reconstructing houses: early village social organization in prince
TRANSCRIPT

Reconstructing Houses: Early Village Social Organization
in Prince Rupert Harbour, British Columbia
by
Anna Katherine Berenice Patton
A thesis submitted in conformity with the requirements
for the degree of Doctorate of Philosophy
Anthropology Department
University of Toronto
© Copyright by A. Katherine Patton 2011

ii
Reconstructing Houses: Early Village Social Organization in
Prince Rupert Harbour, British Columbia
A. Katherine Patton
Doctor of Philosophy
Anthropology Department
University of Toronto
2011
Abstract
In this dissertation, I investigate the nature of social relations on the northern Northwest
Coast during the Late Middle Period (500 BC to AD 500) through the rubric of House Societies
as defined by Levi-Strauss (1982). In House Societies, corporate groups hold estates and wealth
that are transmitted from one generation to the next. Houses were, and still are, the fundamental
organizing principle in Tsimshian society. In the 19th century, Houses were central to systems
of property ownership and social ranking. The antiquity of this institution however, is not clear.
In this study, I ask whether Houses existed in the past in the Prince Rupert area and if so, what
implications they might have had on social and economic relations. To investigate this question,
I excavated two house depressions at GbTo-77, a small village site in Prince Rupert Harbour
and considered whether evidence existed for long-term investment in place, the transmission of
dwellings across multiple generations, and for owned estates or resource locations.
The results suggested that one house depression (house D) showed some evidence for
house reconstruction and maintenance, but over a relatively short period of time, particularly in
comparison to other locations across the Northwest Coast. A second house depression,

iii
however, may have been used intermittently, or for an even shorter period of time than house D;
no evidence was found for continuity between occupations or long-term investment in
architecture. Faunal remains from both house depressions were very small and could not be
reliably used to infer differences in owned resource locations. As such, the results of this study
indicate that the house depressions at GbTo-77 likely do not represent Houses. These results are
significant because archaeologists have often assumed that the house depressions forming
organized, rowed villages, such as GbTo-77, are the remnants of Houses or incipient Houses.
I explored also how architectural, stratigraphic and faunal evidence at GbTo-77
compared with these data at four other village sites in Prince Rupert Harbour. Few other house
depressions were excavated sufficiently in order to adequately compare architecture remains
between villages. The comparison of faunal remains between village sites in Prince Rupert
Harbour, however, showed that there may have been important differences between villages in
terms of economic systems, particularly in terms of salmon abundance, when compared with
other fish taxa. The most significant differences in abundance were observed within column,
bulk and auger samples (equal volume samples), indicating the importance of using small mesh
screens (<2.8 mm) in faunal analyses. These data suggest that villages may have exerted control
over important resource locations. The extent to which this control, or ownership, might reflect
differences between houses, rather than villages, is not entirely clear for the Late Middle Period
villages. I also observed significant differences in terms of shellfish composition at each village
site. Variability in local resources may relate primarily to the precise location of these villages
within the harbour, but may also have implications for our understanding of pre-contact land
tenure practices in Prince Rupert Harbour.

iv
Acknowledgments
I am indebted to many people and organizations whose assistance was vital to the successful
completion of this work. First and foremost, I am grateful to my supervisor, Dr. Gary
Coupland, for his guidance, support and encouragement through each stage of this project. I am
also grateful for his patience and his understanding of my need to balance graduate school with
family life. I am enormously appreciative of the time and efforts of my other core committee
members. Dr. Max Friesen and Dr. Ted Banning provided sound insights into drafts of my
dissertation which have improved it immensely. I would also like to thank Dr. Heather Miller
for asking keen and insightful questions on this work at my defense. I am very thankful to my
external appraiser, Dr. Madonna Moss who provided extensive and thoughtful critiques of this
work. I know that this is a much better work on account of her appraisal.
The field and lab component of this work were assisted by an able and intelligent crew
that included Steven Denis of Lax‟kwalaams First Nation and Barbara Petzelt, Economic
Development Officer, Metlakatla First Nation, students from the University of Toronto (in
particular, David Bilton, Mark Peck, Mike White, Laura Burke, Mike O‟Roark, Danielle
Desmarais and Marina LaSalle) and students from Northwest Community College (NWCC). I
am particularly grateful to David Archer, NWCC, for helping to coordinate student volunteers
from NWCC, and for overseeing the house A excavation; I benefitted greatly from his extensive
knowledge of Prince Rupert archaeology. Dr. Kathlyn helped me with the analysis of faunal
remains, in particular the fish remains; her skills were enormously helpful to my analysis. Dr.
Trevor Orchard also allowed me to use his fish and shellfish collection in my analysis and Dr.
Mark Peck (Royal Ontario Museum) granted me access to the ROM‟s avian collection to assist
with my analysis. Jennifer Melanson and Jonathan Sharp created a beautiful map of house D.

v
I benefitted from a rich graduate student life at the University of Toronto, but am
particularly grateful to Joan Banahan, Terry Clarke and Trevor Orchard and for their support
and assistance in the field and in the lab. Joan, Terry and Trevor were always up for stimulating
discussions about Northwest Coast archaeology; these have helped me to form the ideas that I
present in this dissertation.
A very special thanks to family and friends who encouraged me to see this project to
completion. I am particularly indebted to the Mothers of Cabbagetown for helping with child
care and providing good companionship. I am eternally grateful for my loving and supportive
husband, David Simms, for his persistent confidence in my abilities, and for never asked me
when I would be done. I owe a particular and very special thanks to three children, Barbara,
Maeve and Fiona. I know that it has sometimes been difficult to have a mother who “always
has to work.” But, we had fun in the field in beautiful British Columbia; I hope you may
remember some of that time in Dodge Cove looking at the mountains and collecting shells along
the beaches.
I would like to thank the communities of Lax Kw‟alaams and Metlakatla for granting me
permission to pursue this project. Funding for the field component of the project was graciously
provided by the Wenner-Gren Foundation for Anthropological Research and the Social Sciences
and Humanities Research Council (through Dr, Coupland); the University of Toronto, the
Government of Ontario and the Andre Bekerman Memorial Graduate Scholarship also provided
important funding during the course of my studies.

vi
This dissertation is dedicated to my daughters, Barbara, Maeve, and Fiona Simms,
and in memory of my mother, Barbara Patton.

vii
Table of Contents
Chapter 1. Introduction ........................................................................................................... 1
Social Inequality in Ancient Prince Rupert Harbour .............................................................. 3
The Tsimshian .......................................................................................................................... 6
Research Objectives: when is a house just a house? ................................................................ 8
Organization of Dissertation ................................................................................................... 11
Implications for Results .......................................................................................................... 12
Chapter 2. Theoretical Perspectives ..................................................................................... 14
Pronounced Social Inequality on the Northwest Coast. .............................................................. 16
Houses and Households. .......................................................................................................... 19
Ideas about the House on the Northwest Coast...................................................................... 24
Use of the House Concept in this Study. ................................................................................. 27
The Architecture of Houses. ................................................................................................... 28
The Economies of Houses ....................................................................................................... 31
Archaeological Correlates of Houses ...................................................................................... 34
Conclusions. ............................................................................................................................. 35
Chapter 3: The Environment. ................................................................................................ 36
The Structure of the North Coast Environment .................................................................... 38
Physiography and Topography .............................................................................................. 40
Hydrology .............................................................................................................................. 42
Climate .................................................................................................................................. 47
Vegetation .............................................................................................................................. 48
Plant Resource Locations ...................................................................................................... 49
Fauna .................................................................................................................................. 50
Fish ..................................................................................................................................... 54
Pacific Salmon...................................................................................................................... 62
Harvesting Salmon ............................................................................................................... 67
Invertebrates ....................................................................................................................... 70
Birds .................................................................................................................................... 78
Mammals .............................................................................................................................. 85
Summary .............................................................................................................................. 91
Chapter 4. Recent Tsimshian History. .................................................................................. 93
Territory .................................................................................................................................. 95
Social Organization ................................................................................................................. 98
Phratries and Clans ................................................................................................................ 98
The Village or Ts!ap ............................................................................................................... 99
Wa’lp and Wilnaat’aal .......................................................................................................... 103
Class, Rank and Gender ....................................................................................................... 108
The Tsimshian Economy ....................................................................................................... 110
The Seasonal Round ............................................................................................................. 110
Shellfishing .......................................................................................................................... 113
Hunter-Gatherers, Mangers or Cultivators? ........................................................................ 114
Summary ............................................................................................................................... 115

viii
Chapter 5: The Ancient History of the Prince Rupert Area: previous archaeological
research and oral records. ................................................................................................... 118
The Harbour ......................................................................................................................... 120
North Coast Prehistory Project (NCPP) .............................................................................. 122
Prince Rupert Harbour Radiocarbon Dating Project .......................................................... 123
McNichol Creek Site Excavations and the North Coast Housing Project(NCHP) ................ 123
Dundas Islands Archaeological Project ............................................................................... 124
Kitselas Canyon and the Lower Skeena .............................................................................. 125
Assembling the Past; archaeology, culture history and the adawx ..................................... 127
Culture History of Prince Rupert Harbour and Adjacent Areas ............................................ 128
Period III ........................................................................................................................... 130
Period II ............................................................................................................................ 132
Period I .............................................................................................................................. 134
The Adawx ............................................................................................................................ 137
Summary ............................................................................................................................... 140
Part 2: Results and Interpretation
Chapter 6. The Study Sites. ................................................................................................. 141
GbTo-77 ................................................................................................................................ 142
Chronology ............................................................................................................................ 151
GbTo-46 ................................................................................................................................ 153
Chronology ............................................................................................................................ 156
GbTo-31 ................................................................................................................................ 157
Chronology ............................................................................................................................ 162
GbTo-28 ................................................................................................................................ 163
Chronology ............................................................................................................................ 165
GcTo-6 .................................................................................................................................. 166
Chronology ............................................................................................................................ 170
Summary .............................................................................................................................. 171
Chapter 7: The Houses.......................................................................................................... 175
Northwest Coast Architecture ............................................................................................. 178
Tsimshian Houses ................................................................................................................ 184
Problems Associated with the Interpretation of Architectural Data ...................................... 189
The Houses at GbTo-77 ........................................................................................................ 192
House A: Stratigraphy and Architectural Features ............................................................... 195
House D ............................................................................................................................... 204
Stratigraphy ....................................................................................................................... 205
Architectural Features ....................................................................................................... 206
Hearths ............................................................................................................................... 212
Floors .................................................................................................................................. 215
Understanding the History of house D ................................................................................. 221
Chapter 8: The Faunal Data ................................................................................................ 225
GbTo-77; the vertebrate faunal assemblage ........................................................................ 228
Screening and Sampling Methods ........................................................................................ 228
Vertebrate Quantification Practices ...................................................................................... 230

ix
Fish ..................................................................................................................................... 232
Mammals and Birds ............................................................................................................. 238
GbTo-77; The Shellfish ........................................................................................................ 243
Sampling and Screening Protocols for Shellfish ................................................................... 245
Fragmentation ...................................................................................................................... 251
Implications for Seasonality, Mobility and Labour Organization at GbTo-77 ....................... 255
The Inter-Village Analysis; GbTo-77 in comparisons with other harbour village sites ..... 266
Diversity .............................................................................................................................. 273
Equal Volume Samples .......................................................................................................... 277
The Shellfish ....................................................................................................................... 284
Fragmentation ..................................................................................................................... 289
Summary .............................................................................................................................. 291
Chapter 9. Synthesis, Discussion and Conclusion ................................................................ 292
Interpretation of the inter-house depression results ............................................................ 294
Architecture ......................................................................................................................... 294
Fauna .................................................................................................................................. 300
Inter-house comparisons at other sites ................................................................................. 303
Interpretation of inter-site comparisons .................................................................................. 304
Land tenure, labour and the Late Middle Period .................................................................. 315
When houses are indeed Houses .......................................................................................... 318
Conclusions ............................................................................................................................ 321
References Cited .................................................................................................................... 324
Appendices ............................................................................................................................ 358
Appendix A. Auger samples .................................................................................................... 358
Appendix B. Faunal Data ....................................................................................................... 362
Appendix C. The Artifacts ..................................................................................................... 369
Appendix D. The Shellfish ...................................................................................................... 381
x
List of Figures
Figure 1-1. Map of the Northwest Coast of North America showing locations of Prince Rupert
harbour, the Nass River and Skeen River ............................................................................... 2
Figure 3-1. Map of Prince Rupert Harbour showing landmarks cited in the text......................... 38
Figure 3-2. Map of northern British Columbia and southern Alaska showing the locations of
physiographic landforms and major rivers mentioned in the text ........................................... 41
Figure 3-3. Map of the Skeena River watershed ........................................................................ 43
Figure 3-4. Beach front at GbTo-77, high tide, summer 2003 .................................................... 45
Figure 3-5. Beach front at GbTo-77, low tide, summer 2004 ..................................................... 46
Figure 3-6. North coast salmon migration routes in 2004 ........................................................... 65
Figure 3-7. Map of Prince Rupert Habour showing the location of salmon streams.................... 66
Figure 3-8. Maximum salmon escapements (1934-2008) for streams within Prince Rupert
Harbour in comparison to two Skeena River tributaries ........................................................ 67
Figure 3-9. Average salmon escapements (1934-2008) for streams within Prince Rupert Harbour
in comparison to two Skeena River tributaries ..................................................................... 67
Figure 3-10. Small acorn barnacles, bay mussels and whelks at Dodge Cove, Digby Island ....... 75
Figure 4-1. Map of Traditional Tsimshian territory, showing the four closely related groups that
compose them ..................................................................................................................... 119
Figure 5-1. Map of the Northern Northwest Coast of British Columbia .................................. 119
Figure 5-2. The Prince Rupert Harbour area showing the location of sites discussed
in the text ................................................................................................................................ 121
Figure 5-3. The Skeena River region showing the location of the Paul Mason site and
Psacelay .................................................................................................................................. 126
Figure 6-1. Prince Rupert Harbour showing the location of GbTo-77, GbTo-28, GbTo-46,
GbTo-31 and GcTo-6 as well as key geographical locations mentioned in the text .............. 142
Figure 6-2. Map showing the location of GbTo-77 in relation to the other registered
archaeological sites in the bay ............................................................................................. 143
Figure 6-3. Map of GbTo-77 showing the location of house depressions, auger samples and the
back midden unit ................................................................................................................ 146
Figure 6-4. North and west wall profile of Unit 1, the back midden at GbTo-77 ..................... 149
Figure 6-5. Map of GbTo-46, the Tremayne Bay site............................................................... 154
Figure 6-6. The Dodge Cove area, showing the location of GbTo-31, Dodge Cove, Elizabeth
Point and Dodge Island ....................................................................................................... 159
Figure 6-7. Map of GbTo-31 showing the locations of NCPP excavations, Coupland‟s
excavations in 2000 and 2003 ............................................................................................. 159
Figure 6-8. Site map of GbTo-28 ............................................................................................. 165
Figure 6-9. Site map of GcTo-6 ............................................................................................... 167
Figure 6-10. Probability distributions (95% confidence interval) of calibrated radiocarbon dates
from charcoal samples for all village sites ........................................................................... 173
Figure 7-1. Coast Salish house showing the sewing and tying wall construction
technique................................................................................................................................. 179
Figure 7-2. Photograph of Tsimshian house front ................................................................... 179
Figure 7-3. Diagram of shed roof house roofing and wall structure ......................................... 183
Figure 7-4. Diagram of Tsimshian house back showing mortised planking ............................ 184
Figure 7-5. Tsimshian Type 1 house showing roofing structure independent from walls ......... 187
Figure 7-6. Photograph of GbTo-77, House D excavations, showing extent of forest cover. .... 191
Figure 7-7. Map of GbTo-77 showing units excavated ............................................................ 193

xi
Figure 7-8. Profile of east wall of house A. ............................................................................. 196
Figure 7-9. Profile of the west wall of house A ........................................................................ 198
Figure 7-10. Profile of the north wall house A ......................................................................... 199
Figure 7-11. Plan view of house A, showing extent of lot 4 ..................................................... 203
Figure 7-12. Plan view of house A showing extent of lot 6 ...................................................... 204
Figure 7-13. Floor plan of house D, showing the location of post features, hearths and the
approximate location of the house wall ............................................................................... 207
Figure 7-14. Medium-sized posts associated with cluster 1, house D. ...................................... 209
Figure 7-15. Cluster 2 wall posts ............................................................................................. 209
Figure 7-16. Floor plan of the Shingle Point house, Gulf of Georgia ....................................... 211
Figure 7-17. North-south cross-section of house D. ................................................................. 213
Figure 7-18. Profile of the back of house D. ............................................................................ 217
Figure 7-19. Profile of house D in cross-section. ..................................................................... 219
Figure 7-20. House D bench midden. ...................................................................................... 222
Figure 8-1. Graph showing densities of major fish taxa in relation to < 1.4 mm fine fraction
identified in equal volume samples arranged by site context ............................................... 238
Figure 8-2. Average density of materials identified within equal volume samples ................... 247
Figure 8-3. Average density of five most frequently occurring shellfish taxa identified within
equal volume samples at GbTo-77, arranged by site context ............................................... 253
Figure 8-4. Fragmentation Ratios for each equal volume sample analyzed from
GbTo-77, arranged by site context ....................................................................................... 254
Figure 8-5. Graph illustrating the relative frequency of sea mammal to land mammal remains for
all site components ............................................................................................................. 273
Figure 8-6. Bar gar showing the average density of materials within column,
bulk, and auger (GbTo-77 only) samples taken from GbTo-77, GbTo-28, GbTo-31
and GcTo-6 ............................................................................................................................. 285
Figure 8-7. Scatterplot showing sites in relation to PCA component 1 and component 2.......... 288
Figure 8-8. Graph of fragmentation ratios from four village sites............................................. 290
Figure 8-9. Clam fragmentation ratios from four village sites referenced within this study.. .... 291

xii
List of Tables
Table 3-1. Summary of major climatic information for the coastal area and the interior ............ 48
Table 3-2. List of fish taxa common to the Prince Rupert Harbour and the Skeena River ........... 55
Table 3-3. List of common shellfish taxa for the northern Northwest Coast ............................... 72
Table 3-4. List of bird species common to traditional Tsimshian territory ................................. 79
Table 3-5. List of common mammal species inhabiting traditional Tsimshian territory .............. 86
Table 4-1. Location of Coast and Southern Tsimshian tribes‟ summer and winter villages as
documented in late 19th century ethnographic sources and oral records ............................... 102
Table 6-1. Radiocarbon dates and calibrated age ranges from charcoal samples for GbTo-77 .. 151
Table 6-2. Radiocarbon dates for shell-based samples for GbTo-77 ......................................... 151
Table 6-3. Radiocarbon dates and calibrated age ranges from charcoal samples for GbTo-46 .. 157
Table 6-4. Radiocarbon dates for shell-based samples for GbTo-46 ......................................... 157
Table 6-5. Radiocarbon dates and calibrated age ranges from charcoal samples for GbTo-31 .. 163
Table 6-6. Radiocarbon dates and calibrated age ranges from charcoal samples for GbTo-28 .. 166
Table 6-7. Radiocarbon dates for shell-based samples for GbTo-28 ......................................... 166
Table 6-8. Radiocarbon dates and calibrated age ranges from charcoal samples for GcTo-6 .... 170
Table 6-9. Radiocarbon dates for shell-based samples for GcTo-6 ........................................... 171
Table 8-1. NISP and relative proportions of fish taxa identified in excavated faunal samples at
GbTo-77 ............................................................................................................................. 233
Table 8-2. NISP and relative proportions of smelt positively identified to species ................... 235
Table 8-3. NISP (N), relative frequency and density (D) of major fish taxa identified in equal
volume samples .................................................................................................................. 236
Table 8-4. Density of major fish taxa collected from all screens in equal volume samples
calculated in relation to fine fraction (<1.4 mm). ............................................................... 237
Table 8-5. NISP and relative frequencies of mammal elements identified in the GbTo-77
excavated sample, organized by site location ...................................................................... 241
Table 8-6. showing NISP and relative frequencies of avian fauna identified in the GbTo-77
excavated sample by site context ........................................................................................ 244
Table 8-7. Total mass and average density (D; grams per litre) of material in equal volume
samples by site context. ..................................................................................................... 246
Table 8-8. List of shellfish taxa identified within equal volume samples ........................................... 248
Table 8-9. Relative proportions of clam that could be identified to species .............................. 249
Table 8-10. Mass of total barnacle remains and thatched barnacle remains from GbTo-77 back
midden equal volume samples. ........................................................................................... 250
Table 8-11. Total mass and average density (D) per litre of each shellfish taxa identified within
equal volume samples by site context. . .................................................................................. 252
Table 8-12. NISP and relative frequencies of fauna by class for all sites. ................................. 268
Table 8-13. List of major species of fish identified at the five study sites in excavated and equal
volume samples....................................................................................................................... 269
Table 8-14. List of mammalian taxa identified within excavated samples ............................... 270
Table 8-15. List of avian taxa identified within excavated samples. ......................................... 272
Table 8-16. Simpson‟s Diversity Index Reciprocal for all sites ................................................ 275
Table 8-17. Richness for all sites ............................................................................................ 276
Table 8-18. NISP and relative proportions of major fish taxa from column and auger samples
within and around house depressions .................................................................................. 279
Table 8-19. NISP and relative proportions of major fish taxa from column and auger samples
from back midden contexts ................................................................................................. 279

xiii
Table 8-20. NISP and density of major fish taxa identified within equal volume samples. ....... 281
Table 8-21. NISP and density of major fish taxa identified within equal volume samples
associated with house depressions....................................................................................... 281
Table 8-22. Chi-square value produced from the Kruskal-Wallis one-way ANOVA. ............... 283
Table 8-23. Results of the multiple comparison Z-value test. ................................................... 284
Table 8-24. Mass and average density of major shellfish taxa in equal volume samples. .......... 287

1
Chapter 1. Introduction
Prince Rupert Harbour, British Columbia, has been an area of keen archaeological interest for
over a century. As such, it is one of the most intensively investigated regions on the northern
Northwest Coast of North America. Over the past hundred years, archaeologists have
conducted expansive excavations centred on the large, deep, complex shell midden sites that
line the harbour‟s shorelines. Curiosity about the pre-contact history of the area had been
ignited by the wealth of ethnographic material collected during the 19th and early 20
th centuries
on the Tsimshian, whose homeland includes coastal and interior regions from south of the
Skeena River north to the Nass River (Figure 1-1). The Tsimshian, along with most other
Northwest Coast groups, were thought to exhibit traits such as pronounced and inherited social
inequality, large complex households, semi-sedentism and storage that had traditionally been
associated with agriculturalists (Arnold 1996; Burch and Ellana 1994; Price and Brown 1985).
As a result, many researchers classify Northwest Coast groups as complex hunter-gatherers,
thereby distinguishing them from some more conventional ideas about the foraging way of life.
Understanding how social complexity developed among hunter-gatherer-fishers became the
focus of many archaeological research projects in Prince Rupert, as well as in other areas of the
Northwest Coast (e.g., Ames 2005a; Coupland et al.2000, 2003, 2006; MacDonald and Inglis
1981).
The ideas that define social complexity have come under some scrutiny in recent years.
The “origins” of many of the traits that define complex hunter-gatherers, such as semi-

2
Figure 1-1. Map of the Northwest Coast of
North America (after Coupland et al. 2010).
Prince Rupert Harbour
Skeena River
Nass River
Pacific Ocean
N
0 100 200 300 Kilometres

3
sedentism and storage, may be considerably older on the Northwest Coast than we have
imagined and in some locations may have occurred long before pronounced social inequality
(Cannon and Yang 2006; Daly 2005:30). Some have also questioned whether Northwest Coast
groups are best described as hunter-gatherers, given the evidence for small-scale cultivation and
gardening elicited from re-readings of ethnographic sources and the study of traditional
knowledge (Deur and Turner 2005a; McDonald 2005; Williams and Hunn 1982). Nonetheless,
the long-term interest in the question of how pronounced social inequality developed here and
elsewhere on the Northwest Coast is still unresolved among archaeologists. In particular, there
is no consensus regarding when, why and how social change took place (Ames 1991; Ames and
Maschner 1999; Archer 2001; Coupland 1988a; Hayden 1992; Matson and Coupland 1995;
Moss and Erlandson 1995).
With this work, I will contribute to the debate on the nature of ancient social and
economic organization in the Prince Rupert area through the rubric of House Societies (Ames
2006; Gillespie 2000a, 2000b; Lévi-Strauss 1982; Marshall 2006). Houses were, and still are,
the fundamental organizing principle in Tsimshian society (Roth 2008). In the 19th
century,
Houses were central to systems of property ownership and social ranking. The antiquity of this
institution, however, is not clear. In this study, I address the question of whether Houses existed
in the past in the Prince Rupert area and, if so, what implications they might have had for social
and economic relations.
Social Inequality in Ancient Prince Rupert Harbour
Archaeologists have been unable to solve many of the fundamental questions related to social
change in the Prince Rupert area or elsewhere on the Northwest Coast because researchers do
not agree on which data sets best represent evidence for pronounced social inequality.

4
Moreover, we have not yet resolved what particular bodies of data reveal about social relations.
For example, Archer (1992, 2001) hypothesizes that the small, uniformly sized house features at
some village sites, such as GbTo-77 (the focus of this dissertation) reflect egalitarian social
organization. Following Archer‟s (2001; see also Coupland 1988a) model, sites such as the Paul
Mason site on the Skeena River or GbTo-77 reflect egalitarian social organization because the
house depressions that compose the sites are relatively similar in size. Ames (2005a:299-300),
however, suggests that villages consisting of multiple rows of house depressions represent non-
egalitarian social relations. For Ames, then, the settlement pattern at GbTo-77 (consisting of a
single row of houses) reflects egalitarian social relations, but the Paul Mason site (a two-row
village) does not.
Ames and Archer‟s arguments are well reasoned and draw upon additional lines of
evidence, such as mortuary practices and oral records, to support their claims; in the end,
however, they are contradictory. The ambiguity surrounding the relationship between
settlement and social relations is in many ways not surprising. Inequality is not to be found in a
predictable, comprehensive trait list, but rather can be expressed within multiple social contexts.
Thus, archaeologists need to study a full range of potential interactions in order to gauge social
organization and the historical development of pronounced and hereditary inequality (Pauketat
2007; Pauketat and Alt 2005; Sassaman 2004). Material goods, for example, including
subsistence resources, may foster socially inequitable relations within what otherwise appear to
be non-stratified societies (Cobb 1993; Feinman and Neitzel 1984; Grier 2001; Johnson and
Earle 2000; Paynter 1989). In order to explore the nature of social organization in
archaeological contexts, we need to consider the relations between people with respect to food,
living arrangements, burial, architecture and other objects. GbTo-77, a small village site located

5
in Prince Rupert Harbour, provides a unique opportunity to investigate social relations at what
are presumed to be egalitarian sites through faunal and architectural remains.
Some of the earliest musings on the development of social inequality on the Northwest
Coast emphasized ecological factors such as the structure of important resources, in particular
salmon (Drucker and Heizer 1967; Fladmark 1975; Matson 1992; Schalk 1977; Suttles 1987a,
1987b). Recent thinking, however, has emphasized conflict over the location of these resources
and the ambitions of individuals in managerial roles (Ames 1996; Ames and Maschner 1999;
Coupland 1988b, 1996; Hayden 1996). At the core of all these arguments, however, is salmon.
Over the last two decades, archaeologists have become aware of the enormous diversity that
exists among regions with respect to salmon procurement (Monks 1987; Orchard and Clark
2005), but recent research has shown that salmon appears to have been more important in Prince
Rupert Harbour than anywhere else on the coast (Coupland et al. 2010). As early as 3000 BP,
sedentary groups on the Skeena River practiced resource intensification, surplus production and
large-scale salmon storage at the Paul Mason site (Coupland 1985, 1988b, 1996; Matson and
Coupland 1995:183-186). Coupland and Matson contended that this evidence demonstrates that
intensive salmon harvesting was well within the capabilities of small egalitarian households. As
discussed above, the house depressions at this site seem to represent small, uniformly sized
dwellings and these have been interpreted by some to represent egalitarian households. This
evidence, in conjunction with a paucity of prestige goods, suggested to Coupland (1985, 1988a,
1996) that corporate groups, rather than hereditary elites, controlled surplus production.
Extrapolating from this site to the Prince Rupert area, however, is problematic for two
reasons. First, as mentioned, there exists some disagreement regarding the nature of social
relations represented by the organization of houses at the Paul Mason site (Ames 2005a:299-
300; Ames and Maschner 1999:258; Coupland 1988a; Moss 2004: 187-188). Because of poor

6
faunal preservation at this site, the evidence for large-scale salmon processing and storage is
inferred from an increase in the proportion of slate knives and the presence of plank house
remains (Coupland 1988a, 1996; Matson and Coupland 1995:187). Plank houses had profound
consequences for the social and economic organization of households on the Northwest Coast,
because their construction reflects long-term, multi-generational investment in particular
locations within the landscape (Ames 1991, 1996, 2006; Marshall 2000, 2006). There exists,
however, considerable variability in the number of generations represented in the remains of
plank houses. Some house depressions seem to represent many hundreds of years of continuous
occupation, while others appear to have been inhabited for a few decades (Ames 1996, 2006).
Second, while salmon production for storage may be well within the capabilities of people
living year-round along a very productive salmon river, it does not necessarily follow that
groups living most of the year on the coast were organized in the same way.
The Tsimshian
Intensive salmon harvesting and storage were well within the capacity of people living at the
larger stratified villages of the contact and post-contact periods. Nineteenth and twentieth-
century Tsimshians travelled between the harbour and the Nass and Skeena Rivers on a seasonal
basis (Boas 1916:399; Garfield 1966:13-14; Miller 1997:21-2). Although Tsimshians were
most sedentary during the winter, when most groups lived within the harbour in large villages,
the Skeena River was perhaps the most important component of their seasonal round. In fact,
the word Tsimshian is derived from ts’m, meaning “inside of a thing” and Ksyaan meaning the
“Skeena River”; the most literal translation of the name Tsimshian is “inside of the Skeena
River” (Boas 1916:43; Roth 2008:21). During the 19th and 20
th centuries, Tsimshian tribes, or
local groups, were organized into winter villages in and around Metlakatla Pass, but each tribe

7
also owned carefully defined territories on the Skeena watershed (Allaire 1993; Coupland et al.
2001; Garfield 1966; Miller 1997:15). The tribe, or village, was an important affiliation for
Tsimshians, but one‟s essential identity was with the House (Garfield 1966:22-23; Miller
1997:45; Roth 2008:162). The House, or wa’lp (wüwalp pl.), as it is called in Sm’álgyax (the
Tsimshian language), is synonymous with the functioning feast group, but it is also the physical
dwelling, the people living within it, the summer and winter resource territories owned by this
group, its crests, songs, dances and wealth (Garfield 1966:22-23; Halpin and Seguin 1990;
Miller 1997:45-55; Neylan 2002:169; Seguin 1993:111-115). For the Tsimshian, the wa’lp is a
container that holds inherited names and titles, rights to property and wealth, as well as its
existing members. The names that are contained within each House connect its members to
very particular locations on the ground:
Names link members of a Tsimshian lineage to the past and to the territory on
which that past unfolded. A Tsimshian name holder shares his or her name with a
succession of matrilineally related predecessors stretching back to the ancient
historical events that describe the origins of the name, of the [H]ouse lineage, and
of the lineage‟s rights to territories and resources (Roth 2008:30).
In this way, names are deeds or sovereign titles to owned resource territories that are codified in
crest poles and painted house fronts (Cove 1987; Roth 2008).
The histories of Houses are recorded in the adawx, Tsimshian oral narratives; they tell of
the exotic origins of some Houses and their integration with pre-existing Tsimshian peoples
through marriage and warfare (Allaire 1993:89; Dunn 1993:100-102; Marsden 2000). Winter
villages were composed of these Houses, but Houses could move between villages over the
course of time; through these migrations House estates remained intact, because the wa’lp
formed the fundamental territory-owning unit (Allaire 1993:89; Cove 1987). While they might
draw support from related Houses, or groups of related houses (the wilnaat’aał,) “…when
necessary they stand in the feast hall alone and sovereign against the world” (Roth 2008:204).

8
But what is the antiquity of this kind of economic, social and political organization?
How can we tell if the wa’lp existed in the past and if they were indeed “sovereign”? What
constitutes evidence for ownership, or territorial strategies, in archaeological contexts? Do
plank houses always reflect sedentism and property ownership, as Ames and Maschner
(1999:250) suggest? Working within the rubric of Lévi-Strauss‟ House Societies, Ames (2006)
and Marshall (2000; 2006) have explored the concept of the House in archaeological contexts on
the Northwest Coast through settlement and mortuary data. This research has been successful in
demonstrating how groups became tied to specific locations on the landscape and perhaps the
transmission of these places from one generation to the next. What is missing from these works,
however, is a discussion based on archaeological evidence that supports the idea that important
resource locations were owned beyond the immediate vicinity of an inhabited winter village.
With respect to Prince Rupert Harbour, how do we know that house depressions at coastal sites
represent Houses with territories in the interior? While some have inferred that important
resource locations were owned and that conflict over these territories formed the basis of
emerging multi-family households and social inequality here (e.g., Coupland 1996:122), no
study has explicitly demonstrated how ownership of these locations might have operated.
Research Objectives: when is a house just a house?
Central to this research is the question of whether the house depressions we excavate represent
Houses. In other words, what is the antiquity of the Tsimshian wa’lp? Ames (2006) suggests
that surface house depressions in shell midden sites dating as early as 3000 BP are the remains
of domestic dwellings, but also of Houses. Marshall (2006) argues that evidence for substantial
rectangular structures by approximately 5500 BP may reflect the development of incipient
Houses, but true Houses in the Lévi-Straussian sense only developed within the last 2000 years.

9
Ames (2006) and Marshall (2006) see a link between archaeological house depressions and
sedentism. Because their arguments are framed within Lévi-Strauss‟s concept of the House,
they imply that there is an association between house depressions and property.
The relationship between houses constructed in the past and the surface depressions that
are visible today, however, may be more complicated than we assume. We cannot be sure that
all depressions represent domestic structures, let alone Houses. A variety of taphonomic factors
may create or obscure surface depressions. Mackie and Williamson (2003), for example,
showed recently that surface depressions at 19th-century villages on southwest Vancouver Island
did not always correspond to the remnants of dwellings. Some surface depressions contained
architectural features associated with more than one structure, while other houses produced no
visible surface depressions. Mackie and Wiliamson‟s work serves as a reminder that what we
see on the surface of many shell midden sites may not be directly analogous to the structures
that were built there in the past. Surface house depressions also relate to specific moments in
the life history of archaeological sites; most likely, these represent some of the last events that
occurred at these sites. Many surface house depressions are sitting on top of older deposits that
may be associated with earlier domestic structures obscured by later building activity.
If we are able to confidently identify depressions representing the remnants of domestic
dwellings, how do we know whether they are also the remnants of Houses? Control of property
is the most consistent principle that distinguishes Houses from simple domestic dwellings.
Lévi-Straussian Houses are “…long-lived property-owning social units…” (Gillespie 2000b:7-
8). In archaeological contexts, therefore, Houses should produce evidence for long-term
continuity in occupation of specific places on the landscape, including the domestic dwelling
itself. For these reasons, I use architectural and stratigraphic data from GbTo-77 to explore
whether house depressions at this site demonstrate evidence for repeated rebuilding and

10
extensive repair over long periods of time. On its own, such evidence, if it exists, does not
necessarily reflect intentional transmission of the physical structure from one generation to the
next. There are practical factors that may account for continued reuse of buildings. Evidence
for ownership of estates is central to the concept of the House and, as such, we need to know if
the inhabitants of the houses represented by these depressions owned important resource
locations beyond the immediate vicinity of villages. In this dissertation, I explore also whether
control of regional as opposed to locally available resources (sensu Ames 2005a:280-282) could
reflect House-based land tenure strategies. If these ownership strategies were based around the
House, what do they reveal about relations between Houses in light of the fact that House
Societies tend to promote hereditary social inequality (Carsten and Hugh-Jones 1995a; Gillespie
2000a)?
In my research, I draw upon original data from my excavations at GbTo-77 and data
from Coupland‟s excavations at four other village sites in Prince Rupert Harbour (Coupland et
al. 2006; 2010). Using the chronology developed by Ames and Maschner (1999), three sites I
use in this study date to the latter half of the Middle Pacific Period (or Middle Period), one from
the transitional period between the Late Middle Period and the Early Late Pacific Period (or
Late Period), and one from the Late Period as defined by Ames and Maschner (1999; see also
Ames 2005a:24-29). In this chronological sequence, the Middle Period dates from
approximately 3500 to 1500 BP and corresponds with MacDonald and Inglis‟s (1981) Period II
for Prince Rupert Harbour. The Late Period dates from 1500 BP to the contact period and is
coterminous with Period I (MacDonald and Inglis 1981).

11
Organization of dissertation
This dissertation consists of nine chapters organized in two parts. Part one provides background
information that is needed in order to understand the significance of this research. Chapter 2
presents the theoretical framework in which I have situated my work. It includes a discussion
on the balance between historical and ecological approaches to the past, as well as my
understanding of what House Societies are and how I apply the concept in my research. As
discussed in chapter 2, the relationship between households and Houses is complicated. The
House is equivalent to the household or house-group in many respects but, following Gillespie
(2000c:33-34), I favour the view that Houses, with owned estates, are likely to foster and be
fostered by non-egalitarian social relations. Throughout this work, I refer to the physical
structure, or dwelling, by these names or the term house. House depressions refer to the
archaeological remnants of these dwellings.
Because resource structure is essential to any discussion of ownership or territoriality,
chapter 3 describes the harbour and its adjacent regions in terms of landscape, hydrology,
vegetation, and fauna. In chapter 4, I review what is known about the Tsimshian from
ethnographic, historic and oral records. The problems and pitfalls associated with using
ethnographic data to interpret the past are well known (Deur and Turner 2005b; Ford 1989;
Losey and Yang 2007; Moss 1993, 2004; Schrire 1984). Ethnographies recount societies that
have responded and adapted to contact with Europeans and may be vastly different from pre-
contact groups. Archaeological work into the late pre-contact period has already shown that
many aspects of Tsimshian society were indeed altered by the fur trade and the introduction of
diseases. In other respects, however, there is evidence for continuity (Martindale 1999; Prince
1998). Archaeology is perhaps best suited to address the nature of pre-contact groups and by
extension the history of these groups. Chapter 5 outlines our current understanding of the pre-

12
contact period in Prince Rupert and along the lower Skeena River through archaeological and
oral historical records.
The second part of this work presents the results of my research. I begin chapter 6 with
a summary of settlement data and radiocarbon dates associated with each of the sites in this
study. I also present the stratigraphy of an excavated back midden unit at GbTo-77. In chapter
7, I provide the stratigraphic and architectural evidence from the excavated house depressions at
GbTo-77. I discuss the evidence for investment in house construction and maintenance, and
whether this constitutes evidence for transmission of physical dwellings from one generation to
the next. I discuss also the architectural evidence from GbTo-77 and what this reveals about the
people who built structures at this site more than 2000 years ago.
Chapter 8 focuses on the results of the faunal analysis from material excavated at GbTo-
77 and four other sites that Coupland excavated in the harbour. In this section, I consider how
faunal remains might reflect evidence for ownership of important resource locations, a central
tenet of House Societies. A synthesis of all data, my interpretations of it and my conclusions
are presented in Chapter 9. Appendix A contains a list of the auger samples that were collected
at GbTo-77. Appendix B includes a list of vertebrate fauna collected and identified from the
GbTo-77 excavations. Appendix C consists of a list of the artifacts found and a brief discussion
of them. Appendix D provides a breakdown of each column, bulk, and auger sample collected
and analyzed from GbTo-77.
Implications for Results
The results of my dissertation contribute to our understanding of the rich and complex
archaeological history of Prince Rupert Harbour in three important ways. First, my results
suggest that the house depressions at GbTo-77 do not seem to reflect House-based organization.

13
The stratigraphic and architectural evidence from excavated house depressions showed no
conclusive evidence for long–term occupation, reconstruction or rebuilding. Furthermore,
sampling problems with faunal remains from both excavated house depressions precluded
meaningful comparisons between houses in terms of economic relations. Second, architectural
data from this site shows that houses may have been constructed differently in the past than they
were during the 19th and 20
th centuries. This evidence is tentative, but provides the groundwork
for a discussion on the relationship between architecture, mobility and social relations. Third,
faunal remains from GbTo-77 and four other village sites in the harbour indicate that the people
inhabiting these villages adopted slightly different economic strategies. Most vertebrate faunal
remains collected during excavation using ¼ inch and 1/8 inch mesh screens revealed few
differences among sites. Differences were observed, however, in terms of shellfish composition
and the abundance of small fish recovered from column, bulk and auger samples. Variability in
local resources may relate primarily to the precise location of these villages within the harbour,
but may also have implications for our understanding of pre-contact land tenure practices in the
harbour.

Chapter 2. Theoretical Perspectives
The overarching theoretical framework for this study is influenced by the writings of
archaeologists working within both historical and ecological paradigms. Cross-cultural
regularities in economy, mobility and social organization may exist among disparate groups, but
the mechanisms behind both change and the reproduction of social norms are largely contextual
(Childe 1951:14). This context is not strictly historical or ecological, but a combination of both.
The environment forms very real constraints to human actions and to the kinds of decisions that
people make (Rowley-Conwy 2001; Trigger 1991). The patchy structure of local resources in
Prince Rupert Harbour, for instance, influenced the kinds of settlement and economic systems
that people living in the area could reasonably adopt (Ames 2005a:280-281). To paraphrase
Ingold (2000:20) the environment is not external to humanity or to history. Human actions
shape local environments, the consequences of which may resonate over the course of time. On
the northern Northwest Coast, the village sites that form the basis of this study are prime
examples of how human activity modifies landscapes. Muskeg, or mire, forms a significant
component of the northern coastal landscape (Turunan and Turunan 2003). Martindale et al.
(2009:1574) have suggested recently that shell middens were constructed to create dry, well
drained locations (see chapter 3). Initial settlement then, created ideal conditions for the return
of people to very specific locations over thousands of years. This makes the environment
“fundamentally historical” (Ingold 2000:20).
High-level ideas about the nature of culture change, such as these, are understood or
interpreted in archaeological contexts through middle-level, or middle-range, theories (Binford

15
1977, 1978; Schiffer 1972, 1976). Middle-level theories seek to illustrate the relationship
between material remains and the behaviours that created them. These “generalizations” may be
broad and cross-cultural (as noted above), specific to societies that share similar modes of
production, or to historically-related cultures (Trigger 1989:21-24). Such generalizations are
necessary because archaeological patterning, in and of itself, does not illuminate culturally-
specific meanings of things. This kind of meaning can only be gleaned using other, non-
archaeological sources of data:
Such information may be provided by historical documents, oral traditions,
ethnology and historical linguistics. Finding ways to use these non-archaeological
data to understand the cultural meaning of historically related archaeological
evidence is to the archaeological study of cultural traditions what the use of
ethnoarchaeological data is for the development of middle-range theory. While
this interdisciplinary approach began to be developed in the 1950s (Murdoch 1959;
McCall 1964; Trigger 1968), it was rejected by processual archaeology because of
its cultural-historical affinities and has only begun to move forward again in recent
years (Jennings 1979; Ki-Zerbo 1981; Tardits 1981). The rigorous development of
the direct historical approach is perhaps the most challenging and potentially
important task confronting archaeologists today (Trigger 1991:561-562).
There is a long tradition of using these kinds of non-archaeological lines of data on the
Northwest Coast (MacDonald 1993; MacDonald and Inglis 1981; Martindale and Marsden
2003; McMillan 2000; Moss 1993, 1996). Ethnographies in particular are frequently used both
to construct hypotheses about the past and to aid in interpreting archaeological data (Cannon
2002; Ford 1989; Mitchell 1981,1983; Moss and Erlandson 1995; Orchard 2007). Scholars
increasingly recognize, however, that ethnographies describe ways of life dramatically altered
by contact with Europeans and the integration of indigenous economies into capitalist economic
systems (e.g., Martindale 1999; Prince 1998). Many archaeologists also overlook precisely how
much variability existed in almost all aspects of ethnographically documented Northwest Coast
societies (Cannon 2002; Martindale 1999; Mitchell 1981; 1983). Mitchell (1981), for example,
demonstrates how Kitkatla seasonal migrations, as recorded in historic documents, differed

16
fundamentally from the generalized patterns that Boas (1916) records, and from which many
archaeologists construct their understanding of contact-period settlement and mobility.
Kitkatlas and other Southern Tsimshian groups did not travel to and from the Skeena River, but
rather held multiple summer resource locations along smaller rivers and streams on the
mainland and coastal islands. These smaller groups could spread themselves over a wide area,
exploiting multiple resources simultaneously. In fact, there is considerable variability among all
Tsimshian groups regarding the nature of mobility and, by extension, sedentism. Some
Tsimshian groups moved as many as 16 times over the course of the annual round; five to six
moves a year was considered typical, but, some groups did not move at all (Ames and Maschner
1999:120-121).
Certainly, these kinds of information cannot be taken as a direct analogy to explain
archaeological patterning in the past. I draw upon ethnographic documentation and Tsimshian
oral narratives, however, to hypothesise about the role of the House in the ancient past in the
Prince Rupert area. I draw also upon Lévi-Strauss‟ (1982) concept of House Societies. Houses
not only occurred historically on the northern Northwest Coast, but they also occur in
conjunction with owned resource territories, a land tenure strategy that is often adopted under
the kinds of ecological conditions present in the Prince Rupert area. Looking at the past through
the lens of House Societies has also proved a meaningful way of exploring changes in social
relations because groups that are organized around Houses tend to foster non-egalitarian social
relations.
Pronounced Social Inequality on the Northwest Coast
Archaeologists more commonly address the development of pronounced social inequality on the
Northwest Coast through the idea of complex hunter-gatherers. The reasons for and

17
mechanisms behind the emergence of social and economic complexity have formed one of the
central archaeological research questions in this region for more than a quarter-century.
Anthropologists have long recognized that indigenous Northwest Coast groups exhibited many
traits that were absent or muted in other hunter-gatherer societies (Boas 1928; Drucker 1965;
Kroeber 1963). For Boas, the complex social organization of Northwest Coast groups was
significant because it directly challenged the prevailing evolutionary paradigm (Deur and Turner
2005b). It was not until the 1980s, however, that archaeologists and anthropologists began to
wrestle with the idea of complex hunter-gatherers as a type of human social organization.
Archaeologists typically define these “complex” groups as relying on a hunting-gathering-
fishing subsistence base, but also exhibiting traits that at the time had been associated
exclusively with agriculturalists, including a high degree of sedentism, resource intensification,
economic specialization, food storage, and, most importantly, pronounced social inequality
(Arnold 1996; Hayden 1990, 1996; Price and Brown 1985).
There has been significant disagreement in the hunter-gatherer literature regarding which
combination of traits is essential to defining complex hunter-gatherers: which are causes of
social complexity and which are outcomes? Price and Brown (1985) contend that complexity is
an attempt to categorize groups of hunter-gatherers on the basis on these interrelated parts but,
for Arnold (1996), complexity is related specifically to the ability of elites to control the labour
of non-kin; this is in effect pronounced, or ascribed, social inequality. What these writers share
is an overriding sense that complex hunter-gatherers are most important to archaeology because
of what they reveal about the evolution of human society, i.e., that the association between
social relations and economy is not a straightforward one. Research within the complex hunter-
gatherer framework has done much to augment our understanding of the variability that exists
within hunting and gathering societies. This variability exists not only within the spectrum of

18
mobility and sedentism (e.g., Binford 1980) but also within social organization (Fitzhugh and
Habu 2002; Price and Brown 1985; Woodburn 1980, 1982).
A common criticism of the complex hunter-gatherer model is that it promotes a view of
the past whereby changes in social and economic organization are inherently progressive. In
these neo-evolutionary approaches, complexity is a threshold; once it is reached groups cannot
shift “back” to “simpler” ways of being (e.g., Hayden 1990, 1996). But some societies are
known to have abandoned agriculture or horticulture in favour of hunting and gathering and
others relied on cultigens from time to time (Ingold 2000; Schrire 1984). Moreover, many key
traits of social complexity are found among very early human societies and among primates,
including some degree of social inequality beyond age and sex, and territoriality (Rowley-
Conwy 2001; Sassaman 2004; Wason 1994:41). The kinds of egalitarian societies from which
archaeologists have tended to draw assumptions about the past are often those who have
responded to contact with, or integration into, outside hierarchical groups (Boehm 1993; Kelly
1995:27-29; Trigger 1989:335-336). Social organization is likely far more variable and
complex than can be understood by the binary categories of egalitarian and non-egalitarian
(Cobb 1993; Paynter 1989).
The relationship between social complexity and a hunting-and-gathering economy is
further complicated by recent indications that many Northwest Coast groups practiced some
form of cultivation. Reinterpretations of Northwest Coast ethnographic and ethnohistorical
material suggests that many groups, including the Tsimshian, relied to some degree on
cultivated plants during the 19th and 20
th centuries (Deur and Turner 2005a). There is also
considerable evidence for the active management of important resources, including berries,
rhizomes, shellfish and even salmon from a number of locations across the coast (Deur and
Turner 2005b; Haggan et al. 2006; McDonald 2005; Williams 2006). As a result, many contend

19
that Northwest Coast groups have more in common with cultivators than hunter-gatherers (Deur
and Turner 2005a; Williams 2006). If this is so, the details of how Northwest Coast groups
made a living may still confound models of socio-cultural evolution, not because they exhibit
some of the traits associated with agriculturalists, but because they suggest that a highly-
structured categorization of human societies is problematic (Ingold 2000; Kelly 1995; Williams
and Hunn 1982).
Houses and Households
Marshall (2006) has recently opted to look at Northwest Coast groups within the rubric of
House Societies precisely because this approach allows us to talk about society and economy
outside of the hunter-gatherer/agriculturalist framework. Lévi-Strauss (1982) developed the
idea that certain groups of people are organized around “Houses” as opposed to kinship in an
attempt to understand societies that trace descent through both the maternal and paternal lines.
In these cognatic systems, individuals may be members of multiple social and kin-based groups
at the same time. This means that there is considerable flexibility in terms of where, and with
whom, people live. Lévi-Strauss defined the House in this context as,
a corporate body holding an estate made up of both material and non-material wealth,
which perpetuates itself through the transmission of its name, its goods and its titles down
a real and imaginary line, considered legitimate as long as this continuity can express itself
in the language of kinship or of affinity and, most often, both (Lévi-Strauss 1982:174).
Post-contact period Northwest Coast groups, feudal Japan and medieval European
societies tended to organize themselves around Houses, a physical structure or dwelling that
contained people, or its members, but more importantly wealth, titles and property. These
material, and often non-material, goods were handed down from one generation to the next
through blood lines or through fictive kin and adoption. Strict rules of kinship were less
important in House Societies than the continuity of the House in name and the perpetuation of

20
its estate. For contact and post-contact-period Tsimshians, the perpetuation of Houses and their
estates was of greatest concern to titled elites. Low status, non-titled House members
(commoners), however, also had an interest in maintaining successful Houses because they
received food and protection in exchange for their labour (Garfield 1966:29; Miller 1997:51).
The emphasis on continuity of House estates is probably the most important aspect of House
Societies:
House property is the focus of common interest for the inhabitants, and this property,
whether material or nonmaterial, provides the motivation for people to insure that the
[H]ouse endures through generations (Sandstrom 2000:56).
In this way, the physical structure of the domestic house is seen as a container for its
members, its goods, its titles and wealth. It ties groups to domestic dwellings and, more
important, to specific locations on the landscape (Carsten and Hugh-Jones 1995b:45-46;
Marshall 2000, 2006; Sandstrom 2000:56).
House Societies can trace their ancestry to specific individuals, mythical or real, who
founded the original House in a specific location. Houses may have changed location, but
members retain the shared memory of that origin (Lévi-Strauss 1982:164-165; Marshall
2006:37). The emphasis on continuity, as well as the ownership and transmission of resources,
lands and wealth from one generation to another resonate through all of these writings on House
Societies (Gillespie 2000a; Sandstom 2000). Although some anthropologists have applied the
concept to groups that do not exhibit many of the hallmarks of hereditary social inequality (e.g.,
Waterson 1995), the territorial strategies built around Houses are likely to foster socially
inequitable relations between the groups that inhabit them. This is because competition between
Houses is what most defines this kind of social organization:
All [H]ouses are not the same. No two [H]ouses will incorporate exactly the same estate;
each will have its own names, heirlooms, ritual privileges, and material property that serve
to differentiate [H]ouses and form a basis for ranking them (Gillsepie 2000b:9).

21
Lévi-Strauss viewed House Societies within an evolutionary paradigm; these social
groups “have not yet overstepped the “old ties of blood”” (Lévi-Strauss 1982:186-187) but rely
on kin terminology to express themselves and maintain the House estate (see also Carsten and
Hugh-Jones 1995b:10; Gillespie 2000a; Lévi-Strauss 1987). This aspect of Lévi-Strauss‟
writings has been dismissed by many scholars in conjunction with other neo-evolutionary ideas
of progressive change (Gillespie 2000c:51; Waterson 1995:65-66). Rather, House Societies
“encompass groups unified around domestic-cultural themes embodied in architecture, descent
and alliance. In these and other contexts, group solidarity may accompany supra-settlement
exchanges of things or people” (Pauketat 2000:19). Although many scholars have adapted the
concept of House Societies to address specific events in regional histories (Gillespie 2000a;
Marshall 2000, 2006; Waterson 1995), there is a recurrent theme concerning the role that
Houses may play in political and economic transformations. This means that looking at the
development of Houses requires consideration of how individuals may attempt to consolidate
power as well as the responses of others to these actions (Coupland et al. 2009; Gillespie
2000c:51-52; Waterson 1995). The House is also concerned, however, with the day-to-day
interactions of its members (Bourdieu 1977; Carsten and High-Jones 1995b:45; Joyce and
Hendon 2000:143). In this way, an examination of the past through House Societies requires a
multi-scalar approach. The social relationships that bind individuals to Houses extend well
beyond the parameters of the built environment or the domestic dwellings.
Another way to consider House membership is within the context of affiliation. House
membership brings access to property, wealth and history, mythic or real. People can have
multiple affiliations, but usually feel most strongly about one or two of these. These are “salient
identities” (Schortman 1989:54). In House Societies, the strongest affiliation, or salient identity,
is to the House. This appears to be the case whether the House is genuinely composed of a

22
lineage or kin-based group, or whether relations are affinal or fictive. As a result, some scholars
look at Houses as communities (Canuto 2002:22; Canuto and Yaeger 2000; Kolb and Snead
1997; Pauketat 2000). This is especially true if one considers that domestic activities may not
inherently be related to specific households, and that many activities might be ascribed to house-
clusters (Pauketat 2000:32).
Theory concerning House Societies shares many common themes with other household
approaches but, for Marshall (2006), the main difference between models that emphasize the
House and the “household” is that, in House Societies, economics follows from place, rather
than being the locus of all social change. I see these components as being more integrated than
does Marshall. It is not simply the transmission of the House structure that is important, it is the
transmission of its properties and wealth that by definition is embedded within economic
systems. There are, however, some legitimate criticisms of household theory that are relevant
here. In particular, household theory rests on the premise that households adapt in very concrete
and observable ways to the world around them. Because the domestic group is understood to be
the foundation of economic organization in non-industrial societies (Sahlins 1972:41-148),
changes to the economy and society are presumed to occur first in households (Coupland 1988b;
Wilk 1997; Wilk and Rathje 1982). Critics contend that viewing the household in this way has
contributed to a “building-block” understanding of culture change (Pauketat 2000). Change
occurs first in the household (represented by the house), then the community (represented by the
site), then at a regional scale (represented by a grouping of sites defined by the study area). We
know, however, that household activity occurs well beyond the confines of the domestic house
and that social relations can exist on multiple scales; there are neighbourhoods that define
community on-the-ground, but also organization and family ties that cut across spatially defined
units of analysis that are based on proximity. These associations might be represented

23
archaeologically by shared raw materials, evidence for trade networks and exchange
relationships. The impetus for change might occur along anyone of these scales (Pauketat 2001;
Sassaman 2004).
Scholars working with the concept of the House, by contrast, tend to encourage an
integrated multi-scalar and multi-component approach (Carsten and Hugh-Jones 1995b:20).
The architecture of the domestic structure itself, the interaction between House members and
between members of different Houses, particularly those that form communities, are all crucial
to understanding social relations in the past (Ames 2006; Carsten and High-Jones 1995a;
Gillespie 2000a; Marshall 2000; 2006). This kind of thinking resonates with recent writing by
Pauketat (2001) and Sassaman (2004), both of whom advocate the use of historical approaches
to understanding social change. Pauketat (2001) emphasizes three points that he contends are
critical to augmenting what we know about the past. First is the documentation of variability
through time and space, even in the simple and mundane elements of culture-making, such as
post moulds. Second, this approach encourages consideration of multiple histories at multiple
scales of analysis. This multi-scale and temporal approach is critical because social inequality,
or complexity, might be apparent at one level, but not at another (Pauketat and Alt 2005;
Sassaman 2004). Third, this approach involves tacking between multiple lines of evidence,
including those often ignored by archaeologists. A post mould, therefore, can reveal aspects of
technology, mobility and seasonality just as faunal remains and settlement patterns can (Cobb
1993; Pauketat and Alt 2005; Paynter 1989). Under the right circumstances one or all of these
data sets may allow us to glimpse elements of past social relations, particularly if patterning in
architecture or faunal remains cannot be entirely explained by local environmental conditions or
the introduction of new technologies. Social relations may also change with circumstances.

24
Elites may choose to display wealth and prestige through burials or dwellings, but not
necessarily both (Wason 1994).
Ideas about the House on the Northwest Coast
Although Lévi-Strauss developed the idea of House Societies in an attempt to understand the
Kwakwaka‟wakw numaym, he proposed also that this model could apply to all Northwest Coast
groups. In fact, Houses, as defined by Lévi-Strauss share many characteristics with the
Tsimshian wa’lp. Wa’lp is a term referring to the physical structure of the House (its dwelling),
its names, titles, inhabitants, owned resource territories, crests, songs, and dances as well as its
economic power and wealth (Garfield 1966:22-23; Miller 1997:45-55; Neylan 2002:169; Seguin
1993:122-113). The Tsimshian adawx (oral narratives) contain stories of the origins of many
Houses outside of the Tsimshian homeland and their migration through, and integration into,
Tsimshian society (Dunn 1993; Marsden 2000). Wüwalp were ranked within villages and their
members included those of various social ranks, including commoners and slaves (see chapter
4).
Anthropologists and archaeologists working in this area have become interested in
understanding the origins and development of House Societies on the Northwest Coast because
so many indigenous groups in the region seem to illustrate Lévi-Strauss‟s concept of the House
so well. In the early 1980s, anthropologists working with Tsimshians understood the
importance of the House as an organizing principle (e.g., Cove 1987; Seguin 1993:111-112) and
it has continued as a major focus of study (e.g., Roth 2008). Although Mitchell (1983)
recognized the similarities between Tsimshian social organization and the medieval European
Houses some 25 years ago, archaeological interest in the idea of the House has only begun
within the past decade. Ames (2006) and Marshall (2000, 2006) were foremost among

25
archaeologists to use the idea of House Societies as a theoretical construct in their work. Their
writings emphasize the importance of place through examination of house depressions and
village layout. At the time of Tsimshian contact with Europeans, Northwest Coast societies
consisted of a core group of ancient Houses. Many more Houses, however, had failed to
perpetuate themselves over the course of the preceding millennia. Ames (1996, 2006) argues
that successful Houses were those that were able to maintain a membership large enough to
generate a surplus of important resources. This surplus could provide for its members through
the winter, account for unanticipated risks in terms of resource procurement, and be converted
into wealth and prestige. Houses perpetuate themselves, therefore, by undertaking strategies
that maintain their estate and continue to bring in new members over multiple generations.
Relying on kin relations and producing children only account for some of the membership;
Northwest Coast Houses could also entice commoners, enslave individuals from other groups,
and bring in new members through adoption (Cove 1987; Roth 2002).
For Ames, House Societies coincide with the emergence of pronounced social inequality
expressed in the linear arrangement of plank houses in villages. These buildings acted as
storage for surplus and wealth, as housing for members (Ames 1996) and as markers of status
and rank to outsiders (Blanton 1994; Coupland 2006). The physical remains of some dwellings
may reveal repeated building and maintenance episodes that span hundreds, if not thousands of
years, while other occupations may have been short-lived, so as to leave virtually no record
(Ames 2006). Ames contends that evidence for long-term and uninterrupted occupation of very
specific locations on the landscape suggests not only that the people inhabiting these dwellings
were propertied, but that social relations within and among them are in some dimension
hierarchical. Houses therefore, and the rights, titles, privileges and wealth they contained, may
have been part of Northwest Coast social organization for some time. Such interpretations may

26
be partially influenced by the role that Houses have played since the contact period on the
Northwest Coast. As discussed above, the wealth and property of Houses is symbolized within
the architecture of the domestic dwelling and inheritance is represented by the transmission of
the physical structure from one generation to the next. Archaeologically however, it is
conceivable that evidence for rebuilding and repair could reflect other, more practical processes.
Existing house depressions, for example, are likely desirable places to build new dwellings.
Shell middens provided cleared and well drained locations to construct new dwellings. Standing
house posts could have been incorporated into new dwellings, so long as they were
mechanically sound. On its own, then, evidence of extensive repair and rebuilding is
insufficient to prove the existence of Houses.
Yet the context in which these particular house depressions are found is pertinent to how
we interpret them. This includes the historic context (i.e., the role of the wa’lp that is
documented for the last few centuries in the Prince Rupert area) and evidence that may
corroborate the existence of Houses in the past. For Marshall (2000, 2006:34), the idea of the
House is especially relevant to the Northwest Coast because it describes a way of life specific to
this part of the world and draws upon indigenous ideas of society as opposed to templates
constructed by outsiders. Marshall merges the tenets of the House with Wilson‟s (1988) idea of
human self-domestication to argue that there is a long history on the Northwest Coast of
emphasis on place. Through settlements and cemeteries, people established ties to specific
places as early as 8000 years ago (Marshall 2006:40-41). Individuals became tied to specific
locations on the landscape because of the way in which they have altered the environment
through building activity. Implicit within this discussion are the ideas of ownership and the
transmission of property from one generation to the next, a concept more fully developed by
Ames (2006) in relation to Middle Period house depressions and cemeteries from across the

27
Northwest Coast. Even if groups are not fully sedentary, they return to specific, owned
structures that they inhabit and that are symbolic of a broader range of territories and wealth.
This is fundamentally different from groups that may congregate in a single location on a
seasonal basis, but where the arrangement of households on the landscape may differ from year
to year, or where the rights to particular structures are not passed from one generation to the
next. The means by which people make a living however, is likely integrated with other aspects
of important places. While there may be significant social and ceremonial reasons for groups to
come together, people are unlikely to become tied to specific places without some reference to
fundamental needs such as subsistence (Ames 2006:19; Sandstrom 2000). Embedded within
subsistence or economic strategies are people‟s ideas about land and resources, as well as who
has the right to use them.
Use of the House Concept in this Study
The idea of the House seems to explain many aspects of pre- and post-contact Northwest Coast
settlement. The emphasis on the reconstruction and rebuilding of dwellings over a long period
of time denotes the importance of that place and perhaps its ownership. This, however, only
demonstrates ownership of the locations where people are living. The Tsimshian wa’lp of the
post-contact period owned several important resource locations throughout the coastal and
interior regions. It is not clear how Ames‟s and Marshall‟s evidence for Houses demonstrates
the ownership of resource locations beyond the domestic structure. Although Marshall
considers the role of neighbours in settlement formation, Ames‟s work does not explicitly
explore how groups of houses, or villages, form economic and social relations. I seek to address
these points through this study, by incorporating the idea of the House in two complementary
ways. First, I examine architectural evidence to explore House continuity and stability at GbTo-

28
77 (Ames 2006; Carsten and Hugh-Jones 1995a; Marshall 2000, 2006). This requires an
exploration of how domestic structures were built, as well as the nature of settlement and
mobility. Second, I explore the way in which Houses perpetuate themselves, and this
necessitates an understanding of how, to paraphrase Sandstrom (2000) and Ames (2006),
Houses “made a living”. We need to know the nature of the economic strategies that underlie
Houses and what they might reveal about land tenure systems in the past.
The Architecture of Houses
Understanding the architecture of domestic dwellings allows us also to explore the degree to
which domestic structures were owned and transmitted from one generation to the next. This is
likely to be reflected in evidence for some degree of sedentism and relatively permanent
dwellings. Sedentary groups spend most of the year living in a single location and return
annually over longer periods of time (such as a generation). This is in contrast to more mobile
groups that come together as a community at times and at other times dissolve. Mobility then
can be expressed along a number of interrelated dimensions, including seasonal movement of
residential base, movement of individuals around and between residences, seasonality and the
permanence of facilities such as houses or fishing weirs. The decision to remain in a location or
move depends on the cost of moving (including the nature of the landscape to cover and the
nature of housing), the distance to the next location, and the extent to which food storage is
practiced (Blair 2004:117; Kelly 1995). It is not surprising, therefore, that there is a strong
connection between mobility and architecture. Groups that are highly mobile tend to build
expedient structures. Initial investment costs are low, and as structures are built and taken apart
relatively frequently, long-term maintenance is much less of a concern. Highly sedentary

29
groups, by contrast, will invest more in the original construction process because such structures
require less maintenance, particularly in the short-term (McGuire and Schiffer 1985).
Semi-sedentary groups spend a season or two in one location year after year, but may be
highly mobile the remainder of the year; in other words they incorporate both aspects of the
foraging/collecting continuum (Binford 1980). Yesner (1987) considers semi-sedentary
settlement to be linked to coastal subsistence, because coastal hunter-gatherers tend to locate
themselves so as to take advantage of many resources and use logistically organized groups to
accomplish this. But most important to this discussion is the idea that sedentary groups are
more likely to own and control specific locations on the landscape; these can be inherited and
rules about ownership are reflected in social organization (Ames 2006; Ames and Maschner
1999:25; Bar-Yosef 2002; Marshall 2006). Sedentism however, is not the only indication of
ownership, nor does it always reflect territorial practices (Rowley-Conwy 2001:44-45).
House Societies are also premised on the notion that decisions of the House group are
ultimately made to maintain the estate beyond the lifespan of any of its inhabitants (Gillespie
2000b:12-13) and this is reflected in evidence for maintenance and rebuilding of the physical
dwelling (Ames 2006; Marshall 2006:42-43). As a result, architecture and other elements of the
physical structure have become key components of investigations into the House
archaeologically. Architectural studies are often grounded in the notion that there is a strong
relationship between the ordering of domestic space and the organizing of social relations.
There are, for example, universal tendencies for greater segmentation of space, and the
construction of monumental architecture, to relate to increasing social hierarchy and complexity
(Hillier and Hansen 1980; Kent 1991; Rapoport 1969; Trigger 1990). Embedded within the
house structure, however, are also the conscious and unconscious notions that people have
regarding cultural tradition (Bourdieu 1977; Hodder 1990; Kolb and Snead 1997:613; Lawrence

30
1990; Pauketat and Alt 2005). People learn to build houses from their forbearers and from the
process of living within pre-existing ones.
The dwellings we excavate archaeologically, however, do not always represent the kind of
house the builder or inhabitant had in mind. Domestic houses are works in progress. They can
be lived in without being finished, abandoned before completion, or altered to serve another
purpose. There is no final outcome to architecture because inhabitants rework their dwellings
on daily, seasonal and generational bases. These processual aspects of house construction,
maintenance, reconstruction, abandonment and decay (Carsten and Hugh-Jones 1995b) require
us to consider the dwelling through time, an idea which has been explored for some time in
archaeology (e.g., Banning and Byrd 1987; McCartney 1979). In this way, examinations into
why people build the houses they do is inherently historical:
…[B]uildings of all kinds are handed down as a legacy from one generation to the next in
most sedentary societies; they illustrate the permanence and elasticity of the spatial
organization of societies, being one vehicle for the embodiment of social ideas. Yet if
there is a spatial and social order, however, it interacts with personal attitudes and social
irregularities, is an agent of both stability and change. In architecture, the relationship
between building form, its use, its meaning, and time is a transactional process between
physical and affective factors. Given this fundamental principle, the following theorem is
crucial for research on domestic space: “the relationship between habitat and resident is
dynamic or changeable, and it includes factors which may remain unresolved over a
relatively long period of time” (Lawrence 1990:78, emphasis original).
In addition to ideas of continuity and stability, architecture, like any form of material
culture, can be manipulated to conceal or highlight political or social changes that are occurring
within (Marshall 2000). Ames (2005a:299-300) for example, has argued that there is evidence
for social inequality in the Prince Rupert area burials long before it is expressed in architecture.
The problem with this assessment is that burials can also be manipulated to express deliberate
and often deceptive ideas about social organization (Cannon 2005; Parker Pearson 1982; Trigger

31
1989:348). In fact, patterning in burials may reveal more about mortuary custom and fashion
than directly representing social organization (Burchell 2006).
The Economies of Houses
Houses work not only to maintain and transmit their domestic structures, but also their estates
which may contain specific locations on the landscape well beyond their immediate environs.
Ownership such as this is likely to occur under specific ecological conditions and in conjunction
with specialization of key resources. This means that, in order to know how Houses operated,
we need to understand the economic systems that supported them (Ames 2005a:19; Carsten and
Hugh-Jones 1995b:19; Sandstrom 2000). If important resource locations were owned, we
would expect to see some indication of variability within specialized economic strategies
adopted by Houses. In the Prince Rupert area, this would include evidence for specialization of
important resources, such as salmon. Specialized economies are so defined because they reflect
the intensified exploitation of very few resources and a decrease in the number of secondary
taxa (Ames and Maschner 1999:128; Betts and Friesen 2004; Schalk 1977:228-229). These
strategies tend to be adopted where resources are spatially and temporally concentrated because
the cost of defence is less than the benefits of maintaining access to this resource (Dyson-
Hudson and Smith 1978). Under these conditions, groups are likely to specialize on a few key
resources and to develop systems of ownership that exclude non-members from access to them.
Betts (2005) has shown, for example, that Neoeskimo groups in the Mackenzie Delta region
developed a number of distinct focal economies in response to burgeoning populations and that
19th-century territorial and social divisions among Mackenzie Inuit were rooted in these much
earlier ownership strategies. Eerkens (2004) sees a slightly different approach to ownership
among Great Basin groups. He argues that sudden and significant increase in the density of

32
seeds around 600 years ago is evidence for ownership of piñon trees in the area. These
conditions appear to have fostered inequality in access to piñon seeds among households that
may ultimately have contributed to social and economic inequality in the region. Both studies
emphasize the role of competition for and the intensification of resources in the development of
ownership, but ownership of two different kinds of areas on the landscape (see also Casimir and
Rao 1992 and Kelly 1995). Betts (2005) is examining the origins of territories, which Ingold
(1986:156-157) defines as parts of the landscape bounded by well-defined perimeters. Eerkens
(2004), on the other hand, considers household land tenure strategies. Land tenure refers to
resource locations, or sites, and paths in hunting and gathering societies, and surface plots
among agriculturalists (Ingold 1986:156-157). It demarcates very specific places on the
landscape to which groups or individuals maintain the right to exclude others (Barnard
1992:146). Land tenure, then, is an apt term for what most Tsimshian ethnographers and
scholars refer to as House territories (McDonald 2005).
On the Northwest Coast, scholars have been long interested in understanding the
development of intensified salmon production, which, in areas such as Prince Rupert, has been
shown to be a component of specialized salmon-focused economies (Coupland 1988a, 1988b;
Coupland et al 2010; Matson 1992; Matson and Coupland 1996). Storage is a central
component of this kind of economic system. While storage is not unique to groups that adopt
specialized economies, there is a strong tendency for highly specialized groups to practice
storage of important resources on a large scale (Schalk 1977:228-229). Storage generally refers
to foods and other goods that are processed for consumption at another time of year. Delayed-
return systems, it is argued, create surpluses that foster or are fostered by social inequalities
(e.g., Hayden 1996; Testart 1982). Examples from the Northwest Coast suggest that storage-
based economies may occur without pronounced social inequality, such as the Paul Mason site

33
and areas of southern Alaska (Coupland 1988a; Fitzhugh 2002). This may be explained by the
fact that real differences exist between storage for the needs of the producers, such as resources
to live through the winter months, and groups producing beyond their needs (Ames 1985:158-
159; Gould 1985:429-430; Woodburn 1980). Social inequality may only develop once groups
produce beyond their short-term and long-term needs. Distinguishing storage for long-term
needs from production for the purposes of wealth accumulation may prove difficult based on
archaeological remains. Moreover, evidence for increased labour may not relate to the
intensification of production but may relate to risk-management. The introduction of weirs or
specific fishing technology may reflect a desire to get through a risky time, rather than to
increase production. Thus evidence for specialization, intensification and storage does not
correlate directly with social inequality in and of itself, but it can if other factors, in particular
evidence for territorial strategies, are present.
The role of social inequality and competition with regards to key resources that are in
some way owned is central to the development of Houses in the Lévi-Straussian sense of the
term. This inequality is not only manifest in differential access to important resources, but also
in the concomitant viability of Houses. Big Houses, as discussed by Coupland and Banning
(1996a), are able to achieve things that smaller Houses cannot because they can draw on large
labour pools. Individual House leaders may choose strategies that increase House membership,
for labour but also for prestige. In fact, one of the primary reasons many scholars consider large
households to have emerged is in order to undertake multiple tasks at once. This is what Wilk
and Rathje (1982) define as “task simultaneity.” This is important in areas where multiple
resources become available at the same time of year, or where important resources are abundant
for short periods of time. Large Houses may also have an easier time recruiting new members
because they appear more successful (Coupland and Banning 1996a:2-3).

34
Archaeological Correlates of Houses
This dissertation rests on the premise that I can identify Houses archaeologically, and that they
are distinguishable from simple physical structures, or domestic dwellings, which hold no
property or rights to estates. As I have alluded to above, evidence for the continued repair and
reoccupation of house depressions over hundreds, if not thousands of years may indicate the
existence of Houses. Within the archaeological record at Prince Rupert, Houses should show
little deviation from the original floor plan and evidence for the reuse of existing architectural
features, repair, and continuous occupation over very long periods of time that represent
multiple generations. There should be no evidence for long-term abandonment of the house
depression. House depressions that do not represent Houses would likely show evidence for
short-lived occupations and may contain evidence for alternative uses of the abandoned house
depression. As property-owning entities, Houses should also reveal evidence for land-tenure
strategies. As I have discussed above, such strategies may be represented by variability within
economic systems, and this would be most apparent within faunal remains. If resources are held
in common, we can expect little variability between house depressions in terms of faunal
remains. If house depressions represent Houses that own specific locations on the landscape,
particularly beyond the immediate vicinity of the dwelling, then there may be considerable
variability in terms of the kinds of resources each group is able to acquire.
These factors are particularly compelling in conjunction with evidence for inequality,
both in terms of house construction and size, as well as access to important resources. In other
words, evidence for Houses is strongest where house depressions vary considerably in size and
stature, where some house depressions appear to reflect long-term occupations, while others

35
suggest very short-term occupations. Houses should also produce evidence for considerable
disparity among households in terms of resources that people are able to acquire.
Conclusions
The purpose of this study is to try and understand social organization in the past in the Prince
Rupert area in a way that considers the multifaceted nature of social relations. I use the rubric
of House Societies because it is historically pertinent to the Tsimshian and other Northwest
Coast groups, and because it has proven to be a useful way of understanding both the day-to-day
interactions of House members, and the nature of social, economic and political transformations.
Weaving through the idea of the House are Pauketat and Sassaman‟s thoughts on the importance
of understanding the past in a multifaceted way and across multiple planes. To get at these
ideas, I propose to answer four questions: 1) What was the nature of social relations in small
villages such as GbTo-77 in light of multiple lines of evidence, including frequently overlooked
data? 2) Are the house depressions we excavate at this and other sites in the harbour
representative of Houses, as Ames and Marshall suggest? 3) If so, what can they reveal about
the nature of ownership and territoriality, as well as resource production, mobility and
settlement in the past? And 4) what relations existed between Houses within and between
villages?

Chapter 3. The Environment.
The idea that aspects of the local environment contribute to the structure of Northwest Coast
economies, settlement and social relations has been a focus of archaeological research in the
region for decades (e.g., Matson 1992; Monks 1987; Schalk 1977; Suttles 1987a,1987b).
Although the Northwest Coast is considered an extremely productive region, there is
tremendous variability in both plant and animal species, often within relatively short distances,
and availability of these resources can be highly localized in time and space. Contact-period
groups owned specific locations on the coast as well as along inland rivers and streams, and
thereby controlled access to culturally important resources.
Many anthropologists have observed that so called “hunter-gatherers” manage resources
and often rely on cultivated or domesticated plants and animals (Bird-David 1992; Deur and
Turner 2005a; Haggan et al. 2006; Ingold 2000; Williams and Hunn 1982). Recent work
exploring indigenous cultivation practices through the 18th and 19
th centuries also suggests that
Northwest Coast groups managed wild resources and altered environments in ways that
resemble the practices of horticulturalists (Deur and Turner 2005a; Ingold 2000). There is
significant evidence to suggest that Northwest Coast groups cultivated tobacco and cinqefoil
(Deur and Turner 2005b; McDonald 2005), used controlled burns of forests to boost berry
growth and entice deer (Deur and Turner 2005b; Haggan et al. 2006; Suttles 1987b), and
practiced shellfish cultivation (Ellis and Wilson 1981; Williams 2006). Scholars espousing this
perspective see indigenous groups as “ecological factors” in creating environments, an idea that
has percolated through the fields of ecology and botany for some time (Day 1953; Gomez-

37
Pampa and Kaus 1992). This approach also challenges our perceptions of what hunter-gatherers
do and what they might have done in the past.
In this chapter, I present what is known about the environment people would have been
living in 2000- 2500 years ago in the coastal and interior zones (sensu Martindale 1999) in and
around Prince Rupert. The province of British Columbia defines “environment” on broad
geographical relationships, macroclimatic processes and landforms (Banner et al. 1993:6) and
uses the term synonymously with “ecoregion” and “biogeoclimatic zone” or “ecosystem.” I
begin this section with the physiography, hydrology and climate of the Prince Rupert and
Skeena region of the north coast, all of which contribute to the kinds of plants and animals that
inhabit this area today. I discuss also pre-contact-period ecological changes that may have
occurred in this region, with particular emphasis on the late Holocene.
Archaeologists working on the Northwest Coast have tended to emphasize faunal
resources and, indeed, a significant portion of this work is dedicated to examining the choices
that the inhabitants of GbTo-77 made with respect to fauna. More recently, archaeologists have
begun to examine floral remains within archaeological deposits (e.g., Lepofsky and Lyons 2003;
Ruggles 2007). The timing of plant harvests as well as their locations within the local
environment would also have played a key role in mobility, settlement and subsistence
practices, perhaps in concert with the exploitation of other resources. Moreover, as Blair
(2004:137) points out, raw material sources can also be reflected in the choices people make
about settlement, mobility and subsistence. On the Northwest Coast, these raw materials are not
only lithic, but also organic, such as bone and, perhaps most importantly, wood. The resources
that are harvested, as well as how and when they are exploited, have profound influences on
other aspects of society, such as where people live, what kinds of structures they build, how they
travel, and what kinds of raw materials are available for tool-making.

38
The Structure of the North Coast Environment
GbTo-77 is situated within traditional Tsimshian territory, which includes the coastal mainland
and islands in and around the city of Prince Rupert, as well as the Coast Mountains and the
Skeena and Nass River drainage systems. Digby Island is one of a group of islands that,
together with the Tsimpsean Peninsula, define the inner harbour (Figure 3-1). I define the outer
harbour as the west coast of Digby Island and the northern Tsimpsean peninsula, as well as the
outer coastal islands.
Figure 3-1. Map of Prince Rupert Harbour showing landmarks cited in the text.
Norwegian fishermen and their families established two small communities, Dodge
Cove and Crippen Cove, on Digby Island in the early 20th
century. The city of Prince Rupert is
located on Kaien Island and Metlakatla First Nation on the Tsimpsean Peninsula north of Venn
Passage.
Kilometers
0 1 2 3 4 5
Tsimpsean Peninsula
Digby Island
Kaien Island
Tugwell Island
Chatham Sound
N
Venn Passage
Metlakatla Bay
Tsimpsean Peninsula
Tsimpsean Peninsula
Duncan Bay
Dodge Cove
CrippenCove
City o
f Prin
ce R
uper
t
Metlakatla
Mount Hays
Inner Harbour
Outer Harbour
GbTo-77

39
The inhabitants of GbTo-77 lived within an environment that was similar in most
respects to that which is currently found within the traditional Tsimshian homeland. Botanical
remains from cores taken from Hayes Mountain on Kaien Island and Diana Lake on the
southern Tsimpsean Peninsula near the mouth of the Skeena show that sea levels stabilized in
this area between 8400 and 7700 BP (Banner et al. 1983:939). Initial soil deposits in this area
were alluvial and early forests were composed of shore pine, alder and ferns (Banner et al.
1983:942). Durable parent materials, combined with glacial run-off and a cool wet climate
contributed to the paludification (development of mires and bogs) of these forests.
According to Hebda (2007), the shift to modern ecological conditions on the Northwest
Coast occurred between 7000 and 4000 years ago. These conditions fostered forests of pine-
western hemlock-cypress bog woodland in the Prince Rupert/Skeena region (Banner et al. 1983;
Turunen and Turunen 2003:234). Western redcedars and pacific silver firs were important
components of these forests, particularly on the north coast (Hebda 2007; Hebda and Mathewes
1984). In the Prince Rupert/Skeena region, modern oceanic climate and forest, dominated by
cypress-pine-hemlock-heath-mire, was well established by 2000 cal BP (Turunen and Turunen
2003). While the modern forest was established relatively late, western redcedar, a key resource
for Northwest Coast groups in the harbour area, as well as the conditions for productive shellfish
communities and anadromous salmon runs appear to have been in place by the early Holocene
(Hebda and Mathewes 1985; Moss et al. 2007). In fact, recent archaeological work in the
region confirms that shellfish were harvested in large quantities as early as 7000 to 8000 years
ago (Banahan 2005; Martindale et al. 2009; McLaren 2008).

40
Physiography and Topography
The Prince Rupert area of British Columbia is situated within the western system of the
Canadian Cordillera. This system is made up of three physiographic regions: the Insular
Mountains, the Hecate Depression (or lowland) and the Coast Mountains. The Insular
Mountains are found on Haida Gwaii and include the St. Elias Mountains composing the
Alexander Archipelago in Southern Alaska (Figure 3-2). The Hecate Depression is part of the
Coastal Trough, a largely submerged landscape of basaltic lava and sedimentary rock with some
granitic inclusions. The exposed terrain in the Depression consists of low-lying, rocky, coastal
islands (including Digby and Kaien islands) and muskeg; summit elevations are below 600 masl
(Banner et al. 1993:4.1-4.2; Clague 1989; Hoos 1975:9; Klinka and Chourmouzis 2001:4; Ryder
1978:12-14).
The interior in and around the lower Skeena River is dominated by the Coast Mountains.
These mountains are composed of intrusive igneous rock (mainly granite with some gneiss and
schist) that is relatively resistant to weathering (Ryder 1978:12-14). Groundwater resulting
from heavy and constant rainfalls that characterize the region‟s climate tends to pool and is not
easily drained. As a result, much of the north coast landscape (51% to 79%) is mire (Turunan
and Turunan 2003). The peaks range in elevation between 2500 and 4000 masl and exhibit a
northwest-southeast linear structure, carved out by glacial and fluvial action. During the last
glacial advance, low-lying troughs were cut across these mountains by moving ice and these
now form the major river systems on the north coast. The Coast Mountains are made up of two
distinct ranges, the Kitimat and the Boundary ranges. The Kitimat Range is characterized by
rounded tops or dome shapes that formed when these peaks were overridden by the Cordilleran
Ice Sheet. These are found south of the Nass River and some contain remnant glaciers. By

41
Figure 3-2. Map of northern British Columbia and southern Alaska showing the locations
of physiographic landforms and major rivers mentioned in the text. This map also
illustrates the locations of the cities of Prince Rupert and Terrace.

42
contrast, the Boundary Range has a serrated appearance and runs from the Nass River northward
(Banner et al. 1993:4.1-4.2; Ryder 1978:26-27).
Hydrology
Few streams and creeks in the vicinity of Prince Rupert drain into the harbour and even fewer
are large enough to sustain anadromous fish runs (Canada Dept. of Energy, Mines and
Resources 1980; David Peacock pers. comm..). The largest drainage systems in the area are the
Skeena River to the south and the Nass River to the north.
Both the Skeena and Nass rivers originate in the Nass Basin, a low-lying area composed
of hundreds of lakes in northwestern British Columbia. These lakes drain into the Nass and
Skeena rivers, as well as through their tributaries (Banner et al. 1993). The Skeena is the largest
watershed on the northern coast and drains an area of 54,400 km2 (Natural Resources Canada
2009). Its waters travel approximately 580 km south and then west through the Coast
Mountains to the sea. A number of major rivers drain into the upper and middle section of the
Skeena, including the Babine and Bulkley rivers (Figure 3-3). The lower Skeena is also fed by a
number of smaller tributaries originating in the high altitudes of the Coast Mountains, although
Lakelse Lake and Diana Lake also drain into the Skeena via smaller tributaries.
The waters of the Skeena estuary are especially turbid, particularly during the spring
freshet and heavy autumn rains (Hoos 1975:53-54). The river picks up fine particles and silt
that are held in suspension throughout its course until they are deposited in banks or shoals
along the lower river and channels connecting the estuary to the sea. The Skeena estuary is
large; Hoos (1975:1-4) sees the limits of the estuary area as over 30 km across and extending
almost 8 km seaward, but there is no delta per se. Most of the fresh water leaving the Skeena
flows north and enters Chatham Sound through a series of channels. Three-quarters of Skeena

43
Figure 3-3. Map of the Skeena River watershed showing the location of
landmarks cited in the text.
Lakelse River
KitsumkalumRiver
Morice River
Babine River
Kispiox RiverB
ulkley
Riv
er
Skeena River
Skeena River
Ecstall River
KaienIsland
0 10 20
Kilometres
N
MoriceLake
BabineLake
Inverness Passage
Lakelse LakeDiana
Lake
KitsumkalumLake

44
waters enters Chatham Sound through southern channels; only one-quarter of this freshwater
heads north through Inverness Passage. Some of this water encircles Kaien Island, but does not
move to the north or western coasts of Digby Island, because waters originating from the Nass
prevent Skeena waters from moving north of Tugwell Island (Hoos 1975: 5, 31, 42-43).
South of the Skeena Estuary, the coastline is similar in structure and physiography to the
northern area. There are many more rivers and streams that drain directly into the Pacific and
many of these watercourses have anadromous fish runs. Mitchell (1983) and Coupland et al.
(2001) have suggested that this physiography may explain why contact period Tsimshian living
south of the Skeena owned fishing locations that were dispersed across several smaller
watercourses, while Coast Tsimshian groups tended to own specific locations on the Skeena
watershed.
The shorelines in Prince Rupert Harbour and in the vicinity of the Skeena estuary are
highly indented (Hoos 1975). Consequently, much of the coastline in these areas is well-
protected or semi-protected from direct oceanic conditions. Well-protected coastlines in the
Prince Rupert area include bays and coves of the inner harbour, the eastern shorelines of near-
shore coastal islands, and estuaries (sensu Ricketts et al. 1985). Semi-protected shorelines
include the western shores of Digby Island and other outer harbour islands, as well as the coastal
regions of the northern Tsimpsean Peninsula. Western shorelines of Dundas Island and
Stephens Island are more exposed to oceanic conditions than harbour coastlines. Different types
of fauna, particularly shellfish, may flourish in these environments than in the harbour area.
The waters in and around Digby Island are relatively shallow, particularly on the
northern, southern and western shores. Digby Island shorelines are composed of sand, gravel
and pebble beaches, mudflats, eel grass and kelp forests, interspersed with large rocky outcrops
(Canada Dept. of Energy, Mines and Resources 1980; Fisheries and Oceans Canada, 2010).

45
GbTo-77, for example, is situated on a small, shallow, unnamed bay that is bracketed by large
schist, rhyolite and phyllite bedrock outcrops (Crawford et al. 2000). The shoreline here
consists of at least three wide, sand and gravel beaches interspersed with smaller rocky outcrops
(Figure 3-4 and 3-5). Consistent with much of this landscape, the slope of the beach and
intertidal zone is shallow. At lowest normal tide1 the water lines in almost 200 m from the
beach ridge. For the next 250 m, the waters are between 1 and 5 m deep. Ocean depths
continue to grade gently into Metlakatla Bay, itself a relatively shallow body of water (generally
less than 30 m deep). Shorelines on the northern side of Metlakatla Pass, on Tugwell Island and
to the north in Duncan Bay are very similar to those on these outer shores of Digby Island (see
Figure 3-1). Although there are a number of small shallow coves on the eastern coast of Digby
Island, including Dodge Cove, overall, the sea floor drops very quickly from the waterline to
depths of over 40 m below sea level. The western shoreline terrain of Kaien Island is similar
creating a narrow and deep channel between these two islands that is in effect Prince Rupert
Harbour (Canadian Hydrographic Services 1998).
Figure 3-4. Beach front at GbTo-77, high tide, summer 2003.
1 The lowest normal tide is the average of the lowest low waters (Fisheries and Oceans, Canada, 2010)

46
Figure 3-5. Beach front at GbTo-77, low tide, summer 2004.
The tides in the Prince Rupert area are semi-diurnal and have large tidal ranges that contribute to
strong currents and “vigorous mixing” (Hoos 1975:xxi). Mean high tide is 6.1 m and mean low
tide is 1.2 m above lowest normal tide (Canadian Hydrographic Services 1998). In some areas,
the fluctuation between high and low tides appears even more pronounced due to the highly
indented nature of the coastlines, which creates “a funnelling effect on incoming water” (Hoos
1975:56). This physiography has created a highly productive environment for many marine
species of flora and fauna, including a variety of shellfish, many of which could be easily
harvested during very low tides. The physical structure of the coastlines in the Prince Rupert
harbour area also influences wave action. The many islands and shoals that compose this
coastal landscape break wave swells, making waters choppy, but impeding the development of
large waves that break against the shore as is common on open coastlines (Hoos 1975:58).
Waters are deeper in Chatham Sound, where they reach over 100 m in parts (Canadian
Hydrographic Services 1998). West and north of Stephens Island and the Tree Nob Group of

47
Islands, ocean depths reach over 200 m in Brown‟s Passage and Hecate Strait. The deepest
waters in the area are in Dixon Entrance, where ocean depths range between 200 and 400 m.
West of Haida Gwaii is the edge of the continental shelf, where water depths rapidly drop to
over 2000 m (Statistics Canada 1947).
Climate
The North Coast climate is influenced by the region‟s proximity to the ocean and its topography.
In the winter, storms develop offshore over the North Pacific Ocean and move toward the Gulf
of Alaska where they weaken and die. Storm fronts frequently break away from these storm
centers and move across the coastline where they are blocked by the Coast Mountains and drop
their precipitation. As a result, the rainfall on the coast and the west-facing slopes of the Coast
Mountains is the highest in Canada (Ryder 1989). As winters are mild along the coast, only
4.5% of this precipitation falls as snow (Banner et al. 1983:939). Annual potential evaporation
is generally low; it is highest in July and almost nil from October to February. The heavy
rainfall combined with low evaporation rates contributes to the creation and maintenance of the
mires, or muskeg, that compose so much of the landscape in this area (Meidinger and Pojar
1991:97). Because the strong west winds weaken in summer, the intensity of Pacific storms and
coastal rainfall is greatly diminished in the warmer months (Schaefer 1978:3-5). The wet
climate and terrain are important elements of the north coast landscape because they may help to
explain why people living here built their houses on top of carefully constructed shell middens
(Martindale et al. 2009).
By contrast, temperatures recorded at Terrace in the interior, near Kitselas Canyon, are
very different than those at Prince Rupert (Table 3-1). The difference between mean summer
and winter temperatures is more pronounced; precipitation rates are two-thirds to one-half those

48
on the coast, and much more falls as snow (between 20% and 70 %). In the interior, the deep
winter snowpack is slow to melt, which means that the vegetative season is short (Banner et al.
1983). This vegetation and climate of the interior may have contributed to the decision by
contact and post-contact period groups to spend winters in the harbour (Martindale 1999:49).
Table 3-1. Summary of major climatic information for the coastal area (Prince Rupert) and
the interior (Terrace). Sensu Martindale 1999; Environment Canada 2010.
Location Prince Rupert Terrace
Lowest Daily Mean
Temperature
1.3oC (January) -4.3
oC (January)
Highest Daily Mean
Temperature
13.5 oC (August) 16.4
oC (July)
Highest Mean Precipitation 304.4 mm (November) 191.6 mm (December)
Lowest Mean Precipitation 114.3 mm (July) 51.3 mm (June)
Mean Annual Precipitation 2468.5 mm 1322.4 mm
Snowfall 40.9 cm 110.5 cm
Vegetation
Traditional Tsimshian territory encompasses two biogeoclimatic zones. The harbour, and by
extension GbTo-77, is situated in the Coastal Western Hemlock zone. This biogeoclimatic zone
extends along almost the entire coastal area of British Columbia, including most of the Coast
Mountains from 0 to 300 m asl in the north, and stretches into the interior along major river
valleys, such as the Skeena. Forest cover in this area is dominated by western hemlock (Tsuga
heterphylla), though western redcedar (Thuja plicata) is also common in the Prince Rupert area.
Other common species in this biogeoclimatic zone are amabilis, or pacific silver-fir (Abies
amabilis), lodgepole pine (Pinus contorta), yellow cedar (Chamaecyparis nootkatensis) and red
alder (Alnus rubra). Black cottonwood (Populus balsamifera)is common on large rivers with
extensive floodplains, such as the Skeena. Sitka spruce (Picea sitchensis) is also widespread in
the north and is found in a wide variety of habitats (Meidinger and Pojar 1991:96-97).

49
The higher altitudes of the interior section of Tsimshian territory fall mainly within the
Mountain Hemlock Zone. This biogeoclimatic ecosystem is found in higher altitudes of the
Coast Mountains, between 400 and 1000 masl. The dominant tree cover is the mountain
hemlock, with some amabilis fir and yellow cedar. Forests are confined to lower elevations and
are interspersed with wide areas of parkland (Meidinger and Pojar 1991:113-114).
Plant Resource Locations
Other than looking at the remains of wooden house-building material, there is no formal
analysis of botanical remains included in this study. However, a number of important plant
species were used by contact period Tsimshian groups for consumption and trade, as well as
housing, medicines, clothing, utensils, and furnishings (McDonald 2005; Smith 1997). As with
many other resources in the area, important plant species are often available at certain times of
year in specific locales (Turner et al. 2005). Tsimshian groups harvested at least twenty-two
kinds of berries, including red elderberries (Sambucus racemosa), high-bush cranberries
(Viburnum edule), soapberries (Shepherdia canadensis), salmon berries (Rubus spectabilis),
seaside strawberries (Fragaria chiloensis), and raspberries (Rubus spp.). Although berries and
fruit-bearing plants grow in the interior and coastal forests (Garfield 1966:13; Turunen and
Turunen 2003), contact period Tsimshian groups tended to harvest these resources from owned
lands within the Skeena watershed in conjunction with salmon fishing (McDonald 2005, Miller
1997:22). Contact-period groups managed berry patches with periodic burning in order to
encourage more productive growth (McDonald 2005:247; Turner and Peacock 2005:127).
Seaweeds, bracken fern (Pteridium aquiliunum) and rice-root (Fritillaria lanceolata)
grow well within the coastal region. According to McDonald (2005:249-250) post-contact-
period Tsimshians tended and gathered rice-root and ferns through the spring and summer.

50
Tsimshians harvested seaweeds, particularly kelp, in May (Miller 1997:21). It is not clear
which kind of kelp was harvested, but bull kelp (Nareoceptis luetkeana) and giant kelp
(Macrocystis pyrifera) are common species found in the harbour today. The inner layers of
hemlocks, spruces and pines were stripped and eaten (McDonald 2005). Redcedars were
stripped of bark and roots while standing to provide raw materials for baskets, clothing and mats
(McDonald 2005; Miller 1997:21). Redcedars were also used in house and canoe construction
(Boas 1916:397; Garfield 1996:10). While roots and bark might be taken from both the interior
and coastal locations, material for house and canoe construction likely originated near the
village, or from areas accessible from the water.
The climatic history for this region indicates that many of these plants, particularly
western redcedar, berries, fruit trees and seaweeds, have been components of the Prince
Rupert/Skeena River ecosystem for thousands of years (Banner et al. 1983; Turunen and
Turunen 1980). Thus, many of the same kinds of plants could have been harvested by pre-
contact groups living in this region.
Fauna
The importance of stored salmon in pre-contact indigenous Northwest Coast economies has
become a central issue and leading research question in the archaeology of the region (Ames
and Maschner 1999:251-153; Cannon 2001; Coupland et al 2001; 2003; Croes and
Hackenberger 1988; Huelsbeck 1988; Matson 1992; Schalk 1977). While some scholars have
looked for coast-wide consistencies regarding the origins of the stored salmon economy, there
has been increasing recognition that significant variability exists among regions in terms of
when and how salmon became a focal part of the pre-contact economy (Cannon 2001; McMillan
et al. 2008; Orchard 2007). Salmon may have been particularly important in northern regions

51
where carbohydrate sources are rare. Other protein sources, such as shellfish, flatfish and deer
contain insufficient fats during the winter to counter the problems associated with eating large
amounts of protein (Cannon 2001:181). Salmon, however, are not the only resource that can
fulfill this important dietary role. Other sources of oil, such as sea mammals, herring and
eulachon, would have been important components of pre-contact diets across the coast.
Eulachon oil was not only used as a preservative and condiment for other foods, it was an
important trade item with interior and northern groups, as well as the Haida (Boas 1889:35;
Garfield 1966:13; Mitchell and Donald 2001:21-23).
How resources are situated within the landscape, as well as their availability, would have
been important considerations for people living in this environment and at the village sites
discussed in this study. Existing settlement data indicates that villages were dispersed in coastal
areas prior to 2000 BP and that each village was situated within its own catchment zone
(Martindale 1999:74). The people living within these coastal villages concentrated on
seasonally available local resources. For the most part, it is unclear whether these villages were
occupied year-round. Stewart and Stewart (2001) have argued that there is some evidence for
year-round use of the Boardwalk site and perhaps Ridley Island. Sites excavated by Coupland
(1999, Coupland et al. 2001, 2003, 2006), by contrast, suggest that even around 2000 years ago,
the coastal villages were largely winter occupations. After 2000 BP, and perhaps as late as 1500
BP, people built villages close together, likely for protection, along Venn Passage. These
Tsimshian groups may have included people with inland ancestry and rights to interior resource
locales (Martindale and Marsden 2003).
If villages prior to about 2000 BP were relatively permanent, and well spaced throughout
the harbour, then their faunal assemblages should reflect local resources. Local resources are
those that are found within the harbour, but many, particularly shellfish, may be found in very
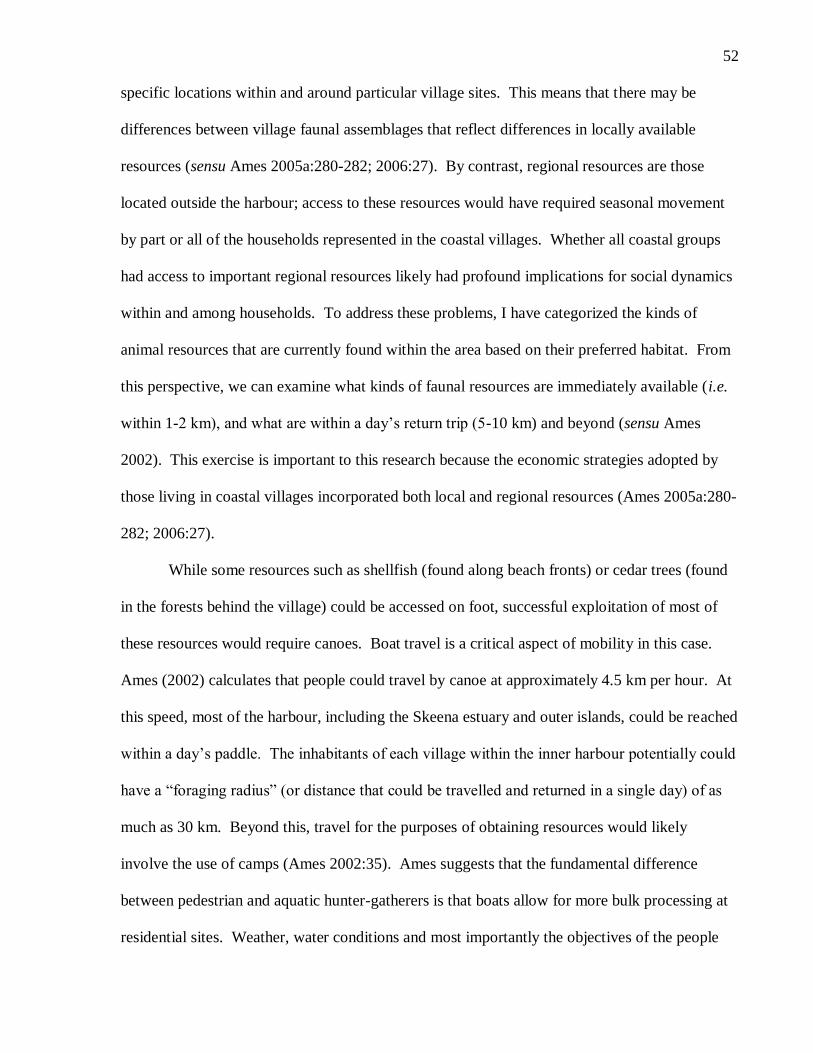
52
specific locations within and around particular village sites. This means that there may be
differences between village faunal assemblages that reflect differences in locally available
resources (sensu Ames 2005a:280-282; 2006:27). By contrast, regional resources are those
located outside the harbour; access to these resources would have required seasonal movement
by part or all of the households represented in the coastal villages. Whether all coastal groups
had access to important regional resources likely had profound implications for social dynamics
within and among households. To address these problems, I have categorized the kinds of
animal resources that are currently found within the area based on their preferred habitat. From
this perspective, we can examine what kinds of faunal resources are immediately available (i.e.
within 1-2 km), and what are within a day‟s return trip (5-10 km) and beyond (sensu Ames
2002). This exercise is important to this research because the economic strategies adopted by
those living in coastal villages incorporated both local and regional resources (Ames 2005a:280-
282; 2006:27).
While some resources such as shellfish (found along beach fronts) or cedar trees (found
in the forests behind the village) could be accessed on foot, successful exploitation of most of
these resources would require canoes. Boat travel is a critical aspect of mobility in this case.
Ames (2002) calculates that people could travel by canoe at approximately 4.5 km per hour. At
this speed, most of the harbour, including the Skeena estuary and outer islands, could be reached
within a day‟s paddle. The inhabitants of each village within the inner harbour potentially could
have a “foraging radius” (or distance that could be travelled and returned in a single day) of as
much as 30 km. Beyond this, travel for the purposes of obtaining resources would likely
involve the use of camps (Ames 2002:35). Ames suggests that the fundamental difference
between pedestrian and aquatic hunter-gatherers is that boats allow for more bulk processing at
residential sites. Weather, water conditions and most importantly the objectives of the people

53
who are traveling could alter this model in substantial ways. We might expect, for example, that
fish caught in Hecate Strait (well within a day‟s return trip) could be brought back to the village
whole. The Lucy Islands, however, are also well within a day‟s return trip from Digby Island;
whether people camped here or retuned to the village would depend on the weather, the tides,
the composition of the crew, but particularly whether shellfish were collected and processed on
site.
In the remainder of this chapter, I present the kinds of fauna that are common today
within the inner and outer harbour, as well as at the Skeena and Nass watersheds. I generated
these lists from two types of sources. I used general, coast-wide sources on animal behaviour
and life histories such as Hart (1988), Quayle (1960) and Ricketts et al. (1985) to determine the
kinds of taxa common to northern forests and waters. I also used regionally-specific sources,
such as Hoos (1975) and Henderson and Graham (1998) where applicable to provide details
specific to Skeena River salmon migrations and life histories.
Although wetlands and modern forests have continued to expand within the past 4000
years, the basic ecological structure of Prince Rupert Harbour and the adjacent area appear to
have been in place for thousands of years (Hebda 2007; Turunen and Turunen 2003). In fact,
the structure of the most important resources, including anadromous fish and shellfish, was
well-established by the time GbTo-77 and the other study sites were inhabited (Hebda and
Fredericks 1990; Moss et al. 2007). Short-term natural phenomena and human behaviours,
however, can have a significant impact upon local habitats. For example, kelp forests and
eelgrasses may flourish or become depleted due to changes in the fishing and hunting of the
animal species inhabiting these environments, blooms in sea urchin populations, changes in
ocean temperatures and salinity or storms (Steneck et al. 2002:439-440). Shellfish beds can be
over-harvested (Jerardino 1997; Kaustuv, et al.2003; Quitmyer and Jones 2000; see Claassen

54
1997 for alternative views) or enhanced by human alterations to the natural substrate (Williams
2006). Species, such as sea otters and northern fur seals, were extirpated from many regions of
the north coast due to increasing human predation (Gifford-Gonzalez et al. 2005; Newsome et
al. 2007; Orchard 2007). Changes in microhabitats such as these had profound influences on
local shellfish, fish and sea mammal populations.
The shellfish list is dominated by taxa that inhabit northern waters in protected and semi-
protected environments. I have also included significant shellfish taxa that inhabit open, or
exposed, coastlines, because these invertebrates might grow well on more exposed coasts such
as the western coasts of Dundas Island and Stephens Island, and would have been accessible to
people living in the harbour. I emphasize fish and shellfish because these taxa dominate the
assemblage from GbTo-77 and the other harbour sites.
Fish
The relationship between fish and their environment, and among fish species, is rarely
straightforward. Many species can occupy multiple environments and not just on a seasonal
basis. All species, however, have specific tolerances to attributes of their environment such as
salinity, water temperature and oxygen levels (Hart 1988:6). Thus an understanding of the kinds
of environments fish species prefer and where they are frequently found, can give insight into
where and how the tasks associated with fishing were incorporated into other aspects of people‟s
lives, such as mobility, settlement, trade and social relations. Table 3-2 presents the common
fish species that are found within what is now Tsimshian territory. This area includes four

55
Table 3-2. List of fish taxa common to the Prince Rupert Harbour and the Skeena River. This list contains fish habitats based on
seasonality and life stages, including spawning (S), immature (IM), and mature (M). Sources: Fisheries and Oceans Canada 2009a, 2010;
Haegele and Schweigert 1985; Hart 1988; Henderson and Graham 1998; Hoos 1975; Spaete and Wehrly 2006.
Species
Habitat
Marine Estuarine Fluvial Lacustrine
Deep Water
>400 m
Moderate
200-400 m
Shallow
<200 m
Intertidal
Anadromous
Sockeye salmon
Oncorhynchus nerka
common spring
through fall
(S)
spring through Fall
(S); may be
common in northern
rivers year round.
occasional
Chinook salmon
Oncorhynchus tshawytscha
common
common common spring
summer fall (S)
spring
summer fall (S)
Chum salmon
Oncorhynchus keta
common occasional
spring/summer
summer
fall (S)
summer
fall (S)
Coho salmon
Oncorhynchus kisutch
common common common summer
fall (S); young
salmon common
year round
Pink salmon
Oncorhynchus gorbuscha
common summer spring (IM) fall (S)
Steelhead salmon
Oncorhynchus mykiss
common common common
late winter/spring
(S)
and summer
Cutthroat salmon
Oncorhynchus clarki
common common common Feb to March (S) common
Rainbow Trout Salmo
gairdneri
Occasional Common common Autumn Common
Dolly Varden Salvelinus malma
common spring autumn (S) common
Eulachon
Thaleichthys pacificus
common (mid
waters)
March to May (S)
Surf or Silver Smelt
Hypomesus pretiosus
M summer (S)
Capelin
Mallotus villosus
Sept to Oct.
(S)
Longfin Smelt
Spirinchus dilatus
winter Oct to Dec (S)

56
Species
Habitat
Marine Estuarine Fluvial Lacustrine
Deep Water
>400 m
Moderate
200-400 m
Shallow
<200 m
Intertidal
Pacific Lamprey Entosphenus
tridentatus
common M July to October;
spring (S)
Marine
Dogfish
Squalus acanthias
M summer M summer IM Common M
Winter
Sand Sole
Psettichthys melanostictus
common
Rock Sole
Lepidopsetta bilineata
common
(benthic)
winter (S) occasional in
summer
English or Lemon Sole
Parophrys vetulus
common winter (S)
spring IM
Dover Sole
Microstomus pacificus
common
(benthic and
pelagic)
common
(benthic and
pelagic)
Rex Sole
Glyptocephalus zachirus
common March, April (S) IM occasional
Petrale Sole
Eopsetta jordani
winter/spring (S)
(benthic and
pelagic)
spring (benthic
and pelagic)
IM occasional
(benthic)
Butter Sole
Isopsetta isolepis
winter. summer
Flathead Sole Hippoglossoides elassodon
common (pelagic)
IM common
Turbot, or Arrowroot Flounder
Atheresthes stomias
common
(benthic and
pelagic)
Starry Flounder Platichthys
stellatus
common; Feb to
April (S)
occasional occasional
P. halibut
Hippoglossus stenolepis
common
(benthic)
Nov to Jan (S)
(benthic)
March to May
(benthic)
Greenling
Hexagrammos sp.
common
(benthic)
Lingcod
Ophiodon elongatus
occasional December to
March (S)
Winter
occasional
IM spring
Herring
Clupea harengus pallasi
fall summer
(Pelagic)
February-April
(S)
Ratfish common common visitor

57
Species
Habitat
Marine Estuarine Fluvial Lacustrine
Deep Water
>400 m
Moderate
200-400 m
Shallow
<200 m
Intertidal
Hydrolagus colliei
Rockfish
Sebastes sp.
common
(benthic)
common
(benthic)
common
(benthic)
Black Prickleback
Xiphister atropurpureus
common
common
Rock Prickleback
Xiphister mucosus
common common
White-barred Prickleback
Poroclinus rothrocki
common
Sculpins
Cottidae
occasional
(benthic)
common
(benthic)
common
(benthic)
Sablefish
Anoplopoma fimbria
common IM Spring
through Autumn
Albacore
Thunnus alalunga
occasional
summer
(pelagic)
Walleye Pollock
Theragra chalcogramma
common
(bathypelagic)
Pacific Hake Merluccius productus
common (pelagic)
Pacific Cod
Gadus macrocephalus
common
(benthic)
common
(benthic)
occasional
Pacific Sandfish
Trichodon trichodon
common common
Spiny Lumpsucker
Eumicrotremus orbis
common common
Tadpole Snailfish Nectoliparis
pelagicus
common
(benthic and
pelagic)
common (benthic
and pelagic)
Threespine Stickleback
Gasterosteus aculeatus
common common common common
Red Brotula
Brosmophycis marginata
common common
Flathead Clingfish Gobiesox
maeandricus
year-round
Yellow Shiner Cymatogaster
aggregata
winter summer

58
Species
Habitat
Marine Estuarine Fluvial Lacustrine
Deep Water
>400 m
Moderate
200-400 m
Shallow
<200 m
Intertidal
Fluvial-lacustrine
Burbot Lota lota always
Lake Whitefish Coregonus
clupeaformis
always
Rocky Mountain Whitefish
Prosopium williamsoni
always
Peamouth Chub Mylocheilus caurinus
always
Squawfish
Ptychocheilus oregonensis
always
Bullhead Sculpin
Cottus asper
always
Long-nose Dace Rhinichthys
cataractae
always
Chub Minnow
Couesius greeni
always
Long-nose Sucker Catostomus
catostomus
always
Common or White Sucker C.
commersonii
always
Coarse-scaled Sucker
C. macrocheilus
always
Redbelly Dace
Chrosomus eos
always
Kokanee salmon
Oncorhynchus nerka kennerlyi
common common

59
broad aquatic habitats: marine, estuarine, fluvial and lacustrine. The fish species listed here are
commonly found in the kinds of marine and freshwater habitats that are present within the
Prince Rupert/Skeena region today. I have divided marine habitats into four subcategories.
Deep water is defined as greater than 400 m and refers to areas off the continental shelf west of
Haida Gwaii and parts of Dixon Entrance. Travel from Digby Island to these areas to fish or
hunt sea mammals or birds would take more than one day.
Moderate depths are between approximately 200 and 400 m. This comprises the Hecate
Strait and other areas of a similar depth, and includes areas within a day‟s travel by boat. Island
groups such as the Dundas and Lucy islands, as well as Stephens Island are also within a day‟s
paddle of the inner harbour. Shallow waters are defined as less than 200 m, which includes
larger bays, such as Metlakatla Bay, in and around Prince Rupert. The intertidal zone includes
all shorelines that are subject to tidal actions. Intertidal and shallow water environments would
have been immediately available to inhabitants of GbTo-77, assuming good weather.
Estuarine habitats refer to the Skeena and Nass estuaries. The lower reaches of the Skeena and
its estuary are accessible within less than 10 hours through relatively sheltered waters. Fishing
trips could be fairly informal based on this criterion alone, but the time spent in these areas
would vary depending on the resources sought. Fluvial habitats relate to any river, stream or
creek, but the Skeena and Nass are the main rivers. Lacustrine habitats pertain largely to inland
lakes. Major ones within the Tsimshian territory or off the Skeena River include Lakelse Lake,
Diana Lake and Woodworth Lake. While some of the lakes on Kaien Island or the mainland
could be reached within a day, they might also require overland travel. People living on Digby
Island could travel most of the way to the lakes that feed the Skeena tributaries by boat, but
these are considerably farther away from the harbour than those on the adjacent mainland.

60
There are a variety of fish species within the immediate vicinity of GbTo-77 (i.e. the
intertidal zone and shallow waters of Metlakatla Bay). The vast majority of these fish are
common to these environments, meaning that they could be found in either inter-tidal or shallow
waters throughout most of the year. Species that are specifically available in the winter in the
intertidal area and in shallow waters are longfin smelt, starry flounder, dogfish, rock sole and
lingcod (Hart 1988:46, 147, 468, 622, 632). Those specific to these habitats in spring are certain
varieties of sole and herring (Haegele and Schweigert 1985, Hart 1988:96, 608, 629-630).
Summer fish are butter soles, herring and shiners (Hart 1988:305, 620; Haegele and Schweigert
1985). Surf smelt are available year-round and congregate at the mouth of the Skeena River
(Hart 1988:305). Capelin and surf smelts spawn on shallow beaches like the shoreline in and
around GbTo-77 during the fall, while eulachon spawn mostly at the Nass, though there is a
small Skeena run as well (Hoos 1975:86-87). Contact period groups took advantage of this and
harvested eulachon using rakes when they came close to shore in large numbers to spawn
(Stewart 1977:76-77).
Herring were often fished in much the same way as eulachon by many pre-contact period
Indigenous groups (Stewart 1977). According to Miller, contact and post-contact period
Tsimshian harvested herring spawn in the early spring (Miller 1997:21). Garfield (1966:13)
noted that Tsimshian also fished herring, though it is not clear when during the year herring
fishing took place. The numbers of Pacific herring that head inshore to spawn in shallow,
coastal waters each year are highly variable. According to Hoos (1975) herring spawn out of
the influence of fresh water. Haegele and Schweigert (1985) however, contend that herring
spawn are not greatly affected by fluctuations in salinity and temperature. On the north coast,
peak spawning occurs in late March early April in sheltered inlets and bays. Herring stocks will
return to the same general area each year to spawn, but are flexible in terms of where precisely

61
spawning will take place. Spawning will occur wherever appropriate substrates can be found.
Herring could have been fished in large numbers during spawning as noted by Drucker
(1963:3). Bailey (1952), however, indicates that herring have used most of their oil reserves by
the time they spawn, suggesting that herring might have been activily sought at other times of
the year. Herring migrate inshore in the late winter and congregate in deep bays and inshore
channels prior to spawning. Young herring also school in inshore waters through the summer
before moving to deeper waters in the fall (Hart 1988:97-98). In other words, contact-period
Tsimshians, as well as their pre-contact counterparts, could have fished for herring at a number
of times throughout the year.
Many fish species that spend part of the year in Hecate Strait and other moderate depths
(200-400 m) frequent shallow waters at other times of the year. Only varieties of sole, halibut
and shiners are found specifically at these depths in winter, though as shown above, these could
be harvested closer to shore at other times of the year (Hart 1988:96, 608, 615). Other soles and
sablefish would be available in moderate depths such as Hecate Strait during spring (Hart
1988:456,610-611). Dogfish are specific to these waters in summer, though as shown above,
they swim closer to shore during the winter (Hart 1988:42). Some fish common to the very
deepest waters migrate north/south, as well as from off-shore to near-shore waters. Petrale
Soles frequent Hecate Strait (moderate waters) and Dixon Entrance (deep waters) in the winter
and spring, but migrate south to Esteban Deep off of central Vancouver Island to spawn (Hart
1988:608). Albacores are also highly migratory between southern and northern off-shore
waters, but are common off the coast throughout British Columbia in the summer months, as are
dogfish (Hart 1988:46,376-378). No species listed are specific to the estuary, but many are
found only in fresh water. These fish would have to be caught in lakes, many of which would
be over a day‟s paddle from GbTo-77.

62
Pacific salmon
Salmon are probably the most versatile fish that live in this area, and are a key ecological
species in the regional ecosystem. Once salmon spawn and die, the nutrients from their
carcasses are absorbed into the soils along river banks for almost a kilometre, encouraging tree
growth and ultimately fostering wildlife (Haggan et al. 2006). Seven species of salmon migrate
from offshore waters to spawn in northern watercourses: sockeyes, cohos, pinks, chums and
chinooks (or springs) cutthroats and steelheads (Fisheries and Oceans Canada 2008, 2009a; Hart
1988:108-130; Hoos 1975). All species of salmon have significant runs on the Skeena River. It
is second only to the Fraser in terms of salmon escapement in British Columbia, but the most
productive traditional fishing areas within the Skeena drainage are within the tributaries (Hoos
1975:79-80).
On the north coast, most Skeena-run, and to a lesser extent at the Nass-run, sockeye
spawn in the late summer and fall (Fisheries and Oceans Canada 2008; Hoos 1975:80).
Sockeyes generally travel very far from the coast before late summer spawning. The Babine
River (see Figure 3-3) is the most productive sockeye salmon river in the Skeena drainage
(Henderson and Graham 1998; Hoos 1975:80). Sockeye salmon are generally abundant once
every four years. In some locations, such as the Fraser River in southern British Columbia, this
leads to “cyclic dominance” (Fisheries and Oceans Canada 2008, 2009a; Hart 1988:121;
Henderson and Graham 1998). Upon emergence from gravels in natal streams, some young
sockeyes go to sea immediately (Hart 1988:120), but many, particularly those in northern river
systems such as the Skeena, spend between one and three years in freshwater nurseries before
heading to the ocean (Fisheries and Oceans Canada 2008; Hart 1988:120; Hoos 1975:80).
Chinooks enter spawning rivers through the spring, summer and fall, but tend to spawn
immediately above the tidal limit (Fisheries and Oceans Canada 2008; Hart 1988:125). There

63
are two main chinook populations that have very different life histories and spawning seasons.
Small coastal river stocks generally return to natal streams in the fall. These fall-run chinook
stocks tend to head to sea within a few days or months after fry emergence and remain in coastal
waters (Fisheries and Oceans Canada 2009a). Spring chinook populations, however, usually
spawn at major river systems, such as the Skeena, in the spring. Spring stocks spend a full year
in freshwater before heading well off-shore (Fisheries and Oceans Canada 2009a). Chinook
salmon return to natal streams on the Skeena River every four to five years (Hoos 1975:81)
Like chinooks, chum salmon spawn in tributaries of the lower Skeena, as well as in the
lower reaches of most coastal streams and rivers in the summer and fall (Fisheries and Oceans
Canada 2009a). According to Hoos (1975:82-83), chum salmon spawn in the Skeena mainstem,
but also in the Ecstall, Kispiox, Lakelse, and Kitsumkalum rivers. Chum salmon leave
freshwater immediately upon fry emergence (Henderson and Graham 1996:14; Fisheries and
Oceans Canada 2009a). Young chum salmon are known to spend late spring and summer in
Inverness Passage, just north of the Skeena River (Hoos 1975:82-83), before moving well off-
shore. Chums spend two to six years in off-shore waters before returning to their natal streams
(Fisheries and Oceans Canada 2009a).
On the Skeena, coho salmon migrate “some distance inland” (Henderson and Graham
1998:14-15) to spawn in smaller tributaries, usually in the late summer/early fall. Coho runs
have been documented on the Babine River, but the main coho channels are lower in the Skeena
drainage and include the Lakelse River and Morice River (Hoos 1975:81-82). Coho salmon that
spawn in northern rivers such as the Skeena spend as much as two to three years in freshwater
before migrating to the sea. Young coho salmon have been found in Inverness Passage and
Chatham Sound (Hoos 1975), and like fall chinook stocks, tend to remain in coastal waters
(Fisheries and Oceans Canada 2009a).

64
Pink salmon are the most prolific salmon in British Columbia. They are relatively
evenly distributed throughout the Skeena drainage but, are most abundant in the Lakelse River
and its tributaries (Hoos 1975:80-81). Pink salmon are also very common in small coastal
streams, rivers and creeks (Fisheries and Oceans Canada 2009a). Pink salmon enter natal
streams in the early fall and generally spawn within or just above the salt water mark (Hart
1988:109; Hoos 1975: 80-81). These salmon are divided into two populations based on a two-
year cycle. In many rivers, pinks are abundant every year, while in other rivers they appear only
every second year (Hart 1988:109-110; Fisheries and Oceans Canada 2009a). Both odd and
even-year pink salmon runs are very large on the Skeena River (Hoos 1975:80-81). These
salmon spend a few days to several months in estuaries prior to moving to the open ocean in
large schools (Fisheries and Oceans Canada 2009a). In the Prince Rupert area, young pinks
have been found in waters along the mainland and western Chatham Sound islands (Hoos 1975:
80-81).
According to Hoos (1975:83-84), the Skeena is the most important steelhead river in the
province of British Columbia. Steelheads prefer to spawn in river mainstems, where oxygen
levels are high and temperatures are cool. Steelheads consist of both winter and summer
populations. Winter steelheads enter spawning streams between November and May. Summer
steelheads migrate to spawning streams between April and October. Spawning, however,
occurs for both groups between January and May. Upon fry emergence, steelhead salmon prefer
coastal waters (Fisheries and Oceans Canada 2009a). Cutthroat salmon are found in most
coastal rivers and streams. Cutthroats spawn for the first time at three or four years of age in the
mid to late winter. Upon fry emergence, cutthroats spend as much as a year in estuaries before
moving to sea. Like steelheads, these salmon prefer coastal waters and rarely travel further
than a few kilometres into the ocean (Fisheries and Oceans Canada 2009a; Hart 1988:128).

65
This review of salmon life histories illustrates that certain varieties of salmon are
common in coastal waters throughout the year. Moreover, salmon spawning occurs in all four
seasons and in a variety of locations. Current salmon migration routes for the Prince Rupert
area show that off-shore salmon move inshore through waters around the Dundas Islands and
other larger coastal islands within the Skeena Estuary (Figure 3-6). These salmon do not appear
to travel through Prince Rupert Harbour itself, but move into the Skeena River or Work Channel
directly from Chatham Sound (Fisheries and Oceans Canada 2010).
Figure 3-6. North coast salmon migration routes in 2004.
Source: Fisheries and Oceans Canada (2010).
There are also smaller salmon populations, particularly of pinks, that must enter the
harbour in order to spawn in smaller harbour streams. According to Fisheries and Oceans
Canada unpublished data for 1934 to 2008 (David Peacock pers.comm.), pink, sockeye,
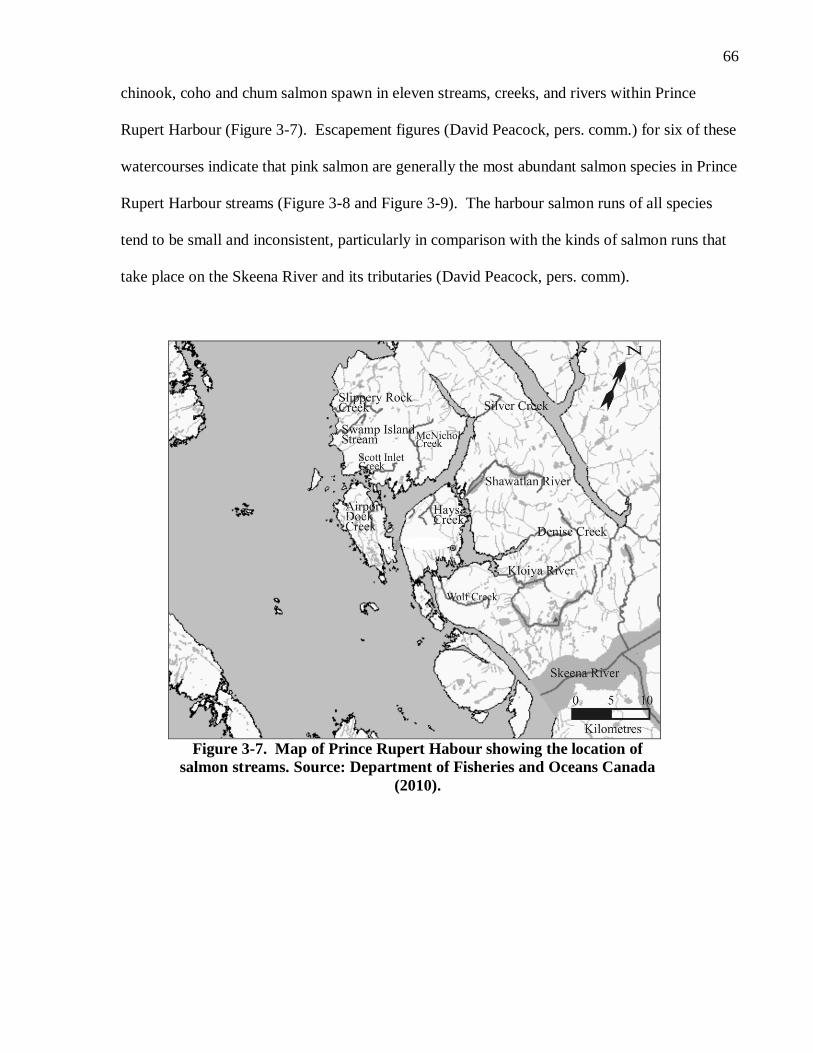
66
chinook, coho and chum salmon spawn in eleven streams, creeks, and rivers within Prince
Rupert Harbour (Figure 3-7). Escapement figures (David Peacock, pers. comm.) for six of these
watercourses indicate that pink salmon are generally the most abundant salmon species in Prince
Rupert Harbour streams (Figure 3-8 and Figure 3-9). The harbour salmon runs of all species
tend to be small and inconsistent, particularly in comparison with the kinds of salmon runs that
take place on the Skeena River and its tributaries (David Peacock, pers. comm).
Figure 3-7. Map of Prince Rupert Habour showing the location of
salmon streams. Source: Department of Fisheries and Oceans Canada
(2010).

67
Figure 3-8. Maximum salmon escapements (1934-2008) for streams within Prince Rupert
Harbour in comparison to two Skeena River tributaries. Source: Department of Fisheries
and Oceans, Prince Rupert office (David Peacock, pers. comm.).
Figure 3-9. Average salmon escapements (1934-2008) for streams within Prince Rupert
Harbour in comparison to two Skeena River tributaries. Source: Department of Fisheries
and Oceans, Prince Rupert office (David Peacock, pers. comm.).
Harvesting salmon
According to Haggan et al. (2006:7) indigenous fisheries across the Northwest Coast
emphasized chum salmon because it is a less oily fish and therefore easier to dry. Tsimshian
ethnographers, however, present disparate views on which species of salmon Tsimshians
0
50000
100000
150000
200000
250000
Denise
Creek
Hays
Creek
Kloyia
River
McNichol
Creek
Shawatlan
River
Silver
Creek
Ecstall
River
Khyex
River
Streams in Prince Rupert Harbour Skeena River
Streams
Esc
ap
em
en
t n
um
bers
SOCKEYE
COHO
PINK
CHUM
CHINOOK
0
5000
10000
15000
20000
25000
Denise
Creek
Hays
Creek
Kloiya
Creek
McNichol
Creek
Shawatlan
Creek
Silver
Creek
Ecsatall
River
Khyex
River
Streams in Prince Rupert Harbour Skeena River
Streams
Esc
ap
em
en
t n
um
bers
SOCKEYE
COHO
PINK
CHUM
CHINOOK

68
prefered. Boas (1916:404) writes that chinook salmon were the most important for storage, but
that Tsimshians also harvested pinks in larger numbers. Garfield (1966:13), however, contends
that Tsimshians concentrated on cohos and sockeyes. She also notes that pinks were stored in
significant numbers for the winter. Boas and Garfield, however, recorded people‟s recollections
of traditional fishing practices in two distinct moments in recent Tsimshian history (the late 19th
century and early 20th century). No doubt Tsimshians engaged in a variety of fishing practices
that emphasized the salmon species that were readily available. Pinks, for example, are the most
abundant of the pacific salmon and, with a lifespan of just two years, have the most prolific runs
on the Skeena. It is not surprising that Tsimshian groups harvested these fish in great numbers.
Coho, sockeye and chum stocks are much smaller. These fish also have longer lifespans than
pinks, ranging from three to seven years, although larger river systems, such as the Skeena, may
have multiple stocks of each species that spawn at different intervals (Fisheries and Oceans
Canada 2009a, 2010; Hoos 1975).
The timing and location of salmon runs were important considerations for Tsimshian
groups of the 19th and 20
th centuries and influenced when groups travelled from the coast to the
interior for salmon and other interior resources. If salmon behaviours were similar in the past
(the recent historic past as well as during the pre-contact period), however, these salmons could
have been fished from a variety of locations throughout the year, including harbour streams and
coastal waters. During the 19th century, Tsimshians caught salmon in large numbers for storage
in rivers and streams using weirs and traps (Boas 1916:400). Weirs acted as barricades, limiting
fish dispersal so that they could be fished from the river using spears and dip nets (see also
Menzies and Butler 2007:449; Nolan 1977:131,140-141). Traps could be used independently or
in conjunction with weirs at river channels. Weirs were also constructed, across narrow
channels on the coast to catch anadromous fish and seals (Boas 1916:400). According to Boas

69
(1916:158-160; 397-398), Tsimshians also used long, wide nets in salmon fishing. Although
Boas is not clear when and where salmon net-fishing took place, there are hints in the story of
The Spider and the Widow‟s Daughter (Boas 1916:158-160) that salmon net-fishing occurred in
the late winter/early spring in coastal waters.
Knowledge of the pre-contact fishery in Prince Rupert Harbour is not well understood.
Few weirs or traps have been identified in the harbour or the Skeena. The best described weirs
in this region come from the upper Skeena region. Prince (2005) recorded as series of fish weirs
on the Kitwancool River in Gitksan territory that range in date from 770 +/-40 BP into the
historic period. By contrast, as of 1998, wooden fish weirs at six sites in southeast Alaska
produced dates of at least 3000 years old (Moss and Erlandson 1998:182-183). The Alaskan
data in conjunction with fish weir data from Vancouver Island (Caldwell 2008) show that weir
technology was not a recent development on the Northwest Coast. A single stone fish trap is
located at the mouth of McNichol Creek. This is in marked contrast to the stone traps located at
the lower reaches of small coastal rivers south of the Skeena estuary and in Portland Inlet to the
north (Lovisek 2007:11; Simonsen 1973). Stone traps are extremely difficult to date, because
they rarely contain organic components (Moss and Erlandson 1998:181). The proximity of the
McNichol Creek stone trap to the pre-contact-period village site GcTo-6 (McNichol Creek)
suggests that fish traps may have been used in the harbour by pre-contact groups.
A very different suite of tools would have been needed if people actively pursued salmon
fishing in coastal environments. Netsinkers have been found at some Middle Period sites
(MacDonald 1969:252) but not all (Coupland et al. 2000). Hooks and barbs, however, are
common at sites that are much earlier (Fladmark et al. 1990:233; MacDonald and Inglis
1981:46; Matson and Coupland 1995:191) and suggest line and spear fishing may predate net-
fishing in this area. It is difficult to demonstrate that these tools were used to harvest salmon,

70
and not other marine fish. Salmon fishing in open waters is certainly possible, but may not be as
predictable or fruitful as riverine fishing. Salmon in open water habitats are more dispersed than
in riverine environments and theoretically would be more difficult to fish in large numbers. As
such, we might expect low proportions of salmon remains in archaeological contexts if salmon
were caught exclusively with barbs and hooks in open waters. Village sites in the harbour that
date between 2000 and 1500 BP, however, are overwhelmingly dominated by salmon remains
(Coupland et al. 2010), suggesting that inhabitants were storing salmon they had likely
harvested in vast quantities, probably at the Skeena River watershed. The extent to which
salmon may also have been fished from coastal streams and rivers in Prince Rupert Harbour is
unclear. While salmon could have been fished from these watercourses, the nearly complete
absence of stone traps and weirs in the harbour suggests that people living in Prince Rupert
Harbour focused on salmon fishing elsewhere. Industrial and urban development in the area,
however, may have obscured evidence for weirs and traps in the harbour.
Invertebrates
Although most beach fronts in the harbour area are gravel bracketed by large schist outcrops in
the upper tidal zone, many have sand or mud bottoms in the lower zones, meaning that there are
a variety of shellfish habitats fronting many village sites, including GbTo-77. Even so, specific
locations in the harbour are known to be highly productive for shellfish. The Lucy Islands is
one such location (Banahan 2007, pers. comm.). In the Broughton Island areas and parts of
Alaska, clam gardens were constructed to intensify clam bed productivity. Gardens have not
been identified in the Prince Rupert area, but Williams (2006) suggests that rock walls along the
low tide mark might represent the remains of clam gardens.

71
Table 3-3 lists the common invertebrate species that are found within the northern
coastal region today. Based on coast-wide habitat information, most of these species would be
common in the semi-protected and protected waters of Prince Rupert Harbour and its environs.
Taxa that favour open coastlines are unlikely to grow in the inner harbour, or even on the
western shore of Digby Island, but might be found along the adjacent, more exposed shorelines
of Dundas Island and Stephens Islands. Each species of shellfish will thrive in specific habitats
that are determined primarily by wave action, substrate type and tidal currents (Ricketts et al.
1985). California mussels, for example, grow well on the exposed rocky shorelines of Haida
Gwaii, while the sandy substrate of North Beach on Graham Island supports numerous clam
species today (Ricketts et al. 1985:218-220; Fisheries and Oceans Canada 2010). Butter clams,
littlenecks, horse clams and bay mussels are all well suited to the protected and semi-protected
waters of Prince Rupert Harbour (Harbo 1997; Quayle 1960; Ricketts et al. 1985: 273-274; 281-
282, 376-379, William 2006:34). Mya and Macoma clam species are found in sandy substrate as
well as dense mud, but prefer the higher ends of the intertidal zone (Moss 1989:109-111).
Horse clams also favour sand and gravel substrates and the lower intertidal zones; they may also
be subtidal (Quayle 1960; Ricketts et al. 1985:376-377). Littlenecks favour gravel or mud
substrates and grow well in the lower half tidal or subtidal zones (Quayle 1960; Ricketts et al.
1985:281-282). Bay mussels, by contrast, can grow on rocky outcrops in protected waters or on
gravel substrates high in the intertidal zone (Quayle 1960; Ricketts et al 1985: 273-274).
Microhabitats, influenced by levels of salinity, temperature and oxygen may
significantly alter the distribution of shellfish coastlines (Claassen 1998:127-131). The presence
of small, freshwater streams, for example, can significantly alter salinity levels and
consequently influence the kinds of shellfish that may be present along shorelines (Moss and
Erlandson 2010). Bay mussels in particular thrive in low-salinity waters influenced by

72
Table 3-3. List of common shellfish taxa for the northern Northwest Coast. This table shows the
shoreline structure and beach habitat for each taxa. Sources: Community Mapping Network
2009.; Cowles 2005a, 2005b, 2005c, 2005d, 2006; Fournier and Dewhirst 1980; Harbo 1997;
Quayle 1960; Ricketts et al. 1985; Strathmann 1987; Thomas 1999; Yagoda 2004
Species Shoreline structure Beach habitat
Molluscs (bivalves)
Butter clam
Saxidomus giganteus
Sheltered Sand/gravel beaches and
bars, but also in areas with
extensive tides
Lower third of tidal range and
subtidal
Pacific Littleneck
Clam
Protothaca staminea
Sheltered gravel/mud beaches Half tide, or subtidal
Bay Mussel
Mytilus trossulus
Rocks or gravel, quiet waters Intertidal
California Mussel
Mytilus californianus
Rocks or gravel, open coastline Intertidal
Horse Clam
Tresus capax
Gravel and sand beaches Lower intertidal to subtidal
Scallop
Chlamys hastata
Gravel and shell sand subtidal
Basket Cockle
Clinocardium nuttalli
Sand or mud beaches Deep water and intertidal
Olympia Oyster
Ostrea conchaphila
Mud or gravel flats Intertidal and subtidal
Giant Rock Scallop
Crassadoma gigantea
Rocky bottoms and boulders Intertidal to sub tidal
Pointed Macoma
Macoma inquinata
Sand or mud High Intertidal to subtidal
Bent-Nose Macoma
Macoma nasuta
Sand or mud High Intertidal to subtidal
Pacific Geoduck
Panopea abrupta
Mud, sand and gravel substrates Lower Intertidal to deep
subtidal
Molluscs (gastropods)
Northern Abalone
Haliotis
kamtschatkana
Semi-protected rocky area Lower intertidal
Periwinkles
Littorina sp.
Sheltered rocky areas with eelgrass
and algae
High to low intertidal
Moonsnails
Naticidae
Protected and semi-protected sand Intertidal to subtidal
Frilled Dogwinkle
Nucella lamellosa
Rocks and crevices on exposed
coastlines
Intertidal to shallow subtidal
Striped Dogwinkle
Nucella emarginata
Semi-protected and exposed rocky
beaches
High intertidal
Ribbed Limpet
Lottia digitalis
Exposed rocky shorelines High intertidal

73
Species Shoreline structure Beach habitat
Plate Limpet
Tectura scutum
Rocky foreshores along protected
coastlines
Intertidal and shallow
subtidal
Dire Whelk
Lirabuccinum dirum
Rocky exposed beaches Intertidal
Dentalia
Antalis pretiosum
Coarse shell-gravel substrate Deep subtidal
Black Katy Chiton
Katharina tunicata
Rocky foreshore on exposed
coastlines
Mid-tidal
Giant Pacific Chiton
Cryptochiton stelleri
Rocky foreshores of semi-
protected coastlines
Intertidal to subtidal
Molluscs (Cephalopoda)
Squids
Cephalopoda
Semi-protected rocky areas Low intertidal
Octopus
Octopoda
Inshore Rocky areas (offshore in
winter)
Shallow subtidal or lower
intertidal
Crustaceans
Shrimps
Pandalidae
Mud substrate subtidal
Dungeness Crab
Cancer magister
Sand or mud and eelgrass Subtidal or lower intertidal
Thatched Barnacle
Semibalanus cariosus
Rocky foreshores of semi-
protected and protected coastlines,
wood
High intertidal
Small Acorn Barnacle
Balanus glandula
Rocky foreshores of semi-
protected and protected coastlines
High intertidal
Giant Acorn Barnacle
Balanus nubilus
Favours exposed piles of wood Middle intertidal to subtidal
Goose Barnacle
Pollicipes polymerus
Rocky foreshore along exposed
shorelines
Upper two-thirds of the
intertidal zone
Echinodermata
Sunflower Star
Pycnopodia
helianthoides
Mud, sand, gravel and rock
substrate
Lower intertidal to deep
subtidal
Purple Sea Urchin
Strongylocentrotus
purpuratus
Semi-protected rocky areas and
sandy substrates
Intertidal and subtidal
Green Sea Urchin
Strongylocentrotus
droebachiensis
Protected rocky and sandy
substrates
Intertidal and subtidal

74
freshwater (Ham 1976; Moss and Erlandson 2010:3360). Barnacles, however, tend to favour
waters with higher salinity. There are two types of barnacles on the Northwest Coast; acorn
(sessile) and goose (pedunculate). Sessile barnacles attach directly to the substrate. Pedunculate
barnacles are stemmed and sometimes attach to floating objects (Cornwall 2010).
Many archaeologists have overlooked the role that barnacles may have played in pre-
contact indigenous economies, perhaps influenced by ethnographers who ignored these shellfish
or dismissed them as starvation food (see Huber and Sommer 2003 and Moss and Erlandson
2010). A variety of barnacle species have been identified (and the results published) within a
handful of archaeological shellfish assemblages. The most commonly identified species are the
small acorn barnacle, the thatched acorn barnacle, giant barnacles and goose barnacles
(Cameron et al. 2008; Fournier and Dewhirst 1980; Huber and Sommer 2003; Moss and
Erlandson 2010; Orchard 2007:270-279). Thatched and small acorn barnacles thrive in
protected and semi-protected coastlines, such as the waters of Prince Rupert Harbour (Ricketts
et al. 1985: 24-25; 223-225, 270-272). Small acorn barnacles, for example, are common in
Dodge Cove today, occurring with bay mussels and whelks (Figure 3-10). Thatched barnacles
prefer moderate oceanic conditions; they can grow in quiet waters, but in microhabitats that
allow them to maximize their exposure to strong tidal currents and wave action. They also
flourish in semi-protected waters, but in these conditions, thatched barnacles are concentrated in
microhabitats that protect them from excessive oceanic conditions (Moss and Erlandson 2010:7;
Ricketts et al. 1985:270-271).

75
Figure 3-10. Small acorn barnacles, bay mussels and whelks at Dodge Cove,
Digby Island.
Butter clams, however, are more versatile than thatched barnacles and mussels in this
respect because they can tolerate a wide range in temperature and salinity. These bivalves
favour sand or gravel substrates and occur in the lower third of the tidal range, but are also
found in sand and gravel bars formed by currents (Quayle 1960; Quayle and Bourne 1972:27;
Ricketts et al. 1985:378-379). Mussels grow in dense patches and can be easily removed en
masse from rock or gravel substrate (Moss 1989:109). Because their growth rate increases if
they are not closely spaced, Moss (1989:111) contends that some mussel patches may have been
semi-cultivated, as has been documented for California mussel on Haida Gwaii and along the
California coast (Ellis and Wilson 1981; McMillan et al. 2008; Whitaker 2008). Chitons
flourish in a variety of habitats, but tend to prefer rocky, exposed or semi-protected shorelines.

76
The Black Katy is most common along British Columbia‟s coasts (Ricketts et al. 1985:242).
They attach firmly to rocks in the low intertidal zone, but can be pried off with a sharp, flat tool.
Red, green and purple sea urchins are generally found in lower intertidal or subtidal waters.
Green sea urchins are the most common sea urchin on the Northwest Coast, favouring protected
waters (Ricketts et al. 1985:286). Purple and red sea urchins thrive in semi-protected and open
coastlines (Ricketts et al. 1985:98-100, 238). Little is written about 19th century Tsimshian use
of sea urchin, but according to Boas (1921:496) Kwakwaka‟wakw groups harvested sea urchins
at low spring tides for their gonads. According to Ellis and Swan (1981:84) elder Manhousat
men preferred to eat sea urchin gonads when they are milky, but it is not clear when this takes
place.
Theoretically, most invertebrate species could be collected year-round from intertidal
and shallow waters. The kinds of tasks involved in shellfishing likely have more in common
with harvesting plants than hunting other fauna (Claassen 1998:177-178). Although season of
availability would likely have been less of a concern with shellfish than with other resources,
most species are better (fatter, tastier) during specific times of the year. The timing and extent
of the tides, as well as the presence or absence of “red tide” would likely have been important
considerations for shellfishers. Red tide is the common name for a highly toxic organism
(Gonyaulax) that inhabits most ocean regions. Under the proper conditions, blooms can occur
making local shellfish poisonous. Some Northwest Coast groups, such as the Coast Salish
removed clam siphons and gills where the poison is stored prior to consumption to mitigate the
effects of paralytic shellfish poisoning (psp) (Batdorf 1990:53). Careful monitoring of water
conditions, however, could also be an effective means of avoiding psp. According to Ellis and
Swan (1981:84) red tide may appear on the west Coast of Vancouver Island in early July
through August, but does not affect the same location each year. It rarely remains in an area for

77
more than one month and in some years red tide does not appear at all. The timing of red tide
may differ slightly in northern waters; it can occur at anytime of year, however, and can change
rapidly (Fisheries and Oceans Canada 2009b).
According to Halpin and Seguin (1990:271), Tsimshians gathered shellfish in the winter
during the contact and post-contact period, with a few exceptions. Closer examination of
ethnographic sources and ecological data however, shows that people may have harvested
shellfish throughout the year, including the spring and summer. Neighbouring Tlingits favour
butter clams from November through the winter, when butter clams are firm and fat (Ellis and
Wilson 1981:xi; Moss 1989:109), although Quayle (1960:11-12) and Suttles (1987b:34) state
that butter clams are best in spring and summer respectively. Daylight low tides also occur in
the spring and summer on the Northwest Coast, which would make butter clams and littlenecks
easier to harvest in warmer months than in the fall and winter (Moss and Erlandson 2010:3359;
Quayle and Bourne 1972:8). Abalone was often gathered at very low tides in the summer
(Garfield 1966:15) and according to Harbo (1995:152), horse clams were also harvested during
the summer months for immediate consumption, and also for storage and trade. Cockles favour
coarse sand beaches and eel grass flats (Quayle 1960:62-63), of which there are plenty in the
immediate vicinity of GbTo-77. While I could find no reference to Tsimshian practices with
regards to the harvesting of these shellfish, Tlingits began collecting cockles in late August
(Moss 1989:109). Indigenous groups across the Northwest Coast ate chitons, including the very
large gumboot chiton (Harbo 1997; Ricketts et al. 1985:103) and they may be eaten year round
(Moss 1989:112).
There is little written about the preference for barnacles in northern areas. Garfield
(1966:13) lists barnacles as a minor resource during the 19th century for people living at Port
Simpson. There are a number of more detailed descriptions of barnacle harvesting from other

78
parts of the Northwest Coast. Nuu-chah-nulth people considered barnacles as delicacies and
harvested thatched and acorn barnacles during the summer (Ellis and Swan 1981:25-26;
Fournier and Dewhirst 1980:95). Manhousat groups also harvested goose barnacles in the
winter (Ellis and Swan 1981:34). Boas (1921:499-505) provides a detailed description of
Kwakwaka‟wakw women harvesting barnacles (species unknown) and preparing them for
feasts. Kwakwaka‟wakw women gathered barnacle encrusted rocks by canoe and transported
them to an adjacent beach, unloaded the rocks with the barnacles still attached and prepared
them for consumption. A large pit was excavated and the barnacle rocks placed inside, where
they were roasted or steamed. Once they were cooked, a woman removed the barnacles (still in
their shells) from the rocks and deposited them in baskets in order to transport them home for
feasting. At the village, the woman‟s husband laid mats out in front of guests and then poured
basket after basket of steamed or roasted barnacles before them. Guests extracted barnacle meat
from the shells using long cedar sticks or cracked shells open using two small cobbles. After the
meal, the host gathered the empty barnacle shells into the mats and disposed of them outside the
house.
Birds
Table 3-4 lists the common bird taxa that currently live in the coastal regions of Prince Rupert,
the adjacent mainland, and in northern off-shore waters. I define five habitats in which birds
can be found. The Shelf break/Pelagic category refers to waters at, and seaward of, the
continental shelf. Off-shore denotes waters between the continental shelf and coastal areas (e.g.
Hecate Strait). Coastal habitats are near-shore, while estuarine environments are specific to the
mouths and lower reaches of rivers. Interior habitats include streams and rivers, riverbanks,
freshwater bogs, lakes and valleys, as well as alpine environments. Many waterfowl use coastal

79
Table 3-4. List of bird species common to traditional Tsimshian territory; their habitats and seasonality. Sources: Dewey and
Potter 2002; Godfrey 1986; Gott 2001; Hejna 2002; Hitztaler 2001; Hoos 1975; Limas 2001; McCollough 2001; Morgan et
al. 1991; Pajerski 2005.
Species Habitat
Shelf break/Pelagic Off-shore Coastal Estuarine Interior
Ducks and Geese
Canada Geese
Branta
canadensis sp.
spring
summer
winter
summer spring
summer
Snow goose
Anser caerulescens
summer
Mallard
Anas platyrhynchos
spring
summer
fall
spring
summer
fall
Common Merganser
Mergus merganser
winter summer
winter
spring
summer
Hooded Merganser
Lophodytes cucullatus
spring
winter
spring
winter
Common Teal
Anas crecca
summer
winter
summer
Harlequin Histrionicus histrionicus
spring winter
spring summer
summer
Northern Pintail
Anas acuta
summer
fall
winter
summer
fall
winter
summer
fall
winter
Greater Scaup
Aythya marila
summer
fall
winter
summer
fall
winter
Common Goldeneye
Bucephala clangula
spring
fall
winter
summer
fall
spring
winter
Barrow‟s Goldeneye
Bucephala islandica
winter winter spring
summer
Bufflehead
Bucephala albeola
summer
fall
winter
summer
fall
winter
summer
fall
winter
Long-tailed duck
Clangula hyemalis
winter
Red-breasted merganser Mergus serrator
winter

80
Species Habitat
Shelf break/Pelagic Off-shore Coastal Estuarine Interior
White-winged Scoter
Melanitta fusca
summer
winter
summer
winter
Black Scoter Melanitta nigra
summer winter
Surf-Scoter
Melanitta perspicillata
summer
winter
summer
Grebes
Colymbidae
spring
winter
spring
summer
Loons
Gaviidae
winter spring
Trumpeter Swan
Cygnus buccinator
winter winter spring
summer
Marsh Birds
Spotted sandpiper
Actitis macularia
spring summer spring
Sandhill Crane
Grus canadensis
spring summer
Black Turnstones
Arenaria melanocephala
winter winter
Rock Sandpipers
Calidris ptilocnemis
winter winter
Dunlin
Calidris alpine
year-round winter
Gulls, Terns, Skimmers. Skuas
Glaucous-winged Gull
Larus glaucescens
spring
fall
winter
fall
summer
Herring Gull
Larus argentatus
summer spring
fall
winter
fall
winter
Mew Gull
Larus canus
year-round
Pomarine Jaeger
Stercorarius pomarinus
summer
fall
Glaucous Gull
Larus hyperboreus
summer
fall winter

81
Species Habitat
Shelf break/Pelagic Off-shore Coastal Estuarine Interior
Sabine‟s Gull
Xema sabini
summer
fall winter
summer
fall
Tufted Puffin
Fratercula cirrhata
summer
winter
winter spring
summer
Horned Puffin
Fratercula corniculata
year-round
Pigeon Guillemot
Cepphus columba
year-round
Marbled Murrelet
Brachyramphus marmoratus
fall winter spring
Rhinocerous Auklet
Cerorhinca monocerata
spring summer
fall
summer
Cassin‟s Auklet
Ptychoramphus aleuticus
spring
summer
fall
spring
Common Murres
Uria aalge
spring summer
fall
fall
Ancient Murelets
Synthliboramphus antiquus
spring
winter
winter
Albatros
Phoebastria sp.
spring
summer
fall
winter
Fork-tailed Storm Petrel Oceanodroma furcata
summer fall
winter
spring
Leach‟s Storm Petrel
Oceanodroma leucorhoa
summer
fall
winter
spring
Raptors
Ospreys Pandion haliaetus
Year-round Year-round Year-round
Peregrine Falcons
Falco peregrinus
spring
summer
fall
spring
summer
fall
spring
summer
fall
Northern Harrier
Circus cyaneus
spring
summer
fall
spring
summer
fall
spring
summer
fall

82
Species Habitat
Shelf break/Pelagic Off-shore Coastal Estuarine Interior
Sharp-shinned Hawk
Accipiter striatus
year-round year-round year-round
Northern Goshawk Accipiter gentilis
year-round year-round
Red-tailed Hawk
Buteo jamaicensis
spring
summer
fall
spring
summer
fall
Golden Eagle
Aquila chrysaetos
year-round (rare) year-round (rare) year-round (rare)
American Kestral
Falco sparverius
year-round year-round year-round
Merlin
Falco columbarius
year-round year-round
Bald Eagle
Haliaeetus leucocephalus
year-round year-round summer
fall
Pheasants, Grouses
Grouses
Bonasa sp.
year-round year-round year-round
Ptarmigans
Lagopus sp.
year-round
Song birds, woodpeckers
Red-breasted Sapsucker
Sphyrapicus ruber
spring
winter
Steller‟s Jay
Cyanocitta stelleri
year-round year-round
Violet-green Swallow
Tachycineta thalassina
spring
summer
fall
spring
summer
fall
Northern Rough-winged
Swallow
Stelgidopteryx serripennis
spring
summer
fall
Tree Swallow Tachycineta bicolor
spring summer
fall
spring summer
fall
Chestnut-backed Chickadee
Parus rufescens
year-round year-round

83
Species Habitat
Shelf break/Pelagic Off-shore Coastal Estuarine Interior
Varied Thrush
Ixoreus naevius
spring
summer fall
spring
summer fall
Water Pipit
Anthus spinoletta
Summer spring
Cedar Waxwing
Bombycilla cedrorum
spring (rare)
Townsend‟s Warbler
Dendroica townsendi
spring
summer
fall
spring
summer
fall
Common Raven
Corvus corax
year-round year-round
Northwestn Crow
Corvus caurinus
year-round
Northern Fulmar
Fulmarus glacialis
spring
summer
fall
summer
Great Blue Heron
Ardea Herodias
spring
summer
spring
summer
Wood Stork
Mycteria americana
rare rare
Waders
Sanderling Calidris sanderlin
summer fall
Western Sandpiper Calidris
mauri
spring
fall
spring
fall
Short-billed Dowitcher
Limnodromus griseus
spring
fall
spring
fall
Long-billed Dowitcher Limnodromus scolopaceus
spring fall
spring fall
Common Snipe
Gallinago gallinago
spring
summer
fall
Red-necked Phalarope
Phalaropus lobatus
summer
fall
Red Phalarope Phalaropus
fulicaria
summer
fall
summer
fall

84
Species Habitat
Shelf break/Pelagic Off-shore Coastal Estuarine Interior
American Black
Oystercatcher Haematopus bachmani
year-round year-round

85
muskeg, lower estuary, and fresh water marshes for breeding, and can be found in the harbour
during the winter months. Swans are found in the interior lakes in the summer, but occur in
coastal areas during the winter months. Others, such as harlequin ducks, mergansers, loons,
grebes and geese, are coastal in winter but spend their springs and summers either at the Skeena
or smaller rivers (Godfrey 1986; Hoos 1975).
Gulls nest on the Skeena delta or on coastal islands (Hoos 1975:119), but spend most of
the time traveling between pelagic, offshore, and coastal environments. Gulls also follow
fishing boats well into coastal waters and are frequent visitors to the inner harbour throughout
the year. Most raptors inhabit coastal, estuarine and interior regions year-round, though some
migrate to more southerly regions during the winter. Ospreys and peregrine falcons are rare in
estuaries, but the western hemlock/western redcedar forests in the area offer abundant roosting
and nesting sites for bald eagles. The bald eagle will also migrate from the interior to the coast
once waters freeze in the interior. Eagles have been observed feeding on spawning herring and
eulachon in the Skeena region (Hoos 1975:120-121). Rhinoceros auklets nest on the Lucy
Islands during the spring and are found in Hecate Strait spring through fall, but overwinter off
the California or Oregon coasts (Bertram et al. 1991:843).
Mammals
Table 3-5 lists the mammals common to Tsimshian territory. The vast majority of these
mammals inhabit coastal and near-coastal areas during the winter months. I have defined seven
habitats that would be relevant for these animals. Pelagic environments refer to waters off the
continental shelf (e.g., west of Haida Gwaii); marine off-shore habitats refer to waters between
the shelf break and coasts (e.g., Hecate Strait); marine coastal refers to waters in and around the
mainland and islands; terrestrial near-coast habitats includes coastal islands and the shoreline

86
Table 3-5. List of common mammal species inhabiting traditional Tsimshian territory showing habitat and seasonality. This includes species that
are presently extinct or rare in the area. Sources: Anderson 2002; Banfield 1974; Fitch et al. 1999; Gozdzik 2001; Hoos 1975; Shefferly and Joly
2000; Steinway 2003. Marine
Pelagic
Marine Off-shore Marine
Coastal
Terrestrial near
coast
Terrestrial within
Skeena watershed
Riverine Terrestrial alpine
Artiodactyls
Sitka Deer
Odocoileus
hemionus sitkensis
mainly fall
winter
mainly fall
winter
spring
summer
Coast deer
Odocoileus
hemionus
columbianus
year-round year-round
American Wapiti
Cervus canadensis
mainly fall
winter
mainly fall
winter
mainly spring/ summer
Caribou Rangifer tarandus
caribou
year-round year-round
Moose
Alces alces
andersoni
year-round year-round
Mountain Goat
Oreamnos
americanus
mainly fall
winter
mainly fall
winter
mainly spring
summer
Mountain Sheep
Ovis canadensis
Fall
Winter
Fall
Winter
spring
summer
Rodents
Red-backed vole
Clethrionomys sp.
year-round year-round
Marmots
Marmota sp.
year-round year-round year-round
Squirrels
Tamiasciurus sp.
year-round year-round year-round
Northern bog
Lemming
Synaptomys borealis
year-round year-round year-round
Vagrant Shrew
Sorex vagrans
year-round year-round year-round
Beaver
Castor canadensis
year-round year-round

87
Marine
Pelagic
Marine Off-shore Marine
Coastal
Terrestrial near
coast
Terrestrial within
Skeena watershed
Riverine Terrestrial alpine
Carnivors
Black Bear Ursus americanus
year-round year-round
Grizzly Bear
Ursus arctos
horribilis
year-round year-round
Red Fox
Vulpes fulva
abietorum
year-round
Wolves
Canis lupus
year-round year-round
Coyotes
Canis latrans
year-round (rare) year-round (rare)
Cougar
Felis concolor
year-round year-round year-round
Mink
Mustela vison
year-round year-round year-round year-round
Marten
Martes americana
year-round year-round year-round
River otter
Lontra canadensis
year-round year-round year-round year-round
Sea otter Enhydra lutris
year-round
Marine
Harbour Seal
Phoca vitulina
richardii
year-round spring
Northern Sea Lion
Eumetopias jubata
winter (rare) year-round spring
Northern fur-seals Callorhinus ursinus
cynocephalus
mainly spring
fall
juvenile: winter adults: spring fall
summer (there are no
rookeries in Prince
Rupert Harbour
currently).
Killer whales
Orcinus orca
summer
Grey whale
Eschrichtius
robustus
spring
fall

88
Marine
Pelagic
Marine Off-shore Marine
Coastal
Terrestrial near
coast
Terrestrial within
Skeena watershed
Riverine Terrestrial alpine
Harbour porpoise
Phocoena phocoena
year-round
Dall‟s porpoise
Phocoenoides dalli
summer summer
.

around Skeena estuary; environments within the Skeena watershed include the valleys in and
around rivers and streams, as well as the surrounding terrain (Terrestrial within Skeena
Watershed and Riverine in Table 3-6); and alpine environments are specific to higher elevations
within Coast Mountains.
Black-tailed deer, black bear, grizzly bear and gray wolf are the most common large land
mammals on the north coast and live within the Prince Rupert/Skeena region year round
(Banner et al. 1991:105). Sitka deer are found on Digby Island today (Hoos 1975:123). In the
1930s and 1940s caribou and wapiti were also common in the Skeena interior (Hoos 1975:123).
Mountain goats and sheep are also common in the Skeena Region. Both animals favour
exposed bedrock habitats in the interior, particularly those with southern exposure. Mountain
goats, in particular, often descend to forested cliffs near sea level in winter (Banner et al.
1991:105; Fitch et al 1999; Godzik 2001). Marine mammals are also common the harbour.
Harbour seals live within coastal waters year round, but “haul out” for breeding in the spring or
fall, or for defence (Bigg 1981). In the Skeena region, harbour seals breed in late summer/ early
fall (Hoos 1975:125). Harbour seals are also known to follow migrating eulachon up the Nass
and Skeena Rivers, and have been found as far inland as Lakelse Lake and Terrace. Northern
sea lions also follow spawning eulachon into the Skeena estuary, but generally remain further
off-shore (Hoos 1975:125).
Ethnographers of the 19th and 20
th centuries noted that Tsimshians hunted all of these
mammals in both coastal and interior locations. Contact period Tsimshian used selective
burning to improve berry habitat and by extension the habitat of animals that frequent open
areas and feed on berries, such as deer (McDonald 2005; Miller 1997:21). According to Suttles,
contact period Northwest Coast groups favoured hunting bucks during the spring and does in the
fall (Suttles 1987b:34). Bears were also best hunted during the fall and least desirable during

90
the spring (Suttles 1987b:34). According to Boas (1916:141,404), mountain goats and sheep
were hunted in the mountains during the winter. Boas (1916:403) records that sea mammals
were hunted from boats using harpoons and that sea lions in particular, were also killed on
shorelines.
The only species listed that might require travel beyond the coastal region are some
species of whale, northern fur seals and coyotes. Whales would be difficult to hunt because they
are large animals that are dangerous to hunt in small boats and tend to migrate through deep
waters such as Hecate Strait or off the continental shelf. Some whales, particularly killer
whales, sometimes travel through coastal waters, often very close to shore. Tsimshians made
use of stranded whales, but there is no record of whale hunts (Boas 1916:404). Nuu-chah-nulth
and Makah are the best known whale hunters on the Northwest Coast (Drucker 1951), but Losey
and Yang (2007) contend that other groups may have hunted whales opportunistically during the
pre-contact period.
The current distribution of some mammals changed dramatically during the late pre-
contact/contact period. Sea otters were common through the Pacific coast during the early
contact period, but pressure from the fur trade brought these animals to near extinction
throughout the Coast (Orchard 2007). Northern fur seals may also have been more readily
available in the pre-contact period. Current fur seal populations do not have breeding areas
outside of California and Pribilof Island, Alaska. Adult female fur seals migrate through Hecate
Strait during the spring and fall and pups follow their parents south through this area during the
winter. The frequency of northern fur seal bones at sites that pre-date 1000 BP, including the
Boardwalk site (GbTo-31) and GbTo-77, suggests that there may have been rookeries in the
area at the time (Gifford-Gonzales et al. 2005; Stewart and Stewart 2001). Although these
animals are difficult to hunt at sea, these remains could alternatively indicate that people were

91
hunting sea mammals in open waters, travelling beyond the current Tsimshian territorial
boundaries, and/or trading with other northern groups for fur seals.
Summary
Knowing when and where specific taxa were available to people living within Prince Rupert
Harbour in the past is key to understanding how households might have been organized to
acquire the resources represented by faunal remains in archaeological assemblages. The
structure of local and regional resources is important because it influences mobility, settlement
and land tenure strategies, all of which are essential to exploring the idea of the House in the
archaeological record. Many resources would have been locally available in the harbour from
the late fall through the early spring. These include virtually all shellfish, most sea mammals,
and many species of fish and birds. Theoretically, all of these species could have been sought
by households or task groups from the village base. We know, however, that camp sites were
used throughout the Holocene in the harbour (Banahan 2005), although as yet we do not
understand how these were incorporated into the economic strategies adopted by people
inhabiting harbour villages. Other resources, such as salmon and eulachon, are regional
resources that would have required travel beyond the harbour at very specific times of year.
This picture of the environment that would have been encountered by the inhabitants of
GbTo-77 is far from complete, but it provides, nonetheless, the groundwork upon which we can
compare faunal remains from house depressions at this site. My primary interest in making such
a comparison is to test the model I presented in chapter 2. If the house depressions at GbTo-77
are the remnants of Houses, then their faunal assemblages should exhibit evidence for
specialization of key resources, particularly of resources that are relatively easily controlled,
such as shellfish and anadromous fish. I pay particular attention to salmon, herring, eulachon

92
and shellfish remains (including barnacle, clam and mussel) in my interpretation of household
and village faunal assemblages precisely because hunter-gatherers often adopt land tenure
strategies with respect to these kinds of resources. They are also the most abundant species at
GbTo-77 and the other sites presented in this study.

Chapter 4. Recent Tsimshian History
There is a long tradition of drawing upon the rich ethnographic descriptions of Northwest Coast
groups to aid in interpreting the archaeological data of Prince Rupert Harbour area (Ames
2005a; Ames and Maschner 1999; Cybulski 1992; Matson and Coupland 1995; McDonald and
Cybulski 2001). Archaeologists‟ use of ethnographic material as interpretive aids relates in
some sense to the idea that an observed relationship between behaviour and material culture at
one time (i.e. the ethnographic period) can help to explain the behaviour behind patterning in
archaeological contexts (Binford 1975, 1977; Trigger 1989:391-395). Many archaeologists
have questioned the relationship between material culture and behaviour (e.g., Hodder 1982),
but this is most problematic in broad, cross-cultural comparisons. By contrast:
[t]he most important regularities are ones that relate to specific historical traditions
and archaeological data pertaining to these traditions appear to be interpreted most
effectively with some variant of the direct historical approach (Trigger 1989:395).
In this context, ethnographic documents can be useful devices for creating hypotheses about the
archaeological record in culturally specific contexts (Roper 1997; Trigger 1989:391-395).
There are, however, certain qualifications that must be addressed in order to use this material
judiciously and not simply as a template for direct analogy in the reading of archaeological
material.
The wealth of information about 19th
century life recorded in ethnographic documents
for the Northwest Coast in general, and the Tsimshian in particular, is impressive and contrasts
sharply with the poor preservation of many organic materials (in particular wood and basketry)
at many archaeological sites along the coast. By the 19th
century, however, indigenous groups

94
had become full participants in the world economy through the fur trade and had incorporated
European elements into their society (Coupland et al. 2001; Martindale 1999, 2003; Norton
1985; Prince 1998). Although changes brought about during the contact period were profound,
fundamental aspects of Tsimshian social and economic organization are undoubtedly rooted in
earlier times (Archer 2001; Coupland et al. 2003; Martindale and Marsden 2003).
Archaeology is well-suited to address the questions surrounding the temporal depth of
many aspects of Tsimshian culture. Marshall (2006) and Ames (2006) for example, contend
that emphasis on the House as the basic unit of social and economic organization has very
ancient origins on the coast. Considerable evidence suggests, however, that the ethnographic
pattern of large summer villages on the Skeena River developed in response to contact with
Europeans and Tsimshian integration into the fur trade (Martindale 1999:197-198). Prior to the
contact period, small groups, often represented by pairs of house depressions, established
themselves on the Skeena‟s tributaries (Martindale 1999:181-186).
Use of ethnographic records can also create a normative view of culture within a specific
period of time, leading to the generalized descriptions of life that pervade the ethnographic
literature (See Ames and Maschner 1999:41; Losey and Yang 2007; Martindale 1999:93-95;
Moss 1993 for further discussion). This is potentially problematic, especially if we want to look
for and ask questions related to specific events in the ancient past (e.g. Pauketat 2007; Roper
2007). Moreover,“[t]he danger is that by relying on “average” or “typical” conditions, we may
be basing our ideas on cultures or circumstances that either never existed, or which are not
really relevant to what we want to understand” (Ames and Maschner 1999:41). Careful study of
ethnographies and historical documents illustrates how differently groups and individuals acted
within the structure of “Tsimshian Society” (e.g. Martindale 1999; Mitchell 1981). This
variability is the result of how individuals and groups responded to historically specific

95
circumstances. Not all Tsimshian groups traveled between the coast and the Skeena, not all
villages were arranged according to the same principles, and not all people built their houses in
the same way.
Ethnographic and historic period documents are also flawed and incomplete. They
record the experiences of particular members of any given society, in the Tsimshian case,
emphasizing high ranking men (for further discussion, see Deur and Turner 2005a; Norton
1985). These experiences are also filtered through the observer‟s theoretical or ideological
preconceptions. This is clearly demonstrated in the ethnographies written by Boas and his
students which consistently ignored information about plant and shellfish management strategies
in order to contradict the prevailing evolutionary paradigm (Deur and Turner 2005b; Moss
1993).
What follows is a brief summary of 19th-and 20
th-century Tsimshian society, as well as a
discussion of what is known about the ancient past through oral records. This is far from a
complete history and I emphasize in particular those aspects pertinent to my thesis, such as
Tsimshian social organization, in particular the House, or wa’lp, settlement and seasonality.
Territory
The homeland of the Tsimshian people consists of the region in and around the Skeena and Nass
river systems (Figure 4-1). It is bounded to the north by Tlingit and Athapascan groups, to the
east by Carriers, to the south by Haislas and Haihais and the west by the Haida (Seguin 1993).
Interactions between these groups, and migrations across the entire northern area, are recorded
in Tsimshian oral records (specifically, the adawx) and in written historical accounts (Marsden
2000; Martindale and Marsden 2003). The Tsimshian consist of four closely related linguistic

96
groups; Nisga‟a traditional territory is centred around the Nass River, Gitksan, on the upper
Skeena above Kitselas Canyon; the Coast Tsimshian [also called the Northern (Coupland et al.
Figure 4-1. Map of traditional Tsimshian territory, showing the four closely related
groups that compose the Tsimshian, as well as neighbouring indigenous groups. Shown
also are the locations of contemporary Tsimshian communities.

97
2001:226) or Metlakatla (Garfield 1966) Tsimshian] on the lower Skeena, adjacent coastal
islands and mainland area, and the Southern Tsimshian south of the Skeena on coastal islands
and mainland. The Tsimshian have rarely acted as a political or economic unit, though the
Coast Tsimshian in particular sometimes forged alliances at their winter villages (Seguin
1993:x). Coast Tsimshian and Southern Tsimshian speak slightly different dialects of
Sm’algyak (the Tsimshian language), but are culturally very similar (Garfield 1966:5-6; Halpin
and Seguin 1990; Miller 1997:16-21; Roth 2008:16-18; Seguin 1993). More pronounced
differences are apparent between Coastal groups and the Nisga‟a and Gitksan. Nisga‟a and
Gitksan speak very closely related dialects of Sm’algyak and can easily understand “Tsimshian
proper” (Dorsey 1897). Sm’algyak speakers however, have difficulty understanding Nisga‟a
and Gitksan dialects. Ethnographies concerning these groups are most frequently cited by
archaeologists working within Prince Rupert Harbour and the surrounding area. Following
Martindale (1999) and others, I use the term “Tsimshian” to refer mostly to the Coastal and
Southern Tsimshian tribes and “Nisga‟a” and “Gitksan” to refer specifically to those groups.
Each village (or tribe) was an independent territorial, economic, and political body, but
Tsimshian society is best understood from the perspective of the House, the groupings of which
form the real “nations” of this region (Roth 2008:162). Prior to the establishment of Canadian
property laws in the late 19th
/early 20th
centuries (McDonald 1983:9), House ownership
provided Tsimshians with exclusive rights to exploit specific and geographically defined
regions. House properties were listed at an installation potlatch of a new House chief who had
the authority to designate certain areas as exclusive and to pass them on as private property to
successors. These were theoretically inalienable, although House groups could take property
from others by force and could claim locations that others had simply failed to use (Garfield

98
1966:14; Mitchell and Donald 2001). These titles to property and wealth were linked to specific
names contained within particular Houses. The history of how territories were acquired was
recorded within the adawx and codified within painted house fronts and crest poles. These
claims were validated at potlatches, where House-specific histories were recounted as a way of
securing control of these locations (Marsden 2000; Roth 2008).
Social Organization
Tsimshian social organization was complex, multifaceted and embedded within all aspects of
traditional Tsimshian settlement, subsistence and ownership. Our conception of Tsimshian
society is complicated by a rather fluid use of terms by scholars in the field to describe these
social relationships. Tsimshians identified with six interconnected social relationships: families,
lineages (Houses, or wa’lp), House groups, (macro-matrilineages, or wilnaat’aał), villages
(local groups, tribes, or ts!ap), clans (crests or pte’x) and phratries (Garfield 1966; Miller 1997;
Roth 2008; Seguin 1993).
Phratries and Clans
The Phratry was and remains the broadest, and in many ways least well-defined, affiliation of
every Tsimshian person. Two Tsimshian phratries were composed of “friend” clans (Seguin
1993:x). Members of the same phratry might provide mutual protection for or share with each
other, but historically, there were few social or political obligations between members of the
same phratry (McDonald 1983:7). Tsimshian phratries were integrated into the wider north
coast system of social organization and are consistent with the Haida and Tlingit moieties
(Miller 1997:54-55). Like the Houses that ultimately composed them, members of each phratry
could trace their descent partly from within Tsimshian territory and partly from migrations of

99
outside groups, mostly Tlingits and Haidas (Garfield 1966:20). Although some scholars use the
term phratry and clan almost interchangeably (Miller 1997; Seguin 1993), Garfield highlights an
important distinction:
Phratries had no important function other than the regulation of spouse selection.
These were essentially loose federations of clans, which were the named
subdivisions of phratries. Each clan included people who shared legends, a history
of common ancestors, and many crests, properties and privileges. The members of
some clans within a phratry had little in common with other clans of the same
phratry except for the fact that they could not intermarry. (Garfield 1966:20;
emphasis mine).
The clans, or crests, that composed each phratry were the Laxkipú (wolf), Laxskí’k (eagle),
Kispuwutwáta (untranslatable but represented by the blackfish crest or fireweed among the
Gitksan) and Qanháta (untranslatable but represented by the raven crest or frog among the
Nisga‟a) (Boas 1916:480; Garfield 1966:19-20; Halpin and Seguin 1990:274). Unlike other
northern groups, the Tsimshian ranked these crests, some of which were specific to royalty
(Miller 1997:54-55).
The Village or Ts!ap
The post-contact period village was not organized by clan; people from all four crests lived
within the same community (Allaire 1993:82-83). Older villages had been divided into sides so
that members of opposing crests, or phratries, were situated at opposite ends of the village
(Miller 1997:54-55). In the contact and post-contact period, Tsimshians constructed linear
villages along narrow beaches or river banks, though additional rows could be added if space
permitted (Boas 1916:394-395). The Tsimshian selected locations that were well-drained and
relatively flat. Easy access by canoe was also a factor (Garfield 1966:10).
The Tsimshian village is often considered interchangeable with the notion of “tribe”
(Boas 1916) or “local group” (Coupland et al. 2001; Martindale 1999:112). Although

100
Tsimshian tribes took their names from the location of their summer resource territories, it is the
structure of the winter village that most closely relates to the “tribes” or “local groups”
documented by Boas (1916), Barbeau (1917), Dorsey (1897) and others. The tribes were, and
are today, relatively autonomous. The Kitselas and Kitsumkalum speak Sm’algyak, but consider
themselves to be culturally closer to the Gitksan. Neither tribe currently considers themselves a
part of the Tsimshian nation (Martindale 1999:100-103).
The Southern Tsimshian consisted of three villages, each with a winter and summer
village located on the coastal mainland and islands south of the Skeena River. These tribes in
particular formed strong relations with non-Tsimshian groups to the south. The Kitasoo and
Kitkatla in particular, reportedly formed alliances with Heiltsuk (Boas 1916; Dorsey 1897;
Marsden 2000:23). The Gitksan and two Coast Tsimshian tribes (the Kitselas and
Kitsumkalum) have summer and winter territories along the Skeena and its tributaries at or
above Kitselas Canyon.
Upon the arrival of the first European maritime traders in the late 18th century, the ten
tribes of the Coast Tsimshian lived in closely clustered winter villages along Metlakatla Pass
(Coupand et al. 2001; Garfield 1966; Miller 1997). Lands were held in common at winter
villages and along the lower Nass River (Boas 1916:399-401), but each tribe also held critical
summer village locations along the lower Skeena River and these, as discussed below, were
ultimately owned by Houses. Villages, as the on-the-ground representation of the local group or
tribe, could be relatively short-lived; the Houses that composed them could change and
consequently, village organization was very flexible. This stood in contrast to more stable
elements of Tsimshian society, in particular the lineage, or House. Old villages were
periodically abandoned and new ones established (Allaire 1993), but it is not clear from the
information at hand how this might have affected tribal affiliations, or the distribution of House-

101
owned properties within tribal territories. As Allaire (1993:83) wrote, “This situation of
instability must have also conflicted with the economic importance of territorial integrity”.
Table 4-1 lists the names and locations of the tribes speaking “Tsimshian proper”
documented in the late 19th century (Dorsey 1897). Tsimshian settlement and subsistence
practices changed dramatically through the course of the 19th century. The establishment of
Hudson‟s Bay posts, missions, and canneries, and the rapid decline in population due to the
introduction of European diseases, changed Tsimshians‟ livelihoods and altered social relations.
Many Houses moved from the Metlakatla Pass villages to the trading post at Fort Simpson in
1831, and later to Port Simpson (Lax Kw‟alaams) at the mouth of the Nass River. A large
migration occurred again when some Houses moved from Lax Kw‟alaams to a utopian Christian
community at Metlakatla under the direction of William Duncan. He later moved with many
Metlakatlans to southern Alaska. Some of these people returned to Old Metlakatla in later
years, but the descendants of many still live in New Metlakatla, Alaska. Currently, the Coast
and Southern Tsimshian population is centered at Lax Kw‟alaams, Metlakatla, Kitkatla,
Kitsumkalum, Kitselas, Klemtu and Hartley Bay, along with Port Essington and the city of
Prince Rupert (Coupland et al. 2001; Inglis et al. 1990; Roth 2008:20-21).
The winter village was an important forum of social interaction for Tsimshian groups.
Villages were organized according to the ranking of the Houses, or wa’lp within them. Among
the Tsimshian, as with many other northern groups, the highest-ranking Houses were situated in
the centre of the front row of houses (Vastokas 1966:102). At Kitselas, however, each phratry
occupied a separate row with the chief‟s house at one end and houses situated in descending
order from there (Martindale 1999:122), not unlike the organization of many 19th
-century Haida
villages (Blackman 1990:241).
Although Houses were autonomous, the head of the highest-ranked House acted as a

102
Table 4-1. Location of Coast and Southern Tsimshian tribes‟ summer and winter villages as
documented in late 19th century ethnographic sources and oral records. Sources: Campbell
1993:4; Coupland et al. 2001; Dorsey 1897; Halpin and Seguin 1990:267; MacDonald et
al.1987; Marsden 2000; Martindale 1999:103; McDonald 1983; Miller 1997:xvii.
Tribe Name Summer Village Location Winter Village Location
Kitselas Kitselas Canyon, Skeena
River
Kitselas Canyon, Skeena
River
Kitsumkalum Kitsumkalum River area Kitsumkalum River area
Kitkatla Coastal islands, such as
Porcher Island, around the
mouth of the Skeena River
Kitkatla
Kitkiata Douglas Channel, Whale
Channel, Wright Sound and
Lewis Pass to Camaano
Sound
Kitiata Inlet
Kitasoo Northwest Millbank Sound Kitasoo Bay
Gitsees Khutzeymateen River, Khyex
River , lower Skeena
Metlakatla Pass (Venn
Passage)
Gitzaxlaal Ecstall River, lower Skeena North Shore of Digby Island
Gitwylgiots Mid Skeena River and
Stephens Island
Tsimpsean Peninsula,
Metlakatla Pass (Venn
Passage)
Ginaxangiik Exchamsiks River North of Dodge Cove, north-
east shore of Digby Island
Gitando Mid Skeena River South shore Tsimpsean
Peninsula
Gitlan Zimacord River Shkgeaum Bay, northeast
shore Digby Island
Gispaxlo‟ats Zimacord River Robson Point, Metlakatla Pass
(Venn Passage)
Gilutsau Mid Skeena River Dundas Point, Digby Island
Gitandoiks Gitandoiks River Dundas Point, Digby Island
village leader or chief. These chiefs received tribute from everyone in the village and their
families were enormously privileged (Garfield 1966:33). Village chiefs were also ranked, but
there is no indication that this was accompanied by regional political authority until the post-
contact period, when multi-village chiefs developed (Allaire 1993:92; Martindale 2001:127,
2003).

103
Wa’lp and Wilnaat’aał
Among the Tsimshian there is no anonymous public sphere, no radically
individuated domestic sphere, no domain of important traditional knowledge or
action that is not rooted in the unitary perspective of one house lineage and that does
not project its power and identity outward to other lineage estates in the society. But
these rights are rooted not in individuals, legal personae (Mauss 1985), but in lineage
collectivities. One might call Tsimshian society lineage-centric. Any significant
social action is carried out under the aegis of some house lineage, and any social
knowledge of real consequences has to be articulated and understood as the property
and exclusive business of some lineage estate (Roth 2008:162).
As this excerpt indicates, the House, or wa’lp is the most important social relationship
for the Tsimshian. As discussed in Chapter 1, the wa’lp is a complex idea that incorporates both
corporeal and cosmological things and relations. The term wa’lp is synonymous in Sm’algyak
for the physical dwelling and its comprising household (Halpin and Seguin 1990) and in fact,
domestic structures are symbolic of all other facets of the wa’lp (Seguin 1993). These Houses
are thought of as containers, or boxes, that hold names and properties, crests, songs and dances,
as well as their members and their wealth (Garfield 1966:22-23; Miller 1997:45-55; Neylan
2002:169; Seguin 1993). Seguin (1993:112) wrote that “[t]he image of the matrilineage is that
of a house, which is a container motif, like the box which contains preserved food, wealth, or
both.” The metaphor of the box also extends to all aspects of the wa’lp. Ranked titles are the
true members of the wa’lp and “contained” the individuals that held them at any given time
(Neylan 2002:169; Seguin 1993). Resource territories were contained within the wa’lp and
these also contained the resources needed to sustain household members and to produce wealth
(Allaire 1993; Coupland et al. 2001; McDonald 2005:242-243; Miller 1997:52; Seguin 1993).
House lands are also thought of as storage boxes, to be opened up “just like a trunk” (McDonald
2005:243). The concept of the container as a symbol for the House is specific to North coast
groups and in particular the Tsimshian (Seguin 1993). The idea of the House as container is

104
absent among southern groups (Boas 1889:20), such as the Coast Salish, and intriguingly these
groups stored food and goods in house lofts, not boxes.
The histories of Houses are documented in the adawx. These oral records tell of the
origins of Houses among the Tlingit and Athapascan groups and their integration into
preexisting Tsimshian peoples through marriage and warfare (Dunn 1993; Marsden 2000). The
adawx are discussed further in chapter 5.
Wa’lp membership consisted of names, which were taken, or put on by the people
inhabiting them (Roth 2008). Those of noble descent, title holders or Real Persons (Sm’oigyet),
held high-ranking names that they acquired through matrilineal inheritance. Sm’oigyet regulated
interactions between groups of people, but also between the human and non-human world. The
Tsimshian considered the worlds of non-human animals, the sky and underwater as Houses
much like their own and sm’oigyet in full regalia could access these worlds during ceremonies
(Miller 1997:52-53).
The core of the household included the name-holder (usually male) and his wife and
children, widowed or divorced sisters and their children, unmarried brothers, and nephews
among others (Miller 1997:50-55). Wa’lp members could and often did occupy more than one
dwelling, sometimes within different villages (Garfield 1939:174). Garfield (1939:174)
contends, however, that this was a recent development and that earlier Houses generally
contained all their members. Houses fluctuated greatly in size and productivity. Houses that
were too large could split in two. If membership was too low to support an individual wa’lp, the
House could adopt members from related houses (Roth 2008:77-78). Lineage members all
participated in the construction of their house and as such, all could live there if they so chose
(Miller 1997: 50-52).

105
Each Tsimshian person was born a member of their mother‟s House (Garfield 1966:23),
but opportunities existed for individuals to move between houses, or to benefit from the wealth
and estates of more than one House. Adoption between House-groups was not uncommon
(Boas 1916:500; Roth 2008; Seguin 1993:114) and at marriage, women lived with their
husbands, in a dwelling belonging to his House (Garfield 1966:23). A woman maintained the
right to use resources belonging to her House (Fiske 1991:514-515), but gathered most of what
she needed for her family from her husband‟s lands (Garfield 1966:17). She could, however,
contribute to her own House, particularly in preparation for feasting (Fiske 1991:515; Garfield
1966:17). Boys resided in dwellings owned by their father‟s Houses until adolescence, at which
point they often moved to the house and House of their maternal uncle. According to Garfield
(1966:17), boys and men could continue to use the estates of their father‟s House while he was
alive. At a father‟s death, his sons could continue to use these lands with permission from the
head of the father‟s House. Much like their mothers, girls lived in and worked primarily for the
Houses of which they were not members (i.e their father‟s and husband‟s Houses). However,
girls had rights to their own House‟s property and in that sense maintained a level of economic
independence (Fiske 1991).
These attributes of Tsimshian social organization indicate that residence and access to
owned resource territories could be flexible, at least for high-ranking Houses. Tsimshians used
cross-cousin marriage, however, to keep property and wealth within a very few high-ranking
Houses (Anderson and Blumhagen 1994:90; Dunn 1984:54). As Garfield (1996:23) wrote,
“[c]ousin marriage bound the two lineages in ties of affection, consolidated hereditary property
and extended the privileges of use of resources.” As commoners did not hold titles, they would
not have been considered part of the wa’lp in the way that elites were. They did, however,

106
benefit from being a part of high-status Houses, in terms of having access to both sufficient
provisions and protection (Miller 1997:51; Seguin 1993:xiii).
The physical structure of the house, or its architecture, is discussed in detail in chapter 7.
Briefly, post-contact Tsimshian houses were square, post-and-beam constructions. On steep
banks, houses might be supported at the front by a foundation of cedar trees (Boas 1916:48;
Vastokas 1966:83-85). Most houses had a large central hearth, but some also had smaller
family hearths in the corners of the central floor area (Boas 1889:35). Wide benches ran along
the inside walls of the house. The house interior was divided according to the rank of its
inhabitants. Families lived in carefully allocated places on wide benches along the inside of the
house walls or in small rooms. The individual families within each House were allocated space
according to rank. Status within the House was graded from back to front and centre to sides.
Boas (1916:395) writes that slaves and lower-class people slept near the door. Commoners had
spaces along the sides of the house and important families were located at the back behind the
central fire. This gave elites access to a special room behind a screen where the wa’lp heirlooms
and art were kept (Garfield 1966:11; Halpin and Seguin 1990; Miller 1997:45-47).
Children sometime slept on platforms or shelves, under the roof. Cedar mats were
sometimes used to divide these family spaces. Storage was in boxes on benches, under benches
or on shelves suspended from the rafters (Boas 1889:35, 1916:48, 395; Halpin and Seguin 1990;
Miller 1997:47). Some houses had an excavated central floor area that created the effect of a
series of benches. A house constructed by a Kitasoo chief is reputed to have had ten levels
along the sides (Miller 1997:45-46). This provided additional warmth in winter, but could also
shelter the large numbers of people needed to maintain and perhaps augment the wealth and
prestige of the wa’lp.

107
According to Miller (1997:52-53), Tsimshian dwellings were simultaneously a
microcosm of the universe, representative of the body and the embodiment of the ancestral
matriclan; the central hearth and its flame represented human intellect, but also the sun,
providing heat to inhabitants the way the sun warms the universe. The four support posts were
conceptualized as limbs, the ridge pole as the backbone, rafters as ribs and the walls as skin.
House fronts were decorated and thought of as the face of the house, while secret passageways
at the rear were the intestines. These distinctly corporeal symbols are perhaps idealized; the
only known drawing of a Tsimshian roofing structure (Boas 1916:47) does not show a central
ridge pole, though Emmons (1916) describes a central ridge pole in a Kitselas house.
According to Roth (2008:36, 86-87, 179) the wilnaat’aał is an important, but complex
set of relationships between Houses that cross-cuts larger forms of organization, such as the
village. Wilnaat’aał are important components of contemporary Tsimshian society, but seem to
have a deep history that extends into the past, though how far into the past is not known.
Wilnaat’aał are networks of related Houses; these groups have a shared ancestry and often hold
some very old narratives concerning their collective origins. Although ties between Houses
within wilnaat’aał may be distant kin, members are unlikely to have much direct contact with
each other, and in fact may be unknown to each other. Currently, a single wilnaat’aał may live
together within the same tribe, or individual Houses may be spread throughout a number of
tribes. The relationships between Houses within wilnaat’aał are an important means by which
declining Houses are able to bring new members in through adoption. This ensures that new
members are already privy to the historical knowledge pertaining to the adoptive House.
108
Class, Rank and Gender
According to Miller (1997:17), Tsimshian society in the 18th, 19
th and 20
th centuries was
organized by class (slaves, commoners, nobility and royalty), and this circumscribed all
interpersonal relations. Royalty developed late in the 19th
century after the winter villages at
Metlakatla were abandoned and communities were established near trading posts and missions
(Miller 1997:17). Traditionally, Sm’oigyet, or Real People, were the principal owners of wealth.
Women were central to how title and resources were inherited because successors were chosen
from eldest sisters‟ sons. Sons of younger sisters and daughters generally did not inherit high-
ranking names and wealth, which meant that wealth and title were concentrated in the hands of
the wa’lp leaders and their heirs. This “class” manipulated property and valuable resources,
directed food production and other work, and controlled major distribution of goods. Garfield
noted (1966:26-28) that the head of the highest-ranking House (generally male) acted as a tribal
chief and received tribute from all tribal members. Tribal chiefs and the members of his
household were especially privileged. There is some indication that this kind of political power
was a relatively recent development in this area of the Northwest Coast that occurred in
conjunction with the fur trade (Martindale 1999; 2006).
Those who did not hold ranked names associated with territories could join one of
several Houses to which they were related in various ways. Commoners, or the poor, are
described as “those without origin” (Garfield 1966:29) and they ranked just above slaves.
Houses needed their labour in order to manage their territories effectively and, in particular, to
process sufficient stores of food for the winter. The relationship was mutually beneficial as
commoners received protection, food and shelter in return (Seguin 1993: xiii).
Many elite Tsimshian during the early contact-period were also slave owners. They could
buy slaves or acquired them by raiding neighbouring groups or even other Tsimshian towns.

109
People lost all social affiliations once enslaved. Enslaved men fished, loaded and unloaded
canoes, and built canoes and houses, while women slaves prepared fish and other foods
(Garfield 1966:29). There has been some disagreement on this last point. Some have argued
that slaves were of no economic value, but were held only for prestige (Drucker 1939). Garfield
(1966:30), however, contends that:
[p]oints of view such as these can be accounted for only because of the absence of
adequate field descriptions of the role and status of slaves and the ethnographers‟
disregard of the productive work of slaves. Slaves worked with family members
and not at tasks exclusively reserved for them and what they produced was pooled
as part of the families‟ stores of goods….The economic role of slave labour must
have been very important, apart from the undoubted prestige accruing to their
owners. Ten to twenty slaves are reported as belonging to each of the nine tribal
chiefs of Port Simpson in the middle nineteenth century. Each of approximately
fifty Port Simpson lineage heads is also reported to have owned from two to as
many as ten slaves. These slaves certainly did much more than earn their
subsistence or give prestige to their owners.
Labour, whether voluntary or not, was essential to the production of stored surpluses,
particularly surplus that extended beyond seasonal needs. Women‟s roles as holders of the
lineage and processors of game into stored resources were important elements in defining their
status. Women‟s labour was a primary means by which wealth was achieved. While a few
people (mostly men) might be required to fish, large numbers of women were needed to process
the catch into storable goods (Ames 2001; Donald 1997:134). Ames (2001) and Donald (1997)
have argued that the task of converting salmon in particular into stored resources was a driving
force behind slavery and warfare in this area. While female kin could be persuaded to provide
labour for their lineage, people from neighbouring groups and sometimes even other Tsimshian
villages were also enslaved to perform food processing and other activities. Slaves of either
gender could perform men‟s or women‟s work, but the Tsimshian specifically favoured women
as slaves (Donald 1997:135). Put another way, women‟s labour was central to the maintenance
of surplus and prestige, and was controlled in this way through slavery and the class system.

110
While some anthropologists have argued that overall social inequality has a direct impact
on the status of women within a society (Kent 1991), class seems to have been as important an
identity as gender among Tsimshian. It was not unusual for high-status women to hold
positions of power and the wealth accumulated through slavery benefited them in the same way
as their male counterparts. High-status women were not restricted from the public sphere (they
occasionally steered war canoes, traded and met with European ships (Fiske 1991: 513-514;
Galois 2004:46). Accordingly, inequality between elite women and men seems to have been
less severe than between elite women and slave women, as the lives of slave women were very
carefully controlled.
The Tsimshian Economy
The Seasonal Round
As discussed earlier, the Tsimshian structured their economic activities around their House-
owned resource territories, with particular emphasis on winter villages along Venn Passage in
the harbour and summer villages in the Skeena watershed. The kind of settlement and
subsistence pattern that incorporated these important locations also included smaller hunting,
fishing and collecting locations that were again owned by Houses and held in trust by House
leaders.
Feasting and other ceremonies tended to occur during the winter, when few economic
activities could take place. Some hunting was undertaken, but mostly people spent time in their
permanent villages, living off stores of salmon, berries and other plant foods caught or collected
in summer and fall, as well as shellfish, some dried from summer harvests and some collected
and eaten fresh. When stores were exhausted, starvation was apparently not uncommon (Boas
1916:399). Resources collected from beach fronts in the vicinity of the winter village, mitigated

111
hunger (Halpin and Seguin 1990:271; Miller 1997:23). Salmon could be fished using traps and
weirs along the coast to catch fish and seals (Boas 1916:399-401).
In late winter/early spring, Nisga‟a and Coast Tsimshian tribes moved to beach fronts on
the lower reaches of the Nass River for the eulachon fishery. It is not clear whether tribal (or
village) leaders orchestrated the move from the harbour to the Nass or whether Houses made the
decision to move to the eulachon grounds independently. There is also contradictory evidence
regarding the nature of land ownership at the Nass. Miller (1997:21) indicates that the beaches
at the Nass were owned in common by all Tsimshians. Mitchell and Donald (2001:30)
however, wrote that many Houses owned specific locations on the Nass beach front. Haida and
Tlingits came to the Nass to trade with Tsimshians and Nisga‟as for eulachon oil, but some
“extra-territorial” groups also managed to gain access to fishing rights at the Nass (Mitchell and
Donald 2001:31). Some access was garnered through marriage and other alliances between
owning Tsimahians and outsiders. In other instances, Tsimshians tolerated a degree of incursion
from outsiders simply because the cost of excluding them, through violence and warfare, was
too high at a time when large numbers of people were needed to fish and harvest eulachon
(Mitchell and Donald 2001: 31). Moreover, it would have been difficult for those with rights to
actively exclude those without because eulachon, unlike salmon, spawn across a wide beach
front and would have proved difficult to “fence in” (Mitchell and Donald 2001: 31).
Men generally caught eulachon in the same way as herring, by using rakes. Women
processed the eulachon catch by drying some, but most were boiled in large quantities and
rendered into grease. This grease was one of the Tsimshians‟ most valued resources and was
used to preserve foods and as a condiment. Halibut dipped in eulachon oil, for example, was an
important winter food. The oil was stored in the winter village for later consumption or for

112
trade with inland Tsimshian tribes or Haidas and Tlingits (Boas 1889:35, 1916:44; Garfield
1966:15; Miller 1997:21; Mitchell 1981).
After eulachon fishing, people returned to the Metlakatla villages. Late Spring was
spent storing and drying seaweed collected from owned locations. Seaweed may have provided
the largest amount of plant food, other than perhaps berries, for Coast Tsimshians and was,
along with shellfish, an important barter item for women (Garfield 1966:13; McDonald
2005:252; Miller 1997:21). Herring also spawn in the spring in the shallow coastal waters
throughout the harbour; both fish and roe were collected (Miller 1997:21).
By the late spring, the salmon begin their runs through the Skeena watershed. At this
time, people moved to summer villages along the Skeena River (Miller 1997:21-22).
Martindale (1999) has shown that large summer villages along the Skeena likely developed in
response to the fur trade. Interestingly, many ethnographers present a very different interior
settlement pattern, one that may reflect the pre-contact use of this area (Boas 1916:399-401;
Garfield 1966:15-16; Halpin and Seguin 1990:270-271). These authors write that tribal groups
split into House-owned fishing camps for the salmon fishing season, suggesting that
“traditional” (i.e. pre-contact period) summer settlement patterns were not organized by villages,
but by Houses. In this scenario, each wa’lp headed to their summer resource territories to fish,
but also to pick berries and collect other important plants and bark. For the Coast Tsimshian,
these locations were on the tributaries that drained into the Skeena River. Houses owned
multiple salmon fishing stations in order to diffuse risk of salmon failure in any given year, and
to acquire access to seven species of salmon (Halpin and Seguin 1990:270-271; Prince 2005).
Southern Tsimshian summer resource territories have large salmon escapements dispersed
through many smaller coastal rivers and streams (Coupland et al. 2001).

113
Tsimshian used weirs, basket traps and dip nets to fish salmon (Boas 1916:399-400).
Later in the season, harpoons were used. The combination of weirs, nets and harpoons was very
effective in narrow channels, Skeena tributaries and canyons (Boas 1889:20; Drucker 1965:114;
Nolan 1977:135-138). Some men concentrated on offshore fishing in the summer months, and
although seals and sea lions could be taken at any point in the year, sea mammal hunting usually
occurred in the summer months (Halpin and Seguin 1990:271; Miller 1997:22-23). Mountain
goat and other land mammal hunting also occurred during the summer and fall.
Shellfishing
Although much has been written on the importance of salmon in the pre-contact Prince Rupert
area (Ames 2005a; Coupland et al. 2003; Matson and Coupland 1995) shellfish have received
very little attention until recently (e.g., Burchell and Cannon 2006; Cannon et al. 2008; Cannon
and Burchell 2009). This is despite the fact that shellfish compose a substantial proportion of
the matrix of midden sites in the harbour area. Part of this oversight stems from the perception
that shellfishing was a marginal activity during the ethnographic period, undertaken mostly by
women, young men, children or slaves (Boas 1916:190: MacDonald 1969:242; see also Moss
1993).
However, like salmon, clams were collected in large numbers and prepared for winter
use. Tsimshian groups made frequent use of shellfish, primarily clams and cockles, for local
consumption in the winter, and trade during the summer (Garfield 1966:13; Halpin and Seguin
1990). Gitksan, Upper Nass Nisga‟a, and probably the Canyon Tsimshian acquired shellfish
through trade with coastal groups as they did not have access to coastal resource locales.
Lightweight strings of shellfish were easily transported to interior groups up river for exchange
here and in other areas of the coast (Norton 1985:89-90, 110, 130).

114
It is critical to remember that these observations about Tsimshian society were made 150
to 200 years after first European contact, and may have little to inform on pre-contact uses of
shellfish. The introduction of European goods through the fur trade had a profound influence on
the Tsimshian economy and diet. Some of the earliest Europeans to encounter Northwest Coast
groups recorded a variety of resources, including shellfish, many of which are not noted in later
ethnographic works (Norton 1985:25). By the late 19th century, when some of the earliest
ethnographies were written, many indigenous groups had shifted emphasis to large scale hunting
and fishing and replaced many traditional foods, including shellfish, with European goods
(Norton 1085:84; 154). This, combined with ethnographers‟ interests in predominantly male
tasks, has formed our conception that shellfishing contributed little to Tsimshian economy in the
pre-contact period (Moss 1993).
Hunter-Gatherers, Managers or Cultivators?
Like other Northwest Coast groups, the Tsimshian are frequently cited as classic examples of
complex hunter-gatherers (see Chapter 2 for further discussion). Some have argued that the
patchy nature of resources, in particular salmon, along the Northwest Coast is key to
understanding human adaptation in the area (Schalk 1977; Suttles 1987a, 1987b). Much like
agricultural economies, these resources were “harvested” from very specific, owned locations
on the landscape at specific times of year (Gottesfeld 1994:447; Suttles 1987a; Vastokas
1966:91). Few researchers, however, specifically address the increasing evidence suggesting
that many groups managed the habitats of important plants through burning, pruning and
transplantation. Evidence for plant resource cultivation is in keeping with well-documented
shellfish management strategies. Shellfish harvests were restricted on specific beaches; those
with good clam beds were cleared of rocks and sticks in order to increase the shellfish
115
population at particular owned locations (Deur and Turner 2005b:19-22). Deur and Turner
(2005b) argue that cultivation constitutes a broad spectrum of “plant enhancement strategies”
that involve the manipulation of plants and their environments in order to augment production.
References to indigenous tobacco and potato cultivation in the early contact period are
controversial (McDonald 2005). House owned gardens at winter and summer villages are
documented in ethnographies about the Tsimshian and in early historical documents concerning
the Haida and Tlingit, but it is unclear whether horticulture was practiced in this way prior to
European contact (McDonald 2005; Moss 2005).
Summary
Since the arrival of European traders, missionaries and ethnographers on the north coast, the
House, or wa’lp has been the fundamental organizing principle upon which political, economic
and social action took place. The wa’lp was also the principle by which status and prestige were
(and are) orchestrated. The success of even the most powerful Houses was rooted in their
ability to maintain and augment their own membership and perhaps the membership of related
Houses (Halpin and Seguin 1990:274; Roth 2008). Commoners could shift households with
each season (Miller 1997:51) but might be enticed to stay and contribute to specific Houses,
which required their labour to successfully manage House territories (Seguin 1994:xiii). These
Houses could also acquire slaves through warfare and trade at a scale that less prosperous
Houses could not (Garfield 1966:30). Each House validated its ownership through potlatches,
where names are passed from one generation to the next, along with the wealth and property
deeded by the name (Cove 1987; Roth 2008). While in theory these rights are inalienable, in the
post-contact period, territory could move from one House to another; moreover, individuals can
gain access to new territories through strategic use of social mechanisms such as marriage,

116
adoption, slavery, warfare, and trade (Coupland et al. 2001; Cove 1987; Marsden 2000; Roth
2008). Tsimshian society is, at its core, a grouping of Houses.
The community, however, is another important element to Tsimshian social and
economic relations. The synthesis of mostly ethnographic materials presented here is rather
foggy on the relationships between Houses and larger groups of Houses; they may cross-cut
villages, as in the case of wilnaat’aał, or they may be linked by geographic proximity as in the
case of the village. Archaeological research, such as the study presented here, can help shed
light on these problems by addressing the antiquity of the House and by investigating the
relationship between House and village in the past.
This review of recent Tsimshian history is pertinent to my thesis because I use the
Tsimshian wa’lp as a basis for examining what kinds of data constitute evidence for Houses in
archaeological contexts. As discussed in chapter 2, Houses should produce evidence for
frequent and consistent repair, as well as evidence for continued reconstruction over multiple
generations. This evidence is most likely to be found in architectural and stratigraphic data.
Houses are also most likely to exist in situations where households compete with each other for
members, as exemplified by the contact and early post-contact period Tsimshians. In other
words, Houses foster and are fostered by inequitable social and economic relations.
Consequently, archaeological evidence for Houses should include evidence for significant
differences between house depressions in terms of resources and investment in architecture that
could reflect social inequality. Tsimshian kinship and residency allowed some individuals to
move between Houses and to benefit from the estates of more than one House over the course of
a person‟s lifetime. Yet, each person contributed most of his or her labour to the House in
which he or she resided. As a result, the remnants of Houses in the archaeological record, both

117
from the perspective of Lévi-Strauss‟s model and the historically specific Tsimshian wa’lp,
should reflect the efforts of those who resided together at any given time.

118
Chapter 5: The ancient history of the Prince Rupert area: previous archaeological
research and oral records
As noted at the beginning of this dissertation, Prince Rupert Harbour has long been a focus of
intensive and significant archaeological research on the north coast. Many projects, including
some of the earliest, emphasized the large scale excavation of village sites (Coupland et al.
2003; Drucker 1943; MacDonald and Inglis 1981), but there has been increasing interest in non-
village sites (Banahan 2005) and in regional or landscape approaches to the past (Archer 2001;
Burchell and Brewster 2008). Although there are some recent and notable exceptions (Burchell
and Brewster 2008; McLaren 2008), two main goals permeate much of this body of work; 1)
understanding the origins of ethnographically documented social and economic organization,
and 2) understanding whether events recorded in the adawx (oral records) correspond to
archaeological evidence (Archer 2001; Martindale 2006a; Martindale and Marsden 2003).
The scope of archaeological research that has occurred in this area is impressive. In
many respects, however, the conventional culture-historical framework that has been used to
define the pre-contact period in the harbour is less nuanced than in other parts of the North
Coast, such as the Kitselas Canyon area and Haida Gwaii (Figure 5-1). There is a deep history
of inter-group contact through trade, warfare, marriage and seasonal migrations between the
Prince Rupert area and these other regions of the North Coast, particularly the Lower Skeena
drainage. Thus, both local and regional historical perspectives are imperative to our
understanding of events that occurred in Prince Rupert in the past. This section provides the
history of archaeological research in Prince Rupert Harbour and the Lower Skeena River area.

119
Skeena River
Nass River
Haida Gwaii
Dundas Islands
Legend* Lucy IslandsD Digby Island
*StephensIsland Prince
Rupert
WorkChannel
Alaska
Kitselas Canyon
GrahamIsland
HecateStrait
D
International boundary
N
O 20 40 60 80 100
Kilometres
British Columbia
Figure 5-1. The northern Northwest Coast of British Columbia, showing key locations
discussed in chapter 5 (after Blackman 1990:241 and Halpin and Seguin 1990:268).

120
Following that, the conventional culture-historical sequence for Prince Rupert is presented in
light of new archaeological data and compared with other North Coast regions.
Prince Rupert Harbour
Harlan Smith (1909) undertook the first archaeological survey of North Coast “shell heaps” in
the late 19th century. Smith concentrated on the area in and around Metlakatla Pass, recording
midden sites on both Digby Island and the mainland (Figure 5-2). Many of these sites were
occupied by contemporary Tsimshians who had used the well-drained shell-bearing deposits to
construct potato garden plots and as foundations for their houses. As a result, Smith had
difficulty discerning ancient materials from modern contexts. Smith assumed, for example, that
cultural material collected from the beaches fronting the sites was recently fashioned (Smith
1909:598). This contributed to the idea that indigenous occupation of Prince Rupert Harbour
had begun relatively recently and that little had changed in the intervening years. When Smith
expanded this survey in 1929 to include excavation at midden sites at the mouth of the Skeena
and on Graham Island, Haida Gwaii, he appears to have been more concerned with dating these
sites and open to the prospect that some may be “centuries older, preceding perhaps even the
Christian era.” (Smith 1929:46). Regardless of the antiquity of these sites, Smith believed there
was little to indicate significant change through their duration of use, or for that matter across
the Northern area;
It is hardly surprising, therefore, that the culture represented in the ancient middens
should seem to be similar, on the whole, to that of the Indians found in this region
at the time of its discovery (Smith 1929:44).
Over the following decade, Drucker (1943) surveyed and test excavated some of the
winter villages within and around Metlakatla Pass that had been inhabited in the late pre-
contact/early contact period. Questions regarding the age of these sites were also problematic

121
Kilometres
0 1 2 3 4 5
Tsimpsean Peninsula
Digby Island Kaien Island
Prince Rupert Harbour
Tugwell Island
Chatham Sound
N
Venn Passage
GbTo-77
GcTo-6McNichol Creek
GbTo-31Boardwalk
GbTo-28Phillip‟s Point
GbTo-46Tremayne Bay
GbTo-10Co-op site
Straith Point
Figure 5-2. The Prince Rupert Harbour area, showing the locations of key sites discussed
within the text.
for Drucker. He identified these sites largely from historic documents and deciduous forest
cover, and as such believed them to be fairly recent occupations. Like Smith, Drucker observed
little difference between archaeological and ethnographic cultures. This idea would permeate
the culture history of the area for the next half century (Ames and Maschner 1999:95;
MacDonald 1969; MacDonald and Inglis 1981:52).
No further archaeological work was undertaken in the harbour until 1954. Charles
Borden, with the assistance of James Baldwin, tested GbTo-10, also known as the Co-op site
(Ames 2005a:20). This excavation was significant because it produced dates over 3000 years
old, thereby demonstrating unequivocally the antiquity of indigenous occupation of the harbour.
Borden and Baldwin also saw evidence for abandonment in the site‟s stratigraphy.

122
Understanding the reasons behind abandonment at this site and throughout the area would
become a significant focus of archaeological research in the harbour in the years to come.
North Coast Prehistory Project (NCPP)
The North Coast Prehistory Project (1966-1980) was the largest archaeological research project
undertaken in the harbour to date. The primary goal of the project was to investigate through a
study of archaeological remains how the ethnographically documented cultures on the North
Coast came into being (Ames 2005a; MacDonald and Cybulski 2001; MacDonald and Inglis
1981:37). This was an all-encompassing programme with a geographical scope far beyond the
harbour; significant 19th century Haida villages were mapped and documented, and pre-contact
sites were excavated on Haida Gwaii. The mainland components included ethnohistorical
research and the excavation of 11 sites within Prince Rupert Harbour, in addition to survey and
excavation in Kitselas Canyon. The programme emphasis however, was on the area in and
around Prince Rupert. Research questions particular to the harbour included whether, as oral
records suggest, human remains could produce evidence for intrusive populations and how
social ranking might have influenced pre-contact settlement and architecture (MacDonald and
Cybulski 2001:4-5).
The wealth of data uncovered from these excavations was largely unpublished until
Ames‟s 2005 monograph. Like many excavations of the time on the Northwest Coast (Lyman
1991:92-93), the methods employed on the NCPP favoured artifact collection and indeed this
forms the bulk of Ames‟ recently published analysis. Faunal material was unsystematically
collected and architectural features poorly documented. As a result, there are significant
limitations to the kinds of interpretations, particularly in the realm of subsistence, which can be
gleaned from this work. Moreover, these results are not easily accessible because they are

123
largely written up in unpublished reports held at the Archaeological Survey of Canada in Ottawa
(see Stewart and Stewart 2001 for an exception).
Prince Rupert Harbour Radiocarbon Dating Project
In the early 1980s, David Archer, a veteran of the NCPP and now at Northwest Community
College in Prince Rupert, carried out an extensive survey and mapping project of the harbour.
The objective of this research was to expand the harbour‟s site inventory and to map village
organization through detailed study and measurement of surface features. Archer (1992, 2001)
identified 71 new sites and took auger samples from each in order to acquire shell samples for
dating. He concluded that early villages, dating prior to 1900 BP (such as GbTo-77) were
generally composed of small, relatively homogenous and sometimes loosely organized house
depressions. Later villages, post-1900 BP, tended to be bigger, but most importantly, they
consisted of heterogeneous house depressions, some of which were very large. This change in
village layout represents for Archer a shift from relatively egalitarian social organization to
ranked villages and corresponds to the evidence for increasing warfare that culminated in the
area around this time (Archer 2001). Raiding and conflicts with Tlingits encouraged the
inhabitants of small egalitarian villages to abandon these settlements and to congregate in larger
villages for protection. The kinds of relationships that developed within these settlements
encouraged social inequities and facilitated the development of social ranking (Archer 2001).
McNichol Creek Site Excavations and the North Coast Housing Project (NCHP)
The research that I present in this dissertation was undertaken as a component of the North
Coast Housing Project (NCHP). This research programme developed out of Coupland‟s work at
GcTo-6 (the McNichol Creek site) and focused on the large scale excavation of four ofther

124
village sites in the harbour: GbTo-46 (Tremayne Bay), GbTo-28 (Phillip‟s Point); GbTo-31 (the
Boardwalk Site) and GbTo-77 (refer to figure 5-2). Both the McNichol Creek project and the
NCHP sought to address, through an analysis of household remains, questions relating to
production and social organization. The results of this work have shown that semi-sedentary
villages based on a salmon storage economy were well underway by 2200 BP and that large-
scale salmon storage precedes evidence for social ranking. Of the village sites in this study,
evidence for social ranking occurs only at later components at GbTo-31 and GcTo-6 (Coupland
2006; Coupland et al. 2003, 2006). House O, the largest house depression at GcTo-6, contained
a large central hearth, most likely for feasting, a partially clay-lined floor and sea mammal
remains. These attributes were found only in house O and suggested to Coupland that this had
been a chief‟s (or lineage head‟s) house. In other words, McNichol Creek was a ranked village
by approximately 1600 BP (Coupland 2006; Coupland et al. 2003).
Another component of the NCHP is focused on what are presumed to be non-village
sites, or small sites within the harbour. These sites (smaller than 1000 square meters) lack house
features and are thought to be the remains of base camps and resource extraction sites. Small
sites have been largely ignored by researchers in the area, but are critical to our understanding of
subsistence and mobility strategies, particularly with regards to shellfish (Banahan 2007).
Dundas Islands Archaeological Project
Andrew Martindale and David Archer have recently completed extensive survey and excavation
of sites in the Dundas Islands, an archipelago to the north of the harbour and across Chatham
Sound from the mouth of the Nass River. This area is the location of significant events recorded
in the adawx. Archer (2008) has carefully mapped large village sites and argues that there are
two very different kinds of settlements. Drawing on events recorded in the adawx, he interprets

125
this as evidence for two distinct ethnic groups (Tlingit and Tsimshian) living in the Dundas
Islands 2000 years ago. A second component of the project has focused on assessing the
formation and antiquity of shell middens and village sites in this area (Martindale et al. 2009).
Preliminary results suggest that shellfish were harvested and the shells used to create habitable
landscapes for at least 6900 years, and that people began building villages composed of
rectangular post and beam houses as early as 3800 years ago (Martindale et al. 2009; Ruggles
2007).
Kitselas Canyon and the Lower Skeena
Like Prince Rupert Harbour, the first archaeological research in the interior was also undertaken
by Harlan Smith. In the 1920s, Smith documented through drawings and photographs a number
of villages along the Skeena River, many with standing architecture. In 1928, Barbeau and
Beynon surveyed the Kitselas Canyon area and documented the ancient villages of the Gitksan
(Allaire 1979:61; MacDonald and Inglis 1979:9-11). Allaire followed up on some of this
research in the 1970s as a component of the NCPP (Allaire 1979; MacDonald and Inglis 1979).
Allaire (1979) excavated portions of the Gituas site, one of the four villages that had been
occupied by the Kitselas tribe. Oral traditions record the founding of this village site after
Tlingit migrants had been absorbed into this Tsimshian group. The artifact assemblages
resulting from this excavation provided the framework for the initial Skeena culture-historical
sequence and suggested to Allaire that the site was used alternately by coastal and interior
groups.
In the 1980s, Gary Coupland surveyed sites in the Kitselas Canyon area, but focused his
research on the Paul Mason site (Figure 5-3). The results of this work are significant for two
reasons; 1) they refine the Canyon‟s culture history into a five-unit sequence; and 2) they

126
Figure 5-3. The Skeena River region showing the location of the
Paul Mason site and Psacelay (after Coupland 1988a).
contributed to our understanding of how social organization relates to production. From
patterning in house depressions at the Paul Mason site, Coupland concluded that small corporate
groups were orchestrating salmon harvesting, processing and storage in the Canyon area almost
3000 years ago, well before evidence for pronounced social inequality (Coupland 1985, 1988a,
1988b).
The Lower Skeena area below the Canyon is perhaps the least well known area within
Tsimshian territory. This area is, however, particularly relevant to our understanding of the
region‟s culture history because the Lower Skeena drainage system encompasses many
traditional Tsimshian summer resource locations. Consulting projects associated with Canadian

127
National Railway and Natural Gas developments had identified through survey a number of
archaeological sites in the area, but little archaeological research had been carried out in the
Lower Skeena prior to Martindale‟s (1999) survey of the Exchamsiks and Gitnadoiks rivers in
the late 1990s. Martindale observed changes in settlement and use of this part of the interior
over 2500 years. Between 2500 BP and 500 BP, sites were small and consisted of one or two
house depressions. After 500 BP, houses were still small in number, but much larger in size.
When winter villages were abandoned in favour of the large aggregate settlements at fur trading
posts in the early contact period, Tsimshians shifted their summer locations from the tributaries
to the Skeena itself. These summer “towns” were large and similar in design to the traditional
winter village (Boas 1916). Although food resources were still important, surplus and wealth
were now measured in European goods. Interior settlements, therefore, shifted from the
tributaries to the Skeena, the major trade route between the coast and the interior (Martindale
1999).
Assembling the Past; archaeology, culture history and the adawx
Archaeologists working in the Prince Rupert area either work without direct reference to culture
histories (Burchell and Brewster 2008; Coupland et al. 2003) or use the periodization compiled
by MacDonald and Inglis (1981). This culture historical sequence was constructed largely from
artifact typologies and was intended as a preliminary attempt to organize the harbour‟s sites and
resulting artifact assemblages chronologically. Despite the abundance of research and CRM
projects that have been undertaken in the harbour in the intervening years, the framework has
never been properly amended. As a result, the culture historical entities that define this area
encompass broad scales of time and convey a certain level of uniformity or cultural stasis within
periods. To get around this problem, researchers further divide some or all of these entities of

128
time into smaller units (Ames 2005a:293-295; Martindale and Marsden 2003), but there has
been no consensus as to where lines should be drawn.
The years of archaeological research in the harbour and adjacent areas have greatly
expanded our understanding of this and other areas on the North Coast. There is, however,
plenty of contention surrounding major archaeological questions such as when the shift from
egalitarian to ranked villages occurred, or when the pattern of Coastal winter villages and
summer villages on the Skeena watershed came into being. Part of this stems from our
dependence upon these incomplete and out-dated culture histories, but there are also
discrepancies in dating methods, including marine correction values (Ames 2005a; Archer
2001).
Culture History of Prince Rupert Harbour and Adjacent Areas
The culture historical sequence for Prince Rupert Harbour consists of three time periods, Period
I (1500 BP to 250 BP), II (3500 BP to 1500 BP) and III (5000 BP to 3500 BP). When
MacDonald and Inglis first developed this sequence, no sites dated earlier than 5000 BP had
been found in or around the harbour. Although the early to mid Holocene (11 000 B.P. to 5500
BP) is poorly represented on the northern mainland, or indeed in the islands forming Prince
Rupert Harbour, recent archaeological research in the outer harbour and adjacent areas has
begun to overturn our conceptions about the region‟s culture history in general and this early
period in particular. Banahan‟s (2007; Coupland et al. 2006) recent work on the Lucy Islands
and Martindale and Archer‟s in the Dundas Islands show the outer harbour was in use more than
7000 years ago. Although no artifacts were uncovered, these sites date well within the Archaic
period (approximately 9000 to 5000 BP), and show that shellfish formed a significant
component of the economy well before shorelines stabilized (Ames and Maschner 1999:88).

129
There are also plenty of sites in the harbour that extend below water mark indicating that there
may be earlier components that date to a period when shorelines were lower than today (Ames
2005a:22-24).
The earliest archaeological sites on the Northern Coast are Ground Hog Bay 2, On-Your-
Knees Cave and Hidden Falls in Southeast Alaska (Ackerman 1974, 1992; Davis 1989; Moss
1998:92). These sites are dated 9500 and 9000 BP respectively and there are considerable
differences between their lithic assemblages. Assemblages from Ground Hog Bay 2 contain
bifaces and flakes, while the earliest Hidden Falls components contain microblade cores and no
bifaces. In Haida Gwaii, Fedje and Christensen (1999) surveyed inter-tidal zones and raised
beaches and identified a number of sites that date 9400 to 5000 years ago. Occupations dating
prior to 8900 BP are termed the “Kinggi Complex” and lithic assemblages from these sites
consist mostly of pebble tools and “Levallois-like” flakes. Assemblages from sites later than
8000 BP consist almost exclusively of microblades and belong to the Moresby Tradition, such
as Arrow Creek 1, the Kasta site, Lawn Point, Cohoe Creek and Stathdang Kwun. These last
two sites have shell midden components (Fedje and Christensen 1999).
Microblades were also found in the earliest components of the Paul Mason at Kitselas
Canyon on the mainland. Termed the Bornite phase (5050+/-140 BP) these deposits consisted
of obsidian microblades and were likely used for fish processing and some woodworking.
Coupland (1988a:230) suggests that the obsidian found within these assemblages indicate trade
with groups further in the interior. There is little to suggest how the canyon area might have
been integrated with the harbour, but very few sites have been excavated in the harbour that date
to this period.

130
Period III
Prince Rupert Harbour Period III (5000-3500 BP) coincides with what is currently the earliest
evidence for occupation in the inner harbour. The Lachane and Boardwalk sites are the best
known sites with components dating to this period. Period III artifact assemblages include
chipped stone, pebble tools, bone and antler tools. These artifacts, combined with faunal
assemblages that exhibit a paucity of fish remains, had been interpreted as evidence of an
economy focused on land mammals, supplemented with fishing. Site components dating to this
time were largely investigated as a component of the NCPP, and as such, faunal material was
not systematically collected. Stewart et al. (2003; see also Stewart et al. 2009) demonstrated
that later components of the Boardwalk site had been adversely affected by screening practices
that likely biased faunal remains against smaller vertebrates like fish in favour of larger
terrestrial mammals. Undoubtedly, screening practices influenced early component
assemblages as well. Moreover, preliminary results from the Dundas Islands project have also
shown that sites dated to Period III contain fish remains (Burchell and Brewster 2008).
The architectural features (mostly small posts) and small slab-lined hearths found in
these early components convey little regarding the nature of settlement in Period III at these
sites. Shell midden deposits that date within Prince Rupert III are shallow; this has been
interpreted as evidence for a relatively high level of residential mobility (Martindale 1999:73;
Matson and Coupland 1995:126). However, Ames (2006) and Marshall (2006) have recently
posited that the presence of cemeteries in these shell middens likely reflects a certain degree of
territoriality (see also Rowley-Conwy 2001). Recent work in the Dundas Islands produced
evidence for rectangular surface house depressions as early as 3800 BP (Ruggles 2007).
Coincidentally, this corresponds to the date of an early house feature at the Hidden Falls Site
(Ames and Maschner 1999:56; Davis 1989).

131
The lithics from this period in the harbour consist of cobble and flaked tools. Bone tools
are decidedly more complex; there are bilaterally barbed bone harpoons with line holes and
unilaterally barbed harpoons. Geometric decorative motifs are found on utilitarian objects from
this time, and there are also California mussel adze-blades and points, bone wedges/chisels,
canine tooth pendants, beaver incisors, bird bone tubes and beads, bone awls and points
(MacDonald and Inglis 1981).
The culture history for Kitselas Canyon is known in greater detail than other parts of the
north coast during this period. The time frame associated with Period III is broken down into
two phases in the Canyon, the Gitaus phase (4300 to 3600 BP) and the Skeena Phase (3600 to
3200 BP) (Allaire 1979; Coupland 1988; Matson and Coupland 1995:129). Gitaus phase
deposits were uncovered at the Gitaus and Hagwilget sites and consisted of chipped stone,
mostly cobbles and cortex spall tools. Allaire (1979) saw this as evidence for coastal groups
from the harbour exploiting the area on a seasonal basis, probably for fish, as early as 4000
years ago. A change in the lithic assemblage at the Gitaus site around 3200 BP (Skeena phase),
showed a decrease in ground stone, an increase in formed bifaces, and the introduction of
lanceolate points. These tools suggested an increasing emphasis on land mammal hunting,
though acute angle flakes (thought to be associated with fish butchery) and birch bark rolls
(interpreted as torches for fishing at night) suggested that fishing was still an important
component of this economy (Coupland 1988a:232-234). Allaire (1979:46) sees this change as
evidence for interior groups settling in the Canyon, because the lithics appear similar to
contemporary assemblages from the Hagwilget site located further east. Coupland (1988a:235)
however, sees similarities between lithics from coastal sites and Skeena phase assemblages and
argues that harbour groups were still using the Canyon, perhaps on a seasonal basis.

132
Prince Rupert Period III corresponds closely with Ames and Maschner‟s (1999) Early
Pacific Period, represented in Southeast Alaska by component II at Hidden Falls Site (Moss
1998:100). One of the hallmarks of the Pacific Period is the introduction of groundstone, in
particular adzes and abraders that would have been conducive to heavy woodworking (Ames
2005a:25). These ground and flaked stones are found in Prince Rupert III components as well
as at the Hidden Falls site (Davis 1989). On Haida Gwaii, sites dating to this period and with
this kind of lithic technology are considered part of the Early Graham Tradition. The Blue
Jackets Creek site is one such example, containing bipolar flakes, pebble cores and basalt flakes
(Ames 2005a:26; Fladmark et al. 1990).
Period II
Period II, dating 3500-1500 BP, can be subdivided into and early and late phase (Martindale and
Marsden 2003). The early phase is characterized by rapid shell accumulation in midden sites,
which as MacDonald and Inglis (1981) contend, likely reflect growing village occupations,
larger house construction and population increases. Villages at this time are still relatively small
and dispersed, but surrounded by smaller resource procurement and camp sites (Martindale
1999:74). Each village group, therefore lived within its own coastal catchment zone.
Period II tool kits in general show continuity with Period III. Late in Period II (circa
2000 BP), new classes of woodworking tools, such as stone adzes, chisels and bark shredders,
were introduced, along with evidence for increasing inter-personal violence (Fladmark et al.
1990:234). Heavy woodworking tools are generally seen as evidence for large-scale
woodworking activity such as the construction of plank houses (Drucker 1943:57). This kind of
technological change may have had a fundamental influence on the nature of building projects
in the harbour over the last 2000 years.

133
Faunal remains from sites dated to this period tend to consist of large quantities of
salmon bones (Matson and Coupland 1995:191). Fish weirs dating 2000 to 3000 years ago in
southeast Alaska (Moss et al. 1990; Moss and Erlandson 1998) and tidal stone fish traps south
of the Skeena (Simonsen 1973) suggest that large scale salmon fishing was well underway in
this period both north and south of the Skeena River and in parts of southeast Alaska. Evidence
for large-scale salmon fishing supports the idea that the seasonal round between the harbour and
the Skeena can be dated to this period (Fladmark et al. 1990:233). Salmon are easily harvested
in large numbers as they travel upriver prior to spawning. To prevent spoilage of salmon caught
in abundance, the flesh must be processed through drying or smoking and stored (Matson and
Coupland 1995). Evidence for drying racks has been identified at a number of sites and in
conjunction with regular post-and beam houses, kerfed boxes and large quantities of ground
stone likely reflect the procurement, processing and storage of large quantities of salmon
(Coupland 1988b:220; MacDonald and Inglis 1981). Recent work in the Dundas area has
shown, however, that rectangular houses predate this period by a few hundred years; the
importance of salmon at these sites is unclear (Ruggles 2007).
The lithic assemblages of this time period are very similar to Period III. New
woodworking tools, such as new types of ground stone and shell knives, are introduced late in
this period. People began creating objects with zoomorphic themes as well as new items of
personal adornment (MacDonald and Inglis 1981). A new unilateral barbed harpoon was made
that includes a multiple notched unilateral line-guard, and exotic raw materials such as amber,
copper and dentalia, are often found in burials (Ames 2005a:301; Coupland 1988b:220). These
have been used to support the idea that social ranking developed early in the harbour, perhaps
by 3000 BP (Ames 2005a:294, 301), although amber has been found in a variety of non-burial
contexts across the northern region (see chapter 8).

134
Chronologies are more detailed in the Kitselas Canyon area, where this time period
crosscuts three phases; the end of the Skeena phase (3600 to 3200 BP), the Paul Mason phase
(3200 to 2700 BP) and the Kleanza Complex (2700 to 1500 BP). Settlement and subsistence
patterns change dramatically at the beginning of the Paul Mason phase, which is defined largely
from deposits at the Paul Mason site. Lithic assemblages from Paul Mason phase deposits at
this site are composed of increasing proportions of ground stone, thought to be associated with
fish processing, at the expense of chipped stone tools. The small, rectangular, surface house
depressions at this site are associated with the Paul Mason phase, and this suggests to Coupland
that households were organized as co-residential corporate groups living here on a year-round
basis (Coupland 1988a:230-242). The Kleanza phase differs from the Paul Mason phase only in
the introduction of new artifacts related to fishing (such as net sinkers similar to those found in
later Period II assemblages from the harbour) and personal adornment. Thus far, components
associated with the Kleanza Phase have been found only at the Gitaus site (Allaire 1979;
Coupland 1988a:239-241; Matson and Coupland 1995:236).
On the North coast, Middle Pacific period (3500 to 1500 BP) sites include Component
III at the Hidden Falls site. The lithics associated with this time period at the Hidden Falls site
consist of undiagnositic flakes and specialized ground stone, including abraders, planing adzes,
knives, chisels and mauls (Davis 1989; Moss 1998:100-101). In contrast to Middle period sites
in Prince Rupert Harbour, there are few bone tools here or on Haida Gwaii (Fladmark et al.
1990:237).
Period I
Period I dates from 1500 BP to contact, and is represented in the inner harbour by components
at the Baldwin site (GbTo-36) Kitandach (GbTo-34), K‟nu (GcTo-1), Lachane (GbTo-33),

135
Pariseau Point (GbTo-30), Garden Island (GbTo-23), the Boardwalk site, and Lucy Islands
(Ames 2005a; Banahan 2007; Martindale and Marsden 2003). New woodworking tools
conducive to very heavy woodworking, such as large, grooved splitting adzes, hafted mauls,
shell knives, and carving and cutting tools were found in components dating to Period I
(Fladmark et al. 1990:235); these tool types may relate to the increasingly large houses that
were constructed during this time. Inter-personal violence also appears to be escalating as
indicated by evidence for bow and arrows (MacDonald and Inglis 1981).
There is a clear shift in settlement patterns around 1500 BP. Once dispersed villages
were abandoned as groups clustered together along Metlakatla Pass (Venn Passage).
Concentrations of large numbers of people within a relatively small geographical area likely had
implications for economic pursuits. In particular, the inhabitants of the Metlakatla Pass area
may have had to travel farther to acquire basic coastal resources, such as shellfish. This may
reflect changes in ownership of resource locations as well as the development of land tenure
practices at non-village locations on the landscape (Martindale 1999:75). For Martindale and
Marsden (2003), this period is marked by the reoccupation of the harbour by allied coastal and
interior groups and the start of the traditional Tsimshian seasonal round.
One of the most significant sites dating to this period in the region is the Greenville
Burial Ground (Cybulski 1992), located on the lower Nass River. Faunal remains from this site
indicate that anadromous fish formed a significant component of the economy. The site is most
revealing about mortuary ritual from this period. The dead were buried in a flexed position, in
boxes that may have been originally used as food containers (Cybulski 1992). The relatively
low number of women in these and other burial sites has been interpreted as possible evidence
for slavery (Cybulski 1992; Donald 1997). This argument hinges on the fact that many women
were buried differently from men and other women in society. Burchell (2004), however,

136
argued recently that differences in burial custom may not relate directly to class, but may reflect
variability in mortuary fashion.
From Drucker‟s initial impressions of midden sites in Prince Rupert Harbour, there has
been a tendency to view the Late Pacific period as much like the historically documented
cultures (Ames and Maschner 1999; MacDonald and Inglis 1981; Matson and Coupland 1995).
Not only is our understanding of this period less complete than we would often like to believe,
this kind of perception of the past glosses over regionally and chronologically distinct and
significant events that occurred along the North Coast. Orchard (2007), for example, recently
surveyed and tested a series of sites in southern Haida Gwaii that date within the Late period, or
Late Graham Tradition. He demonstrates that there is evidence for significant change through
the Late Period. Between 1200 and 800 BP, economies shift emphasis from rockfish (the Xyuu
daw phase) to salmon (Qayjuu phase). This means that the emphasis on salmon, which is
purported to be a critical resource for the development of pronounced social inequality on the
Northwest Coast, occurs significantly later here than it does on the northern mainland. Acheson
(1991) argues that large multi-lineage villages were not present until around AD 1200 in Haida
Gwaii, much later than other parts of the coast and on the mainland (Ames 2005a; Archer 2001).
For Maschner (1992), in southeast Alaska, large, multi-lineage villages do not occur until after
AD 500 and very large houses are not present until AD 700 to 1200. From this, he interprets
social ranking as a relatively late development compared with our conventional interpretation of
the late pre-contact period in Prince Rupert. Interestingly, Eldridge and McKechnie (2008) have
recently argued that many of the Prince Rupert dates have been incorrectly adjusted for the
marine reservoir effect and that evidence for social ranking in both burials and settlement data,
occurs later than expected. In chapter 6, I use Eldridge and McKechnie‟s Delta-R value to
correct for the marine reservoir effect in Archer‟s (2001) shell-based dates.

137
The Adawx
As discussed in chapter 4, archaeologists working on the Northwest Coast have made frequent
use of ethnographic and ethnohistorical documentation as the basis for their interpretation of
archaeological data, despite the problems that have been identified with the information they
contain (Cannon 2002; Martindale 1999; Norton 1985). Specific uses of oral records are much
less common, even though ethnographies are themselves largely constructed from oral
narratives (Martindale and Marsden 2003).
Interest in how Tsimshian oral narratives, in particular the adawx, correspond to
archaeological data, however, has been a recurrent theme throughout the course of
archaeological research in Prince Rupert. One of the central tenets of the NCPP was to establish
whether physical remains would demonstrate evidence for intrusive populations, as recorded in
the adawx. George MacDonald (1993) referenced the Epic of Nekt to help interpret proto- and
early historic period events at the Kitwanga Hill Fort. The adawx are featured also in Archer‟s
(2001) interpretation of changes in settlement and village organization in the harbour 1500 to
2000 years ago.
Marsden (2000) has written extensively on the relationship between oral narrative and
archaeological data, particularly within the last 2000 years. In 2003, Andrew Martindale and
Susan Marsden published an article on the relationship between archaeological data and the
events recorded in the adawx. They contend that events recorded in these narratives correspond
best to archaeological data at the regional level and in particular to the Middle Period (3500 to
1500 BP). According to Martindale (2006a), the annual rounds recorded ethnographically
occurred at different times in the past, shifting in response to migrations and incursions by
outsiders. The adawx record that the earliest coastal groups in the area maintained territory at

138
the Nass River because of the importance of the eulachon fishery. Some Houses and tribes
expanded their territory to the mouth of the Skeena through negotiations with supernatural
beings and marriage alliances (Marsden 2002). This opened up travel between the coast and the
Skeena estuary (up to the tidal limit). Coastal groups were generally resistant to incursions from
migrants into the area and remained distinct from interior groups for millennia (Marsden 2002;
Martindale 2006). Houses that brought wealth and status, however, were welcomed and
absorbed into preexisting coastal groups (Marsden 2002).
Some time later, Tlingit groups originating on the Stikine River moved into the Tsimshian
homeland, building villages and seasonal camps throughout southeast Alaska, the Dundas
Islands, Tuck Inlet, Stephens Island, Work Channel and perhaps even along Metlakatla Pass
(Marsden 2000:22). What were at first friendly interactions between Tsimshian and Tlingit
soured and became violent. In response, Tsimshian groups at the mouths of Skeena and Nass
rivers were forced to retreat up the Skeena, while Tsimshian living on the southern coast moved
to fortified sites on nearby Islands. The Skeena Tsimshian in particular formed alliances with
neighbouring tribes in the interior and attacked Tlingit settlements in the harbour and mouth of
the Skeena in order to reclaim these areas.
The adawx are of particular interest here because of what they reveal about the history of
Tsimshian Houses. Each House owns its own adawx or historical narrative “which explains the
significant relationships that legitimize its (the House‟s) place in the social and geographical
landscape” (Martindale and Marsden 2003:16). This includes explanations concerning the
founding of Houses, the integration of new members through marriage, the movement of
individuals between Houses due to conflict and raiding, and inter- and intra-house fighting over
access to hunting and fishing territories (Marsden 2002:43).
When these integrated Tsimshian groups returned to the harbour and reclaimed the area,

139
Tsimshian society changed profoundly (Marsden 2002:33). According to the adawx, the pattern
of seasonal migration between the harbour and interior only begins at this time, which
Martindale and Marsden (2003) believe corresponds to the evidence for a relatively abrupt
reoccupation of the harbour about 1500 BP. The Tsimshian, now shared extended kin relations
with the Tlingit, Nisga‟a and Gitksan (Marsden 2000:50-51). This means that Tsimshians had
ties to Tlingit, Nisga‟a and Gitksan Houses and that Tsimshian Houses now consisted of
individuals whose origins were within these other groups. This resulted in a network of related
groups spread through the region, which both encouraged closer economic and social ties within
Tsimshian tribes and between the Tsimshian and other northern groups (Marsden 2000:45-51).
This coincides with an important concept that generations of archaeologists working in
the area have grappled with, that the Northern indigenous groups are particularly closely related
culturally and genetically. Drucker (1955) referred to the north coast area as the “northern
province” and MacDonald (1969) called this the “north coast interaction sphere” or co-tradition.
In MacDonald‟s view, marriage and raiding between groups facilitated cultural convergences.
The kinds of ranked systems witnessed historically developed out of the need for elites to
control prestige items that could not be found locally and this desire for trade goods stimulated
inter-tribal contacts (MacDonald 1969:244-245). The idea that this kind of interaction sphere
provides the foundation for social ranking as been criticized (Sutherland 2001) and comparisons
of physical remains (admittedly few) do not seem to suggest a close biological relationship
between northern groups (Cybulski 2001). The notion that close cultural relations existed
between the three major Northern groups however, still exists (e.g. Clark 2008).

140
Summary
Although extensive work has been undertaken in Prince Rupert Harbour, our knowledge of past
events in this area is still in many respects uncertain. This lack of clarity stems partly from our
dependence on outdated culture histories that gloss over hundreds of years of historical change.
The connection between the coast and interior is particularly important, though our
understanding of the regional movement of people and ideas is hampered by the relative paucity
of data from the Skeena and the Nass river areas.
This review of previous archaeological work in the Prince Rupert/Skeena region raises a
number of interesting and unresolved questions that pertain to my dissertation. One of the most
significant asks whether it is possible to differentiate between ancestral Tlingit and ancestral
Tsimshian Houses from surface house depressions. Archer‟s (2008) recent survey of the
Dundas Islands area revealed at least two distinct settlement plans that he argues may reflect
occupations of this area by different ethnic groups. This kind of settlement variability, however,
has not been observed within the inner or outer harbour area where my own study is focused.
Moreover, the Lévi-Straussian House represents a “type” of social organization that includes a
variety of contemporary and historical groups, including the contact and post-contact-period
Tsimshian; these groups share key characteristics in social and economic organization that I
outlined in chapter 2. In archaeological contexts, Houses should produce evidence for repeated
rebuilding and repair of the domestic structure over multiple generations and should provide
evidence for owned resource territories. These patterns may be investigated regardless of the
ethnic affiliation of those who constructed the dwellings we excavate.

141
Part 2: Results and Interpretation
Chapter 6. Site Descriptions
In this chapter, I provide descriptions of the environment within the immediate vicinity of the
study sites, GbTo-77, GbTo-46, GbTo-31, GcTo-6 and GbTo-28 (Figure 6-1). The physical and
biological structure surrounding archaeological sites is key to understanding patterning within
faunal assemblages. This information, therefore, allows me to explore where individual
households at GbTo-77 acquired the resources represented within the sites‟ faunal samples,
particularly with respect to invertebrate remains.
In this chapter, I also present a synopsis of archaeological work undertaken by other
archaeologists at each of the study sites and a summary of their findings, including site
chronology. These details have been presented elsewhere (Ames 2005a; Archer 2001;
Coupland et al. 2000, 2003, 2006), but a review is important because current arguments that
concern social relations hinge on the timing of changes in settlement patterns (Ames 2005a;
Archer 2001; Marshall 2006). Descriptions for GbTo-77 also include the methods and results of
auger testing at this site, as well as excavation methods and stratigraphic interpretation of a back
midden unit.
The dates presented below are from charcoal (Coupland et al. 2000, 2006, 2010) and
shell samples (Archer 1992; 2001). I calibrated all charcoal samples with OxCal 4.1.
Correcting and calibrating shell dates was much more complex. Archer (2001) corrected shell
dates for the marine reservoir effect by subtracting the Delta-R value of 650 +/- 50 (Southon et
al. 1990:202) from his uncalibrated dates. As discussed in chapter 5, Eldridge and McKenchnie
(2008) argue the regional Delta-R correction value for the marine reservoir effect in the Prince
Rupert Harbour area should be 400 +/-70 for marine samples with uncalibrated dates prior to

142
Kilometres
0 1 2 3 4 5
Tsimpsean Peninsula
Digby Island
Kaien Island
Prince Rupert Harbour
Tugwell Island
Chatham Sound
N
Venn Passage
GbTo-77
GcTo-6
GbTo-31
GbTo-28
GbTo-46
DevastationIsland
CarrIsland
PikeIslandMetlakatla
Bay
Melville Arm
Metlakatla First Nation
Figure 6-1. Prince Rupert Harbour showing the location of GbTo-77, GbTo-28, GbTo-46,
GbTo-31 and GcTo-6 as well as key geographical locations mentioned in the text (after
Archer 2001).
2500 BP and 455+/- 60 for marine samples with uncalibrated dates between 2500 and 1500 BP.
As such, I corrected and calibrated shell-based dates following Eldridge and McKechnie (2008)
using CALIB 6.0. I present all calendar dates below at the 95% confidence interval.
GbTo-77
GbTo-77 is located in a small, shallow unnamed bay (Figure 6-2) on the northwest shore of
Digby Island. Heading west out of Prince Rupert Harbour via Venn Passage, this bay is located
approximately 3 km southwest of Metlakatla village. Devastation, Carr and Pike islands in
Metlakatla Bay protect the shoreline in front of GbTo-77 from extreme oceanic conditions; each
of these islands contains important archaeological sites that date 2000-3000 years ago (Banahan
pers. comm.; Martindale and Marsden 2003). Two rock reefs 200 m to 300 m seaward of the

143
Figure 6-2. Map showing the location of GbTo-77 in
relation to the other registered archaeological sites in
the bay (after Canada Dept. of Energy, Mines and
Resources (Canada) 1980).
high-tide mark further protect this bay from powerful wave shock.
The bay in front of GbTo-77 is subject to impressive high and low tides that vary as much
as 4 m. At low tide, the bay drains to reveal sandy and muddy pocket beaches bracketed by
expansive schist bedrock outcrops; a rock ledge also bounds the seaward edge of the intertidal
zone. Eel grasses and seaweeds cover the intertidal zone in front of the site; thatched barnacles,
limpets, and occasionally bay mussels adhere to the bedrock outcrops that bracket the beach in
front of GbTo-77. Seals are frequently observed offshore, and occasionally dolphins and

144
whales. Wolves and deer have been spotted on the shore in front of the site. Common bird
sightings include ravens, eagles, ducks and geese. Two other recorded archaeological sites are
situated within this bay; GbTo-78 is a large village site, consisting of over 30 house depressions
and is located approximately 200 m south of GbTo-77. In addition, a smaller midden site
(GbTo-79) is located even further to the southwest (Coupland et al. 2006). Each of the three
sites faces a beach that is bracketed by large bedrock outcrops.
The upper beach, or beach ridge, directly in front of GbTo-77 is approximately 15 m wide
(measured from the base of the embankment to the high tide mark) and is largely composed of
schist gravel with small quartz inclusions and large particle sand. The embankment rises steeply
approximately 1 m in elevation from the beach to the forest. The site itself is 10 m east of the
forest edge, and just 1 m higher in elevation.
GbTo-77 is a small shell midden village site measuring some 3000 m2
in area. It consists
of six house depressions and is rimmed on the back and sides by a relatively small, shallow
midden (Figure 6-3). Five of the house depressions (houses B through F) are arranged in a
single row; they are relatively homogenous in size, ranging from 3 m x 4 m to 4 m x 6 m, as
measured from the mid-slope of the house depressions (sensu Archer 2001; Coupland 1985,
1988a). A sixth house depression (house A) is oriented perpendicular to the main row and, from
surface measurements, is approximately 2 m x 3 m. The back midden (as measured from the
back of the main row of house depressions to the far midden edge) ranges between 6 m and 6.5
m in width but broadens to almost 10 m behind house A. The eastern edge of the back midden
drops 1.5 m sharply to the forest floor. The northern edge of the midden also slopes steeply to
the forest floor; the southern midden edge, however, tapers to an end beside a small gully that
drains onto the upper beachfront south of GbTo-77. The forest cover in the vicinity of the site
consists of cedars, hemlocks and pine trees, which made accurate measurements of some surface

145
house depressions difficult. House depressions B, C, and D were well defined on the surface,
but, house depressions D and E were obscured by large tree falls. House depression A was
relatively clear of large obstructions, but, the feature itself was less pronounced (shallower) than
those in the main row.
GbTo-77 is one of the more remote sites in Prince Rupert Harbour (see Figure 6-1).
Access to this site is available only by boat, even from communities such as Dodge Cove and
Crippen Cove, which are located on the eastern shore of Digby Island. The closest community
is Metlakatla First Nation across Metlakatla Bay at the opening of Venn Passage. From the city
of Prince Rupert, one must travel across the harbour and through Venn Passage, a distance of
approximately 10 km. Lands cleared for the Prince Rupert Airport runway, however, are
located less than 1 km to the southeast of GbTo-77 where elevations above sea level are higher.
Lands to the northeast and east of the site are part of Tsimpsean Indian Reserve 2 held at
Metlakatla First Nation.
Prior to my own work at GbTo-77, David Archer of the Northwest Community College
in Prince Rupert mapped and tested a small portion of the back midden in 1988, as a component
of the Prince Rupert Harbour Radiocarbon Dating Project. He also collected shell samples from
the top of the back midden in two locations in order to acquire terminal dates for this site
(Archer 1992; 2001). I first visited the site in June 2002. I mapped GbTo-77 by hand and, in
2004, with the assistance of Dr. Michael Blake (University of British Columbia), using a total
station. In the summer of 2002, I also collected a series of auger samples from a number of site
contexts using a 7 cm diameter hand-held auger (Figure 6-3). These auger tests allowed me to
test the depth and composition of the site in a variety of locations (sensu Coupand et al. 1999;
Stewart et al. 2003). These samples also provided me with midden, faunal, and sediments
samples to compare with excavated data. A total of 30 auger tests were taken from GbTo-77,

146
Figure 6-3. Map of GbTo-77 showing the location of house depressions, auger samples
and the back midden unit. Elevations are in masl.
although two were discontinued due to subsurface obstructions in the humic layer; I excavated
12 auger tests from across the back midden, four from the area in front of the houses, one along
the eastern edge of house A, one along the northern edge of house B and one each between
house depressions B through D. I also took two auger tests from house depressions B through D
and one test each from house depressions E and F. I aimed to collect one-litre samples of
material samples every 20 cm; differences in deposit compaction and composition made
147
consistency difficult. As such, samples ranged from every 10 to 40 cm. Nine samples were
sorted and informally examined in the field, but the components of these samples have not been
quantified and, as such, are not presented or considered in this dissertation. I have analyzed an
additional four samples in the lab to date and the results of this work are presented in chapter 8.
The auger tests helped me identify shell midden in three contexts, behind house
depressions (back midden), between house depressions (side midden) and in front of house
depressions (front midden). Samples with no visible shell, mostly taken from the centre of
house depressions, occasionally produced very small quantities of shell during analysis,
particularly those samples positioned slightly toward house depression edges. Auger samples
taken from house depressions C, D, E, and F were all very similar in composition; underneath
the humus, 75 cm to 95 cm below the surface, I encountered a greasy black silt with loose schist
gravel. Beneath this deposit (between 100 cm and 130 cm below the ground surface) was a
layer of dense compact schist gravel, often in association with ground water. Samples from
house depression B were different from the other house depressions; auger tests here
encountered deposits of sand and clay between 40 and 70 cm below the ground surface, but the
same compact, schist gravel layer was encountered beneath this.
Auger tests taken across back and side middens were very different in composition from
the house depression samples. Along the back midden, shell deposits were encountered
between 20 cm and 50 cm below the surface and continued as deep as 175 cm to 225 cm below
ground surface. In side middens, as well as at the northern and southern edges of the site, shell
deposits were encountered between 40 cm and 80 cm below ground surface. These samples
contained mixed invertebrate taxa within a dark brown to black sandy-loam. Occasionally
pockets of mussel, thatched barnacle and green sea urchin could be identified within the
samples.

148
Side middens, however, were very different stratigraphically from back middens. Side
middens were relatively homogeneous in appearance and consisted of broken clam shell
dispersed in a grey-black sandy-loam. However, layers composed almost entirely of crushed
mussel were encountered toward the bottom of shell deposits between houses C, D and E. Shell
deposits were generally shallower across side middens and at the northern and southern edges of
the site, bottoming out between 140 and 185 cm below ground surface. At the southern end of
the midden, the water table was encountered between 130 and 160 cm in depth below the
ground surface. The presence of groundwater at these depths in this section of the site is not
surprising given its proximity to the small gully south of the site.
Following the augering and mapping of the site, I excavated a 1 m x 1 m test unit,
designated unit 1 (Figure 6-4) in the back midden behind house depression C. While my
dissertation research focused on house depressions, the back midden excavation unit provided
faunal samples from the back midden area to compare with auger samples and materials
collected from house depression excavations in 2003 and 2004. Each deposit or stratigraphic
layer was given a separate lot number. I made general observations about the composition of
each lot during my field work; because I took column and bulk samples of each lot identified
during excavation, I was able to refine my descriptions of lot composition in the lab (see chapter
7, chapter 8 and appendix C). Column samples that were not analyzed for shellfish composition
were examined in order to gain information about sediment composition.
The basic stratigraphic sequence for unit 1 was as follows: Lot 1, humus, formed after the
abandonment of the site and ranged in thickness between 5 and 40 cm below the surface, and
ranged in colour from dark red/brown to black. As is common to call humus, lot 1 was also rich
in organic materials in various states of decomposition. Beneath this was a thin, grey zone of

149
Figure 6-4. North and west wall profile of Unit 1, the back midden at GbTo-77.

150
leached mineral which had percolated through the humus. Lot 3 was a greasy, black silt with a
high organic component. This lot was found across the entire surface of the back midden unit
and in almost every auger test sample. It is also similar in description to the “black midden”
noted by Ames (2005:80). Coupland (Coupland et al. 2000; 2006) also describes a greasy black
layer below the humus at GcTo-6, GbTo-28 and GbTo-46. Lot 4 refers to the unit 1 shell
deposits; for this unit only, I excavated shell deposits by trowel in 10 cm intervals. I subdivided
lot 4 into discrete shell dumping events in the profiles. The upper metre of the back midden
consists of discrete dumps of shell. Each of these deposits was well-defined and tended to be
dominated by one or a few shellfish species. Lot 4a, for example, consists of thatched barnacle,
green sea urchin and small mussels (bay or small California mussels). Other back midden
deposits appeared to represent toss zones (Binford 1978, 1983; Schiffer 1972). These deposits,
such as lot 4d and lot 4i were more horizontal in orientation and consisted of gravel and diffuse
and highly fragmented mussel, green sea urchin and sometimes clam. It is difficult to determine
from a single one-meter square unit what these deposits represent, but I suspect they may relate
to house cleaning or rebuilding episodes (see chapter 7).
All matrix excavated from this unit was screened for artifacts and faunal remains. I
followed the same screening protocol as Coupland (Coupland et al. 2006); 75% of all material
was dry-screened through one-quarter inch mesh and 25% of the material was wet-screened
through one-eighth inch mesh. These deposits were mostly composed of whole, broken or
highly fragmented shell, vertebrate fauna and sediments. Artifacts were also found within the
lot 4 deposits (see appendix C). The details of specific lot 4 deposits are noted in the legend for
figure 6-4. The unit 1 lots produced many vertebrate faunal remains, including a nearly
complete dog skeleton (see chapter 8).

151
Chronology
I collected charcoal samples for radiocarbon dating from three different site contexts at GbTo-
77: from the back midden, from house depressions and from side middens. Excavation of the
side middens and house depressions are discussed in chapter 7. Five charcoal samples were
assayed at the Isotrace laboratory at the University of Toronto and these are summarized in
Table 6-1. Two charcoal samples relate specifically to back midden depositional events and
these produced dates with age ranges of 390-120 cal BC and 360-1 cal BC (TO11032,
TO11033). There is considerable overlap at the 95% confidence interval for the back midden
dates (one sample was taken from the top of the midden and one from the middle of the
midden); this may indicate that this section of the back midden accumulated rapidly. I corrected
and calibrated Archer‟s (2001) shell-based dates using Eldridge and McKechnie‟s (2008) Delta-
R values for the Prince Rupert area (Table 6-2); these age ranges may reflect an earlier use of
the back midden.
Table 6-1. Radiocarbon dates and calibrated age ranges from charcoal samples for GbTo-77.
Normalized
Radiocarbon Age
BP
Calibrated Radiocarbon
Age Range, 95% confidence
interval (Reimer et al 2009)
Context Sample
Number
1990 +/- 50 150 cal BC-AD cal 125 house A midden
slump TO12055
2120 +/- 50 360-1 cal BC Back Midden TO11033
2210 +/- 50 390-120 cal BC Back Midden TO11032
2250 +/- 50 400-200 cal BC house D TO12054
3040 +/- 60 1430-1120 cal BC house D hearth TO12056
Table 6-2. Radiocarbon dates for shell-based samples for GbTo-77. Samples were corrected for
the marine reservoir effect using a Delta-R value of 455 +/-60 for dates lab dates between 2500
and 1500 BP and 400 +/- 70 for lab dates prior to 2500 BP (Eldridge and McKechnie 2008).
Normalized
Radiocarbon Age
Calibrated Radiocarbon Age
Range, 95% confidence
interval
Context Sample Number
3210 +/-110 900-260 cal BC Back Midden WSU-4391
2925 +/-110 600 cal BC-AD cal 90 Back Midden WSU-4392

152
Most of the dates from GbTo-77 produced calibrated age ranges that overlap with the back
midden dates. Each date, however, may represent chronologically distinct events in the site‟s
history. The house depressions are not well dated and this is a considerable obstacle to
understanding the full nature of the events that produced these features. Two dates were
acquired from samples recovered from house D, one from a hearth feature (Hearth 1, see chapter
7) and one from bench midden deposits toward the front of the house depression. The hearth
sample (TO12056) was taken from a large piece of charcoal and is the only date from this site
that does not conform to the 390-125 cal BC age range. The date from the hearth feature is
between 1430-1120 cal BC (TO12056). This is much earlier than the rest of the dates for this
site, including the shell-based dates, and likely reflects a hiatus between tree cutting and wood
burning events (Dean 1978). The other radiocarbon date associated with this house was taken
from a deposit I interpret as “bench midden.” Bench middens are deposits of finely crushed
shell found along the inside house walls (see chapter 7). These deposits represent material that
accumulated under a bench structure while the house was in use and likely represent house
cleaning activities. The charcoal sample taken from the house D bench midden produced a
radiocarbon date of 400-200 cal BC (TO12054), placing the occupation of this house well in the
age range of other early houses in the harbour area (see below).
Few adequate carbon samples found in the house A deposits were sufficient for dating.
This relates partly to the processes surrounding the construction, use and abandonment of the
structure that created this house depression (see chapter 7). In particular, the house depression
is capped by shell midden material that slumped across the floor area; it is from this “midden
slump” that a carbon sample was taken, producing a date of 150 cal BC- AD cal 125
(TO12055). Because the deposit from which this date came was slumped over the living floor

153
deposit, it suggests that house A fell into disuse prior to the 150 cal BC- AD cal 125 age range.
Unfortunately, it is difficult to determine how much time elapsed between when the charcoal
was deposited in the back midden and when this section of the midden slumped across the house
A depression.
GbTo-46
GbTo-46, or the Tremayne Bay site, is located at the southern tip of Digby Island on a narrow
isthmus between two shallow bays, one on the harbour side (unnamed) and the other (Tremayne
Bay) on Chatham Sound (Figure 6-5). At high tide, the isthmus is approximately 75 m wide.
The eastern shoreline of the isthmus is well protected from open ocean conditions by Kaien
Island. The eastern shore at GbTo-46 consists of rocky outcrops and a pebble/sandy, pocket
beach above the intertidal zone. At low tide, this bay drains to expose wide mud flats.
Although Tremayne Bay is located on the Chatham Sound coast, it is also relatively well
protected from wave action by two small islands. This bay also drains at low tide to expose
sandy flats but, Fraser Point, at the southern end of Tremayne Bay is composed of rock outcrops
(Canada Dept. of Energy, Mines and Resources 1980).
GbTo-46 is located between 2 and 5 m above the high tide line. The site consists of a
large shell midden and surface house depressions arranged on an upper and lower terrace.
GbTo-46 has been mapped on two separate occasions and each survey recorded a different
number of surface house depressions. Archer identified 20 house depressions in 1988 during his
survey of village sites in the harbour. In 2000, Coupland (Coupland et al. 2006; 2010)
identified 24 house depressions; his map is presented in Figure 6-5.
The layout of houses at GbTo-46 is unusual in comparison with other village sites in the
harbour. There are two points of entry by water for this site and so village orientation may not

154
Figure 6-5. Map of GbTo-46, the Tremayne Bay site (from Coupland
et al. 2010).
have been as clearly defined as at other sites from a similar period. The nine upper terrace
house depressions at this site are arranged in a single row and rimmed by a deep shell midden.
Working west to east, the first six houses face Tremayne Bay, while the eastern three houses
face the isthmus and look over the southern terrace. The lower terrace is 1 m to 1.5 m lower in

155
elevation than the upper terrace. Fifteen house depressions are loosely arranged on the lower
terrace, singly, or in groups of two and three. Ten house depressions appear to be oriented with
their long sides parallel to the beach and match those on the upper terrace in cardinal direction.
The structures that created these depressions may have been built with their long sides facing
the shore rather than to their short ends, so that both bays were visible, at least peripherally from
the house entrance. The remaining four lower terrace houses are arranged with their short axis
to the shoreline. The shape of these surface depressions suggests that the structures that were
built here, and that created these depressions, may have faced Prince Rupert Harbour. This
difference in house depression configuration could reflect a separate occupation at this site. The
fact that these remain as surface depressions and were not filled in by later inhabitants suggests
they were inhabited while the rest of the entire lower terrace was in use. As Mackie and
Williamson (2003) point out, however, the relationship between surface depressions and the
structures that created them are less than strait forward; multiple structures may produce a single
depression and some structures may produce no depression at all. Moreover, we cannot be
certain that all surface depressions represent domestic structures.
In addition to mapping GbTo-46, David Archer excavated a shallow 1 m x 1 m unit in
the back midden in the 1980s in order to retrieve shell for dating the site. In 1999, Coupland
(Coupland et al. 2000) took six auger tests using a 7 cm diameter hand-held soil auger; four
auger tests were located across the back midden on the upper terrace and two were located on
the slope between the upper and lower terraces (Coupland et al. 2006:4). In 2000, Coupland
(Coupland et al. 2006:4) excavated a 2 m x 1 m unit in the upper terrace back midden. During
excavation, the field crew encountered human remains and, as a result, closed the northern end
of this excavation. The remainder of the unit was excavated to 1.4 m below the surface and
extended through dense, concentrated shell deposits indicative of refuse midden. Coupland

156
(Coupland et al. 2006:4-5) continued excavations at this site in 2002, concentrating on house J
on the lower terrace. An additional three auger tests were taken from the north/south midline of
the house depression. Coupland (Coupland et al. 2006:5-7) then excavated three areas in and
around the house J depression and identified four depositional zones, two natural and two
cultural. Zone A, humus layer, and zone D, beach sand represent natural deposits at the top and
bottom of the stratigraphic sequence; zone B consisted of greasy black organic sediment,
containing fragments of charcoal and ash, as well as decomposing and fragmented rock. This
deposit formed an interface with zone D within the central area of the house depression and with
zone C (described below) along the midden slope. Zone C may be the same kind of sediment
that I observed underneath the humus in the back midden at GbTo-77. Zone C consisted of
stratigraphically layered deposits of mixed shell and dark brown/black sediment. At the north
and west end of the house J depression, zone C deposits included a thin layer of ash and
charcoal flecks, which Coupland (Coupland et al. 2006:8) interprets as bench midden. The
house and back midden excavations, as well as the auger test, produced vertebrate and
invertebrate faunal remains that I use in this study to compare with the GbTo-77 faunal samples
(see chapter 8).
Chronology
Most radiocarbon dates from both the upper and lower terraces overlap at the 95% confidence
interval and fall between 40 cal BC and 340 cal AD (Table 6-3). Charcoal samples from the
back midden produced dates with age ranges of AD cal 30-340 (TO10898) and 40 cal BC-AD
cal 240 (TO10899) (Coupland et al. 2000). Two dates, both associated with house depression J
are earlier; the first is associated with the latest occupation of house J and has an age range of
360-50 cal BC. The oldest date associated with this site comes from a lower house floor layer

157
and falls between 810 and 520 cal BC. Coupland (Coupland et al. 2006:16) contends that this
charcoal sample was very large, likely included “heart wood,” and reflects a hiatus between tree
cutting and wood burning events (Dean 1978). Archer‟s shell-based dates from the back
midden (corrected using Eldridge and McKenchnie‟s [2008] Delta-R value) at GbTo-46 have an
age range of 40 cal BC-AD cal 530 and 130 cal BC-AD cal 440 (Table 6-4). Based on
Coupland‟s dates (Coupland et al. 2006), I suggest that the most intensively occupied period for
this site was sometime between 360 cal BC and AD cal 340.
Table 6-3. Radiocarbon dates and calibrated age ranges from charcoal samples for GbTo-46.
Normalized
Radiocarbon Age BP
Calibrated Radiocarbon
Age Range, 95% confidence
interval (Reimer et al 2009)
Context Sample
Number
1810 +/- 50 AD cal 80-340 house J TO11029
1840 +/- 60 AD cal 30-340 Back Midden TO10898
1890 +/- 50 AD cal 10-240 house J TO11030
1910 +/- 50 1 cal BC-AD cal 240 Back Midden TO10899
2150 +/- 50 360-50 cal BC house J TO11028
2550 +/- 50 810-520 cal BC house J sub floor TO11031
Table 6-4. Radiocarbon dates for shell-based samples for GbTo-46. Samples were corrected for
the marine reservoir effect using a Delta-R value of 455 +/-60 for dates lab dates between 2500
and 1500 BP and 400 +/- 70 for lab dates prior to 2500 BP (Eldridge and McKechnie 2008).
Normalized
Radiocarbon Age
Calibrated Radiocarbon Age
Range, 95% confidence interval
Context Sample Number
2530+/-95 40 cal BC-AD cal 530 Back Midden WSU-4379
2590+/-95 130 cal BC-AD cal 440 Back Midden WSU-4380
GbTo-31
GbTo-31, the Boardwalk site, is located on the southeast shore of a prominent peninsula called
Elizabeth Point, at the mouth of Dodge Cove on the eastern shore of Digby Island (Canada
Dept. of Energy, Mines and Resources 1980). At low tide, Dodge Cove drains to expose
expansive sand and mud flats. The exposed intertidal zone may have been even greater during
the pre-contact period, because a channel between Dodge Island and Elizabeth Point was

158
dredged within the last century in order to facilitate travel by boat in and out of the cove at low
tides (Ames 2005a:58). The beach ridge above the intertidal zone, directly in front of the site is
composed of sand and gravel; heading inland, the embankment rises sharply 3.5 m in elevation
from the beach to the top of the forested front midden area of the site.
GbTo-31 is a very large site, more than 1 ha in area, and is part of the Dodge Cove
complex of sites. This includes Parizeau Point, Dodge Island, and Dodge Cove (Figure 6-6).
The extensive archaeological work at this site indicates that it was inhabited for at least 5000
years. Many archaeologists have argued that the site held a prominent position in the area
during the pre-contact period (Ames 2005a; Coupland 2004). The site has been disturbed, first
by construction of a boardwalk and then by the large-scale excavations that the National
Museum undertook in the late 1960s and early 1970s as a component of the NCPP. There is
also a broad foot-path that runs through the middle of the site. In the middle of the last century,
a large house was constructed on the back midden of the Parizeau Point site in order to house
the doctor who worked at the quarantine hospital on Dodge Island. At one time, a bridge
crossed the mouth of the cove from Elizabeth Point to Dodge Island to facilitate travel to and
from the hospital.
George McDonald, director of the North Coast Prehistory Project, oversaw the
excavation of over 1000 cubic metres of this site between 1968 and 1970 (Ames 2005:65).
These excavations focused on six distinct locations within the site. Area B, E, D and F extend
in an arc along the southern shoreline of Elizabeth Point above the beach ridge. The NCPP
excavated most intensively, however, in Areas A, B, C, and D (Figure 6-7). Area E (not shown)

159
Figure 6-6. The Dodge Cove area, showing the location of
GbTo-31, Dodge Cove, Elizabeth Point and Dodge Island.
North Coast PrehistoryProject Excavation Units
0 20m
2000, 2003 Excavation Units
House Depression
Dodge Cove
Area B
Area D
Area A/C
shellmidden
shell midden
shell midden
3
6
9Auger location
Figure 6-7. Map of GbTo-31 showing the locations of NCPP excavations,
Coupland’s excavations in 2000 and 2003 and auger-test locations (after
Coupland et al. 2010). Contour lines are in masl.
Shell midden0 500 1000
Metres
N
DodgeCove
Dodge Island
ElizabethPoint
DigbyIsland
KaienIsland
Prince RupertHarbour
GbTo-31 Parizeau Point
GbTo-17
GbTo-30
GbTo-18

160
consisted primarily of a seepage channel; the National Museum excavated in this location as a
component of the NCPP in the 1970s and unearthed well preserved organic artifacts.
The earliest deposits from the NCPP excavations in Areas B and D are sloped, suggesting
that the front area of the site was refuse midden. Later deposits, however, contain lenses of flat
gravel or crushed shell that may represent living floors. The stratigraphy associated with the
living floors in Areas B and D is unique for the harbour; Ames (2005a72; 298) argued that wall
profiles reveal “pithouse” construction. There is no concrete evidence for pithouses elsewhere
in the harbour, but Ames (2005a:62) suggested that the Garden Island stratigraphy may also
represent pithouse building. In conjunction with the fact that so few house depressions were
identified at this site and the carefully terraced front area, the possible evidence for pithouse
construction may suggest quite a different occupational history here than at the other village
sites in this study. However, Ames (2005a) is not entirely clear on how profiles at GbTo-31 or
Garden Island reveal evidence for pithouses as opposed to filled- in, above-ground dwellings.
Pithouses common to other areas of the Northwest Coast and the interior are generally circular
in shape (Lepofsky et al. 2009). There is no indication from the profiles in Ames (2005a:61-73)
of the overall shape of the dwelling. The idea that pithouses might have been constructed in
Prince Rupert Harbour prior to above ground structures is certainly intriguing, but requires
further evidence to be substantiated. According to Ames (2005a:65) the upper deposits of Areas
B and D appeared terraced for house platforms, though some mortuary activity took place in
these areas as well (Ames 2005a:76-77).
Further inland and approximately 3.5 m higher in elevation are Areas A and C. These
areas include the back midden ridge and are the deepest areas of the site. The NCPP excavated
Areas A and C in two large blocks. The results of these excavations revealed that the back
midden was used as a cemetery for at least 2000 years (Ames 2005a:288). In fact, Ames

161
(2005a:289) argues that back middens such as this one were specifically designed and shaped as
burial mounds, and not just shell refuse. Shallow burials and evidence for soil accumulation on
top of midden deposits indicate that the back midden of the site fell into disuse for a time about
2200 years ago (Ames 2005:81).
Area C excavations also included trench excavations through two surface house
depressions at the southwest edge of the back midden ridge (Ames et al. 2005a:82). These
houses were built into existing midden and Ames (1995, 2005a:78) argues that they produced
evidence for rebuilding on at least one occasion. He suggested also that each building episode
may correspond with the burial clusters in the midden behind the surface depressions. The
houses themselves are undated, but estimates derived from midden accumulation rates and basal
midden dates suggest these houses may be as much as 2700 years old. There is some indication
that other houses of a similar size may have been constructed in this area, but the activities of
later inhabitants have obliterated any evidence of them (Ames 2005a:78-88).
In 2000, Coupland (Coupland et al. 2000; 2006:18) excavated a 2 m x 2 m unit in area C.
This excavation extended through two cultural deposits to a depth of 1.7 m below the surface.
The upper deposits were composed of concentrated shell that Coupland (Coupland et al.
2006:18) interprets as refuse midden. The lower deposits in Area C consisted of fine layering
associated with occupation floors, or buried house floors. Coupland (Coupland et al. 2006:18-
19) also excavated a 3 m x 2.5 m section of Area D in 2000, which was completed in 2003. A 2
m x 2 m portion of the original unit was excavated to a depth of 1.75 m below the surface,
through three depositional zones. The upper deposit, zone A, consisted of humus. Zone B
consisted predominantly of layers of dark brown sediment and crushed shell. Coupland
(Coupland et al. 2006:19) also identified three large hearths or ash deposits in stratigraphic
sequence, which he argued reflect three successive house floors. Zone C was characterized by a

162
series of sloped deposits of crushed shell and black sediment that may represent secondary
refuse deposit.
Coupland (Coupland et al. 2006:20) also excavated a 2 m x 2 m unit in Area B in 2003.
This unit was excavated to a depth of 1.5 m below ground surface; one quadrant of this unit
extended deeper to 2.6 m below ground surface. In total, Coupland (Coupland et al. 2006:20)
identified five depositional layers below the humus. Zone B, represented back dirt
accumulation from the NCPP excavations decades earlier. Zone C, however, consisted of
multiple layers of concentrated shell and black sediment, likely representing refuse midden.
Zone D was characterized by grey-brown gravel and sediment; despite the absence of shell,
faunal remains were uncovered in high densities from this deposit. Zone E consisted of a thin
layer of “greasy black soil” and a lack of shell and Zone F consisted of grey-brown sediment
and gravel as well as broken and crushed shell (mostly barnacle) (Coupland et al. 2006:20).
The results of the NCPP and Coupland‟s excavations (Coupland et al. 2006) suggested
that residential and refuse sections at GbTo-31 shifted over the course of thousands of years.
Ames (2005a) argued that the back midden had been the focus of mortuary activity for
thousands of years. Coupland (Coupland et al. 2006), moreover, interpreted lower stratigraphic
deposits in Areas A and C as living floors and upper deposits as refuse midden. In Areas B and
D, both scholars contended that lower deposits represented refuse midden, while upper deposits,
included hearth features and scattered post moulds and likely represented living floors.
Chronology
It is well known that GbTo-31 was in use for thousands of years, yet the areas recently
excavated by Coupland date to narrower time frames (Table 6-5). Although the NCPP dated
their excavations in Area C between 2000 cal BC and AD cal 250, Coupland‟s dates for this

163
section of the site produced age ranges of 370-60 cal BC and 380-60 cal BC (TO101895,
TO10893). New dates reported in Coupland et al. (2006, 2010) for Areas B and D overlap at 2
standard deviations between AD cal 830 and 1250 (TO12057, TO10894, TO12058, TO10892,
TO12059). One of Coupland‟s dates from Area B produced an earlier date range of AD cal
130-410. These calibrated dates suggest that most of the deposits and faunal remains excavated
by Coupland were deposited somewhere between 370 and 60 cal BC in Area C and between 830
and 1250 cal BC for area B and D.
Table 6-5. Radiocarbon dates and calibrated age ranges from charcoal samples for GbTo-31.
Normalized
Radiocarbon Age
BP
Calibrated Radiocarbon Age
Range, 95% confidence interval
(Reimer et al 2009)
Context Sample
Number
890 +/- 60 AD cal 1030-1250 Area D TO12057
900 +/- 50 AD cal 1020-1220 Area D TO10894
980 +/-60 AD cal 900-1210 Area B TO12058
1050 +/- 60 AD cal 830-1155 Area D TO10892
1050 +/- 60 AD cal 830-1155 Area B TO12059
1750 +/- 60 AD cal 130-410 Area B TO12060
2160 +/- 50 370-60 cal BC Area C TO10895
2170 +/- 60 380-60 cal BC Area C TO10893
GbTo-28
GbTo-28, or the Phillip‟s Point site, is also located in a wide shallow bay on the eastern shore of
Digby Island, just south of the Boardwalk site. It is directly west of Phillip‟s Point, from which
the site takes its name. At low tide the bay drains, exposing a vast sand-and-mud intertidal zone
(Canada Dept. of Energy, Mines and Resources 1980). The beach ridge above the intertidal
zone is composed mostly of gravel; heading inland, the terrain rises steeply 4.5 m in elevation to
the site. The site was originally mapped as a component of the NCPP; this map showed two
sections of GbTo-28 divided by a small stream. The eastern section consisted of thirteen house
depressions arranged loosely in two rows. The first row of six houses was constructed on a

164
lower terrace in a relatively straight line. The remaining seven houses were arranged less
uniformly; two groups of three house depressions composed the back row and a single house
depression was identified between the first and second row. The western section of the site was
composed of four house depressions (Coupland et al. 2006:28). Archer re-surveyed GbTo-28 in
the early 1980s; his map showed 13 house depressions arranged more or less in two rows in the
eastern section. The front section of the first row of house depressions here was difficult to
identify and appeared to have been heavily eroded. Archer also excavated a small portion of the
back midden in the east area of the site in order to collect shell for dating.
Coupland (Coupland et al. 2006:28) began work at the site in 1989. He identified only
six house depressions at GbTo-28 in the eastern section of the site (Figure 6-8). No house
depressions were observed in the western section. Coupland (Coupland et al. 2000; 2006:28)
tested the site using a soil probe and took four cores to assess the depth and composition of the
subsurface deposits. In 1999, Coupland (Coupland et al. 2000; 2006:28) took seven auger tests
from across the back midden using a 7 cm diameter auger. In 2000, Coupland (Coupland et al.
2000) excavated a 2 m x 1 m excavation unit in the back midden, and in 2004 he excavated
three units in the house F depression. At the front and back of this house depression,
excavations extended through two cultural zones. Zone B consisted of the same greasy black
sediment that has been noted in other sites in the harbour. A series of shell-based deposits were
observed beneath zone B. The upper deposits of zone C were composed of concentrated shell;
lower zone C deposits were thin and many contained crushed clam shell that Coupland
(Coupland et al. 2006:29) interprets as floor or bench deposits. Excavation through the middle
of house F produced a different stratigraphic sequence. Beneath the humus and black sediment
deposit, Coupland (Coupland et al. 2006:30) found three small discrete mounds of crushed shell.
These deposits were only partially excavated, but Coupland speculated that they could represent

165
back shell midden
front shell midden
Prince Rupert Harbour
A
B
C
D
EF
1
5
10
101 5
0 10m
House Depression
Excavation UnitAuger Test Location
Figure 6-8. Site map of GbTo-28 (after Coupland et al. 2010).
overturned baskets of shell left on the house floor when it was abandoned.
Chronology
Coupland‟s back midden excavations produced dates with age ranges of 380-60 cal BC and 390-
60 cal BC (TO10896, TO12062) (Table 6-6). The calibrated dates associated with house F are
broader in range; the oldest date, 1020-800 cal BC, comes from shell below house F; it may date
an earlier occupation of house F or another occupation altogether. A shell lens within house F
and a burnt house post produced dates that fall at the 95% confidence interval between 410 and

166
Table 6-6. Radiocarbon dates and calibrated age ranges from charcoal samples for GbTo-28.
Normalized Radiocarbon
Age BP
Calibrated Radiocarbon
Age Range, 95% confidence
interval (Reimer et al 2009)
Context Sample
Number
1370 +/- 60 AD cal 560-775 house F TO12061
2170 +/- 50 380-60 cal BC Back Midden TO10897
2180 +/- 60 390-60 cal BC Back Midden TO10896
2260 +/- 60 410-170 cal BC house F TO12062
2740 +/- 60 1020-800 cal BC house F sub floor TO12063
170 cal BC (TO12062) and between AD cal 520 and 810 (TO12061) respectively. The large
gap in time between the age ranges associated with house F could reflect multiple, but
continuous, occupations of the same house or, that this house was abandoned and reoccupied on
multiple occasions. The back midden shell dates provided by Archer (Coupland et al. 2006) and
corrected using the Delta-R values provided by Eldridge and McKechnie (2008) are also
separated by a few hundred years (Table 6-7); these age ranges overlap with Coupland‟s
charcoal-based dates. The three dates with age ranges that cluster closely suggest at a minimum
that the site was inhabited at least intermittently at some point between 410 and 60 cal BC. The
earlier and later charcoal dates could reflect a broader, continuous occupation, or two additional
occupational events.
Table 6-7. Radiocarbon dates for shell-based samples for GbTo-28. Samples were corrected for
the marine reservoir effect using a Delta-R of 455 +/-60 for dates lab dates between 2500 and
1500 BP and 400 +/- 70 for lab dates prior to 2500 BP (Eldridge and McKechnie 2008).
Normalized
Radiocarbon Age
Calibrated Radiocarbon Age
Range, 95% confidence
interval
Context Sample
Number
2600+/- 95 140cal BC-AD cal 430 Back Midden unavailable
1900+/-105 AD cal 700-1200 Back Midden unavailable
GcTo-6
McNichol Creek is located toward the mouth of a narrow channel called Melville Arm on the
Tsimpsean Peninsula (Figure 6-9). Melville Arm drains a marshy area, less than 1 km to the

167
Figure 6-9. Site map of GcTo-6 (from Coupland et al. 2010)
A B C D E F G H
J
K L M N O P
MelvilleArm Grassy Flats
GravelBeach
Excavation Unit
House Depression
0 10m
Auger Test Location

168
northeast of GcTo-6, into Prince Rupert Harbour. At low tide, Melville Arm drains almost
completely exposing a vast, muddy intertidal zone (Canada Dept. of Energy, Mines and
Resources 1980). There are two distinct beach fronts at GcTo-6. The western beach area
consists largely of gravel; wide grassy flats form the eastern beach area. The creek for which
the site received its name (McNichol Creek) is located 25 m east of the site itself. As noted in
chapter 3, McNichol Creek receives a small run of pink salmon each year (David Peacock, pers.
comm). The terrain rises sharply from the beach area to the front of the site, which is
approximately 5 masl. The site consists of a crescent-shaped shell ridge across the back and
sides of the site that is upwards of 3 m deep in places, and fifteen house depressions, fourteen of
which are arranged in two rows (Coupland et al. 2003:152). The fifteenth depression (house J)
is located between the two main rows of house depressions. House depression K is the only
house depressions oriented with its short axis toward the beach.
Diffuse sheet midden deposits are found in front of the first row of house depressions.
Coupland (Coupland et al. 2000, 2003) excavated large areas of the site, including sections of
five house depressions (houses D, E, K, N and O), as well sections of the back and front
midden. The results of these excavations are summarized in Coupland et al. 1999; 2000 and
2003. Excavations in house depressions revealed sequences of house floors and bench midden
deposits, characterized by “compact, greasy, gravely black soil” (Coupland et al. 2000:23). The
front and back midden area produced markedly different stratigraphy. The back midden was
composed of large deposits of concentrated shell. Many deposits were over 1 m in thickness
and extended over a large area of the back midden. Other than human remains, no features were
identified in the back midden at GcTo-6. Coupland (Coupland et al. 2003:156) contended,
therefore, that as was the case for many village sites within the harbour, the back midden at this
site was primarily used for refuse disposal and mortuary activities. The front midden

169
stratigraphy was much more complex than what was observed in the back midden. Shell
deposits in this area were variable in composition; many contained concentrated shell, while
others contained diffuse shell within black soil. Some deposits contained predominantly burnt
shell, while no burning was evident in other shell deposits. Soil layers and features, such as post
moulds, ash lenses, and hearth spills cut through these shell deposits. A single human burial
was also encountered within the front midden area (Coupland et al. 2003:156). This evidence
suggests to Coupland (Coupland et al. 2003:156) that a variety of activities took place to
produce the front midden.
Coupland (Coupland et al. 2003) identified significant differences between house
depressions in terms of architecture, faunal remains and artifacts, all of which suggested that
these features represented ranked households. In contrast to the other excavated house features,
house O, located in the front row, produced evidence of a central hearth and clay floor, which
Coupland (Coupland et al. 2003, 2009) regarded as evidence for communal feasting sponsored
by elites. The argument for the presence of elites and non-egalitarian social relations is
enhanced by the fact that all sea mammal remains recovered from at this site were found at
house O; this suggested to Coupland (Coupland et al. 2003) that sea mammal hunting was a
prestige activity limited to elites, just as it had been during the contact period in this area
(Drucker 1955). The three other houses that were excavated at this site contained multiple
hearths, few items of prestige and no sea mammal remains. This not only indicates that social
inequality pervaded social relations between Houses, but that the owners of house O had
significant influence over the ceremonial activities that were concentrated within this elite-
owned structure. In other words, house O was the economic, social and ceremonial hub of the
entire village.

170
Chronology
The age ranges from seventeen radiocarbon dates show the site may have been inhabited as
early as 900 cal BC and as late as AD cal 1200 (Table 6-8). The very earliest dates, however,
came from deposits below house floors and it was unclear whether these deposits were older
living floors that may be associated with earlier structures, or whether these represented
different uses of the site. The village itself is thought to date between about AD cal 1 and 600
(Coupland et al. 2003, 2010). The age ranges for most dates for GcTo-6 fall after 1 cal AD and
there is considerable overlap in age ranges between AD cal 1 and 600. There are also five dates
that produce 2-sigma age ranges that extend well beyond AD cal 600; these date events that
occurred somewhere between AD cal 260 and 1290. The age ranges produced by the calibration
of Archer‟s shell-based corrected dates (corrected for the marine reservoir effect following
Eldridge and McKechnie [2008]) are similar to many of the charcoal-based dates (Table 6-9).
Table 6-8. Radiocarbon dates and calibrated age ranges from charcoal samples for GcTo-6.
Normalized
Radiocarbon
Age BP
Calibrated Radiocarbon
Age Range, 95% confidence
interval (Reimer et al 2009)
Context Sample Number
810+/-60 AD1045-1290 house O fill Isotrace 7021
930+/-80 AD 980-1260 house E, hearth Isotrace 7019
1060+/-50 AD 870-1150 house O, hearth Isotrace 7022
1350+/-70 AD 560-865 house E, hearth Isotrace 7018
1510+/-60 AD 430-650 Front Midden Isotrace 7025
1570+/-80 AD 630-640 house O, hearth Teledyne 18687
1580+/-80 AD 260-640 house D, front
hearth Teledyne 16452
1590+/-80 AD 260-620 house D, back
hearth Teledyne 16451
1660+/-50 AD 260-535 house O, hearth Isotrace 7024
1670+/-70 AD 215-555 house O, floor Isotrace 7023
1720+/-60 AD 130-430 Back Midden Isotrace 6418
2070+/-60 350 BC-AD 60 Back Midden Isotace 6419
2220+/-60 400-155 BC house E Isotrace 7020
2560+/-60 830-420 BC house D Isotrace 2352
2590+/-90 910-415 BC house N Teledyne 18689

171
Table 6-9. Radiocarbon dates for shell-based samples for GcTo-6. Samples were corrected for
the marine reservoir effect using a Delta-R value of 455 +/-60 for dates lab dates between 2500
and 1500 BP and 400 +/- 70 for lab dates prior to 2500 BP (Eldridge and McKechnie 2008).
Normalized
Radiocarbon
Age BP
Calibrated Radiocarbon Age
Range, 95% confidence
interval
Context Sample Number
2310+/-70 AD cal 330-720 Back Midden WSU-4399
2140+/-90 AD cal 480-950 Back Midden WSU-4400
Summary
Although the focus of my research is on house depressions as archaeological correlates for
households and perhaps Houses, important information can be gleaned about how groups were
organized in the past from inter-site comparisons. In this chapter, I have presented the
settlement, stratigraphic and chronological data for the five village sites in this study. GbTo-77,
GbTo-46, GbTo-31, GcTo-6 and GbTo-28 share a number of characteristics with respect to
these data sets. Surface house depressions, for example, have been identified at all five sites.
Each site was mapped more than once, and it is worth noting that a different number of house
depressions was recorded on each mapping occasion at GbTo-31, GbTo-28 and GbTo-46.
Coupland (Coupland et al. 2006:27) suggests that many of the house depressions at GbTo-28
may have been lost to erosion. According to Ames (2005a) and Coupland (Coupland et al.
2006) the two house depressions at GbTo-31 in Area C were clearly visible in the late
1960s/early 1970s when the NCPP was working at this site. Recent disturbances at this site,
including excavation of these features by the NCPP may have obliterated any evidence for these
features.
It is also possible that the number of house depressions recognized on the ground and
mapped is dependent upon the observer. Shallow surface depressions may be difficult to
distinguish from other features of the forest floor, such as tree falls and throws. Nonetheless,

172
GbTo-31 appears to be considerably different from the other four village sites in terms of
surface features. Ames (2005a) and Coupland (Coupland et al. 2006) have argued that some
stratigraphy at this site is indicative of buried living floors, particularly in the upper layers of
Area D and the lower layers of Area C. This suggests that residential activities and refuse
disposal areas shifted location through time. Coupland (Coupland et al. 2006) suggests that
activities associated with the continued occupation of this site into the late pre-contact period
may have obliterated evidence for house depressions and he (Coupland pers. comm. 2009)
contends that very large houses may have been constructed in Areas B and D within the last
1500 years. Ames, however, argued that the stratigraphy in areas B and D was not only
indicative of buried house floors, but of pithouses. It is not clear from the profiles in Ames
(2005a) how these deposits differ from evidence for buried house floors. The lack of surface
house depressions may be an indication of the depth of occupation at this site, but it could also
reflect different ways of building that did not require shell midden material between houses. As
I discuss in chapter 7, there is some indication that shell was used for architectural purposes at
some sites (Blukis-Onat 1985; Stein 2000).
All sites in this study are also characterized by distinct back midden ridges. Ames
(2005a:237, 289) suggests that back middens are “topographically distinct” from other areas of
the site, particularly house depressions and terraces; the back middens at these sites are higher
in elevation than other areas of the site. Back midden edges are also very steeply sloped. Their
shape and form suggests to Ames that back middens are burial mounds as well as refuse
disposal areas. The heaping of debris created “a linear mound at the back of the village” (Ames
2005a:289). Ames does not discuss how groups might have organized mound-building activity
such as this, but it implies that shell midden structure may reflect supra-household or
community-level organization.

173
The age ranges (Figure 6-10) produced by the calibrated radiocarbon dates from each
1000 500 BC/AD 501 1001 1000
house A
house D bench
house D hearth
back midden
back midden
house J
house J
house J
house J
back midden
back midden
Area D
Area D
Area D
Area B
Area B
Area B
Area AC
Area AC
house f
house f
back midden
back midden
House N
house O fill
house O hearth
house O hearth
house O hearth
house O floor
house E hearth
house E hearth
house E hearth
house E
house D front hearth
house D back hearth
house D
front midden
back midden
back midden
500 BC/AD 501 1001
500 BC/AD 501 1001 1000
500 BC/AD 501
1500 1000 500 BC/AD 501
GcTo-6
GbTo-28
GbTo-31
GbTo-46
GbTo-77
Figure 6-10. Probability distributions (95% confidence interval) of
calibrated radiocarbon dates from charcoal samples for all village sites.

174
site indicate that some villages may have been occupied at the same time. There is considerable
overlap in the age ranges produced by Coupland‟s charcoal-based dates from GbTo-77, GbTo-
28, GbTo-46 and Areas A/C at GbTo-31; this could indicate that the period of habitation, or use
of these sites, or site components, overlapped between 400 cal BC and AD cal 200. Dates for
GbTo-77 and GbTo-28 cluster particularly well and suggest these sites were occupied
somewhere between approximately 400 cal BC and 100 cal AD. GbTo-46 may have been in
use slightly later. It is not possible to determine whether these sites, or site components, were in
use at precisely the same time, but, I suggest that they were inhabited at some point during the
same 600 year period; these sites and site components all date within the Late Middle Period. In
particular, house D at GbTo-77, house F at GbTo-28 and house J at GbTo-46 all produced dates
that overlap with each other within 2 standard deviations; this suggests that these structures
could have been inhabited within approximately 100 years of each other between 400 to 275 cal
BC. Both house J and house F produced earlier and later age ranges. Current data make it
difficult to understand the relationship between sub-floor dates and house occupation dates.
Moreover, GbTo-28 has a much later date associated with a burnt house post that could indicate
a later occupation of the site, or it may reflect continuous occupation. As discussed, it is not
clear from the data at hand how these two occupation events were related.
The age ranges produced by charcoal based dates from GbTo-31 Areas B and D (B/D) are
between AD cal 800 and 1200 and, thus, date well within the Late Period (Ames and Maschner
1999). The samples for these dates were taken from deposits interpreted as house floors
(Coupland et al. 2006). Although there are some very early dates at GcTo-6, the main period of
occupation at this site is at the very end of the Late Middle period, and extends into the Early
Late period as defined by Ames and Maschner (1999; see also Martindale and Marsden 2003).

175
Chapter 7: The Houses
Plank houses are one of the defining characteristics of 19th-century Northwest Coast societies.
At the time of European contact, explorers, and later ethnographers documented these
impressive structures through text, drawings and photographs. We know that in specific areas
of the Northwest Coast, people have been building plank houses for millennia (e.g. Coupland
1988a, 1999; Coupland et al. 2009; Grier 2001, 2006; Johnstone 2003; Lepofsky et al. 2000,
2009; Marshall 2000, 2006; Schaepe 2003), but the origin of this architectural form is not clear.
Studies of early pre-contact indigenous architecture, mainly from the south coast, have
attempted to show how houses do or do not conform to expectations drawn from these
ethnographic accounts (e.g., Ames et al. 1991; Johnstone 2003; Lepofsky et al. 2007, 2009;
Matson 2003; Schaepe 2003; Stein 2000). By contrast, discussions of pre-and post-contact
architecture on the north coast have been limited. Archaeological investigations in and around
houses on the north coast have tended to focus on house floors rather than the superstructure
(Archer 2001; Coupland et al. 2003, 2009). This is because excavating a small fraction of a
village site is a long and arduous process and few excavated houses have produced sufficient
architectural data to say much about house construction.
Understanding house construction, however, has the potential to contribute to discourse
on social and economic organization. Architecture, in anthropological circles, emphasizes how
social relations are expressed within built forms (Hillier and Hanson 1984; Lawrence and Low
1990; McGuire and Schiffer 1983). Data that provide insight into how houses were built are
important, therefore, because understanding the social meaning of houses requires insight into

176
what Johnson (1993:30) calls “the activity of building and using houses”. Northwest Coast
scholars have long contended that aspects of kinship, hierarchy and mobility are reflected in
domestic architecture, in particular the winter houses (Marshall 2000; Samuels 1991; Suttles
1991:219-220; Vastokas 1966:104-105). The specifics of Coast Salish long houses, for
instance, seem to represent a very flexible kinship structure and loosely defined hierarchy
(Suttles 1991). By contrast, north coast houses are thought to reflect well-defined kin groups
and deeply entrenched social inequalities (Suttles 1991; Vastokas 1966: 104-105).
Examining Northwest Coast architecture from the perspective of House Societies breaks
apart broad generalizations about building types and their meanings for a number of reasons.
First, households in House Societies are composed of members who may or may not be related
to each other through direct lines of kinship. Distant or non-kin may be adopted, enticed or
forced from one House to another. Members work to maintain and perpetuate the House as an
entity, but the individuals that compose them may change through time. In other words,
membership in specific Houses can be fluid. This suggests a nuanced relationship between
kinship and architecture, one that may be more complex than the idea that matrilineal descent
systems foster well-defined, permanent houses.
Second, if social change, or at least variability within a given region, is to be reflected in
the built environment, then subtle distinctions in how houses were constructed may illuminate
genuine differences in social relations among Houses. Such differences in construction may
include the interior division of space, or the means of construction, which can reflect the costs,
effort and skill involved in building domestic structures (Ames 1996; Ames and Maschner
1999:152, 250; McGuire and Schiffer 1983; Trieu Gahr 2006). In House Societies such as
contact period Northwest Coast groups, the act of building a dwelling produced the physical
structure, but also solidified House group identity (Lepofsky et al. 2009; Trieu Gahr 2006:58).

177
Third, Houses, as land-owning social units, built and maintained dwellings over multiple
generations. Longevity in occupation has been demonstrated at a number of Northwest Coast
and interior sites; many researchers (Grier 2006; Hayden 1996; Lepofsky et al. 2009) have
explored the relationship between long-term, multi-generational occupation of specific
dwellings and land tenure. Hayden et al. (1996), for example, argued that specific houses were
maintained and reconstructed for almost 1000 years in the Fraser Plateau. He has suggested that
this reflects ownership of specific locations on the landscape and the transmission of property
over tens of generations. Other researchers (e.g., Grier 2006 and Lepofsky et al. 2009)
demonstrated evidence for multi-generational use of specific dwellings over considerably
shorter periods of time (200 to 400 years). Whether or not the house depressions at GbTo-77
represent Houses, research into the longevity of these dwellings should provide a foundation for
a discussion of land tenure systems in the past.
In this chapter, I argue that construction methods across the Northwest Coast are more
varied than models derived from ethnographic materials allow. Although the data are limited, I
examine how houses might have been constructed 2000 to 2500 years ago in the Prince Rupert
Harbour area and try to understand what construction techniques might reveal about the people
who built and inhabited these dwellings. Specifically, I consider these ideas in the context of
the two excavated house depressions at GbTo-77. If social, economic and political relations are
embedded within the north coast architecture of the past 200 years, then what can earlier and
potentially different building styles reveal about social organization during the latter half of the
Middle Period (2500-1500 BP) in this area? Most important for this study, however, is the
question of whether the physical remains of dwellings represent Houses and all that this concept
entails, particularly as it relates to transmission of property, including the physical structure,
from one generation to the next.

178
Northwest Coast Architecture
In broadest terms, two kinds of houses were constructed on the Northwest Coast. Coast Salish
and Makah groups constructed large rectangular houses with shed-roofs and slung walls (see
below). In most other areas of the Coast, and on the north coast in particular, people constructed
square or rectangular gable-roofed dwellings with fitted or mortised wall planks. The difference
between the two basic house types is frequently viewed as a reflection of two kinds of social
organization, a bilateral system that provided choice in terms of residence, because individuals
can be members of more than one kin group at the same time, and a more rigid matrilineal
system (Marshall 2000; Samuels 1991; Suttles 1991:219-220; Vastokas 1966:104-105). This
position is exemplified by Suttles (1991) who argued that Coast Salish shed-roof houses served
a different social, economic and ceremonial purpose than north coast houses; contact period
Coast Salish groups constructed large and rectangular houses that could be taken apart and
changed in size with relative ease in response to the fluctuations in population that can occur in
bilateral kinship systems (Figure 7-1). House fronts were undecorated; instead, inhabitants
decorated interior house posts emphasizing individual family groups in a decidedly non-
hierarchical fashion (Suttles 1991:220). Northern groups, however, constructed square or
rectangular houses with tightly mortised walls and often with excavated interiors (Figure 7-2).
It has been argued that these houses were built for a specific group of relatives, as defined by a
matrilineal descent system (Suttles 1991). Northern houses, particularly their house fronts,
could be elaborately decorated in order to advertise the status of the household that inhabited it
(Vastokas 1966:75).

179
Figure 7-1. Coast Salish house showing the sewing and tying wall
construction technique. Late 19th
or early 20th
century photograph
(Provincial Archives of British Columbia, Victoria).
Figure 7-2. Photograph of Tsimshian house front. Fort Simpson, 1875. (Smithsonian,
Department of Anthropology).

180
Scholars such as Drucker (1965:26) and Suttles (1990:6-7) established a more detailed
typology consisting of at least five house forms. In their typologies, northern groups
constructed nearly square houses with a low-pitch gabled roof; walls, consisting of tightly
mortised planking, were incorporated into the house frame. Wakashan groups built long,
rectangular houses with low-pitch gabled roofs. In these houses, the walls were independent of
the house frame. Coast Salish groups, on the other hand, built shed-roof houses, but with siding
and dimensions like Wakashan groups. Groups inhabiting the southern extremes of the area,
such as the Chinook-Oregon Coast groups, constructed semi-subterranean gabled roof
dwellings, while Lower Klamath constructed semi-subterranean, three-pitch gabled roof houses.
Despite this variability, Drucker postulated a single, shared, but as yet unknown, origin for all
Northwest Coast plank houses types. He wrote that
[s]ufficient archaeological research has not yet been done to define the
historical relationships of the [house] variants, nor to indicate which is the
closest to the original ancestral pattern. However, deviation from a single
form is suggested by a number of distinctive features shared by two or more
subtypes. These include round-to-oval doorway, double-ridgepole, carved
posts and roof timbers, walls separate from (not supporting) the roof, gabled
roofs, a central pit, and multifamily occupancy and therefore large size, in
addition to the basic outline and material. On the basis of the overlapping
distributions of these features it seems reasonable to assume that the variants
of the rectangular plank house represent local modifications of a single
ancestral plan (Drucker 1965:25).
Significant problems exist, however, with the source material from which these
typologies are drawn. Ethnographic accounts are often based on observations of a few houses
and many very early accounts are thought to have been incorrect. Some of the first Europeans
to describe Northwest Coast houses sometimes mistook gabled roofs for shed-roofed structures
(Stein 2000:60). By the time Boas and other ethnographers began to document and photograph
indigenous structures in some detail, many houses had become influenced by European designs
and materials (Blackman 1981:xiv, 27-28; Marshall 2000; Miller 1997:48; Stein 2000:64-65).

181
Post-contact period houses are unlikely to provide an exact analogy for what we should expect
to find in pre-contact archaeological contexts. The very earliest written accounts of Northwest
Coast house construction revealed that indigenous groups built houses using iron tools acquired
through extensive and far-reaching trade networks (Blackman 1976:391; Nabokov and Easton
1989:231). Theoretically, contact and post-contact period groups using metal tools could have
constructed the same kinds of houses more quickly or with fewer people than their pre-contact
counterparts. Many scholars, however, contend that metal tools allowed for a profound shift in
the kinds of houses that were built on the Northwest Coast (MacDonald 2002:16; Nabokov and
Easton 1989:231). Throughout the region, metal tools allowed groups to construct larger and
more elaborate dwellings, with sleeping compartments, planked floors and eventually windows
and hinged doors (Blackman 1976:402-404).
Research into contact period architecture also suggests that there can be substantial
variability in housing styles within sites and even within contact period houses (Mackie and
Williamson 2003). Mackie and Williamson‟s examination of Barkley Sound village sites, on
the west coast of Vancouver Island, illustrates precisely how generalized models derived from
ethnographic sources have failed to recognize the range of building styles adopted in the late
19th and early 20
th centuries. Mackie and Williamson (2003) showed that gabled and shed-
roofed houses occurred within the same villages and, in one example within the same house;
their work serves as a cautionary tale for archaeologists hoping to elicit roofing styles from
archaeological features, as Mackie and Williamson could ascertain little difference between the
two roofing systems based on standing posts. If ethnographic models of house design gloss
over the range of architectural styles common to specific areas within a relatively recent period
in time, we should consider that houses may have been constructed in a variety of ways in the
distant past as well.

182
Methods of wall construction are also more variable than what is reflected in
conventional architectural typologies. Horizontal wall planks, supported by withe2 between two
poles (or the sewing and tying technique), is often considered specific to Coast Salish and
Makah groups (Figure 7-3). These “slung” walls were independent of the roofing structure and
were easily dismantled, so that wall planks could be used in several constructions in seasonally
occupied sites or to accommodate families moving from one group of relatives to another
(Marshall 2000:75; Suttles 1991:216).
Mortised planking was more commonly used throughout the Northwest Coast. Among
northern groups, planks were secured horizontally or vertically into mortised posts, head boards,
or sills (Figure 7-4), but many central and north coast groups sometimes constructed slung
walls. Wakashan, Nuxalk and Tlingit groups are known to have used the sewing and tying
technique to construct walls on occasion (MacDonald 1984: plate 8; Vastokas 1966:23, 49-53)
and some Kwakwaka‟wakw houses employed mortised planking for the front walls, but sewing
and tying on the side walls (Boas 1909:340-341; Drucker 1955:69; 1965:145; Vastokas
1966:45). Moreover, a memory drawing by Tsimshian artist and carver Fred Alexcee (n.d.) on
file at the Glenbow Museum Archives shows small temporary structures built partially using the
sewing and tying technique. This suggests that the method was known to the Tsimshian during
the mid-19th
century and used in some constructions, in this case, smokehouses.
2 A withe is a strong but flexible twig or shoot used in binding.

183
Figure 7-3. Diagram of a shed roof house showing
roofing structure (view a) and the house in cross
section (view b). Diagram also shows the placement
of cross-beams (C), uprights, or house posts (U),
rafters (R), poles (P) and cedar branch ropes (L)
(After Boas, from Vastokas 1966).

184
Figure 7-4. Diagram of a Tsimshian house back showing
mortised planking (from Boas).
Tsimshian Houses
From an architectural perspective, contact period Tsimshian houses are not well documented
and as such are less well understood than houses from other areas of the coast (Martindale
1999:124; Vastokas 1966:39-41). Like other northern groups, Tsimshian houses were generally
square or rectangular, with a gabled roof and mortised plank walls. Interior earthen floors were
sometimes excavated and generally not planked (Boas 1916:48; Drucker 1965:119; Vastokas
1966:40). Platforms of planks and timbers for sleeping, sitting and storage were located to each
side of the house floor and some houses had a rear partition. Nineteenth-century Tsimshian
houses are estimated to have been 100-120 m2 and housed 11-25 people (Ames 1996:140;
Coupland 1996:124). Other estimates put typical Tsimshian houses at approximately 250 m2
with populations of over 30 inhabitants (Trieu Gahr 2006:68). The most detailed descriptions
are of winter houses but summer houses, smoke houses, and storage houses were similarly
constructed, only rougher (Garfield 1966:9-11).
Nineteenth-century Tsimshian houses contained a number of attributes that emphasize

185
the House over smaller family units. First, tightly mortised walls contributed to the perception
that these houses were not easily dismantled, nor responsive to substantial changes in
membership size (Suttles 1991:219-220). Second, most houses were built with central hearths,
as opposed to multiple family hearths (Coupland et al. 2009). Even in this context,
membership in these Houses was not necessarily permanent. Some individuals and their
families, namely commoners, could move between households with relative ease. Women
moved residence at marriage and at widowhood, and often children (particularly boys) moved
to the house of their mother‟s brother (Halpin and Seguin 1990:277; Miller 1997:50-52).
Adoption and slavery were other ways Tsimshians augmented household size and moved
people between Houses (Ames 1996; Roth 2008).
Tsimshian groups also moved seasonally between their winter villages in Prince Rupert
Harbour, the Nass River in the spring and the Skeena River in the summer. Summer villages
consisted of standing structures or house frames that were walled during the fishing season
(Miller 1997:21-22). Mortised walls are theoretically more difficult to dismantle from the
frame. Suttles (1991:219-220), for example, contended that in the northern and very southern
parts of the coast, where mortised, or fitted, planks were used, walls were less easily dismantled
and that, among northern groups, planks fitted directly into the house frame were likely left in
place. Mitchell (1981) and Miller (1997:21-22) provided some evidence to suggest that winter
houses sometimes remained walled and even occupied during the spring and summer. Eulachon
oil was often stored in winter houses after the spring fishery and before the move to the summer
villages (Mitchell 1981; Halpin and Seguin 1990:269); this could suggest that these houses were
walled throughout the spring and summer. Moreover, ethnohistoric records documenting the
Kitkatla seasonal rounds show that only some of the House groups participated in the major
seasonal moves between Prince Rupert Harbour, the Nass River and the Skeena River. Others

186
remained in the winter village, or participated in hunting and fishing taking place elsewhere
(Mitchell 1981). Miller (1997:21-22) also noted that summer villages consisted of standing
structures or house frames that were walled during the fishing season. This suggests that in
some cases, Tsimshian Houses maintained multiple and consistently walled dwellings, one in
the harbour and the other at summer fishing locations.
Tsimshian winter dwellings are generally categorized into three types based largely on
descriptions by Boas (1896:852-853, 1916:46-48) and Emmons (1916). Boas documents two
house types. In Type 1 houses (Figure 7-5), the roof support system consisted of four large
posts situated midway between the central line of the house and the side walls. Primary roof
beams rested on top of these. At the roof edges two smaller eave beams were supported by four
smaller corner posts and roof planks rested on these beams. Walls were constructed
independent of the frame and consist of carefully mortised planks. The front and rear walls
were composed of very wide planks oriented horizontally. These were grooved and thinner
planks fit into them. A short plank formed the lintel above the door and on top of this rested a
thinner vertical plank. Side walls were generally constructed of horizontal or vertical mortised
planks.
The Type 2 house allows some integration of roof and walls by eliminating the smaller
group of posts; the roof planks then rest on a square beam supported by larger corner posts that
are also mortised to hold wall planks. The third roofing style, apparently unique to the Kitselas
area, was recorded by Emmons (1916). A heavy tree- trunk ridge pole was supported by the
hollowed out heads of two upright posts at the front and back of the house. This ridge pole gave
the pitch to the roof, while the lower ends of the roof planks rested on the walls.
Archaeological evidence from the early contact period on the north coast, in particular
the Tsimshian area, is scant, but what there is appears to reflect what is documented

187
Figure 7-5. Tsimshian Type 1 house showing roofing
structure independent from walls. Roof structure includes
main roof beams (B) resting on uprights (U), rafters (R),
eave beams (V) resting on corner house posts (C) (from
Boas 1916:47).
ethnographically. Martindale (1999:286-296; 2006), for example, argued that the patterning of
post moulds and standing posts at Psacelay, a late pre-contact/early contact period site, indicated
that these houses incorporated many traditional Tsimshian design elements. The architectural
evidence at Psacelay suggested that four large posts midway between the side walls and central
line of the house supported the roof; this is very similar to the type 1 or type 2 house described
by Boas. Although Psacelay house walls were less well preserved, Martindale (1999:292)
reconstructed house 2 at Psacelay with an integrated roofing structure and walls, following the
Tsimshian type 2 model. The Houses at Gitlaxdzawk in Kitselas, dated to the late 19th century,
seem to conform to the patterns of house posts and roof supports described in Emmons
(MacDonald 1981). The 18th
-and 19th
-century sites of K‟nu and Kitandach in Prince Rupert
Harbour both exhibited evidence for large cedar posts and planking (Inglis 1973). Details about

188
wall construction techniques are often obscured even in very recent archaeological contexts such
as these. There is, however, evidence for the use of wall sills from the houses at the proto-
historic period Kitwanga hillfort, in the Skeena interior, that could conform to mortised planking
(MacDonald 1993:70).
Architectural evidence concerning Middle Period plank houses is considerably less
detailed. The Paul Mason site in Kitselas Canyon produced some architectural evidence in the
form of post moulds. These houses are significantly smaller than their recent counterparts and
were probably inhabited by groups of 12-13 individuals, or two families (Coupland 1996:124).
Two houses were excavated, each containing two hearths, one in the middle and the other to the
front of the house. Coupland (1988a:137-141) identified post moulds along the mid-line of both
houses that likely supported a central ridge pole; this suggests possible long-term continuity in
roof design in the Kitselas area. Two paired external wall posts were recorded on the edges of
the house floor, but not in sufficient number to determine how the walls were constructed.
Ames and Maschner (1999:262) have suggested, however, that the paired posts “…could
indicate at least one replacement of the wall post, or the use of multiple parallel posts in the
wall, a form of construction quite unlike anything historically.” This point is pertinent to my
interpretation of architectural features at GbTo-77, as described below.
There is even less documented about Middle Period plank houses in Prince Rupert
Harbour. The earliest such houses come from GbTo-31, the Boardwalk site; these features were
partially excavated by the NCPP in the late 1960s/early 1970s, but no descriptions of
architectural features have been published. The shape of the depressions alone hints at the
nature of the houses. Coupland (Coupland et al. 2002, 2003, 2006) excavated plank houses that
date within the last 2500 years at GcTo-6, GbTo-46 and GbTo-28. House K at GcTo-6 may
have had a central house post suggesting roof design similar to what is described for the Kitselas

189
area (Coupland et al. 2002:24). Most posts at GcTo-6 however, were identified as bench posts.
As such, there is little that can be gleaned from this material about the construction of plank
houses in the harbour during this time.
Problems Associated with the Interpretation of Architectural Data
Part of the difficulty in reconstructing what these early houses looked like is that interpretation
is hampered by a variety of processes that contribute to the destruction of architectural remains,
including the behaviours and actions of later inhabitants (see Smith 2006; Stein 2000:64-65).
All along the Northwest Coast, people tended to build newer houses on top of older ones. When
houses were constructed at coastal shell middens, inhabitants deposited refuse outside the house
walls which, upon abandonment, slumped across the periphery of the house floor. When people
returned, the area was landscaped and houses constructed directly on top of the previous ones.
If houses were abandoned for longer stretches of time, other villagers might choose to use the
house depression for refuse disposal (Schiffer 1983). These factors can make the process of
distinguishing house floor deposits from refuse deposits difficult; yet differentiating these two
very different deposits is essential to understanding architecture, as well as how people lived
within houses.
Evidence from many places across the Northwest Coast shows that over the last 2000 to
3000 years, houses were frequently built and then rebuilt in precisely the same location. At
Ozette, house 2 had been built directly on top of house 5 (Samuels 1991) and, at Yuquot, on
Vancouver Island, a series of superimposed hearths suggests that for at least 400 years people
were deliberately constructing not only houses, but interior features precisely on top of pre-
existing ones (Marshall 2006:43). Grier (2006) estimates that house 2 at Dionisio Point in the
southern Gulf Islands was continuously inhabited and transmitted between generations for at

190
least 200 years. At the Palmrose site on the Oregon coast houses were built and rebuilt over the
course of 1000 years (Ames 1996). The Meier house appears to have been inhabited and
continually maintained for over 400 years; three major repairs over the lifespan of the house
generated only minor deviations from the original plan (Ames 1996:141; Ames et al. 1992;
Marshall 2006; Samuels 1991). At GbTo-77, there is evidence to suggest that the construction
of later incarnations of these houses began with digging out and levelling of some older house
features (see below).
The process by which houses were constructed, used and repaired is also obscured by the
nature of the sites themselves. Ames et al. (1992:276) have shown the problems inherent in
understanding the relationships between architectural features and the matrix surrounding them,
and this is particularly troublesome in shell midden sites. Moreover, middens, frequently used
to isolate house depressions archaeologically, do not always conform to the location of standing
architectural features. Mackie and Williamson‟s (2003) study showed that some houses had no
midden built up to the front and back. Without standing posts, this area would have appeared as
a gap in the line of houses. In other cases, two houses were standing within one depression.
The impact of tree growth, fall, and decay on archaeological sites is not well understood,
although natural taphonomic processes such as these have significant implications for the
interpretation of site formation and stratigraphy. In both house depressions at GbTo-77,
excavation was partially hampered by the very large cedar trees currently growing along the
edges of the house depressions (Figure 7-6). It is not uncommon, however, to see seedlings
growing from rotting house posts and standing poles in post-contact village sites (see
MacDonald 2002). High concentrations of roots may occur in layers of decomposing wood,
layers of decomposing litter, old root channels, in soil layers retaining a lot of water, or above
hardpan or bedrock. Red cedars will become deeply rooted where soils allow, but in the shallow

191
organic forest floor soils (and presumably those associated with shell middens), these trees will
spread most of their roots obliquely within the top 50 cm or so below the ground surface and
find support mainly by interlacing their roots with those of other trees (Els 1974; Stewart
1984:22). During excavation of this site, I noted that most roots followed the top of the shell
midden, but occasionally penetrated the top few levels of midden deposits in a lateral fashion.
In a few striking examples, large roots ran straight down through house floor peripheries. It is
possible that, in these cases, the roots are following older roots and, perhaps originally, posts.
Figure 7-6. Photograph of GbTo-77, house D
excavations showing extent of forest cover.

192
The Houses at GbTo-77
I excavated two house depressions at GbTo-77 in order to document important information
about architecture (Figure 7-7). Large areas were exposed so that entire sections of these house
depressions could be excavated simultaneously and to ensure that every effort was made to
identify and record architectural features. House D is located in the middle of the main row of
house depressions and was relatively clear of large tree fall and living trees; this made it an ideal
candidate for excavation. House A was not constructed in the same configuration as the other
houses on site. It is oriented perpendicular to the main row of houses and is smaller than the
others. As such, it seemed likely to provide the greatest contrast with house D.
The excavation of both features included the side middens between these houses and
adjacent depressions, as well as the house depression floors. The house A excavation proceeded
in two stages. For stage 1, I excavated a 2 m x 2 m unit toward the northern end of the
depression. The northwest corner of this unit was 17 m north and 24 m west of the site datum. I
subdivided this unit into 1 m x 1 m quadrants (labelled 22, 23, 25 and 26 in Figure 7-7) in order
to improve the provenience of excavated faunal remains. I recorded three dimensional
provenience for artifacts found in situ. Features and stratigraphy were mapped in plan-view
during excavation and in profiles. Excavation ceased prior to sterile subsoil in units 23 and 26
because two fragments of human bone were uncovered within midden materials. These remains
were immediately identified by David Archer (NWCC) and me as the proximal end of a human
tibia and patella. We suspected that these bones were pushed from the back midden into the
house floor area by root activity, because these remains were found within old root channels that
had penetrated the top few centimetres of the midden from the east. We contacted Barbara

193
Figure 7-7. Map of GbTo-77 showing units excavated. Unit numbers are shown within
each unit. Contour lines are in masl.
Petzelt at the Metlakatla First Nation Economic Development Office on this matter. Upon her
advice, we left the human remains where they were found and ceased excavation in this area of
the house. For stage 2 of the house A excavation, I excavated a 1 m x 2 m unit south of the
stage 1 excavation. This unit was also subdivided into 1 m x 1 m units for recording purposes
(units 27 and 24 in Figure 7-7).

194
House D was excavated through the summer of 2003 and 2004 in four stages and
followed the same recording protocol outlined for house A. For stage 1, I excavated two 2 m x
2 m units at the back, or eastern end, of the house depression. As with house A, these units were
subdivided into 1 m x 1 m quadrants. Only 7 of these were excavated (units 2, 3, 4, 5, 7 and 9 in
Figure 7-7). For stage 2 of the house D excavation, I opened a 1 m x 3 m unit, running north-
south, across the front of house D (encompassing units 13, 14 and 15 on Figure 7-7). For stage
3, 1 m x 1 m units were opened off of the stage 1 and stage 2 excavated area (units 6, 10, 11, 12,
16, 17, 20 and 21). Stage 4 focused on the excavation of units 18 and 19 (Figure 7-7). These
were the only units that were not excavated to sterile in house D, due to time constraints. My
architectural analysis focuses on house D because architectural features were more abundant and
more clearly defined here than in house A. Of the 33 post features identified at GbTo-77, only
one is associated with house A while 32 can be attributed to the house D depression.
Deciphering evidence for the rebuilding of houses from evidence for house repair was an
important consideration in my analysis. I define a construction episode as a complete, or near
complete, rebuilding. This process would include digging out and levelling off of house floors
and perhaps evidence for slight adjustments to the wall alignments. Repair, by contrast, might
include the placement of new house posts adjacent to existing ones or new bench posts. The
line between these processes may be somewhat blurred if houses were partially dismantled on a
seasonal basis; seasonal reoccupation of a house may require some repair, but also some
cleaning and levelling of house floors. In other words, cuts into the midden slump could reflect
seasonal refurbishing of the existing structure or a new construction episode.

195
House A: Stratigraphy and Architectural Features
House A is located at the northern end of the midden, almost perpendicular in orientation to the
main row of houses. It is the smallest of the six surface house depressions at this site and
measures approximately 3 m x 4 m from approximately half way up the midden slope. The
stratigraphy in this house depression is complex and suggests that many different kinds of
activities took place in this area, and that it was not consistently used as a dwelling.
The basic stratigraphic sequence for house A can be summarized into four zones. Zone
1 refers to lot 1, the forest litter, humic topsoil and a grey leached mineral deposit immediately
underneath it. This deposit ranged from 30 cm to 50 cm in thickness. Zone 2 consisted of a
black silt deposit with gravel inclusions that is immediately underneath the humus. On top of
shell deposits, this zone is relatively thin, often less than 10 cm in thickness. Zone 2 also
included an architectural feature located along the east wall of the house A depression and lot 2a
(discussed below). Zone 3 consisted of all shell-bearing deposits; these were located underneath
lot 2 and generally represented refuse midden. Two deposits within this zone were significantly
different from the refuse midden deposits and these are discussed below. Zone 4 is located
below the shell-bearing deposits; it consists of two gravel deposits (lot 8 and lot 9) with low
densities of shell and sediment.
As mentioned above, architectural interpretations of house A are limited because we
were only able to complete excavation in four 1m x 1m units due to the discovery of isolated
and scattered human remains in the middle section of the depression. The only conclusive
architectural feature associated with this house depression was a single squared post uncovered
along the east wall during the excavation (Figure 7-8). As such, little can be said about how this
structure was built beyond that it may have been of post-and-beam construction. It should be
noted, however, that posts are not always associated with dwellings, or even buildings. During

196
Lot Composition
1 Humus and forest litter
2 Dark brown/black schist gravel and sand with a high organic component
2c Black silt with a high organic component, some schist gravel
3 Broken barnacle and fine particle sand. Some fire cracked rock (FCR) and broken clam
3c Grey/black sand and whole and broken clam, mussel, green sea urchin and broken barnacle
4 Grey/black loamy sand with some broken and crushed shell (mostly barnacle, but also broken clam)
6 Black silt with some broken shell and schist gravel
8 Grey/black loamy sand and schist gravel. Some charcoal flecks
9 Orange schist gravel and sand
Figure 7-8. Profile of east wall of house A. Lot 2c is a post mould and represents the only
conclusive architectural feature associated with this house depression.
197
the post-contact period, posts were erected for a variety of purposes. Photographs of 19th
century Tsimshian villages, for example, show fish-drying racks and frames that could produce
post moulds in archaeological contexts (Halpin and Seguin 1990:270; Miller 1997:22).
I identified a levelled occupational floor (lot 8) at the back of the house that is
particularly well-defined within the west and north wall profile (Figure 7-9; 7-10). This deposit
consists of gravel and coarse sand, much like the sterile substrate (lot 9), but also included
scattered vertebrate and invertebrate remains, as well as a single artifact, that were likely pushed
into the gravel substrate through trampling. I identified no hearth within this house depression
and in fact, there was a distinct lack of charcoal staining within the house A living floor deposit.
There is, of course, the possibility that a hearth or hearths might be found beneath unexcavated
shell midden deposits within the central area of house A.
The southern, or front, end of the house depression appears to have been quite different.
Shell accumulation occurred only at the peripheries of the depression. A small straight-sided
lobe of shell was uncovered along the west wall on top of the lot 8 (lot 3d in Figure 7-9). This
may have been formed as shell collapsed between square house posts or through bench supports.
Coupland (Coupland et al. 2006:30) has observed similar features in the centre of one house
floor at GbTo-28 and has suggested they may be shell-filled baskets left on the floor when the
house was abandoned. The deposits in house A are composed of mixed and broken shell in
black sandy-loam and in this way look like refuse midden. A relatively pronounced dip in
elevation toward the middle of the depression here suggests also that less care was taken in
preparing the floor toward the house front, or that in fact, this area lies outside the house
altogether.
The most perplexing feature associated with house A is the wide and straight break in
the midden along the north wall and a similar feature along the west wall (labelled lot 2a and lot

198
Lot Composition
1 Humus and forest litter
2 Dark brown/black schist gravel and sand with a high organic component
3b Mostly whole and broken clam, mussel, green sea urchin and barnacle in grey/black sand. Some FCR
3d Grey/black sand with whole and broken clam, mussel, green sea urchin and broken barnacle. Some
FCR
7 Reddish brown loam with small and medium sized roots
8 Grey/black loamy sand and schist gravel. Some charcoal flecks
9 Orange schist gravel and sand
Figure 7-9. Profile of the west wall of house A.

199
Lot Composition
1 Humus and forest litter
2 Dark brown/black schist gravel and sand with a high organic component
2a Black silt with a high organic component. Heavy schist gravel inclusions toward the bottom
2b Black silt with a high organic component, some schist gravel
3 Broken barnacle and fine particle sand. Some fire cracked rock (FCR) and broken clam
4 Grey/black loamy sand with some broken and crushed shell (mostly barnacle, but also broken clam)
3b Mostly whole and broken clam, mussel, green sea urchin and barnacle in grey/black sand. Some FCR
3c Grey/black sand and whole and broken clam, mussel, green sea urchin and broken barnacle
8 Grey/black loamy sand and schist gravel. Some charcoal flecks
9 Orange schist gravel and sand
Figure 7-10. Profile of the north wall house A.

200
7 respectively) (Figure 7-9 and Figure 7-10). Lot 2a is composed of black silt with a high
organic content. The first 40 cm of this lot was very greasy and contained few inclusions. Lot
2a narrowed into a straight-sided oval-shaped feature, extending 15 cm into the natural
substrate. The lower levels of this deposit contain schist gravel inclusions in addition to black
silt. The feature‟s shape and location along the back wall might indicate that it is architectural
in nature. Favourable comparisons could be made with the wall plank features Ames (Ames et
al. 1992, 1999) has identified in south coast houses. Ames identified large plank moulds 10 to
20 cm deep and 30 to 100 cm wide. The wall trenches constructed to support the base of the
wall planks were up to 30 cm deep. These features were filled in and re-excavated many times;
frequently, rock, artifacts flora and fauna were found as a part of the fill used to support both
planks and posts (Ames et al. 1992:280-281).
The stratigraphy for the north wall of house A, however, suggests that Lot 2a may have
been excavated through midden material deposited on top of the house floors and thereby
represents a post-abandonment process, perhaps a pit. In this regard, it shares common elements
with feature 1 at GbTo-46. The GbTo-46 pit feature was excavated into the north wall of House
J and probably served as a burial at some point, as a few scattered human remains were found
near its surface (Coupland et al. 2006:7-8). This is unusual for the area because most midden
burials, such as those excavated at Greenville (Cybulski 1992) and GbTo-31 (Ames 2005a:78-
89) were generally shell-filled. The GbTo-46 feature also has a distinctive bell-shape which is
lacking from the house A feature, though strait-sided pits are not unknown on the Northwest
Coast. Ames et al. (1992) describe a series of large pit features that form a cellar at the Meier
site. These pits, upwards of 2 m deep and straight-sided, were uncovered along the corridor
between the benches and the hearth complex. At Cathlapotle, some pits were found underneath
benches, against the side walls and, in one case, underneath the wall trench (Ames et al.

201
1999:52). The human remains found in the house A depression are likely not associated with
the feature, because they were uncovered within an old root channel that penetrated the midden
surface emanating from the eastern edge of the house depression.
I excavated small portions of lots 2a and 7 and my interpretation of these features is
based largely on their profiles. Consequently, it is difficult to draw firm conclusions about what
these features represent. Lot 2a and lot 7 intersect all lots along the north and west walls,
including lot 8, the original living floor deposit. A few fish bones were found in lot 2a, in
addition to an artifact toward the bottom of the feature and one at the interface with the shell
midden deposits closer to the surface. This might suggest that lot 2a is a pit, although the
combined data and location of the feature suggests it could also be the remains of wall planks,
excavated into the subsoil and filled in with gravel and refuse. The presence of gravel is equally
ambiguous; gravel could have been used as fill in both pits and to secure wall planks. Lot 7,
however, has a heavy humic component suggesting that it consists of masses of rotting tree
roots. This is further supported by the composition of Lot 5, which seems to originate within lot
7 and extends out across the surface of lot 6. Lot 5 is composed of red/brown silt and also may
be decaying root masses that originated from a larger root system that permeates lot 7.
Unfortunately, I cannot be certain if lot 7 was originally a feature associated with this house
depression that later fostered tree growth, or whether this feature was a root system to begin
with.
From these data, it is difficult to conclude for certain that house A was, in fact, a house.
The original living floor, lot 8, was prepared toward the back of the depression, but not at the
front. This deposit is not significantly different in terms of matrix from the natural substrate and
this suggests that cultural material identified within lot 8 may have been pushed into the existing
substrate through trampling. Alternatively, lot 8 may represent the repeated action of

202
inhabitants bringing gravel from the beach in to line their living or working space, perhaps as it
became too dirty or muddy. A cut in the midden slump observed in the west profile of the house
depression suggests the floor area was cleared of shell, perhaps after a period of disuse. The
front area of the structure may have incorporated the natural topography as there is no evidence
to suggest that lot 8 was levelled at the front of the depression. Refuse midden accumulated
across the surface of lot 8 toward the back of the depression, but not at the front; shell deposits
in units 24 and 27 were patchy at best. Given that auger testing in front of the main row of
house depressions indicated that midden in this area was also patchey, the data from units 24
and 27 suggest that this area may have been outside the structure. This would render the house
A depression less than 3 m in length. More importantly, it suggests that the house A structure
may have been very small. The small depression, combined with the lack of a clearly defined
bench area and midden, hearths or charcoal stained floor deposits suggested to me that this
structure may not have been used as a domestic dwelling. The presence of sporadic broken shell
within the floor deposits is in marked contrast to the house D floors discussed below; it may
indicate that broken shell was not viewed as an impediment to the kinds of activities that took
place within this structure and as such, may result from activities not generally undertaken
inside domestic dwellings. In fact, this structure might have served as additional work or
storage space. Alternatively, house A may represent a domestic house that was in use for a very
short period of time. A short-lived dwelling might not produce the kinds of well developed or
defined floor deposits that I observed in house D (see below). To reiterate, I cannot rule out the
existence of a hearth in the central area of house A, and as such, I cannot conclude that house A
was not a domestic dwelling.
Lot 4 differs slightly from other refuse midden deposits (Figure 7-11). Lot 4 consists of
a black sandy loam, but with significant quantities of broken shell (approximately 25%),

203
Lot 2
Lot 4
Lot 4a
Lot 4 a
Lot 3a/b
Unexcavated
.
Lot 7
0 50 100 cm
50
100 cm
N
Unit 25 Unit 22
Unit 26 Unit 23
Rocks
Lot Composition
1 Humus, forest litter and leachate
2a Black silt with a high organic component. Heavy schist gravel inclusions toward the bottom
3a Broken barnacle and fine particle sand. Some fire cracked rock (FCR) and broken clam
3b Mostly whole and broken clam, mussel, green sea urchin and barnacle in grey/black sand. Some FCR
4 Grey/black loamy sand with some broken and crushed shell (mostly barnacle, but also broken clam)
4a Two small deposits of green sea urchin
6 Black silt with some broken shell and schist gravel
Figure 7-11. Plan view of house A, showing lots 2, 3, 4 and 4a opening.
including a high proportion of barnacle (approximately 47% of all shell in this sample- see
Appendix D). As discussed in chapter 8, barnacle is well represented in most other back midden
deposits. As such, I consider lot 4 a refuse midden deposit. Lot 6, however, differs
considerably from other refuse midden deposits (Figure 7-12). Lot 6 is composed of black silt
and large quantities of schist gravel (57% of all materials), with a high organic component,
some vertebrate fauna and very little broken shell (2.6%). It covers most of the back area of the
house depression, but is absent in the front units. It is not clear what this deposit represents, but
it is interesting that it is confined to the area above the living floor (lot 8) and not in unit 24 or
27, which may in fact lie outside the original house. Lot 6 could represent additional living
floors associated with house A as a dwelling or perhaps additional work space associated with
an alternate structure in this location.

204
Lot Composition
2a Black silt with a high organic component. Heavy schist gravel inclusions toward the bottom
3c Grey/black sand and whole and broken clam, mussel, green sea urchin and broken barnacle
6 Black silt with some broken shell and schist gravel
7 Reddish brown loam with small and medium sized roots
7-12. Plan view of house A showing lot 2a, 3c, 6 (opening) and 7.
House D
House D, the centre house depression within the main row of five houses, was excavated in
considerable detail. It measures approximately 6 m x 4 m (again as measured from
approximately half way up the side midden slope), with its short axis facing the shore. 11.2 m3
of this house depression was excavated, including a large area across the back, and central area
of the house depression. Excavation focussed on the south side of the house depression in order
to acquire as much architectural information as possible from contiguous units, and the central
area of the house floor; I was able to excavate only a very small section of the northwest area.
From this, I generated extensive plan views and long profiles that transect the house depression
in a number of locations. These provide significant insight into how this house was constructed,
used, reused and ultimately abandoned.
Lot 3c
Lot 6
Lot 2a
Lot 7
Unexcavated
0 50 100 cm
50
100 cm
N
Unit 25 Unit 22
Unit 26 Unit23

205
Stratigraphy
The stratigraphy for house D shows a very different kind of occupation and use than house A.
Because of the larger scope of this excavation, I designated lots (deposits) by units, rather than
the whole house. I summarize the house D stratigraphy here into zones: humus, black silt with a
high organic component and gravel, and shell-bearing deposits.
Zone 1. Forest litter, humus: As in house A, humus covered the surface of the house
depression, ranging in thickness from 40 cm to 80 cm.
Zone 2. Black silt with a high organic component and gravel. This layer of black, greasy
silt was found immediately beneath lot 1. This deposit appears to share many characteristics
with a “greasy black soil” (Coupland et al. 2006:10) or a “black midden” (Ames 2005a:80)
observed at other sites in the harbour. At the peripheries of the house depression, this layer is
thin (less than 5 cm) and is immediately on top of shell deposits. In some locations the black silt
was very thick and, during excavation, these areas soon emerged as architectural features or the
house floor area. Architectural features, however, were of loose compaction and contained few
gravel inclusions; by contrast, house floors were compact and contained large quantities of
schist gravel. Floor deposits were also identified by charcoal staining and ash scatters.
Zone 3. Shell midden: The most commonly occurring shell deposits within the house D
excavations emanate from the side middens. These are mostly homogenous deposits of shell,
gravel and sand or sandy-loam sediments at the house floor peripheries. Most of this represents
material that was deposited between the houses while they were occupied and later slumped
across the house floor edge when the houses were abandoned. Toward the front, a separate
deposit of finely crushed shell, ash, and charcoal was uncovered toward the bottom of the inside
wall. I interpret these deposits as bench-midden material following Coupland et al. (2006:8).

206
Stein (1992) cautions that, because settling occurs in middens over time, differences in midden
deposits that relate to particle size could result from natural taphonomic processes. However,
the lower deposits inside the house walls are very different from the lower deposits located
outside the house walls. Exterior house deposits consist of discrete and easily identifiable shell
deposits that are composed largely of a single species or two; in other words, they look much
like back-midden deposits. This suggests that side middens, like back middens, were formed by
a series of shell dumps. The upper deposits become mixed as inhabitants dig out and replace
posts or wall planks. Further mixing of deposits likely occurred when the house was abandoned
and the midden material slumped across the house floor, only to be excavated out as the entire
house was rebuilt at another time.
Architectural features
Thirty-two of the post moulds identified during excavation may be associated with house D
(Figure 7-13). I identified post features by their sediment composition, colour and compaction;
posts are composed of loose black organic silt with occasional gravel inclusions. Nonetheless,
these features were most easily detected in shell midden deposits. Post moulds varied in size,
depth, shape and location within the house depression. I categorize these posts into three sizes,
small (10-15 cm diameter), medium (20-30 cm diameter) and large (>35 cm) (Martindale
1999:227-231). The patterning of these features indicates that post moulds of different sizes
likely served different functions.
The smallest posts are found within the house-floor and midden-slump deposits. Eight
round post moulds, measuring between 10 and 15 cm in diameter were organized in a loose
configuration at the edge of the house floor, less than a metre from where the walls were likely
constructed (see below). These posts were probably wooden stakes; they were shallow, often no

207
Figure 7-13. Floor plan of house D, showing the location of post features, hearths and the
approximate location of the house wall (created by Jennifer Melanson and Jonathan
Sharpe).

208
more than 10 to 15 cm in depth. I interpret these as bench posts because of their position in
relation to the house walls, their narrow size and short length. A bench supported by these posts
would have been less than a metre wide. All eight post moulds bottomed out between 100 and
110 cm below the surface, suggesting they relate to the same occupation. A single, small post
mould was also identified in the vicinity of hearth 1 in unit 2. Martindale (1999:230)
documented posts alongside hearths at Psacelay, set vertically into the ground, as is the case
here.
I identified seventeen medium sized post moulds within the south side midden in units
17, 18 and 21. These post features are loosely arranged in two or three rows, following the
orientation of the south side midden berm. They are irregularly shaped, deep, post moulds.
These features began directly underneath the humic layer and were initially visible as two much
larger irregularly shaped features consisting of loose black silt. Further excavation revealed,
however, that these two features actually consisted of two groups of posts (cluster 1 and cluster
2), approximately 20 to 30 cm in diameter, extending between 80 and 100 cm below the surface.
I identified at least seven medium-sized posts in cluster 1; four of these can be easily observed
in Figure 7-14. Cluster 2 posts were not as easy to discern from each other as were the cluster 1
posts. I used the bottom elevations for the cluster 2 posts to identify nine separate medium-
sized posts (Figure 7-15). An additional medium-sized post (the sixteenth) may be related to
cluster 2, but it is separated from this group by almost 1 m. The cluster 1 posts may relate to an
initial house D wall, while the cluster 2 posts may relate to a second wall, and could reflect a
second construction episode for House D.
This configuration of posts might be similar to what Ames and Maschner (1999:262)
have gleaned from the Paul Mason site floor plans. The architectural evidence from the Paul
Mason site is extremely limited, but Ames and Maschner suggest that a single pair of small

209
Figure 7-14. Medium-sized posts associated with cluster 1, house D.
*148
*165
*171
*160
*169
*156
*167
*159
Shell midden
Shell midden
Post 1
post 2
post 4
post 5
post 6
post 7
post 8
post 9
post 3
Figure 7-15. Cluster 2 wall posts showing variability in depth below site datum
that was used to identify individual house posts.

210
posts at the edge of a house floor may indicate that these houses were constructed very
differently from the Tsimshian houses that are documented for the 19th century. Although Ames
and Maschner do not elaborate on what this ancient architectural form might have looked like,
the Paul Mason house posts have something in common with the features I present for house D
and I suggest that these posts may be consistent with the sewing and tying technique. Post-
contact period houses constructed using this method did not generally position posts close
together, but neither were they built within shell middens or shell ridges. Moreover,
photographs and plans of houses that use this kind of wall construction reflect a single moment
in the life cycle of the structure. As such, archaeological evidence for slung walls likely
represents the cumulative effect of frequent rebuilding and repair episodes. Matson (2003)
documented the results of these processes at the Shingle Point site on Valdez Island in the Gulf
of Georgia.
As Figure 7-16 illustrates, the processes of repairing and rebuilding slung walls over
time produce clusters and sometimes short rows of small posts along house edges. The shell
ridges between houses at GbTo-77 could have served as a useful building material (Blukis Onat
1985; Stein 2000), but also helped to keep posts in place. Walls could be repaired by
positioning new posts next to old and rotting ones. This might produce the clustering of posts
evident along the south wall. Two groups of posts arranged in short rows may represent
multiple and complete reconstructions of house D, and suggests that the position of the house
wall may have shifted slightly during a reconstruction episode. Alternatively, the more
southerly wall may have been part of the north wall of house E. If my interpretation of these
medium sized posts is correct, then house walls may have been constructed differently in the
past than what has been broadly observed in the contact and post-contact period (e.g., Boas

211
Figure 7-16. Floor plan of the Shingle Point house, Gulf of
Georgia. Small posts within oval on the right are interpreted
by Matson as evidence for the sewing and tying technique
(from Matson 2003).
1916; MacDonald 1993; Martindale 1999). The sewing and tying methods may have been
known to 19th -century Tsimshian groups, but this method has not been documented at large
semi-permanent winter dwellings. This may have been an oversight on the part of 19th-and 20
th-
century ethnographers, or it may indicate that architectural styles changed through time in this
region.
Large posts were located well outside the house floor area. The size and location of all
large posts suggests they could have supported eave beams. Three large posts were identified
along the south wall. One post appeared slightly squared in shape and is particularly large,
measuring 45cm x 45cm and extending a metre in depth from directly underneath of the humic
layer. This suggests that it was likely left in place when the house was abandoned. Three large

212
posts were also identified within the north side midden, in between house depressions C and D.
These posts were only partially excavated, but judging from their profiles, these posts measured
approximately 40 cm in diameter. The posts within the north side midden are not as well-
defined as those within the south side midden (or the south wall posts) and there is currently an
extensive root system running through one north post feature. The location of the north wall
posts in relation to the house C and house D depressions suggests that the two northerly posts, in
unit 18, could have been associated with house C and the most southerly post, in unit 19, may
have been part of the house D construction.
Hearths
Two hearths were encountered toward the centre and back of house D. Hearth 1 and hearth 2
were only partially excavated so the full dimensions of these features are unknown. Both
hearths consisted of a lower layer of charcoal and an upper layer of ash, indicating hot burning
fires (Martindale 1999:231-238). Hearth 1 is the larger of the two hearths and appears to have
been in use for a longer period of time (Figure 7-17). Hearth 1 has a characteristic basin-shape
and is defined at its base by two small boulders. It measures approximately 30 cm in depth and
is at least 50 cm wide. A small deposit of charcoal (lot 7) in unit 12, however, may in fact be
the western extent of this feature, in which case, hearth 1 would measure over 1 m across. As
noted in chapter 6, a charcoal sample from hearth 1 produced a calibrated age range of 1430-
1120 cal BC (3040 +/- 60 BP; T12056). This is significantly earlier than calibrated age ranges
from the rest of the site and likely represents a hiatus between wood cutting and wood burning
events.
Hearth 2 appeared to be slightly smaller, although very little of this feature was
excavated. It measures 20 cm in depth and is approximately 50 cm in across. This hearth

213
Figure 7-17. North-south cross-section of house D showing floor deposits (unit 20, lot 3 and unit 13, lot 3) as well as hearth 1 and 2
discussed in text.

214
Legend for Figure 7-17
Unit Lot Description of stratigraphic deposit
Unit 20 Lot 1 Humus
Lot 2
Black silt with a high organic component and schist gravel inclusions
Lot 3 Charcoal stained schist gravel.
Lot 7 Grey/brown sand and schist gravel
Unit 13
Lot 1 Humus
Lot 2 Black silt with a high organic component and schist gravel inclusions
Lot 3 Charcoal stained schist gravel
Lot 7 Ash deposit
Lot 7a Charcoal deposit
Lot 8 Grey/brown sand and schist gravel
Unit 12
Lot 1 Humus
Lot 2 Black silt with a high organic component and schist gravel inclusions
Lot 3 Large flagstones and boulders
Lot 4 Large flagstones and boulders
Lot 5 Deposit of dispersed charcoal and gravel
Lot 6 Large boulder
Lot 7 Charcoal stained schist gravel (possible edge of hearth 1)
Lot 9 Grey/brown sand and schist gravel
Lot 10 Brown sand and schist gravel
Lot 12 Orange schist gravel and sand
Unit 7 Lot 1 Humus
Lot 3 Black silt with a high organic component and schist gravel inclusions
Lot 4 Schist gravel in mottled brown/black sediment
Lot 5 Small deposit of finely crushed shell
Lot 7 Large boulder
Lot 22 Small deposit of ash and finely crushed shell
Lot 24 Black silt and gravel
Lot 25 Ash and charcoal (hearth)
Lot 26 Large boulder

215
feature lacks a distinctive basin-shape, but is composed of two distinct layers, one of charcoal and one
of ash. I also noted black silt and gravel (i.e., floor deposits) above this hearth at approximately 150
cm below site datum. Hearth 1, however, still appears to have been in use when floor deposits covered
hearth 2, suggesting that hearth 2 fell into disuse prior to hearth 1. A large area of cobble and boulder-
sized stones were found between the two hearths in three continuous layers. The lowest levels of these
stones and boulders correspond stratigraphically with the bottom of the two hearths. While they do not
form a neat rock lining or box for the hearths, they may have been part of a paved area between the two
hearths. Some of the top rocks could have been used within the house and are perhaps related to
cooking. Alternatively, some may have been used as roof rocks (rocks used to hold roof planks in
place), which fell into the house floor once the house was abandoned.
Floors
House floors were perhaps the most difficult architectural feature to identify within house D. This is a
common problem in Northwest Coast household archaeology. Grier (2006) noted that individual house
floor deposits were extremely difficult to isolate at Dionisio Point; he viewed house floor deposits as
“the cumulative results of multiple processes rather than a series of discrete living floors” (Grier
2006:103). This describes well the kind of floor deposits that I observed in house D. As I noted for
house A and the back midden, I encountered a layer of black silt and gravel immediately below the
humic layer. In side midden contexts, the black silt layer was very thin, but in house floors, this
deposit was as much as 40 cm thick and contained significant quantities of gravel. The gravel
component increased in abundance through the central house floor area and it was often difficult to
distinguish floor deposits from sub-floor sterile gravels. Sterile gravels were often, though not always,
lighter in colour (grey/black) than the floor deposits. The floor area was particularly well-defined

216
toward the centre of the house depression within the vicinity of the hearths (see Figure 7-17); at 150-
155 cm below site datum, I encountered a 10 cm thick deposit of charcoal stained schist gravel (lot 3,
units 20 and 13) in front of the hearths. Small pockets of ash and crushed shell ranging in size from 10
to 30 cm in diameter were found within this charcoal stained floor area, but otherwise, the house D
floor area was generally shell-free. A number of factors suggest that there may have been earlier and
later house floors that have been obscured by natural and cultural processes. Toward the back of the
house, black silt and gravel continued below the Hearth 1, suggesting earlier house floors may have
been partially obscured by later activities. Moreover, a clear cut into the gravel subsoil of about 15 cm
in depth (Figure 7-18) is a full 35 cm below the hearth area described above and could reflect efforts of
inhabitants to level the subsoil prior to house construction. There is no indication of a buried humic
layer, indicating that the first thing the people who built house D would have done is remove the forest
floor material.
The north-south cross-section of house D revealed that side midden shell deposits were
immediately adjacent to, and even underneath, black silt and gravel deposits at the edge of the house
floor. Sections of side midden, therefore, have an almost step-like character, particularly evident in
Figure 7-19. This might indicate that house floors were replenished with gravels periodically, perhaps
when the house was reoccupied seasonally or reconstructed. Small pockets of shell, measuring 10 to
15 cm across and 2 to 3 cm in depth were found within the house floor deposits at the edge of the house
floor. These may represent refuse material dropped at the peripheries of the living area. As the floor
was periodically replenished, perhaps seasonally, small fragments of bench or slumped refuse midden
appear to have been buried in the floor deposits. Inhabitants may also have periodically removed floor
deposits during cleaning.
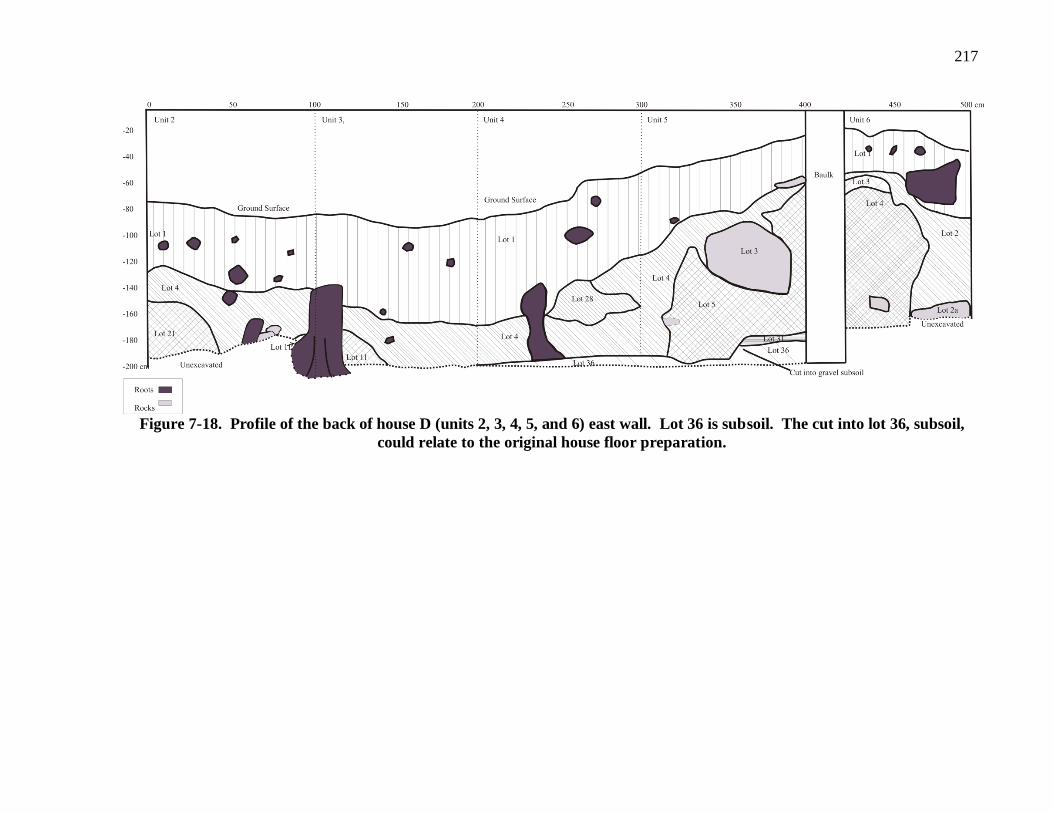
217
Figure 7-18. Profile of the back of house D (units 2, 3, 4, 5, and 6) east wall. Lot 36 is subsoil. The cut into lot 36, subsoil,
could relate to the original house floor preparation.

218
Legend for Figure 7-18
Unit Lot Description of stratigraphic deposit
Unit 2 Lot 1 Humus
Lot 4 Black silt with a high organic component and schist gravel inclusion
Lot 21 Grey/black fine particle sand with broken, mixed shell
Unit 3
Lot 1 Humus
Lot 4 Black silt with a high organic component and schist gravel inclusion
Lot 11 Grey/black fine particle sand with broken, mixed shell
Unit 4
Lot 1 Humus
Lot 4 Black silt with a high organic component and schist gravel inclusion
Lot 28 Dense red silt and schist gravel
Lot 36 Orange stained gravel and sand
Unit 5
Lot 1 Humus
Lot 3 Large boulder
Lot 4 Black silt with a high organic component and schist gravel inclusion
Lot 5 Grey/black sandy-loam with broken, mixed shell; loose compaction
Lot 31 Black silt; wet and compact
Lot 36 Orange stained schist gravel and sand
Unit 6
Lot 1 Humus
Lot 2 Black silt with a high organic component and schist gravel inclusion
Lot 2a Large boulder
Lot3 Grey fine particle sand and whole clam shell; loose compaction
Lot 4 Grey/black sandy-loam with broken, mixed shell; loose compaction

219
Figure 7-19. Profile of house D in cross-section. Units 18 and 19 show the cross-section of the north wall
area. Units 13 through 17 show a cross-section of the mid-floor area through to the southern wall area.

220
Legend for Figure 7-19
Unit Lot Description of stratigraphic deposit
Units 18, 19 Lot 1 Humus
Lot 2 Black silt with a high organic component and schist gravel inclusions
Lot 3 Grey/black fine particle sand with broken, mixed shell
Lot 4 Dispersed fragmented shell in grey/black sand.
Lot 7 Thin, crushed shell, mostly mussel.
Unit 13
Lot 1 Humus
Lot 3 Black silt with a high organic component and schist gravel inclusions
Lot 8 Grey/brown sand and schist gravel
Unit 14 Lot 1 Humus
Lot 3 Black silt with a high organic component and schist gravel inclusions
Lot 8 Grey/brown sand and schist gravel
Unit 15 Lot 1 Humus
Lot 3 Black silt with a high organic component and schist gravel inclusions
Lot 4 Grey/black sandy loam with broken clam shell
Lot 6 Black silt with a high organic component and schist gravel inclusions
Lot 7 Grey/brown sand and schist gravel
Lot 9 Orange sand and gravel
Unit 16
Lot 1 Humus
Lot 2 Black silt with a high organic component and schist gravel inclusions
Lot 5 Grey/black sandy loam with broken clam shell
Lot 21 Black silt with a high organic component and schist gravel inclusions
Lot 23 Grey/brown sand and schist gravel
Unit 17 Lot 1 Humus
Lot 2 Black silt with a high organic component and schist gravel inclusions
Lot 3 Grey/black sandy loam with broken clam shell
Lot 7 Grey/black sand with broken clam shell, crushed mussel shell and
gravel
Lot 13 Ash and charcoal deposit
Lot 14 Grey/brown sand and schist gravel
Lot 15 Orange sand and gravel

221
I was able to identify bench midden deposits only toward the house front; I interpret lots
3a and 3b in unit 21 as bench midden (Figure 7-20). In the front area of the southern wall, I
identified bench midden beneath side midden deposits. Bench middens consisted of finely
crushed shell, ash and charcoal. These deposits provided me with the only reliable date and
faunal material from house D. The single radiocarbon date from this deposit places this
occupation of house D somewhere between 400 and 190 cal. BC (2250 +/-50 BP).
The consistent deposition of shell material between houses may also have served an
architectural purpose. Stein (2000:65-72) posits that the use of shell in and around house
features may also have helped to insulate dwellings, particularly if the walls were not carefully
mortised. Posts were also secured within these deposits and Blukis Onat (1985) has argued that
shell deposits may have been used to support benches. If so, this could have profound
influences on our interpretations of bench-midden deposits, because it suggests that there may
be considerable mixing of bench middens with architectural shell deposits. At GbTo-77,
however, deposits of ash and finely crushed shell were clearly visible toward the front of house
D and I defined them as such.
Understanding the history of house D
Conclusions regarding house D are more robust than those for house A and are useful to the
ongoing discussion of early architecture in this area. The house was initially constructed on top
of sterile gravel deposits and not into pre-existing midden. The accumulation of floor deposits
that include some gravel suggest that house floors may have been frequently replenished,
perhaps in conjunction with seasonal reuse of this house. Alternatively, house floors may have
been periodically dug out and cleared of debris.

222
Lot Description of stratigraphic deposit
1 Humus
2 Black silt with a high organic component and schist gravel inclusions
3 Grey/black fine particle sand with broken, broken barnacle, marine snail and clam shell;
loose compaction
3a Black sandy loam with small fragments of barnacle, clam, marine snail and mussel shell
and schist gravel
3b Black sandy loam with small fragments of barnacle, clam and mussel shell and schist
gravel
5 Grey/brown sand and schist gravel
Figure 7-20. House D bench midden (lot 3a and 3b) underneath collapsed side midden (lot 3)
from the front area of the south wall.

223
House D may have been reconstructed in a substantial way at least once, after what
appears to have been a relatively short period of abandonment. The available evidence cannot
shed light on the length of each occupation, nor the period of time between the abandonment of
one house and the reconstruction of another on the same spot. Unlike house A, the location of
house D was never treated as a place to dump shell and other refuse by other village inhabitants.
This distinct lack of shell in the central area of the house suggests that the time between house
occupations is quite short. Small deposits of shell mixed within floor deposits at the periphery
of the floor area may reflect side-midden deposits falling in over the floor edges during floor
cleaning, wall repair, or short-term dismantling associated with seasonal moves.
We can, however, glean some further insight into the length of occupation of house D
through the wall and house posts. Medium-sized wall posts appear to have been replaced
periodically, but these are likely to have rotted fairly quickly given their circumference. The
single, large square house post could have been in use for almost a half-century, according to
Trieu Gahr (2006). A slightly smaller and circular post located immediately adjacent to the
square post could represent a replacement house post, or at the very least an additional support
post that was added after the house had been in use for some time, perhaps approaching or
surpassing 50 years. The evidence for a slight shift in the orientation of the south wall posts
may also reflect a rebuilding of this house, as opposed to seasonal repair. If the inhabitants of
house D needed to replace walls composed of narrow posts every 20 to 25 years (Trieu Gahr
2006: Table 7), then this structure was inhabited for a period of time representing a generation
or two.
While two hearths suggest that house D could have been originally inhabited by two
small families or an extended family, hearth 1 appears to have been in use for a longer period of
time. Coupland et al. (2009) recently argued that single, central hearths may reflect the tensions

224
that exist within transegalitarian societies between communalism and hierarchy. Elites may
choose to encourage communal feasting around central hearths so as to present themselves as
benevolent and generous, and to foster support for their House. A prime example of this
arrangement is house O at GcTo-6, where a single large hearth, upwards of 3m in length and
over a metre across, was uncovered within the central area of the house depression in
association with a marine clay-lined floor (Coupland et al. 2003:161-162). This seems to me
quite a different scenario than the one presented by house D at GbTo-77; Hearth 1 is not
particularly large, nor is there evidence that it shifted from the back area of the house toward the
middle, as might be expected from the house O example. Although it is possible that two
families began to use the same hearth at the back of the house, under the auspices of emerging
elites, it seems just as likely that household membership was in decline. Additional hearths
might however, be located in areas of the house that were not excavated.
The architectural features reveal little about how the house was roofed. The series of
medium posts along the south wall, however, suggested that the house walls may have been
constructed using the sewing and tying technique. What this might reveal about the inhabitants
of house D is discussed in chapter 9.

225
Chapter 8: The Faunal Data
In the preceding chapter, I argued that the architectural and stratigraphic evidence from GbTo-
77 revealed that the dwelling represented by house D was maintained and, may have been
reconstructed on at least one occasion, over a period of time that likely represents decades, if not
more than one generation. An emphasis on place (sensu Ames 2006 and Marshall 2000, 2006)
such as this suggests that dwellings and their locations might have been owned and that
mechanisms were in place to ensure the transfer of some houses from one generation to another.
The house D stratigraphic and architectural data, however, appear to reflect a far shorter period
of continuous occupation than has often been observed elsewhere on the Northwest Coast ( e.g.,
Ames 1996; Grier 2001, 2006; Lepofsky et al. 2009). In and of itself, therefore, the house D
evidence does not prove that the house depressions at GbTo-77 represent Houses, or that the
wa’lp was guiding the way individuals and groups organized as early as 2500 years ago. People
might choose to use existing house depressions for constructing houses for a variety of practical
reasons. Chief among these would be the presence of pre-existing architectural features,
particularly if the span of time between one occupation and another by an unrelated group, is
short.
In this chapter, I examine whether there are indications in the faunal remains that house
depressions at GbTo-77 represent Houses as defined by Lévi-Strauss (1982). Of particular
interest is the degree to which patterning in the faunal remains can be used to infer the existence
of owned resource locations or estates, a fundamental characteristic of House Societies. If the
house depressions we excavate are indeed Houses, we should expect to find evidence for land

226
tenure strategies within their archaeological remains. Betts (2005) has recently argued that
diversity within economic systems and intensification are often key facets of territoriality.
Territoriality in this sense is a strategy that is generally adopted by groups of people inhabiting a
larger region. If, however, the basic social and economic group is the House, then we could
expect the same kind of variability to occur at this small scale. In this case, it is not so much
territoriality as land tenure. Land tenure, or ownership implies that exclusive control of
resources and of specific locations on the landscape is more likely to develop where important
resources are abundant, yet spatially and seasonally circumscribed (Dyson-Hudson and Smith
1978). This is indeed the situation on the north coast, and Prince Rupert Harbour is no
exception (Gottesfeld 1994; Turner et al. 2005:167-169). Do we have evidence for
intensification and diversity in the economic strategies adopted by people living within the
harbour 2500 to 1000 years ago? If so, how might it demonstrate ownership?
Central to this dissertation is the problem of how small households, whether they are
Houses or not, made a living. This pragmatic question brings together concepts of
human/environment interaction, as well as intra and inter-household relations (Ames 2006;
Marshall 2000; Sandstrom 2000). Unfortunately, the kinds of artifacts that survive and were
uncovered during excavation at GbTo-77 and other sites reveal little specific information about
hunting, gathering and fishing. The artifact assemblage from GbTo-77 consists mostly of awls,
which are ideal for basket-and net-making, but shed only indirect light on how resources might
have been captured and harvested. This means that our ideas about how specific resources were
harvested and processed must be drawn from faunal remains, knowledge of the local ecology
and hypotheses drawn from ethnographic descriptions and ethnoarchaeological observations
(Colley 1990).
Faunal data provide one of the most important vehicles for understanding the economic

227
decisions that were made by the inhabitants of specific dwellings. Because I wish to explore
whether or not the house depressions at GbTo-77 represent Houses, I consider the question of
whether, and to what extent, resource locations were owned during the latter half of the Middle
Period, when GbTo-77 and most of the other sites in this study were inhabited. If resource
locations were owned, how can we demonstrate this archaeologically?
These questions draw the discussion toward the on-going debate about the nature of
social organization in Prince Rupert Harbour during the Middle Period (Ames 2005a; Ames and
Maschner 1999; Archer 2001). As discussed in Chapter 1, studies of social organization in
Prince Rupert Harbour have tended to focus on settlement layout and house size. Two models
concerning social organization emerge from this body of work. The spatial organization of the
houses in relation to each other is central to the first model (Ames 2005a). Ames contends that
single-row villages, likely kin-based, reflect egalitarian social relations. Villages with multiple
rows, by contrast, represent more than one kin group, the organization of which facilitates, but
does not require, social ranking. In this latter arrangement, each kin group occupies a single
row, a pattern observed among a number of northern groups in the 19th century (Vastokas
1966:100-101). The second model is built around the idea that the distribution of house
depression sizes is related to social relations. Villages with relatively equal-sized house
depressions represent egalitarian social organization, while those exhibiting considerable
variability in house depression size reflect social ranking (Archer 2001; Coupland 1988a). From
either assessment, GbTo-77 is an egalitarian village composed of small households.
The character of, and reasons behind, the shift from egalitarian to ranked villages is not
fully understood. Archer (2001) and Martindale and Marsden (2003) contend that the shift was
rapid, the consequence of historical circumstances. Ames (2006) and Coupland (1996) have
tended to view the shift as integrated with changing household economy, specifically the

228
intensive production of salmon. Investigations of faunal remains at larger sites, such as GcTo-6,
reveal evidence for considerable inter-house variability in terms of resources, although salmon
is ubiquitous (Coupland et al. 2003). Much is not understood about the extent to which salmon
intensification played a role in burgeoning social inequality in the harbour (Ames 2006; Archer
2001; Coupland 1996), nor is there agreement on how to recognise it archaeologically (Ames
2005:244; Ames and Maschner 1999:161-163; Archer 2001; Coupland 2006:93; Coupland et al.
2010). Coupland (1988a), for instance, interprets the Paul Mason site as an egalitarian village
from the site‟s relatively equally sized house depressions. Faunal preservation is very poor at
this site, but 96.7% of the faunal remains were identified as fish; only seven specimens were
positively identified as salmon (Coupland 1988:381-382). The site‟s location at Kitselas
Canyon on the Skeena River, in conjunction with the faunal material and evidence for year-
round occupation, suggested to Coupland (1988) that inhabitants fished and processed salmon
for storage as early as 3000 BP. While this might indicate that large-scale salmon fishing and
storage was well within the capacities of small households, as Coupland (1996) contends, it is
not clear how the Paul Mason site is directly comparable to small households in Prince Rupert
Harbour. As a result, there is no real understanding of the kinds of economic strategies that
underlie what are presumed to be egalitarian villages in the harbour, nor has there been much
consideration of the way in which social inequalities may have permeated relations among
settlements. Inequalities may not have occurred in all facets of life simultaneously, and thus any
discussion of social organization must consider the complexities that may have existed across
multiple scales of interaction.
GbTo-77; the vertebrate faunal assemblage
Sampling and Screening Methods

229
A total of 20,420 vertebrate faunal specimens were collected from GbTo-773. In the field, I
screened 75% of the excavated material through one-quarter inch mesh (6.35 mm) and 25%
through one-eighth inch mesh (3.18 mm). I refer to the faunal material collected in this manner
as the excavated sample. I identified additional vertebrate fauna within the column, auger and
bulk samples that I sorted and analyzed, with the help of volunteers, in the lab. In this study,
column, bulk and auger samples were sorted using 6.3 mm, 2.8 mm and 1.4 mm nested screens.
Following Ham (1976:43) and Pacific Identification, I sorted material from every second sample
in a column. I selected bulk and auger samples from locations that I had missed, or
underrepresented, during excavation. As time allowed, I added additional samples from specific
columns; as a result, I was able to analyze most of the samples in the unit 5 column. I identified
all vertebrate material in the 6.3 mm and 2.8 mm screens and 25% of vertebrate faunal remains
in the 1.4 mm screen, following Coupland‟s screening protocol (Coupland pers. comm.). I refer
to the faunal material collected from column, bulk and auger samples as the equal volume
samples. The equal volume samples provide a unique opportunity to examine material caught in
small screens (1.4mm) that is generally underrepresented in the larger mesh (May 1979;
McKechnie 2005; Moss 2007). The faunal remains collected during excavation, together with
the faunal specimens collected from column, bulk and auger samples in the lab, produced a total
site assemblage that provides a sample of the breadth of animal taxa that the inhabitants of
GbTo-77 hunted, collected and fished. Many Northwest Coast scholars have noted the
importance of examining both kinds of faunal assemblages for this very reason (e.g.,
McKechnie 2005; Moss 2007; Stewart et al. 2003). Sample elements of equal volume samples
also provided a standardized way of comparing the densities of major fauna from specific
3 Please note that the faunal assemblage presented here differs slightly from Coupland et al. 2010. I present two
additional site contexts in this chapter, the north side midden (excavated sample) and auger 11 (equal volume
sample).

230
locations within the site.
Vertebrate Quantification Practices
Most of the faunal material was identified using the zooarchaeological collection at the
University of Toronto. I also made preliminary identifications of fish remains using an
archaeological collection compiled by Dr. Trevor Orchard. These identifications were
confirmed with the assistance of Dr. Kathlyn Stewart using the collection at the National
Museum in Ottawa. Dr. Mark Peck granted me access to the Ornithology collection at the
Royal Ontario Museum in order to identify avian faunal material in my sample. I also made
frequent use of written sources, such as Yee Cannon (1987), Hart (1973), Godfrey (1986) and
Banfield (1974).
I sorted specimens initially into class; for those identifiable beyond class, I recorded the
family, genus and, where possible, species. I also noted element name, portion represented, sex,
side, size and evidence for cut and burn marks. The avian specimens in this sample were
particularly difficult to identify beyond family. While it proved difficult to identify many fish
remains, particularly salmon, beyond genus, some elements, such as the basipterygium, were
tentatively identified to species (see Appendix B). I made little distinction among vertebrae,
though I identified where possible the ultimate and penultimate vertebrae, as well as atlas and
axis in fish.
Much has been written concerning methods used to assess the taxonomic abundance
represented in vertebrate faunal samples (Banning 2000:93-115; Grayson 1984; Reitz and Wing
1999:191-238). On the Northwest Coast, many faunal analysts use NISP, or Number of
Identifiable Specimens, which is simply the count of specimens within each taxonomic
category. The method is relatively reliable for inter-site comparisons where species

231
composition is expected to be similar and where sites are likely subject to similar taphonomic
processes (Banning 2000:95). NISP is, therefore, a good method for use in comparing data from
village sites in Prince Rupert Harbour; in this case from village sites on Digby Island. Its
outcomes depend, however, on a myriad of factors, including the number of bones within the
body of a given living animal, the hunting, butchery and disposal practices that created the
archaeological deposit, excavation and recovery strategies of researchers, and fragmentation
(Banning 2000:94-96). To correct for these problems, many faunal analysts use derived
measures such as Minimum Number of Individuals (MNI). MNI reduces the sample to the
minimum number of individuals per taxon that are represented by the assemblage. Some
researchers argue that derived methods such as MNI are necessary to convert raw data into
culturally-meaningful units, but the method is equally prone to problems of preservation,
fragmentation and sample size. MNI also tends to overestimate the importance of rare animals
and is particularly sensitive to how faunal material is aggregated (Banning 2000:101-102;
Grayson 1978; Reitz and Wing 1999:194-195).
Although excavations focused on two house depressions, a total of six separate contexts
were identified. The back midden consists of faunal material from unit 1, the midden material
along the east wall of house A, and material from the northeast corner of house D. Two side
middens were sampled; between houses C and D (the north side midden) and between houses D
and E (the south side midden). The side middens represent material that was deposited between
houses and cannot be specifically linked to the occupation of any particular house. A
fundamental problem that emerged with the inter-house depression comparison of faunal
remains is rooted in the fact that few deposits could be linked to specific houses depressions or
occupations. No hearth or bench midden was identified in house A, though a small sample of
faunal material was collected from the house A floor. Vertebrate faunal remains likely were

232
preserved here because of the small shell fragments in the floor deposits. The house D floors,
however, contained virtually no shell and, consequently, almost no vertebrate faunal material
was collected from the floor deposits in this house. Instead, the house D faunal remains was
collected mainly from hearths and bench middens. This means that the faunal samples from
house A and house D may reveal as much about disposal patterns and levels of preservation as
they do about resource procurement strategies that could be linked to specific house depressions.
A final area, between house B and house C, is represented by two auger samples (A11-1 and
A11-3).
Approximately half of the faunal material in the excavated sample was unidentifiable
beyond mammal, bird or fish. Of that which could be identified beyond class, over 95% are
fish, 3.7% mammals and less than 1% bird.
Fish
The fish remains from GbTo-77 are overwhelmingly dominated by salmon species. This is true
also when the excavated sample is divided into five samples based on location within the site
(Table 8-1). Herring, the second most commonly occurring taxon, were found in much lower
proportions across the site. Numerous other species are represented in the site assemblage, such
as smelt (mostly eulachon, but also capelin and indeterminate smelts), dogfish and greenlings,
but in very small proportions.
There are, however, a number of problems associated with an analysis that relies on
relative frequencies, and these are well documented (Banning 2000; Begler and Keatinge 1979;
Claassen 1998; Grayson 1984). Because the relative abundance of one taxon depends on the
abundance of all others, a difference in the proportion of herring, for example, between samples
may not reflect a difference in the actual quantity of herring. This is particularly troublesome in
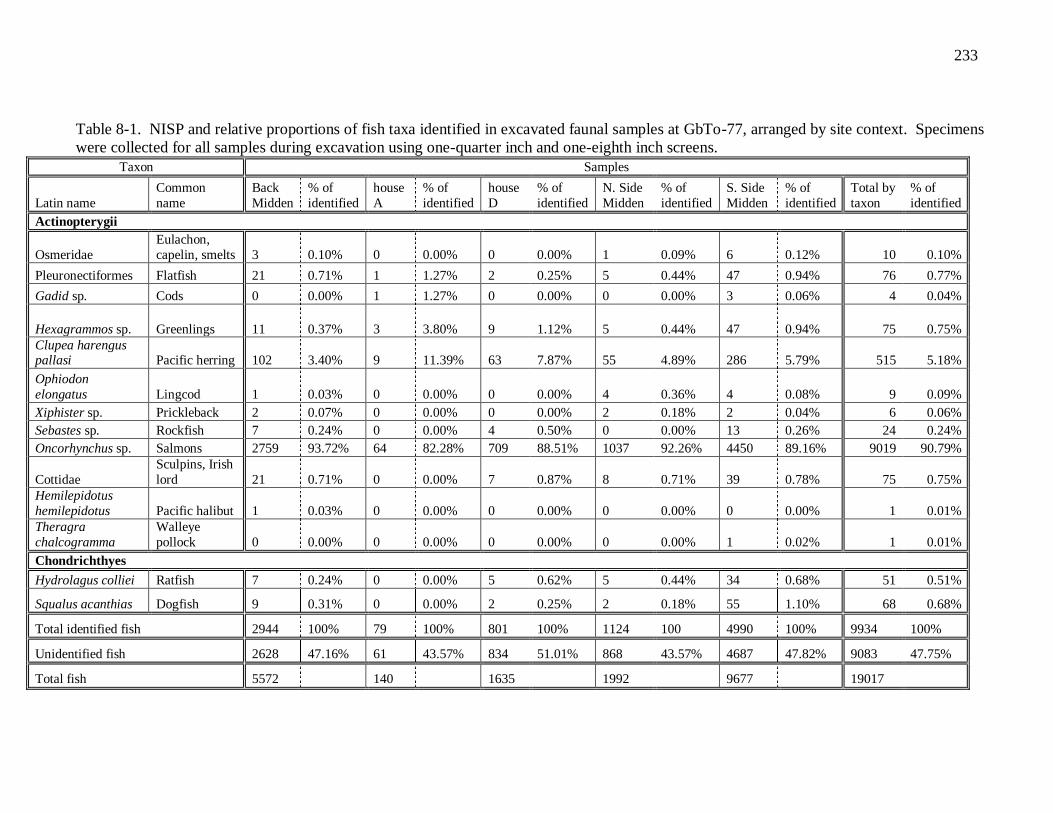
233
Table 8-1. NISP and relative proportions of fish taxa identified in excavated faunal samples at GbTo-77, arranged by site context. Specimens
were collected for all samples during excavation using one-quarter inch and one-eighth inch screens.
Taxon Samples
Latin name
Common
name
Back
Midden
% of
identified
house
A
% of
identified
house
D
% of
identified
N. Side
Midden
% of
identified
S. Side
Midden
% of
identified
Total by
taxon
% of
identified
Actinopterygii
Osmeridae
Eulachon,
capelin, smelts 3 0.10% 0 0.00% 0 0.00% 1 0.09% 6 0.12% 10 0.10%
Pleuronectiformes Flatfish 21 0.71% 1 1.27% 2 0.25% 5 0.44% 47 0.94% 76 0.77%
Gadid sp. Cods 0 0.00% 1 1.27% 0 0.00% 0 0.00% 3 0.06% 4 0.04%
Hexagrammos sp. Greenlings 11 0.37% 3 3.80% 9 1.12% 5 0.44% 47 0.94% 75 0.75%
Clupea harengus pallasi Pacific herring 102 3.40% 9 11.39% 63 7.87% 55 4.89% 286 5.79% 515 5.18%
Ophiodon
elongatus Lingcod 1 0.03% 0 0.00% 0 0.00% 4 0.36% 4 0.08% 9 0.09%
Xiphister sp. Prickleback 2 0.07% 0 0.00% 0 0.00% 2 0.18% 2 0.04% 6 0.06%
Sebastes sp. Rockfish 7 0.24% 0 0.00% 4 0.50% 0 0.00% 13 0.26% 24 0.24%
Oncorhynchus sp. Salmons 2759 93.72% 64 82.28% 709 88.51% 1037 92.26% 4450 89.16% 9019 90.79%
Cottidae
Sculpins, Irish
lord 21 0.71% 0 0.00% 7 0.87% 8 0.71% 39 0.78% 75 0.75%
Hemilepidotus
hemilepidotus Pacific halibut 1 0.03% 0 0.00% 0 0.00% 0 0.00% 0 0.00% 1 0.01%
Theragra
chalcogramma
Walleye
pollock 0 0.00% 0 0.00% 0 0.00% 0 0.00% 1 0.02% 1 0.01%
Chondrichthyes
Hydrolagus colliei Ratfish 7 0.24% 0 0.00% 5 0.62% 5 0.44% 34 0.68% 51 0.51%
Squalus acanthias Dogfish 9 0.31% 0 0.00% 2 0.25% 2 0.18% 55 1.10% 68 0.68%
Total identified fish 2944 100% 79 100% 801 100% 1124 100 4990 100% 9934 100%
Unidentified fish 2628 47.16% 61 43.57% 834 51.01% 868 43.57% 4687 47.82% 9083 47.75%
Total fish 5572 140 1635 1992
9677 19017

234
examples such as this one, where salmon dominate all samples, making fluctuations in other
taxa seem almost negligible (Banning 2000:99-100). For this reason, I also used the equal
volume samples to compare faunal material between site contexts based on density (NISP/litre
of matrix). As discussed earlier, I took one-litre units of site matrix from a number of locations
across the site, either as column, auger or bulk samples. I took four column samples from the
house D area (units 5, 6, 17 and 21). Due to time constraints, I sorted and identified the faunal
material from four of these columns. I identified most of the samples within these four columns
as belonging to the south side midden. In other words, most of the faunal material within these
four columns accumulated between houses while they were inhabited and slumped across the
house floor edges upon their abandonment. I identified two samples only that belonged to house
D specifically (unit 21 lot 3a and 3b). These deposits were noted as possible bench midden
during excavation; they contain noticeable quantities of ash and crushed shell. I took a single
column of samples from the back midden (unit 1) and from house A (unit 22). Most of the
samples from the unit 22 column were identified as back midden deposit as opposed to house
deposits. These deposits consisted of whole shell or large fragments of shell and little schist
gravel. As such, samples from lot 3 and lot 4 in unit 22 were grouped with other back midden
samples from unit 1. I also sampled smaller shell deposits in bulk that did not articulate with
unit walls during excavation; I include two in this analysis. In addition, I took a number of
auger samples from across the site. Time prevented me from examining the vast majority of
these, although I present two samples from Auger 5 and two from Auger 11 here. I present a
complete listing of all materials identified within each sample by mass in Appendix D.
The density of fish is very high in the equal volume samples (15.12 NISP per litre of
matrix) compared with mammals and birds (.29 and .06 NISP per litre of matrix, respectively).
Column sampling, as a method, tends to under-represent mammalian taxa and this may

235
contribute to the paucity of mammal remains within these samples. Salmon, smelt (or
osmerids), and herring were the only fish identified to family or lower within the equal volume
samples. I identified specific species of smelt with the help of Dr. Kathlyn Stewart at the
National Museum in Ottawa. Between the equal volume samples and the excavated samples, I
identified 45 smelt (or osmerids). A subsample of 25 smelt was analyzed with a microscope.
Twenty-two (88%) were positively identified as eulachon and two specimens were identified as
cf capelin (8%). The twenty-fifth specimen was identified as “smelt indeterminate”. This
suggests that the vast majority of the smelt remains from GbTo-77 are probably eulachon. At a
minimum, of the total 49 smelt, almost 45% are eulachon (Table 8-2).
Table 8-2. NISP and relative proportions of smelt positively identified to species.
Eulachon cf Capelin
Smelt
indeterminate Total Smelt
NISP 22 2 25 49
Relative
proportion of
all smelt
44.89% 4.44% 51.02% 100%
Table 8-3 presents the NISP, relative proportions and average density of these major fish
taxa identified within equal volume samples by site context. While herring composed a mere
5% of the site assemblage and smelt were virtually non-existent, these species are well
represented in the equal volume samples. Salmon still dominate, but compose just over 40% of
the identified fish. Herring compose approximately 23% and smelt compose almost 34% of the
identified fish remains in equal volume samples. Smelt are well represented in house D (65%)
and to a lesser extent in the south side midden (37%). Herring is also well represented in house
A and house D, but also in the back midden and side midden. These samples, however, are
very small and this likely influences some of the patterning in relative proportions.

236
Table 8-3. NISP (N), relative frequency and density (D) of major fish taxa identified in equal volume samples, organized by site location. Each
sample is 1 litre in volume. Specimens were collected during sample analysis in the lab using nested screens (6.3 mm, 2.8 mm and 1.4 mm).
Identified
fish
Back Midden
(7 samples)
Auger 11
(2 samples)
South Side Midden
(9 samples)
house D
(2 samples)
North Side
Midden
(3 samples)
house A
(1 sample)
Total GbTo-77
(24 samples)
N % D N % D N % D N % D N % D N % D N % D
Salmon 18 62.1% 2.57 7 87.5% 3.5 20 37.7% 2.22 1 4.4% 0.5 0 0 0 1 33% 1 47 40.5% 1.96
Herring 7 24.1% 1.00 1 12.5% 0.5 13 24.5% 1.44 7 30.4% 3.5 0 0 0 2 67% 2 30 23.3% 1.13
Smelt 4 13.8% 0.57 0 0 0 20 37.5% 2.22 15 65.2% 8 0 0 0 0 0% 0 39 33.6% 1.63
Total 29 100% 4.14 8 100% 4 53 100% 5.56 23 100% 12 0 0 0 3 100% 4 116 100% 4.71

237
Following Cannon (2000, 2001), I also calculated densities in relation to the <1.4 mm
fine fraction (Table 8-4). These density figures may be more accurate reflections of overall
densities because this method controls for variability in coarse shell between samples. The fine
fraction itself, however, may also vary from location to location depending on the level of shell
crushing. Moreover, there is no way to control for inconsistencies among sites in terms of
sediment accumulation, which might be expected in greater quantities within the house
depression than in the back midden.
Table 8-4. Density of major fish taxa collected from all screens in equal volume samples,
calculated in relation to fine fraction (<1.4 mm). This table excludes the north side midden
context because no vertebrate faunal remains were recovered from the column and auger
samples taken in this area of the site.
Identified
fish
Back
Midden Auger 11
South side
midden house D house A
Total
column
sample fish
Salmon 17.48 14 10.96 2.67 11.11 12.6
Herring 6.8 2 7.12 18.67 22.22 8.04
Smelt 3.88 0 10.96 40.00 0.00 10.46
Total 29.59 16 27.40 61.33 33.33 31.1
Both measures of density showed that the composition of fish taxa in the equal volume
samples is strikingly different from the picture presented in the site assemblage. Density in
comparison to the fine fraction is very high, and may be over representing all fish. In terms of
density, smelt are almost as abundant as salmon and better represented than herring. Both
relative proportions and density values indicate that, while salmon were critical, herring, and
particularly smelt, were far more important at GbTo-77 than would have been determined from
the site assemblage alone.
The density of the three major fish taxa also exhibits significant variability across the
site. The highest density of fish remains in relation to the fine fraction was found in the house D
deposits, followed by house A and the back midden. Although samples are small, the density of

238
salmon is greater in external midden deposits than in house deposits. By contrast, herring and
smelt are generally more abundant in house deposits (Figure 8-1). I used chi-square to test the
association between site context and fish taxa using density figures derived from the litre matrix
and from the 1.4mm fine fraction. I combined house deposits and exterior middens because the
house A NISP was too small to be examined independently (Shennan 1997:104-118). The
results show that an association exists between fish taxa and site context (8.14; .01<p-
value<.001 and 36.82; .00001<p-value). This suggests that the preponderance of small fish
Figure 8-1. Graph showing densities of major fish taxa in relation to < 1.4 mm fine
fraction identified in equal volume samples arranged by site context.
elements in houses is not a product of sampling but, rather, may reflect genuine disposal
patterns. Small fish bones would have been more easily lost inside the house than larger salmon
bones. Herring and eulachon bones would also be much harder to remove from the house
during cleaning because of their small size.
Mammals and Birds
Mammalian remains were generally more difficult to identify beyond class and, as a result,
relatively small proportions of mammal bones were considered identifiable. The site‟s
assemblage is dominated by canid remains and none of these was positively identified as wolf.
0
5
10
15
20
25
30
35
40
45
Back Midden Auger 11 South side midden
house D house A
Salmon
Herring
Smelt

239
It is likely, however, that domestic dog was not part of the food economy for three reasons.
First, Northwest Coast ethnographies consistently show that, all across the region, people kept
domestic dogs for hunting, as pack animals and, in some instances, for their fur (de Laguna
1990a:190, 1990b:208-209; Renker and Gunther 1990:427; Suttles 1990:460-461). Although
dogs were occasionally consumed as a part of the dog-eater ceremonies, dogs were not generally
eaten (Arima and Dewhurst 1990; de Laguna 1990a, 1990b Hamori-Torok 1990; Mitchell 1990;
Suttles 1990). Second, 65% of canid remains come from a single context in the back midden,
and likely represent a dog burial. Dog burials have been found in a number of midden contexts
across the Northwest Coast (e.g., Cannon et al. 1999; Severs 1974:198). In the Rupert area dog
burials have been found at GbTo-28 (Coupland et al. 2006) and at the Greenville Burial Ground
site at the Nass River (Cybulski 1992). The remains of multiple dogs were also found at GbTo-
31. Seventy-seven percent of the dog remains at GbTo-31 were found within area A/C, the back
midden, where human burials were also common (Cybulski 1992:64-65). According to
Cybulski (1992:65) at least some of the dog remains represented intentional interments and one
was directly associated with human remains. Two of the three dog burials at Greenville were
also found in association with human remains, and in one example, the dog remains appeared
cradled within the upper arm and chest of an adolescent male (Cybulski 1992: 63). These data
suggest to Cybulski (1992) that dogs were given special treatment in death, likely because these
dogs were owned by village inhabitants. Many of the Greenville dog remains, however, also
exhibited evidence for butchery (Balkwill and Cybulski 1992:82-83) and this may suggest that
dogs were also sometimes eaten, or their remains used for raw materials. Alternatively,
Cybulski (1992:66-67) speculated that the presence of dogs in burials exhibiting cut marks
might reflect ritual consumption of dogs, not unlike the Dog Eaters ceremony practiced by post-
contact period Tsimshians (Garfield 1939:305-312,1966:45-46). Initiation into the Dog Eaters

240
society was not inherited, but was open to any individual with access to enough wealth (through
House affiliation) to undertake the initiation ceremony. The presence of dog remains with
human burials, such as has been observed at GbTo-31 and the Greenville Burial Ground,
therefore, might reflect the wealth and high status of the household to which that person
belonged. It is conceivable, however, that many individuals or households owned dogs in ways
that have little to do with wealth. These dogs may have played important economic roles, in
hunting, for fur, or other raw materials, but may not reflect wealth. Regardless, domestic dogs
were probably viewed very differently from wild taxa.
Third, only one of the 55 dog elements identified showed possible evidence of cut
marks. As such, I recorded NISPs for canids, along with small rodents, below the main list of
taxa (Table 8-5) and excluded them from the analysis (sensu Orchard 2007:235).
Four unidentified mammal bones were noted within the back midden and south side midden
equal volume samples (See Appendix B).
In the revised mammalian assemblage, 124 specimens were identified beyond class.
Cervids (most of which are deer) and harbour seals dominate the excavated sample. Other taxa
are represented in much smaller quantities and these include mountain goat, beaver, bear, whale,
mink, fox, red squirrel and cougar. These animals may have been hunted for food and also raw
materials, such as skins, hides, furs, bone and antler. Approximately 54% of the identifiable
mammal bones are sea mammal that, in addition to those sea mammals listed above, include sea
lion, fur seal and sea otter. I observed considerable variability in mammalian remains when the
assemblage was divided into sub-samples based on site context. Most significantly, sea
mammals were prevalent in and around house D, but poorly represented in the back midden and
house A. The very small sample of mammals from house A means that much of this variability
likely results from sampling. Given the single context (the house floor) from which faunal

241
Table 8-5. NISP and relative frequencies of mammal elements identified in the GbTo-77 excavated sample, organized by site location.
Mammalian taxon Samples GbTo-77 Totals
Latin name
Common
name
Back
Midden
% of
identified
house
A
% of
identified
house
D
% of
identified
North
Side
Midden
% of
identified
South
Side
Midden
% of
identified
Total
by
Taxon
% of
identified
Artiodactyls
Cervids Deer 13 81.25% 1 100.00% 1 3.85% 0 0.00% 27 38.57% 42 33.87%
Oreamnos
americanus Goats 0 0.00% 0 0.00% 2 7.69% 2 18.18% 3 4.29% 7 5.65%
Carnivora
Ursus sp. Bear 1 6.25% 0 0.00% 1 3.85% 0 0.00% 1 1.43% 3 2.42%
Enhydra lutris Sea otter 0 0.00% 0 0.00% 0 0.00% 3 27.27% 8 11.43% 11 8.87%
Tamiasciurus hudsonicus Mink 0 0.00% 0 0.00% 0 0.00% 0 0.00% 1 1.43% 1 0.81%
Zalophus californianus
Northern sea lion 0 0.00% 0 0.00% 0 0.00% 0 0.00% 3 4.29% 3 2.42%
Callorhinus ursinus
cynocephalus
Northern
fur seal 0 0.00% 0 0.00% 0 0.00% 0 0.00% 1 1.43% 1 0.81%
Phoca vitulina
Harbour
seal 2 12.50% 0 0.00% 16 61.54% 4 36.36% 15 21.43% 37 29.84%
Felis concolor Cougar 0 0.00% 0 0.00% 0 0.00% 0 0.00% 1 1.43% 1 0.81%
Vulpis fulva
abietorum Red fox 0 0.00% 0 0.00% 2 7.69% 0 0.00% 2 2.86% 4 3.23%
Cetacea
Cetacea Whale 0 0.00% 0 0.00% 0 0.00% 0 0.00% 7 10.00% 7 5.65%
Rodentia
Marmota
monax
Red
squirrel 0 0.00% 0 0.00% 0 0.00% 0 0.00% 1 1.43% 1 0.81%
Castor
canadensis Beaver 0 0.00% 0 0.00% 4 15.38% 2 18.18% 0 0.00% 6 4.84%

242
Total identified mammals 16 1 26 11 70 124
Small rodent 1 1 1 2 8 13
Unidentified sea
mammal 1 0 5 11 9 26
Canis sp. Dog/wolf 37 0 5 2 12 56
Unidentified mammals 83 12 99 31 313 538
Total mammals 138 14 136 57 412 757

243
material was collected from house A, statistical tests measuring whether the variability between
contexts is greater than the variability within contexts cannot be used in this instance.
The avian assemblage is very small, totalling 137 elements, 77 of which could be
identified beyond class (Table 8-6). Of these, the most frequently occurring bird elements are
ducks (including mallards, mergansers, scoters and eiders) and geese (predominately Canada
geese). I was unable to identify most duck elements beyond family and only 9 specimens to
species (see Appendix B). The assemblage also includes gulls, loons, birds of prey (mostly
eagles) and song birds, as well as a single swan and woodpecker element. No avian remains
were identified in Auger 11; two unidentified avian remains were noted within back midden and
house A column sample faunal remains (see Appendix B).
GbTo-77; The Shellfish
In addition to providing a means of comparing vertebrate faunal densities within and across
sites, equal volume samples were a useful way of looking at the shellfish taxa that compose the
midden, as well as variability in the level of shell fragmentation. Banahan and Patton (2008)
showed that the primary factor influencing shellfish composition at a sample of 11 sites in the
harbour, including village and camp sites, is the immediate environment, in particular the
presence of sandy or rocky foreshores. I expected, therefore, that the shellfish assemblage at
this and other village sites would probably represent shellfish collected from shorelines in the
immediate area. This is not uncommon in Northwest Coast shell midden sites. Many
archaeologists have noted the association between shoreline habitat and the taxa that compose
shellfish assemblages (Ham 1976; Moss 2004; Orchard 2007). Moss and Erlandson (2010),
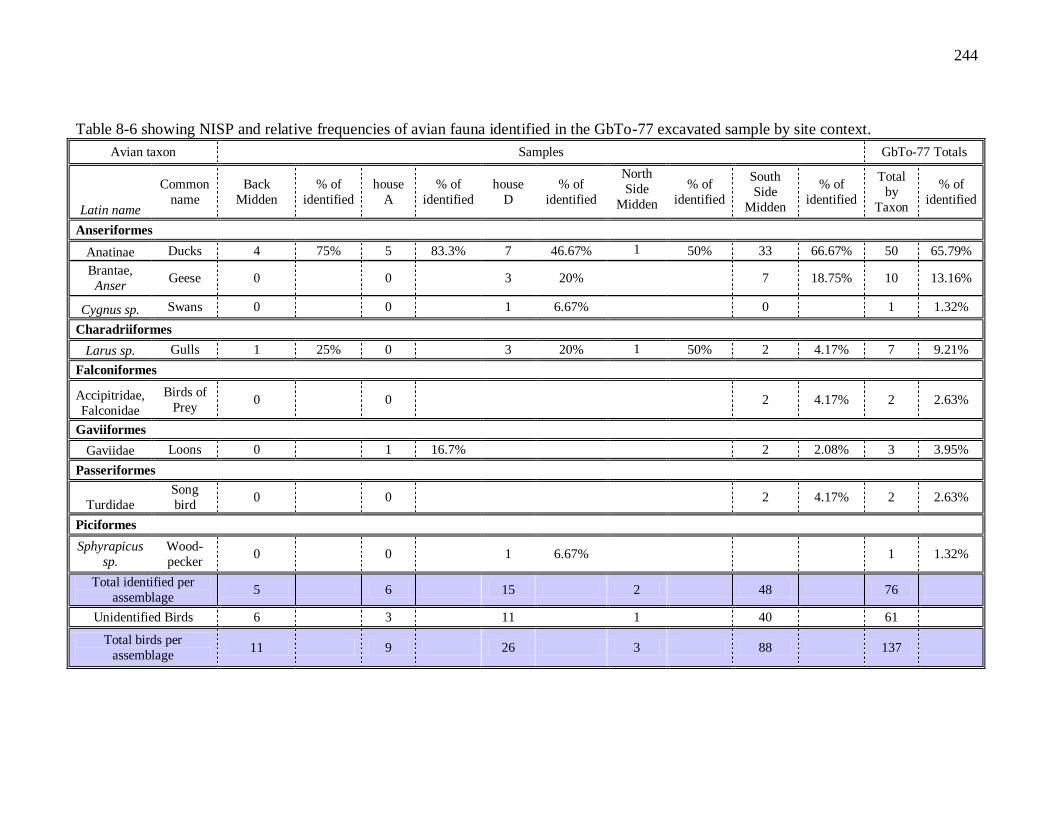
244
Table 8-6 showing NISP and relative frequencies of avian fauna identified in the GbTo-77 excavated sample by site context.
Avian taxon Samples GbTo-77 Totals
Latin name
Common
name
Back
Midden
% of
identified
house
A
% of
identified
house
D
% of
identified
North
Side
Midden
% of
identified
South
Side
Midden
% of
identified
Total
by
Taxon
% of
identified
Anseriformes
Anatinae Ducks 4 75% 5 83.3% 7 46.67% 1 50% 33 66.67% 50 65.79%
Brantae,
Anser Geese 0 0 3 20%
7 18.75% 10 13.16%
Cygnus sp. Swans 0 0 1 6.67% 0 1 1.32%
Charadriiformes
Larus sp. Gulls 1 25% 0 3 20% 1 50% 2 4.17% 7 9.21%
Falconiformes
Accipitridae,
Falconidae
Birds of
Prey 0 0
2 4.17% 2 2.63%
Gaviiformes
Gaviidae Loons 0 1 16.7% 2 2.08% 3 3.95%
Passeriformes
Turdidae
Song
bird 0 0
2 4.17% 2 2.63%
Piciformes
Sphyrapicus
sp.
Wood-
pecker 0 0 1 6.67%
1 1.32%
Total identified per
assemblage 5 6 15 2 48 76
Unidentified Birds 6 3 11 1 40 61
Total birds per
assemblage 11 9 26 3 88 137

245
however, note that early components at the Kit‟n‟kaboodle Cave in southeast Alaska were
dominated by thatched barnacles, although these shellfish were unsuited to local shoreline
habitats. Moss and Erlandson (2010) demonstrated that the waters in the immediate vicinity of
Kit‟n‟kaboodle Cave were influenced by freshwater run-off, making the shoreline inhospitable
for thatched barnacles. Their results suggest that groups living at this site would have had to
travel 4-5 km away to harvest these barnacles. In Moss and Erlandson‟s example, boats
provided people with the means to bring resources from camps to villages for processing (sensu
Ames 2002). This seems to be quite different from the scenario presented by the GbTo-77
shellfish data. As shellfish remains have been found at a variety of sites, including those
presumed to be camp sites (Banahan and Patton 2008), groups likely harvested shellfish at other
locations. Shellfish harvested at camp sites, however, may have been processed where they
were harvested.
Sampling and Screening Protocols for Shellfish
As discussed above, equal volume samples were sorted using nested screens. Following the
vertebrate sampling strategy, I identified all material within the 6.3 mm and 2.8 mm screens and
quantified them by weight. I began sorting 25% of the invertebrate material in the 1.4 mm
screen, but changed my sample size to 10% due to time constraints (note that I continued to
sample 25% of the 1.4 mm screens for vertebrate specimens). I accounted for the discrepancy
between these two sampling strategies by multiplying the mass of my 10% subsamples by 2.5.
Table 8-7 presents the total and average masses of the materials identified within each
site context. The equal volume samples consist mainly of rock (schist gravel) and shell, though
there is some variability in the density of these materials from place to place across the site
(Figure 8-2). All other materials are relatively poorly represented in equal volume samples; the

246
Table 8-7: Total mass and average density (D; grams per litre) of material in equal volume samples by site context. Back midden samples are
taken from unit 1 and the top two samples from Unit 22. South side midden samples include the unit 5 column, a bulk sample from unit 6 and
the top sample from unit 21. House D samples are unit 21, lot 3a and 3b. There is only one House A sample (Lot 8). Total Mass excludes
residue (fine fraction) and unanalyzed portions of the 1.4 mm screens.
Material
Back Midden
7 samples
Auger 11 total
2 samples
South Side Midden
9 samples
house D
2 samples
North Side
Midden
3 samples
house A
1 sample
GbTo-77
24 samples
Mass in
grams D
Mass in
grams D
Mass in
grams D
Mass in
grams D
Mass in
grams D
Mass
in
grams
D Mass in
grams D
Rock 992.93 141.85 889.42 444.71 3179.08 353.23 862.59 422.45 624.84 208.28 544.46 544.46 7093.32 295.55
Charcoal 22.8 3.26 0.01 0.01 12.34 1.37 3.83 1.77 2.83 0.94 .49 .49 42.3 1.76
Floral
Remains 1.09 0.16 12.83 6.42 4.04 0.45 0.28 0.075 2.80 0.93 0.09 0.09 21.13 0.88
Faunal
Remains 2.08 0.3 0.17 0.09 4.83 0.54 1.71 0.72 0.19 0.06 0.71 0.71 9.69 0.40
Shell 3222.47
460.35
165.31 82.66 2095.79
232.87
352.67 176.3 302.40 100.80 25.22 25.22 6163.86 237.33
Total
material
Mass
4241.37
605.91
1067.7 533.87 5296.08 588.54 1221.1 610.53 933.05 311.02 570.96 570.96 11923.36 472.06

247
Figure 8-2. Average density of materials identified within column, bulk and auger
samples.
density of bone is low across the site, but slightly higher in house deposits than in exterior
midden deposits. This pattern is reinforced when vertebrate fauna are quantified by NISP. The
two major materials that compose the equal volume samples (shell and rock) differ between site
contexts. The back midden contains the highest density of shell remains and the lowest of rock.
The house deposits, by contrast, contain much higher densities of rock in comparison with shell.
Eighteen shellfish taxa were identified within equal volume samples and these are
presented in Table 8-8. In order to compare proportions and densities of taxa across the site, I
reduced this list to a series of 10 non-overlapping taxa. This also facilitated a comparison of
shellfish taxa between sites. Gastropods were poorly represented at this site. Where they were
identified, gastropods were highly fragmented and difficult to identify to species. For these
reasons, all gastropods were combined into four broad categories (land snails, marine snails,
chitons and limpets).
0
100
200
300
400
500
600
Back Midden Auger 11 South Side
Midden
house D North Side
Midden
house A
Den
sity
in
Gra
ms
Site Context
Rock
Shell

248
Table 8-8. List of shellfish taxa identified within equal volume samples.
Common name Latin name Category for analysis
Bay mussel Mytilus trossulus Mussel
cf California mussel Mytilus californianus Mussel
Butter clam Saxidomus gianteus Clam
Horse clam Tresus capax Clam
cf Pointed macoma Macoma nasuta Clam
Littleneck clam Protothaca staminea Littleneck clam
Basket cockle Clinocardium nuttalli Cockle
Dire whelk Lirabuccinum dirum Marine snail
Channelled dogwinkle Nucella canaliculata Marine snail
Striped dogwinkle Nucella emarginata Marine snail
Sitka periwinkle Littorina sitkana Marine snail
Lyre Whelk Buccinum plectrum Marine snail
Ribbed limpet Lottia digitalis Limpet
Plate limpet Tectura scutum Limpet
cf Black Katy chiton Katharina tunicata Chiton
Small barnacle Balanus glandula or Barnacle
Thatched acorn barnacle Semibalanus cariosus Barnacle
Green sea urchin Strongylocentrotus
droebachiensis
Green sea urchin
Butter clams and horse clams are difficult to distinguish from each other without the
hinge. Although some deposits contained whole clam shells, most consisted of broken and
fragmented specimens that could not be identified to species. As such, I combined butter clam
and horse clam together with clam specimens unidentifiable to class into a broad clam category.
This category also includes a single fragment of cf pointed macoma. I distinguished between
butter clam and horse clam where possible in three contexts, the back midden, house D and the
south side midden. Butter clams composed between 20% and 32% of the total identified clams;
horse clams composed between 0.33% and 6.77 of the total identified clam (Table 8-9).

249
Table 8-9. Relative proportions of clam that could be identified to species.
Invertebrate
taxon Back Midden South Side Midden house D
Butter Clam 19.79% 20.7% 32.5%
Horse Clam 0.33% 1% 6.77%
Small Mussel 2.54% 0% 0%
California
Mussel
0% 0% 0.7%
Many mussel remains were highly fragmented. The semi-protected nature of the GbTo-
77 shoreline is not ideal California mussel habitat; given the pattern observed within the harbour
(Banahan and Patton 2008), I did not expect to find California mussel in great abundance. Bay
mussels, by contrast favour sheltered waters, such as protected bays and inlets. The shoreline at
GbTo-77 may, in fact, be too exposed for favourable bay mussel conditions. While there are
subtle differences in shape and texture between California mussels and bay mussels (Cowles
2005b), small California mussels are very difficult to distinguish from bay mussels (Moss and
Erlandson 2010:3362), particularly in contexts such as this one where remains are highly
fragmented. I identified small mussels from whole or partial valves in back midden contexts.
Most mussel deposits, however, consisted of very finely crushed fragments. I identified one
fragment of mussel that may belong to California mussel in the house D deposit (less than .01%
of all mussel identified). Three California mussel chisels or adzes were also recovered at GbTo-
77 (Appendix C). As California mussel thrives along exposed coastlines, the raw material for
these artifacts must have come from quite a distance from protected and semi-protected
shorelines of the inner harbour, such as the western Dundas Islands or Stephens Island. If
mussel species could be distinguished with certainty in shellfish samples, then we could

250
consider whether the California mussels used to create these chisels were brought into the site
primarily as food or as raw material.
Barnacles, however, were the most abundant (by mass) shellfish taxa in the equal volume
samples. Barnacles were best represented, and most easily distinguished to species, in back
midden contexts. Although I observed occasional body plates belonging to a small barnacle
species, the most abundant and most readily identifiable barnacle species were thatched barnacles.
I distinguished thatched barnacles from indeterminate barnacles based on opercular and body
plates, using photographs, drawings and descriptions in Huber and Sommer 2003, Moss and
Erlandson (2010), and Pilsbry (1916). I identified all scuta as thatched barnacles (Table 8-10) and
these represent a minimum of 120 individuals. Many barnacle body plates were very large; some
complete body plates were between 5 and 6 cm in length, suggesting that they belonged to a large
barnacle species. I observed characteristic thatching on 23% of broken and complete body plates
in the GbTo-77 equal volume samples. A lack of thatching does not necessarily indicate a
different species of barnacle (Klinkenberg 2010); thatching is less common on the body plates of
thatched barnacles growing in crowded conditions (Cowles 2006; Moss and Erlandson
2010:3366). As all identified scuta were thatched barnacle, it seems likely that many of the
undiagnostic barnacle body plates may also represent thatched barnacles.
Table 8-10. Mass of total barnacle remains and thatched barnacle remains from GbTo-77 back
midden equal volume samples.
Back Midden
Deposit
Total Barnacle
Mass
Thatched barnacle
Mass Relative proportion
of total barnacle
Scuta
Unit 1, 4a 203.51 39.52 19.41% 8 left/7 right
Unit 1, 4c 328.57 92.14 28.04% 12 left/14 right
Unit 1, 4e 521.42 149.4 28.65% 31 left/39 right
Unit 1, 4g 451 110.10 24.41% 37 left/44 right
Unit 22, lot 3 331.96 45.55 13.72% 11 left/10 right
Unit 22, lot 4 90.84 6.54 7.20% 6 left/6 right
Total 1927.3 443.25 23% 105 left/120 right

251
I present in Table 8-11 total and average shellfish masses by site context for the reduced
shellfish categories. Overall, barnacles are the most frequently occurring shellfish taxon at this
site, followed by clams (horse clams and/or butter clams), littleneck clams, mussels (bay mussel
and California mussel), and marine snails. All other invertebrate taxa occur in very small
quantities. Clam and barnacle densities varied considerably by site context. Barnacles in
particular show the widest variability (Figure 8-3); they are very dense in back midden deposits,
having a greater mass than clam. Barnacles are considerably less dense in and around houses.
Mussel species are relatively low in terms of density and are concentrated in specific back midden
deposits and in the north side midden between houses C and D. Marine snails are most abundant
in terms of density in house D deposits.
Fragmentation
To further examine formation processes at GbTo-77 and to assess intensity of use, I examined
the fragmentation of shell deposits following Ford (1992) and Claassen (1998:114-115; see also
Burchell and Brewster 2008). Claassen discussed fragmentation in terms of one-half inch and
one-quarter inch screens; I employed the same calculation, but with 6.3 mm and 2.8 mm
screens. Fragmentation ratios were calculated for each equal volume sample by dividing the
weight of shell caught in the 6.3 mm screens by the weight of shell material within 2.8 mm
screens. Deposits with low ratios reflect deposits that are highly fragmented, while deposits
consisting of coarse shell will produce higher ratio.

252
Table 8-11. Total mass and average density (D) per litre of each shellfish taxa identified within equal volume samples by site
context. Context is derived as discussed in table 8-6.
Shellfish
taxa
Back Midden
7 samples
Auger 11 Total
2 samples
South Side
Midden
9 samples
house D
2 samples
North Side Midden
3 samples
house A
1 sample
GbTo-77
24 samples
Mass in
grams D
Mass
in
grams
D Mass in
grams D
Mass in
grams D
Mass in
grams D
Mass in
grams D
Mass in
grams D
Molluscs (bivalves)
Mussels 303.48 43 1.05 0.53 33.17 4 13.86 7 41.55 14 1.68 2 389.62 16
Clams 434.93 62 40.86 20.43 989.27 110 201.51 101 96.00 32 9.25 9 1771.03 74
Littleneck
clam 398.22 57 35.22 17.61 329.42 37 19.95 10 26.67 9 5.32 5 814.57 34
Cockles 7.40 1 1.36 0.68 21.63 2 7.52 4 3.60 1 41.51 2
Molluscs (gastropods)
Land
Snails 0.23 0 0.00 0.00 1.15 0 0.00 0 0.00 0.00 1.38 0
Marine
Snails 37.52 5 15.87 7.94 61.84 7 41.37 21 16.54 6 1.95 2 174.94 7
Chitons 6.10 1 0.02 0.01 6.52 1 0.56 0 0.46 0.15 13.64 1
Limpets 2.16 0 0.09 0.05 2.08 0 0.03 0 0.00 0.00 4.34 0
Crustaceans
Barnacles 1932.43 276 65.59 32.80 466.06 52 33.74 17 73.37 14 1.93 2 2571.09 107
Echinodermata
Sea
Urchins 53.31 8 0.51 0.26 28.7 3 0.55 0 0.24 0 0.16 0 80.07 3
Unid shell 46.71 7 4.74 2.37 155.96 17 33.50 17 27.31 9 4.89 5 265.83 11
Total
shellfish 3222.47 460 165.31 83 2095.79
233
352.67 176 302.40 101 25.22 25 6163.86 237

253
Figure 8-3. Average density of five most frequently occurring shellfish taxa identified
within equal volume samples at GbTo-77, arranged by site context.
To some extent, fragmentation will vary in accordance with shellfish taxa. Bay mussel
and sea urchin, for example, break into very small pieces relatively easily (Claassen 1989:56-
58). Deposits composed mainly of these species are likely to exhibit lower fragmentation ratios
than deposits composed predominantly of clams and barnacles, and as such may reflect
taxonomic composition of the sample as much as intensity of use. Figure 8-4 illustrates the
variability in fragmentation rates across the site. Deposits in and around house D tend to be
highly fragmented, while back midden deposits consist of less fragmented and whole shell
pieces. Some variability in fragmentation rates exists also within columns. The bottom of the
back midden (sample 1,9), for example, is much more fragmented than the top deposits. Stein
(1992; see also Ford 1992) has argued that fine particles can settle over time. In this case,
however, the stratigraphic variability in terms of fragmentation may reflect other taphonomic
0
50
100
150
200
250
300
Back Midden
Auger 11 South Side Midden
house D North Side Midden
house A
De
nsi
ty
Site Context
Mussels
Clams
Littleneck clams
Marine Snail
Barnacle

254
Figure 8-4. Fragmentation Ratios for each equal volume sample analyzed from GbTo-77, arranged by site context.
0
1
2
3
4
5
6
7
8
9
10
1,1 1,3 1,5 1,7 1,9 22,2 22,4 5,5,1 5,5,2 5,5,3 5,5,5 5,5,7 5,5,8 6,1 17,1 17,3a 17,3b 18,1 A5-1 A5-3 A11,1A11,3 22,6
Back Midden South Side Midden house D North Side Midden Auger 11 house
A
Fra
gm
en
tati
on
Ra
tio
Site Context

255
processes. The bottom deposit of the south side midden (sample 6,1) is much less fragmented
than the deposits above it, and compares favourably with most back-midden fragmentation
ratios. This deposit consists of a discrete deposit of clam, barnacle and urchin; its location
below and adjacent to a sizable house post probably protected it from the mixing that appears to
have formed the deposits above during house repair and rebuilding episodes. Sample 5,5,1 is
not very fragmented and represents one of the last depositions prior to the site‟s abandonment.
This deposit would not have been subjected to the same mixing and trampling as most side
midden deposits. Overall, however, the fragmentation ratios show that areas in and around
houses were much more heavily used than the back midden area.
Implications for Seasonality, Mobility and Labour Organization at GbTo-77
The vast majority of species identified within the GbTo-77 assemblage are locally available
throughout the winter and to a lesser extent in the fall and spring. To reiterate, local resources
are those that are available within the immediate vicinity of the site or within a day‟s paddle;
this accounts for most of the coast between the Nass River and Skeena River. In terms of fish
and other marine taxa, local resources could have been harvested in deep water, moderate water,
shallow water and intertidal habitats. As noted in chapter 3, a number of salmon species,
particularly steelheads, cutthroats, as well as some cohos and chinooks, could have been fished
in coastal waters throughout the year. Although fall-run chinooks favour small coastal streams
throughout the Northwest Coast, pink salmon are the most abundant salmon species in the small
coastal streams of Prince Rupert Harbour (David Peacock, pers. comm). As such, the
inhabitants of GbTo-77 and other harbour villages could have harvested a number of salmon
species in local coastal waters and rivers, instead of, or in addition to, the Skeena River.

256
Secondary fish taxa occur in small proportions ranging from 1-2% of the total site
assemblage but, are absent from the equal volume samples. Many of these fish could have been
harvested in moderate waters in winter, but frequent shallower waters at other times of the year.
On the other hand, dogfish are closest to shore during the winter. Lingcod, greenlings, ratfish,
pricklebacks and sculpins also frequent moderate, shallow and even inter-tidal waters through
the winter months (although some are available year-round). These are distributed across all
areas except the house A floor deposits. Once again, small sample size strongly influences the
distribution of fish taxa across the site and I would expect further excavation of house A to
produce more secondary taxa.
Sea mammals, land mammals and shellfish could also have been harvested within close
proximity of the site throughout the year, including through the winter. Beavers, bears and deer
all frequent the adjacent mainland throughout the year but could also be found on Digby Island
(there is currently a population of deer on Digby Island). Mountain goats frequent high altitudes
during the summer, but move to lower elevations, including areas immediately adjacent to the
coast during the winter. Harbour seals and sea otters, the two most frequently occurring sea
mammals, are common in coastal waters year-round. Harbour seals and Northern sea lions also
haul out in rookeries during the spring. However, northern fur seals, of which there is a single
specimen at GbTo-77, favour coastal waters in the spring and fall, and haul out on shore in the
summer. Interestingly, there are no Northern fur seal rookeries in the harbour today (Gifford-
Gonzalez et al. 2005). Juveniles, however, travel from Alaska southward during the winter
through the off-shore areas. The one fur seal element is from an immature animal, suggesting
either that it came from coastal waters in the spring or fall, that there was a rookery in the
harbour at one time and the animal was hunted in the summer, or that it came from an individual
that washed ashore, as they do periodically today. Many whale species are also coastal in the

257
summer, and off-shore in the spring and fall. Fragments from what appear to be a single
element are insufficient to indicate hunting. Rather, like their contact period counterparts,
villagers probably scavenged beached whales or whale bone.
For the most part, sea mammals could be hunted by small groups. Boas (1916:403)
records groups of four or five hunting sea mammals from boats and on land using barbed bone
and stone points, as well as traps and nets. Ames and Maschner (1999) argued, however, that
most sea mammals could have been effectively harvested by one or two people. If people are
more likely to dispose of refuse adjacent to their own houses, particularly if the refuse does not
interfere with other household activities (Hayden and Cannon 1982), the concentration of sea
mammal remains in and around house D might indicate that sea mammal hunting was indeed
orchestrated by small, independently operating households and that not all households focused
on sea mammal hunting to the same degree. However, sampling is likely contributing to much
of this variability, particularly because of the paucity of faunal remains from house A. More
house depressions would need to be excavated at this site in order to determine whether genuine
patterns that reflect differences in behavior or economic strategies existed. Understanding
variability in faunal remains between house depressions might be clearer where deposits could
be more convincingly associated with specific house depressions.
Although shellfish could theoretically be harvested throughout the year, there are
advantages to both summer and winter harvesting. During the summer, the lowest tides occur
during the day. Shellfish that inhabit the lower intertidal zones, such as butter clams and
littleneck clams, could be sought more easily, and perhaps in greater abundance during the
summer as opposed to the winter. Both butter clams and littleneck clams are well represented
at GbTo-77. Horse clams, cockles and sea urchins are also species that favour lower intertidal
zones, but are less well represented at this site. On the other hand, Gonyaulax, the algae that

258
cause paralytic shellfish poisoning, occurs during the summer. As I noted in chapter 3,
however, the timing and location of algae blooms changes from year-to-year and generally last
no more than a month. Thus, even if Gonyaulax occurred annually, the inhabitants of GbTo-77
and other villages could still have harvested shellfish, including butter clams and littleneck
clams during parts of the summer.
Shellfish were also likely gathered by small groups or individuals from the beach area in
front of the village site. The back midden was constructed by clearly demarcated deposits of
coarse shell, interspersed with relatively horizontal deposits of gravel and finely crushed shell.
The deposits of coarse shell may represent discrete basket loads of shell and the crushed shell
and gravel may have been deposited during major house rebuilding or cleaning episodes. There
is little evidence for mixing and the generally high fragmentation ratios suggest that the area
was not heavily used other than for the disposal of refuse and probably burial in some locations.
Barnacle occurs in very high densities in the back midden compared with the rest of the site,
while clams are more evenly distributed across the site. I used the t-test (Shennan 1997:83-92)
to assess whether the concentration of barnacles in the back midden as opposed to deposits in
and around houses is significant and the results indicate that they are (t=3.38; p-value < 0.05).
This patterning may reflect some aspect of the way in which site inhabitants collected,
processed and disposed of barnacles that differed from clams. Adults and children, working
alone or in small groups, could harvest clams throughout the period of village occupation (Moss
1993; Norton 1985:128-129). If collecting was a casual activity, baskets of clams could be
brought into the house for processing or for fresh consumption. Whole and broken shell could
be easily removed from the house floor, but smaller fragments of clam became part of the house
floor and bench deposits. These fragments eventually became mixed into side midden deposits
during house cleaning and rebuilding. The back midden shell deposits, however, could

259
represent larger-scale processing activities. The lack of rock in coarse shell back midden
deposits, in conjunction with the lack of barnacle in and around the house, suggests that
barnacles were processed in such a way that the gravel composing house floors did not mix with
barnacle refuse. There are a number of possible explanations for this patterning. Theoretically,
barnacles could be collected at any time of year, but a pattern that shows highly localized
deposition without the rock associated with house floors could indicate that barnacles were
harvested en masse in warmer months and processed outside. Although far from the north
coast, Fournier and Dewhirst (1980) report that barnacles were summer treats on Vancouver
Island. Alternatively, the paucity of barnacles from house-floor deposits might occur if house
inhabitants were more mindful of how they disposed of barnacles. Ethnoarchaeological studies
have shown that people commonly remove dangerous debris from high-traffic areas; the large,
sharp fragments of barnacle shell might have been considered more of a hindrance than clam
shells and thus disposed of with greater care (Hayden and Cannon 1982; Smith 2006). The
Kwakwaka‟wakw barnacle feast, discussed in chapter 3, illustrates how this kind of disposal
may have occurred (Boas 1921:499-505). The host served roasted or steamed barnacles to
guests on mats; these mats were later used to gather broken barnacle shells and dispose of them
outside the house.
Birds can be among the most sensitive indicators of seasonality (Reitz and Wing 2008).
Most ducks represented here are common in the coastal waters in and around Prince Rupert in
the winter, spring and summer. Canada geese are common also in coastal waters spring through
winter. Swans and loons frequent the area in winter, while gulls (mostly mew and herring gulls)
are present in coastal regions in winter, as well as other times of the year.
The discussion thus far has focused on resources that are available in the immediate
vicinity of GbTo-77 or within a day‟s paddle of the site (sensu Ames 2002). Although some

260
shellfish, and perhaps herring, could have been processed for later consumption, most local
resources probably represent foods that were consumed relatively quickly after harvest. Small
household groups could collect or capture these resources in the absence of larger-scale
organization on behalf of single or multiple households. Again, except for shellfish and herring,
these resources occur in relatively small quantities at this site. As the comparison of vertebrate
faunal density among contexts illustrates, the most abundant vertebrate taxa at GbTo-77 are
salmon, herring and smelt. Herring are available locally, but most salmon species (and in
particular, the most abundant species) and eulachon can be most easily acquired in large
numbers outside the harbour and at very specific times of year. Salmon, herring and eulachon
are highly localized and most abundant during spawning and this would provide ample
opportunity for groups to harvest these fish in large numbers (Hart 1988:108-125; Nolan
1977:289-290, 296-298; Schalk 1977) and process them for storage and later consumption.
Contact period Tsimshian used rakes made with bone teeth, and sometimes nets, to
capture herring, which were fished by small groups of two or three family members from the
shoreline or from boats (Boas 1916:400; Nolan 1977:318). A single small bone barb was found
at GbTo-77 that looks very similar to the kinds used by 19th
-century Northwest Coast groups to
harvest herring. This method was extremely productive for both herring and eulachon fishing
(Drucker 1965:116). For example, Arthur Birch describes as many as 600 smelts taken in one
hour by this method in Victoria (in Stewart 1977:76). Other animals, such as seals, eagles and
sea lions attracted by the large number of herring, could be hunted at this time (Stewart 1977:
76, 97).
Extra household labour might have been needed for processing herring, although it is not
clear from the data at hand precisely how herring were processed at GbTo-77. In the 19th
century, herring were eaten fresh, dried for storage and sometimes, like eulachon, rendered into

261
oil or grease (Boas 1916:44-45). As discussed below, the organization of labour required for
rendering fish oil may have been very different and more complex than what is required for
drying. Herring, in particular, lose much of their oil by the time they spawn (Bailey 1952).
While this might facilitate drying, it also suggests that groups might have fished herring at other
times of year. Although inshore spawning lasts only a few days, herring congregate in adjacent
shallow waters for a longer period of time, almost six weeks (Nolan 1977:318). Young herring
also school in inshore waters throughout the summer (Haegele and Schweigert 1985; Hart
1988:97-98).
Eulachon and salmon are the only specifically regional resources identified in the GbTo-
77 faunal assemblage (although some salmon would have been locally available in the harbour).
Task groups or whole households would have had to move from their village locations outside
of the harbour to harvest these fish in large numbers. Eulachon spawn in very specific locations
along the Northwest Coast. One of the largest runs occurs at the Nass River in late February or
early March. These fish congregate for a longer stretch of time in shallow waters and thus could
have been easily harvested for a good portion of the spring. For this reason, Nolan (1977:323-
325) suggests that eulachon could have been harvested by smaller task groups as easily as entire
households. During the 19th and 20
th centuries, however, the move to the Nass River from the
winter villages at Metlakatla was orchestrated by the village chief, and large households traveled
en masse to their eulachon fishing grounds (Garfield 1966:16). Small groups in canoes could
easily capture eulachon, like herring, with rakes or bag nets over the course of many weeks
(Nolan 1977; Stewart 1997). The organization of labour around processing eulachon is less well
established than salmon. Boas (1916:44-45) records that women and children strung eulachon
for drying and storage, but that Tsimshians concentrated their efforts on rendering eulachon oil,
an important and highly prized commodity. The process of rendering oil from eulachon was

262
long, and potentially labour-intensive. The first stage in the process was to allow the fish to rot
for 10 days to three weeks depending on the weather. After this, ripened fish were placed in
boxes of boiling water and the resulting oil skimmed off the top. This long and arduous process
is recorded in Boas (1916:44-45) and is worth repeating in full:
I found each house had a pit near it, about three feet deep and six or eight
inches square, filled with the little fish. I found some Indians making boxes to
put the grease in, others cutting firewood, and others (women and children)
stringing the fish and hanging them up to dry in the sun; while others, and they
are the greater number, were making fish grease. The process is as follows:
Make a large fire, plant four or five heaps of stones as big as your hand in it;
while these are heating fill a few baskets with rather stale fish, and get a tub of
water into the house. When the stones are red-hot bring a deep box, about 18
inches square…. near the fire, and put about half a gallon of the fish into it and
as much fresh water, then three or four hot stones, using wooden tongs. Repeat
the doses again, then stir the whole up…Proceed in this way until the box is
nearly full, then let the whole cool, and commence skimming of the grease.
While this is cooking, prepare another boxful in the same way. In doing the
third, use, instead of fresh water, the liquid from the box. On coming to the
refuse of the boiled fish in the box, which is still pretty warm, let it be put into
a rough willowbasket; then let an old woman, for the purpose of squeezing the
liquid from it, lay it on a wooden grate sufficiently elevated to let a wooden
box stand under; then let her lay her naked chest on it and press it with all her
weight…
It is unclear how many people might have been required for rendering eulachon oil.
Stewart (1977:151-152), drawing upon two early photographs of eulachon oil processing,
illustrates groups of two to four, mainly women, boiling fish and skimming oil. This process
might not result in large numbers of eulachon vertebrae being transported back to the winter
village site; bones might be destroyed during processing or sink along with sediment to the
bottom of baskets. If this were so, I would expect eulachon vertebrae to be found at the Nass
sites and not in the harbour village middens. The fact that eulachon vertebrae are found almost
exclusively in and around houses could suggest that eulachon and other smelts were likely
strung and dried rather than rendered into oil and that strings of eulachon were stored within the
house. The small vertebrae from these fish, as well as herring, might fall between bench slabs.

263
Moreover, because these fish are so small, smelt remains may be overlooked or ignored during
house cleaning (Hayden and Cannon 1982; Schiffer 1983). Orchard (2007:268) observed a
similar distinction between interior house deposits and exterior middens in terms of fish taxa
(including herring) at some Haida Gwaii sites. I tested the correlation between smelt NISP and
overall sample size; the results show that, although smelt remains were concentrated in the area
in and around house D, the lack of smelt in house A and in the north side midden appears to be a
product of small sample size (Sr= .8804; p-value .0206). None of this resolves the question as to
whether eulachon fishing was organized by the household or the village, but the restricted
distribution of smelt remains within and near house depressions may indicate that these fish
could have been processed by small households on their own, or in conjunction with neighbours.
The other major regional resource found at GbTo-77 is salmon, the most abundant in
terms of proportion and density of any taxa at this site. This suggests that salmon harvesting
would have had considerable influence on many other aspects of household life. Ames and
Maschner (1999:119) contend that there is no good evidence for an open-water salmon fishery
on the north coast. According to Boas (1916) and Halpin and Seguin (1990:269), however,
Tsimshians used multiple technologies to exploit salmon in a variety of settings, including
trawling in open waters. Trawling would have required nets, lines and stone weights. If these
practices existed during the pre-contact period, net-sinkers might be fairly common at coastal
archaeological sites. MacDonald (1969:252) contends that net weights are found in Middle
Period artifact assemblages, but none were uncovered at McNichol Creek (Coupland et al.
2000), GbTo-46, GbTo-28 (Coupland et al. 2006) or GbTo-77 (Appendix B). Moreover, the
wet-site components at the Lachane and Boardwalk (GbTo-31) sites produced baskets in the
hundreds (Croes 1997; MacDonald and Inglis 1976) but, no evidence for netting or hooks
(Inglis 1976:164). This is in marked contrast to wet sites in other areas of the Northwest Coast

264
that produced netting, hooks and stone weights; this suggests that net fishing may not have been
common in the harbour during the pre-contact period (Nolan 1977:131-132).
Salmon could also have been fished using leister spears or harpoons particularly in
concert with traps and weirs (Stewart 1977:65-77), and it is certainly possible to use projectiles
in shallow but open waters as well. There are 18 bone points, awls or punches in the GbTo-77
assemblage and many of these could have formed parts of spears, harpoons, or barbs; these were
likely used in sea mammal hunting as well as fishing. The major salmon migration routes
bypass Prince Rupert Harbour itself and most salmon head well off-shore after leaving their
natal rivers and remain there until spawning (see chapter 3). Without nets, people living at
GbTo-77 would have had to harvest salmon much like other locally available fish that inhabit
coastal waters, such as dogfish, greenlings, rockfish and ratfish.
Where, then, was the overwhelming abundance of salmon found at GbTo-77 harvested?
Salmon runs in local harbour streams are small and inconsistent, particularly in comparison with
the adjacent Skeena watershed (see chapter 3 for salmon escapement figures); harbour streams
are also often limited to a species or two of salmon, whereas all seven species of salmon have
significant runs on the Skeena. Historical sources indicate that, on average, each person
consumed approximately 250 kg of salmon per year (Campbell and Butler 2010; Haggan et al.
2006:6-7). There is approximately 3 to 4 kg of edible flesh on a single, large salmon (Meengs
and Lacky 2005) and as such, each person would have to consume between 50 and 80 salmon
per year. It is likely that these numbers were even higher during the pre-contact period, prior to
the introduction of European foodstuffs. However, this amount would also vary considerably
from person to person and was likely much lower for small children. Even among adults, there
would have been room for considerable variability. Newell (1993), for example writes that
people on boat brigades during the fur trade consumed as much as 4 kg of salmon per day. At

265
this rate, a single person could consume 250 kg within 2 months. Using the 250 kg per person
as a benchmark, how many salmon would the inhabitants of GbTo-77 consume on an annual
basis? In chapter 7, I estimated that houses at GbTo-77 would probably have housed 11-15
individuals. If we assume that this consisted of two families or one extended family, it is likely
that a minimum of four adults lived within each house. Excluding house A, this suggests that at
a minimum there would have been approximately 20 adults living at GbTo-77. This population
would have consumed between 1200 and 1680 salmon per year. This is a little less per person
than Martindale‟s (2006b:146) estimate of 2737 to 5475 salmon for a household of 30. If we
assume that children consume half the quantity of salmon as adults (and this would be a very
low estimate given the quantities that older children and adolescents might consume) the
inhabitants of GbTo-77 could have harvested between 3297 and 4614 salmon each year. If the
salmon represented by the faunal remains at GbTo-77 were fished primarily from local streams,
the inhabitants of this site would have needed to harvest salmon from other sources in years
when local salmon numbers were low.
The Skeena River salmon populations, however, are, and were, enormous. For this
reason, 19th-century Coast Tsimshian groups moved to villages on the Skeena River in the
summer and fall to fish salmon. Houses owned specific fishing locations and constructed weirs
and traps that were used to capture salmon in conjunction with baskets and nets. Rock traps and
weirs identified on the north coast date as early as 3000 BP (Moss and Erlandson 1998; Moss et
al. 1990; Simonsen 1973:31-32,78), indicating that this method of harvesting salmon and other
fish is potentially very old. Prince (2005) documents wooden fish weirs, some containing
baskets traps, dating to the Late Period, along the Kitwanga River, located above Kitselas
Canyon and the Skeena River. However, little other work on weirs and traps has been
undertaken in Prince Rupert Harbour and the Skeena watershed. As such, we do not know how

266
old weir fishing is in the Tsimshian area.
There is, in fact, little evidence to indicate that salmon procurement and preservation
techniques changed much at all in this area, even with the introduction of larger and presumably
more productive households (Coupland 1996). Schalk (1981) and Suttles (1987a) have both
shown that a few individuals can harvest salmon relatively easily in large numbers during
spawning, but that a large labour pool is needed to process these fish before they spoil.
Ethnographic descriptions of processing on the north coast are limited but, in general, the flesh
was scored and hung to dry in smoke houses. Archaeological faunal remains reveal little about
how fish were processed in the past. The faunal evidence from GbTo-77, in conjunction with
modern escapement data suggest that salmon were likely harvested in very large numbers at
fishing camps and probably stored at villages for winter consumption. If similar processing
methods were in use 2500 to 2000 years ago, how much salmon could small households
effectively process? How critical were salmon for these households, particularly in a relatively
productive region such as the harbour? The importance of salmon at this site, as well as
possible explanations of when and where they were harvested, are more easily discussed below
in the context of other villages sites in the harbour.
The Inter-Village Analysis: GbTo-77 in comparison with other harbour village sites
In this section, I compare the GbTo-77 fauna presented above with assemblages from recent
excavations at GbTo-31 (the Boardwalk site), GbTo-28 (Phillip‟s Point), GbTo-46 (Tremayne
Bay), and GcTo-6 (McNichol Creek). The NISP for GbTo-31, GbTo-28 and GbTo-46 were
provided by Kathlyn Stewart of the Museum of Nature in Ottawa. The NISP for GcTo-6 was
compiled from a number of published and unpublished sources (Coupland 1999, Coupland et al.
2003, 2006). GbTo-31 is a large, complex site consisting of multiple components. I present

267
here faunal remains from area A/C, the back midden area dating approximately 380-45 cal BC,
and area B/D, the front, terraced area of the site. Most dates in area B/D cluster between AD cal
880 and 1260; both Areas B and D appear to have had similar depositional histories and have
produced evidence for multiple superimposed house floors, although no definitive house
depressions were identified (Ames 2005a:72; Coupland et al. 2006). For these reasons, I have
combined the faunal remains from these areas. I refer also to the GcTo-6 (McNichol Creek)
vertebrate assemblages but, the invertebrate faunal data from this site were not available. GcTo-
6 was in use for a long time, just over 2500 years, but the dates associated with the village
occupation cluster between AD cal 200 and 1200.
The five village sites produced a total of 223,648 vertebrate faunal elements (identifiable
to class) from a variety of bird, fish and mammals (Table 8-12). In order to facilitate inter-site
comparisons, I condensed the taxa in all assemblages into a series of non-overlapping categories
(see Betts and Friesen 2004 and Grayson and Delpech 2002). This produced a total of 46
taxonomic categories that I use for the comparative analysis and these are listed in Tables 8-13,
8-14 and 8-15. As with the GbTo-77 analysis, I did not include domestic dog and small rodent
NISPs in the inter-site analysis; instead, I provide the NISP for these and other very broad
classes of taxa separately (these are excluded from the inter-site analysis).
By class, all sites are dominated by fish, specifically salmon, with herring placing a
distant second (Table 8-13). The mammal and bird assemblages, however, show considerable
variability across sites (Table 8-14 and 8-15). Small mammals, many of which are fur-bearing,
are more common at GbTo-28, GcTo-6 and GbTo-31 than at GbTo-77 and GbTo-46; cervids,
most of which are deer, are also well represented at these sites. GbTo-77 and GbTo-31contain
relatively high proportions of sea mammals, which is in marked contrast to the very low
proportions of sea mammals at GbTo-28 and GbTo-46 and GcTo-6 (Figure 8-5). GbTo-77 also

268
Table 8-12. NISP and relative frequencies of fauna by class for all sites. Counts include elements that could not be identified beyond class.
Class
GbTo-31 A/C GbTo-31 B/D GbTo-28 GbTo-46 GbTo-77 GcTo-6
NISP %NISP NISP %NISP NISP %NISP NISP %NISP NISP %NISP NISP %NISP
Total
mammals 388 3.44% 4278 7.27% 530 0.92% 242 0.87% 762 3.71% 9981 20.75%
Total fish 10823 96.03% 54470 92.55% 56733 99.00% 27427 99.08% 19628 95.61% 37962 78.93%
Total birds 60 0.53% 104 0.18% 42 0.07% 13 0.05% 139 0.68% 156 0.32%
Total
NISP 11271 100% 58852 100.% 57305 100.% 27682 100% 20529 100.% 48009 100.%
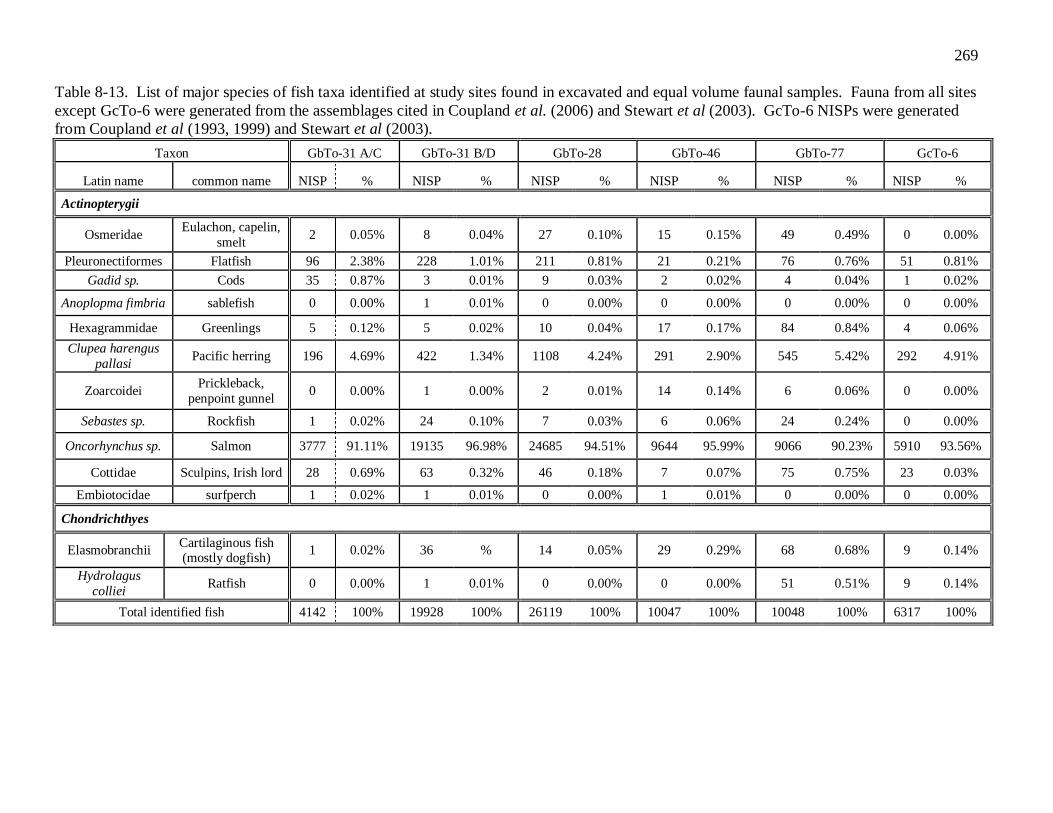
269
Table 8-13. List of major species of fish taxa identified at study sites found in excavated and equal volume faunal samples. Fauna from all sites
except GcTo-6 were generated from the assemblages cited in Coupland et al. (2006) and Stewart et al (2003). GcTo-6 NISPs were generated
from Coupland et al (1993, 1999) and Stewart et al (2003).
Taxon GbTo-31 A/C GbTo-31 B/D GbTo-28 GbTo-46 GbTo-77 GcTo-6
Latin name common name NISP % NISP % NISP % NISP % NISP % NISP %
Actinopterygii
Osmeridae Eulachon, capelin,
smelt 2 0.05% 8 0.04% 27 0.10% 15 0.15% 49 0.49% 0 0.00%
Pleuronectiformes Flatfish 96 2.38% 228 1.01% 211 0.81% 21 0.21% 76 0.76% 51 0.81%
Gadid sp. Cods 35 0.87% 3 0.01% 9 0.03% 2 0.02% 4 0.04% 1 0.02%
Anoplopma fimbria sablefish 0 0.00% 1 0.01% 0 0.00% 0 0.00% 0 0.00% 0 0.00%
Hexagrammidae Greenlings 5 0.12% 5 0.02% 10 0.04% 17 0.17% 84 0.84% 4 0.06%
Clupea harengus
pallasi Pacific herring 196 4.69% 422 1.34% 1108 4.24% 291 2.90% 545 5.42% 292 4.91%
Zoarcoidei Prickleback,
penpoint gunnel 0 0.00% 1 0.00% 2 0.01% 14 0.14% 6 0.06% 0 0.00%
Sebastes sp. Rockfish 1 0.02% 24 0.10% 7 0.03% 6 0.06% 24 0.24% 0 0.00%
Oncorhynchus sp. Salmon 3777 91.11% 19135 96.98% 24685 94.51% 9644 95.99% 9066 90.23% 5910 93.56%
Cottidae Sculpins, Irish lord 28 0.69% 63 0.32% 46 0.18% 7 0.07% 75 0.75% 23 0.03%
Embiotocidae surfperch 1 0.02% 1 0.01% 0 0.00% 1 0.01% 0 0.00% 0 0.00%
Chondrichthyes
Elasmobranchii Cartilaginous fish (mostly dogfish)
1 0.02% 36 % 14 0.05% 29 0.29% 68 0.68% 9 0.14%
Hydrolagus
colliei Ratfish 0 0.00% 1 0.01% 0 0.00% 0 0.00% 51 0.51% 9 0.14%
Total identified fish 4142 100% 19928 100% 26119 100% 10047 100% 10048 100% 6317 100%

270
Table 8-14. List of mammalian taxa identified within excavated and equal volume faunal samples from GbTo-77, GbTo-28, GbTo-
46, GbTo-31 (A/C and B/D) and GcTo-6. Fauna from all sites except GcTo-6 were generated from the assemblages cited in
Coupland et al. (2006, 2010). GcTo-6 NISPs were generated from Coupland et al. 2003 and 1999).
Taxon GbTo-31 A/C GbTo-31 B/D GbTo-28 GbTo-46 GbTo-77 GcTo-6
Latin name Common
name NISP % NISP % NISP % NISP % NISP % NISP %
Artiodactyls
Cervidae Deer, Moose 15 41.67% 327 43.25% 21 50.00% 22 57.89% 42 33.87% 47 58.75%
Oreamnos
americanus
Mountain
Goat 0 0.00% 5 0.66% 0 0.00% 1 2.63% 7 5.65% 0 0.00%
Ovis canadensis Mountain
Sheep 0 0.00% 0 0.00% 0 0.00% 1 2.63% 0 0.00% 0 0.00%
Carnivora
Ursus sp. Bear 0 0.00% 1 0.13% 0 0.00% 0 0.00% 3 2.42% 0 0.00%
Lontra canadensis River Otter 0 0.00% 4 0.53% 1 2.38% 0 0.00% 0 0.00% 1 1.25%
Enhydra lutris Sea Otter 1 2.78% 284 37.57% 0 0.00% 1 2.63% 11 8.87% 7 8.75%
Tamiasciurus
hudsonicus Mink 3 8.33% 1 0.13% 1 2.38% 0 0.00% 1 0.81% 5 6.25%
Martes americana Marten 0 0.00% 1 0.13% 1 2.38% 0 0.00% 0 0.00% 0 0.00%
Martes pennanti Fisher 0 0.00% 3 0.40% 0 0.00% 0 0.00% 0 0.00% 1 1.25%
Eumetopias
jubata
Northern Sea
Lion 0 0.00% 7 0.93% 0 0.00% 0 0.00% 3 2.42% 0 0.00%
Callorhinus
ursinus
cynocephalus
Northern Fur
Seal 0.00% 0 0.00% 0 0.00% 0 0.00% 1 0.81% 0 0.00%
Phoca vitulina Harbour Seal 7 19.44% 76 10.05% 5 11.90% 8 21.05% 37 29.84% 0 0.00%
Felis concolor Cougar/Linx 0 0.00% 0 0.00% 0 0.00% 0 0.00% 1 0.81% 1 1.25%
Vulpus vulpus Red Fox 0 0.00% 0 0.00% 0 0.00% 0 0.00% 4 3.23% 0 0.00%
Canis lupus Wolf 1 2.78% 0.00% 1 2.38% 2 5.26% 0 0.00% 1 1.25%
Cetacea
Cetacea Whale 0 0.00% 0.00% 0 0.00% 0 0.00% 7 5.65% 0 0.00%
Rodentia
Tamiasciurus Red Squirrel 0 0.00% 5 0.66% 0 0.00% 0 0.00% 1 0.81% 1 1.25%

271
Taxon GbTo-31 A/C GbTo-31 B/D GbTo-28 GbTo-46 GbTo-77 GcTo-6
Latin name Common
name NISP % NISP % NISP % NISP % NISP % NISP %
hudsonicus
Marmota sp. Marmot 0 0.00% 12 1.59% 2 4.76% 0 0.00% 0 0.00% 0 0.00%
Erethizon dorsatum
Porcupines 5 13.89% 12 1.59% 5 11.90% 1 2.63% 0 0.00% 9 11.25%
Castor canadensis Beaver 4 11.11% 18 2.38% 5 11.90% 2 5.26% 6 4.84% 7 8.75%
Total identified mammals 36 100% 756 100% 42 100% 38 100% 124 100% 80 100%
Unid Sea
Mammals 2 15 3 1 26 2
Small
Rodents 4 9 8 8 13
Dog and
Canine indet 51 58 142 15 56 0
Unid Hoofed
Mammals 8 59 6 0 0 0
Unid
Carnivore 1 4 0 0 0 0

272
Table 8-15. List of avian taxa identified within excavated and equal volume faunal samples from GbTo-77, GbTo-28, GbTo-46, GbTo-
31 (A/C and B/D) and GcTo-6. Fauna from all sites except GcTo-6 were generated from the assemblages cited in Coupland et al.
(2006, 2010). GcTo-6 NISPs were generated from Coupland et al. 2003 and 1999).
Avian taxon GbTo-31 A/C GbTo-31 B/D GbTo-28 GbTo-46 GbTo-77 GcTo-6
Latin name Common name NISP % NISP % NISP % NISP % NISP % NISP %
Anseriforms
Anatinae Ducks 9 26.47% 23 76.67% 3 10% 0 0.00% 50 65.79% 2 8.70%
Brantae, Anser Geese 1 2.94% 8 26.67% 0 0.00% 0 0.00% 10 13.16% 1 4.35%
Cygnus sp. Swans 0 0.00% 0 0.00% 0 0.00% 0 0.00% 1 1.32% 0 0.00%
Charadriiformes
Larus sp. Gulls 2 5.88% 7 23.33% 3 10% 2 40% 7 9.21% 5 21.74%
Alcidae Alcids 1 2.94% 2 6.67% 0 0.00% 1 20% 0 0.00% 12 52.17%
Falconiforms
Accipitridae,
Falconidae Birds of Prey 0 0.00% 1 3.33% 0 0.00% 0 0.00% 2 2.63% 0 0.00%
Galliformes
Lagopus sp. Ptarmigan 0 0.00% 0 0.00% 0 0.00% 0 0.00% 0 0.00% 1 4.35%
Gaviiformes
Gaviidae Loons 5 14.71% 6 20.00% 0 0.00% 0 0.00% 3 3.95% 0 0.00%
Passeriformes
Turdidae Song bird 2 5.88% 2 6.67% 0 0.00% 0 0.00% 2 2.63% 0 0.00%
Passeriformes Perching birds 3 8.82% 2 6.67% 0 0.00% 0 0.00% 0 0.00% 0 0.00%
Corvidae Crow/Raven 7 20.59% 4 13.33% 1 3.33% 2 40% 0 0.00% 2 8.70%
Pelecaniformes
Phalacrocoracidae Cormorant 0 0.00% 0 0.00% 2 6.67% 0 0.00% 0 0.00% 0 0.00%
Piciformes
Sphyrapicus sp. Woodpecker 0 0.00% 0 0.00% 0 0.00% 0 0.00% 1 1.32% 0 0.00%
Podicipediformes
Podicipedidae Grebe 4 11.76% 3 10.00% 0 0.00% 0 0.00% 0 0.00% 0 0.00%
Total identified birds 34 100% 58 100% 9 100% 5 100% 76 100% 23 100%

273
Figure 8-5. Graph illustrating the relative frequency of sea mammal to land
mammal remains for all site components.
contains a handful of elements of larger terrestrial mammals, such as goats, bears and cougars,
but the lowest proportion of cervids of any site in this study (33.87% of identified mammals).
GbTo-77 and GbTo-31 contain large proportions of ducks, geese and gulls, but alcids
are found only at GcTo-6 and GbTo-31. Alcids, in particular, are good seasonal indicators
because they spend most of the year well off-shore and nest on near-shore islands for a brief
period of time in the summer (Stewart and Stewart 2001:186).
Diversity
One of the basic means of exploring the degree of variability within economic strategies is to
examine the extent to which faunal assemblages reflect specialized or generalized adaptations
(Ames and Maschner 1999:127-128; Reitz and Wing 2008). Although intensification has
conventionally been considered the outcome of specialization, it is increasingly understood that
0%
10%
20%
30%
40%
50%
60%
70%
80%
90%
100%
GbTo-31
A/C
GbTo-77 GbTo-28 GbTo-46 GbTo-31
B/D
GcTo-6
Rela
tiv
e F
req
uen
cy
Sites
land mammals
sea mammals

274
both specialization and diversification play a role in the process of intensification (Betts and
Friesen 2004; Morrison 1994). This is relevant to the Northwest Coast, and to the pre-contact
period in the harbour in particular, because many archaeologists have argued that salmon
intensification was an integral component of social change within the region. Defining
intensification has seen considerable debate in anthropological circles (Bender 1978; Boserup
1966; Matson 1983; Morrison 1994), but the most useful construct of intensification for the
purposes of this study is drawn from Betts and Friesen (2004). They see intensification as the
process by which more resources per capita are extracted from a given unit of land or labour.
Evidence for intensification and variation as well as diversity within the economic strategies
adopted by groups living in close proximity has been linked to land tenure, territoriality,
ethnicity and complexity (Ames 1985:158-159, 2005b; Bender 1978, 1981; Betts 2005;
Morrison 1994).
Richness and the Simpson‟s Index are useful ways to identify specialized or generalized
economic strategies (Betts and Friesen 2004; Grayson and Delpech 2002; Reitz and Wing
1999). As discussed in chapter 2, both strategies can play a role in the intensification process
(Morrison 1994). Richness is the number of taxa in a given assemblage (Betts and Friesen
2004; Reitz and Wing 1999:102-106). The Simpson‟s Index accounts for the number of taxa in
a sample, but also factors in the distribution of individual specimens across taxa (Grayson
1984:158-167; Moss 1989). Although this index is generally considered to have greater
accuracy than other diversity indices, such as the Shannon index, Simpson‟s Index is heavily
dependent on the most abundant species within the sample (Banning 2000; 110-112; Ringrose
1993). In the reciprocal of the Simpson‟s Index, the higher the value the more evenly
distributed the individuals are across species. The lower the value of the Simpson Index
reciprocal, the more an assemblage is dominated by a single taxon. Zooarchaeologists

275
commonly use assemblages with a minimum of 20 to 30 specimens in diversity analyses (e.g.,
Betts and Friesen 2004; Grayson et al. 2001; Grayson and Delpech 2002) because diversity
measures are prone to the effects of sample size; as sample size increases, new species are likely
to be added. To mitigate the effects of sampling, I calculated richness and Simpson‟s Diversity
Index Reciprocals only from those assemblages with a minimum of 20 specimens.
The Simpson‟s Diversity Index Reciprocal for all sites in this study are relatively low,
ranging from 1.09 to 1.26, and this can be explained by the overwhelming proportion of salmon
remains at all sites (See Table 8-16 and Table 8-17 for this section of the analysis). However,
there is a very real difference in the number of taxa that compose the assemblages. GbTo-31
B/D and GbTo-77 have the greatest taxonomic richness (37 and 32 taxa respectively), followed
by GbTo-31 A/C (26), GcTo-6 (24) GbTo-28 (24) and GbTo-46 (22).
Table 8-16. Spearman‟s Diversity Index Reciprocal for all sites. Sites are arranged
approximately in chronological order. Dates from GbTo-31 A/C, GbTo-77, GbTo-28
and GbTo-46 fall mostly within the Late Middle Period. Dates from GcTo-6 and GbTo-
31 B/D fall mostly within the Transitional/Late Period.
Sites Fish Mammals Birds All identified fauna
GbTo-31 A/C 1.20 3.98 6.08 1.24
GbTo-77 1.22 4.49 2.25 1.26
GbTo-28 1.12 3.37 n/a 1.12
GbTo-46 1.08 2.58 n/a 1.09
GcTo-6 1.14 2.65 2.96 1.17
GbTo-31 B/D 0.96 2.94 4.70 1.17

276
Table 8-17. Richness for all site components. Sites are arranged approximately in
chronological order.
Sites Fish Mammals Birds All identified fauna
GbTo-31 A/C 10 7 9 26
GbTo-77 11 13 8 32
GbTo-28 11 9 n/a 24
GbTo-46 11 8 n/a 22
GcTo-6 8 10 6 24
GbTo-31 B/D 13 14 10 37
To test for the effects of sample size I compared assemblage NISP to the number of taxa
per site and the diversity indices using Spearman‟s Rho (sensu Betts and Friesen 2004; Grayson
1984:158-167; Moss 1989). No significant correlation exists between NISP and the Simpson‟s
Reciprocal Index (Sr=-.2899; p-value .5773), or NISP and richness (Sr=.2029; p-value .6997),
suggesting that the differences observed in the number of taxa present, as well as the way in
which they are distributed, is not related to sample size.
I also explored differences in diversity of specific classes of taxa among sites.
Differences in species richness are more variable within mammalian and avian taxa than within
fish. Fish assemblages are relatively homogenous in terms of diversity, with Simpson‟s
Diversity Index Reciprocal measures ranging from 0.96 to 1.22, and this is likely explained by
the overwhelming proportion of salmon remains at all sites. Although differences among sites
are small in this regard, GbTo-31 (area B/D) has more fish taxa than other sites and GbTo-77 is
slightly more diverse. The Simpson‟s Diversity Reciprocal shows no significant correlations
with total fish NISP (Sr =-.4286, p-value .3965), but the moderately strong correlation between
NISP and richness (Sr=.7590, p-value=.080), though not significant at the .05 level, suggests
that sampling may still influence this measure of diversity.
The most significant variability exists within the mammals. I applied richness and

277
diversity measures to the reduced mammalian sample, which excludes canine indeterminate and
small rodents. The richness of the mammalian assemblages is strongly correlated with sample
size (1.000; p-value .0000), but the Simpson‟s Reciprocal of each assemblage does not correlate
with overall mammal NISP (.0857; p-value .8717). GbTo-46 and GcTo-6 have the least diverse
mammalian assemblages and this likely reflects the fact that over half of the assemblage consists
of cervids. GbTo-31 B/D also does not appear particularly diverse. GbTo-77 is the richest
mammalian assemblage and it also has the highest proportion of sea mammals of any of the
sites, followed closely by GbTo-31 B/D. The three remaining sites and the A/C component at
GbTo-31 have relatively low proportions of sea mammals, ranging from almost 11% to just over
25%.
Only GbTo-31 (A/C and B/D), GbTo-77 and GcTo-6 have large enough avian samples
to be analyzed by diversity measures. Both diversity indices show a general trend toward
decreasing diversity over time with regards to birds, although GbTo-31 B/D does contain a
relatively large number of avian taxa in comparison with the other sites. Moreover, GbTo-31
(A/C) is far more diverse than GbTo-77. This may be partly due to the focus on ducks at GbTo-
77. The relatively poor representation of avian remains at GbTo-28 and GbTo-46 is interesting;
the faunal assemblage at both sites is larger than that from GbTo-77, but excavations produced
very few bird remains.
Equal Volume Samples
Although the overall faunal assemblages (specimens collected in the field during excavation and
those collected from column, bulk and auger samples in the lab) showed an overwhelming
emphasis on salmon at all sites, the equal volume samples alone highlighted significant
variability in the abundance of salmon remains at these villages. As noted above, significant

278
variability also exists within sites, in particular between deposits located in and around house
depressions and those that compose the back midden. I sampled a number of contexts at GbTo-
77 using column, bulk and auger sampling methods. The sampling protocols employed at
GbTo-31, GbTo-46 and GbTo-28 were slightly different. Coupland (Coupland et al. 2000;
Stewart et al. 2003) took column and bulk samples from in and around house depressions at
GbTo-28 and GbTo-46 and auger samples from the back midden area at these sites. At GbTo-
31, he focussed column and bulk sampling in area B/D and sampled the back midden using an
auger. Moreover, there is no column sample data available for GcTo-6; auger samples were
however excavated across the back midden at this site and three samples are present here (from
Stewart et al. 2003). Other than the four auger samples from GbTo-77, column, bulk and auger
samples provide data from two distinct site contexts; auger samples provide the only small
screen data for back-midden contexts at sites other than GbTo-77, and column and bulk samples
provide small screen faunal data from the area in and around house depressions.
Stewart et al. (2003), however, employed different field and lab methods which render
their auger samples comparable to column samples from all sites in terms of relative proportions
only. Stewart‟s auger samples represent 20 cm of deposit (extracted with a 7 cm diameter
auger) rather than a full litre, and were wet screened prior to analysis (Stewart et al. 2003). In
the analysis of my equal volume samples, I identified vertebrate fauna in just 25% of the
material caught in the 1.4 mm screen, while Stewart identified and quantified all vertebrate
fauna in the 1.4 mm screen. Stewart notes that no vertebrate fauna was recovered from the 6.4
mm screens in her auger samples.
The combined data illustrate well the kind of variability that exists within middens
(Stewart et al.2003). In particular, it illuminates the differences between house and back-
midden deposits in terms of fish abundance (Table 8-18 and 8-19). Back middens generally

279
Table 8-18. NISP and relative proportions of major fish from combined column and auger
samples taken in and around house depressions. Auger and column samples were collected
in the same way at each site. This table compares the combined NISPs for the 2.8mm and
1.4 mm screens only.
Houses
GbTo-77 GbTo-31 (B/D) GbTo-28 GbTo-46
NISP % NISP % NISP % NISP %
Salmon 27 31.8% 135 95.74% 95 76% 61 70.67%
Herring 23 27.1% 3 2.12% 21 16.8% 11 10.67%
Smelt 35 41.2% 3 2.12% 9 7.2% 14 18.67%
Total 85 100.00% 141 100.00% 125 100.00% 75 100.00%
Table 8-19. NISP and relative proportions of major fish taxa identified in combined column
and auger samples taken from back midden contexts. This table compares the combined
NISPs for the 2.8mm and 1.4 mm screens only. These column and auger samples were taken
from back midden deposits at each site.
Back Midden
GbTo-77 GbTo-31 (A/C) GbTo-28 GbTo-46 GcTo-6
NISP % NISP % NISP % NISP % NISP %
Salmon 16 59.25% 112 92.51% 200 87.7% 174 94.50% 31 88.89%
Herring 7 25.93% 9 7.51% 28 12.3% 15 5.50% 1 11.11%
Smelt 4 14.82% 0 0.00% 0 0.00% 0 0.00% 0 0.00%
Total 27 100% 121 100% 228 100% 189 100% 32 100%
contain a greater proportion of salmon than house deposits. As most back-midden samples were
taken with a bucket auger, the considerable crushing and compaction that occurs during the
augering process may have contributed to the low NISP for small fish, such as herring and smelt
and the relatively high rates of salmon. Salmon vertebrae are relatively hardy and easily
recognizable even in fractured form, while the vertebrae of smaller fish are more likely to be
destroyed in the process. It is also possible, however, that there are more salmon in back-
midden deposits and smaller fish in and around house depressions because of the way different
fish were processed, consumed and their remains discarded. GbTo-31, however, is an exception
with respect to the distribution of small fish remains; at this site, salmon proportions are lower
in area B/D than in the back midden. As discussed in chapter 6, both Coupland et al. (2000) and
Ames (2005a) interpret layer upon layer of living floors in the area B/D stratigraphy, although

280
there are no formal house depressions in this section of the site. The sample size from the back
midden at GbTo-31 is very small (as it is at GcTo-6) and this may account for some of the
discrepancy between this site and the others. Alternatively, it may reflect processes that differ
from those at other village sites in Prince Rupert Harbour. For example, the living floors
observed in area B/D may reflect a different kind of occupation than at sites with surface house
depressions.
Looking specifically at my data (in other words, excluding Stewart‟s auger samples), the
density of salmon remains varies substantially among sites. Table 8-20 lists the density of
salmon, herring and smelt, the three major fish taxa identified within equal volume samples at
GbTo-77, GbTo-28, GbTo-46, and GbTo-31 (B/D only). As with the intra-site comparison at
GbTo-77, I present density in terms of NISP per litre of matrix and NISP in relation to the <1.4
mm fine fraction (sensu Cannon 2000). At most sites, salmon occurs in much higher densities
than herring or smelt, but at GbTo-77, the range in the density of fish taxa is much smaller. In
fact, GbTo-77 is the only site of the four where the combined density of herring and smelt is
greater than salmon. This is in marked contrast to the pattern exhibited at GbTo-31, GbTo-28
and GbTo-46 where the combined herring and smelt are less than half as dense as salmon.
What is most interesting about these results in terms of GbTo-77 is that they illustrate
the relative paucity of salmon at this site in comparison with other villages. This is particularly
true in light of the strong representation of smelt and herring at GbTo-77. The equal volume
samples presented thus far, however, represent more than one context at GbTo-77 and house
depression contexts only at the remaining sites. In order to mitigate the effects that site context
may have on the results, I present in Table 8-21 the results of equal volume samples from house
areas (house depressions and adjacent middens) only. In this comparison, the range in salmon

281
Table 8-20. NISP and density of all major fish taxa identified within all equal volume samples (excluding Stewart et al. 2003). These
include back midden and house contexts. NISPs were generated using specimens caught in 6.3 mm, 2.8 mm and 1.4 mm screens.
Density is calculated by NISP/litre of matrix and in relation to the fine fraction.
NISP Density per litre of matrix Density <1.4mm
Site # of
samples
Total
volume (litres)
<1.4 mm (litres) Smelt Herring Salmon Smelt Herring Salmon Smelt Herring Salmon
GbTo-77 24 24 4.73 39 30 47 1.63 1.25 1.96 9.94 6.34 8.25
GbTo-31 B/D 18 18 7.68 3 3 135 0.17 0.17 7.5 0.39 0.39 17.59
GbTo-28 6 6 1.83 9 21 95 1.5 3.5 15.83 4.93 11.51 52.05
GbTo-46 10 10 3.78 14 11 61 1.4 1.1 6.1 3.71 2.9 16.16
Table 8-21. NISP and density of major fish taxa identified within equal volume samples associated with house features only. NISPs were
generated from 6.3 mm, 28 mm, and 1.4 mm nested screens
NISP Density per litre of matrix Density <1.4mm
Site # of
samples total
volume <1.4
mm Smelt Herring Salmon Smelt Herring Salmon Smelt Herring Salmon
GbTo-77 17 17 3.88 35 24 29 2.06 1.41 1.71 9.23 6.19 7.65 GbTo-31
B/D 18 18 7.68 3 3 135 0.17 0.17 7.5 0.39 0.39 17.59 GbTo-28 6 6 1.83 9 21 95 1.5 3.5 15.83 4.93 11.51 52.05
GbTo-46 10 10 3.78 14 11 61 1.4 1.1 6.1 3.71 2.9 16.16

282
density is still very broad; it is still lowest at GbTo-77, moderate at GbTo-46 and GbTo-31
(B/D) and very high at GbTo-28. The range of densities in smelts and herring is much smaller,
but in house contexts smelt out-number salmon only at GbTo-77. GbTo-31 stands out in this
case, however, as containing a very low density of smelts in both methods of calculating
density. The variability in the density of herring is somewhat broader than smelts but nowhere
near as wide a range as for salmon.
I used the Kruskal-Wallis One-way ANOVA on ranks (Hintze 2004) to test whether the
observed pattern with respect to deposits from in and around houses, is likely representative of
genuine differences among sites rather than variability within middens. I tested the variability
in all three fish densities in two ways. I first tested the salmon, herring and smelt densities that
represent NISP/litre of matrix and then with densities calculated in relation to the <1.4mm fine
fraction. The first test showed that the variability in fish densities between sites was statistically
significant at the .05 level (Table 8-22). The second group of tests, however, showed that the
variability among deposits in terms of salmon densities was strong, but not significant at the .05
level. I also used the Kruskal-Wallis Multiple Comparison Z-value test in order to examine
where the variability actually lies. Because this test is only useful where significant variability
has been demonstrated at the .05 level (Hintze 2004), I applied it to the density values calculated
in relation to the litre of matrix only. These results (Table 8-23) show that for salmon, the
GbTo-77 assemblage is significantly different from all others. For herring and smelts,
significant differences exist between GbTo-31 and the other sites in this study. The implications
of these results are discussed in chapter 9.

283
Table 8-22: Chi-square values produced from the Kruskal-Wallis One-way ANOVA test. Density A was calculated in relation to one litre
matrix. Density B was calculated in relation to the 1.4mm fine fraction.
Salmon Herring Smelt
Density A Density B Density A Density B Density A Density B
Chi-sqaure 11.49 4.9 12.32 13.08 10.29 12.97
P-value 0.009 0.177 0.006 0.004 0.016 0.005

284
Table 8-23. Results of the Kruskal-Wallis Multiple Comparison Z-value test. The density
values used are in relation to the litre matrix. Results are significant if they are greater than
1.96. These values are highlighted in grey.
Salmon GbTo-28 GbTo-31 GbTo-46 GbTo-77
GbTo-28 0 0.263 0.1181 2.2778
GbTo-31 0.263 0 0.1591 2.871
GbTo-46 0.1181 0.1591 0 2.561
GbTo-77 2.2778 2.871 2.561 0
Herring GbTo-28 GbTo-31 GbTo-46 GbTo-77
GbTo-28 0 3.238 1.2938 1.8157
GbTo-31 3.238 0 2.1762 1.964
GbTo-46 1.2938 2.1762 0 0.487
GbTo-77 1.8157 1.964 0.487 0
Smelt GbTo-28 GbTo-31 GbTo-46 GbTo-77
GbTo-28 0 1.723 0.2419 0.2176
GbTo-31 1.7723 0 2.4435 2.7955
GbTo-46 0.2414 2.24435 0 0.0535
GbTo-77 0.2176 2.7955 0.053 0
The Shellfish
The inter-site analysis of shellfish fauna was drawn from column samples at GbTo-46, GbTo-28
and GbTo-31 and from column, auger and bulk samples from GbTo-77. The auger samples
taken at the other village sites have not yet been analyzed for their shellfish data and thus are not
considered in this analysis.
GbTo-77 has considerably higher density of rock, particularly in relation to residue
(sediments and finely crushed shell) and shell, than the other village sites (Figure 8-6). This
indicates that site formation processed at this site differed slightly from the others. The
excavated portions of GbTo-31, GbTo-28 and GbTo-46 indicated that houses had been
constructed on top of pre-existing shell deposits. It is not surprising, therefore, that deposits
from house depressions at these sites contained little gravel. At GbTo-77, house D, and perhaps

285
Figure 8-6. Bar gar showing the average density of materials within column,
bulk, and auger (GbTo-77 only) samples taken from GbTo-77. GbTo-28, GbTo-31
and GcTo-6.
depressions B, C, E and F had been built on top of schist gravel and likely before most shell-
bearing deposits began accumulating. This may indicate that the house depressions I observed
at GbTo-77 represent the first, and perhaps only, houses constructed at this site. GbTo-31 has
the highest density of residue and bone, but also has the lowest density of shell. This may relate
to the fact that so much of the shell from GbTo-31 is mussel, particularly small mussel; this
taxon is friable and easily crushed, thus slipping through the 1.4 mm screen and may explain the
high residue density at this site as well. GbTo-28 has the highest density of shell of any site in
this study. As only six one-litre column and bulk samples were analyzed from GbTo-28, the
difference may reflect sampling.
I grouped shellfish types into non-overlapping categories following the methods used for
the GbTo-77 inter-house depression analysis. Clams are ubiquitous, perhaps because butter
clams, in particular, are extremely versatile (Quayle 1960; Quayle and Bourne 1972:27). Each
shellfish assemblage also consists of different, site-specific shellfish taxa. The list of major 31
invertebrate taxa identified in column samples for GbTo-77, GbTo-46, GbTo-28 and GbTo-
0.00
50.00
100.00
150.00
200.00
250.00
300.00
350.00
400.00
450.00
GbTo-77 GbTo-28 GbTo-31 GbTo-46
Den
sity
in
gra
ms
Sites
Rock
Shell
Residue
Bone
Charcoal
Flora

286
(B/D) is presented in Table 8-24. The largest contrast is between GbTo-77, which contains the
most barnacle of any site, and GbTo-31. The density of mussel is similar at GbTo-31, GbTo-28
and GbTo-46, and much higher than it is at GbTo-77. The GbTo-31 assemblage differs from
the others, however, because of the relative paucity of all other shellfish taxa at this site.
Moreover, GbTo-77 is unique in that it contains virtually no cockle, but relatively high
frequencies of marine snail.
I used Principal Components Analysis (PCA) to explore further the variability among
sites in terms of shellfish remains (Hintze 2004). PCA is an exploratory technique that
summarizes multiple variables as a small number of dimensions or factors. Similarities and
differences in samples may be interpreted based on the relative positioning of points on a
scatterplot (Shennan 1997:265-303). According to Shennan, PCA is particularly good for
continuous data, such as the shellfish mass, that I employ here.
The analysis was run using the average density for each shellfish taxon, except land
snail, at each site. I removed land snail from the analysis because these are likely intrusive.
These results produced three factors accounting for a total of 100% of the variance. I refer to
the first two in this analysis (Figure 8-7). Component 1 accounts for 43% of the variation
within the original nine variables. GbTo-77 plots on the left of the graph and points
representing GbTo-46, GbTo-28 and GbTo-31 plot on the right of the graph. GbTo-77 is
situated on the rocky, outer shore of Digby Island, along semi-protected shoreline. The shellfish
assemblage from this site is dominated by taxa that favour rocky environments and in particular
barnacles. Limpets, chitons and marine snails are well represented at GbTo-77 in comparison to
the other sites.

287
Table 8-24. Mass and average density of major shellfish taxa identified from equal volume
samples at four village study sites.
Shellfish taxon
GbTo-77 GbTo-28 GbTo-31 GbTo-46
Total
mass
Average
density
Total
mass
Average
density
Total
mass
Average
density
Total
mass
Average
density
Molluscs (bivalves)
Mussels 361.72 15.73 273.92 45.65 708.66 39.37 465.88 46.59
Clams 1578.72 68.64 712.70 118.78 824.98 45.83 813.28 81.33
Littleneck clam 751.27 32.66 367.53 61.26 268.20 14.90 484.50 48.45
Cockle 40.62 1.77 253.02 42.17 62.24 3.46 127.78 12.78
Molluscs (gastropods)
Land Snails 1.30 0.06 2.59 0.43 2.71 0.15 33.84 3.38
Marine Snails 162.79 7.08 14.99 2.50 28.91 1.61 34.61 3.46
Chitons 13.06 0.57 0.00 0.00 0.00 0.00 0.31 0.03
Limpets 4.28 0.19 0.48 0.08 0.00 0.00 2.11 0.21
Crustaceans
Barnacles 2419.44 105.19 583.30 97.22 131.26 7.29 547.41 54.74
Echinodermata
Sea Urchin 66.66 2.90 6.23 1.04 4.00 0.22 119.99 12.00
Unidentified shell 231.88 10.08 123.40 20.57 263.77 14.65 214.47 21.45
Total weight 5631.74 244.86 2338.16 389.69 2294.73 127.49 2844.18 284.42

288
Figure 8-7. Scatterplot showing sites in relation to PCA
component 1 and component 2.
Specific species of limpets and chitons favour different levels of exposure to wave
action. The black katy chiton and the ribbed limpet for example, favour exposed coastlines
(Cowles 2005c. Plate limpets, however, favour rocky shores that are protected from strong
wave action (Cowles 2005d). Barnacles, most of which are likely thatched barnacles, prefer
protected and semi-protected shorelines; even in protected areas, thatched barnacles favour
locations where tidal currents are strong. Thatched barnacles also prefer high salinity waters.
GbTo-77 is located along a semi-protected coastline, out of the influence of freshwater, an ideal

289
habitat for thatched barnacles. GbTo-28 and GbTo-31 are located on relatively quiet and
sheltered bays along the eastern shore of Digby Island and emphasize taxa that favour this kind
of habitat, such as small mussels, clams, cockles and littlenecks. GbTo-46 has access to both an
inner and outer coast beach, but because of islands in Tremayne Bay, both shorelines are
relatively protected. Moreover, both shorelines at GbTo-46 consist of sandy substrates and the
invertebrate samples from GbTo-46 contain a higher density of species that favour such
locations. Green sea urchin is particularly well represented at this site; these shellfish, in
particular, favour protected coastlines (Ricketts et al. 1985:286). This suggests that Component
1 is influenced by site location.
Component 2 accounts for 38% of the variation within the original nine variables.
Along this axis, GbTo-31 is the most distinct. The factor loadings suggest that this component
is influenced by the abundance of specific shellfish types in the assemblages, specifically
barnacle, clam and littleneck. Site assemblages that contain relatively high densities of these
taxa cluster together along the bottom of the graph. GbTo-31 plots on its own at the top of the
graph because it contains very low densities of every invertebrate taxa except mussel. GbTo-31
is particularly well protected from direct oceanic conditions and wave shock because it faces
into Dodge Cove, making it ideal for bay mussels (Cowles 2005a; Ricketts et al 1985:98-
100,238). This may account for the abundance of small mussels and the exclusion of other
shellfish taxa at this site.
Fragmentation
I calculated total fragmentation ratios for all sites, using the same formula that I used to
calculate the GbTo-77 fragmentation ratios. These calculations allowed me to assess
differences in the intensity of site use (Figure 8-8). All sites contain deposits ranging from

290
highly fragmented to fairly coarse shell. Shell deposits at GbTo-31 are significantly more
fragmented than those at the three other village sites. The fragmentation at GbTo-31, however,
is exaggerated because of the abundance of mussel, which fragments easily, and the lack of
other, more robust species. I also calculated fragmentation ratios for clam only using the same
formula described above. The results of the clam fragmentation ratios show less dramatic
variation between sites, but the graph in Figure 8-9 still shows that GbTo- 31 contains the most
fragmented shell deposits of all sites. The extent of shell crushing and the relative paucity of
clam species at GbTo-31 likely contribute to the perception that GbTo-31 is “undershelled”
(Ames 2005). However, it also suggests that GbTo-31 was very intensively used. This could
mean that larger groups of people used this site more frequently than the other sites in this
study.
Figure 8-8. Graph of fragmentation ratios from four village sites. Low ratios reflect
more fragmented deposits.
0
0.5
1
1.5
2
2.5
3
3.5
GbTo-77 GbTo-28 GbTo-31 GbTo-46
Fra
gmen
tati
on
rati
o
Sites

291
Figure 8-9. Clam fragmentation ratios from four village sites referenced within this
study.
Summary
In this chapter I have presented the results of the intra-site faunal analysis at GbTo-77 and the
inter-site analysis for the five study sites. My interpretations of inter-house variability in faunal
remains are limited due to problems associated with small sample sizes. I noted and discussed,
however, interesting patterning in the distribution of small fish taxa and invertebrates between
back midden and house depression contexts. The inter-site comparison showed that although
there are broad similarities in terms of economy, there are subtle differences between them in
terms of vertebrate and invertebrate faunal remains. What this might mean in terms of the
central questions in this dissertation is discussed in the next chapter.
0
2
4
6
8
10
12
GbTo-77 GbTo-28 GbTo-31 GbTo-46
Cla
mfr
agm
enta
tio
nra
tio
Sites

292
Chapter 9. Synthesis, Discussion and Conclusion
In this chapter, I draw together the evidence presented in preceding sections of my dissertation
to address the question of whether the house depressions described in this work are the remains
of Houses in the Lévi-Straussian sense. Was the wa’lp, the core of contemporary Tsimshian
society (Cove 1987; Roth 2008), the central organizing principle at GbTo-77? Is there evidence
for Houses at contemporaneous or more recent sites in Prince Rupert Harbour? If these house
depressions are indeed the remains of Houses, what kinds of social relations existed within and
between villages? If they are not, can we establish how groups were, in fact, organized in the
past?
I proposed in chapter 2 that there are two lines of evidence required to establish the
existence of Houses in the archaeological record. First, Houses should provide evidence for
continuity in occupation and the transfer of specific locations (i.e., the house itself) across
multiple generations. This is best reflected in the continued maintenance and long-term
rebuilding of domestic structures. Second, as Houses are by definition groups that own
property, we should see evidence for land tenure, that is, ownership of important local and
regional resource locations. Faunal data are the most effective means of exploring this aspect of
the model. In particular, we should see evidence for variation within economic systems, as well
as the intensive exploitation of resources that are abundant and predictable (Betts 2005; Dyson-
Hudson and Smith 1978; Kelly 1995:189-193; Schalk 1981). These complementary lines of
evidence should ultimately reflect the ownership and inheritance of property (the domestic
structure itself and important resource locations) over the course of multiple generations.
As discussed in chapter 2, I favour a definition of House Societies that considers the role
Houses play in fostering and maintaining social hierarchies. Houses are generally ranked in

293
relation to each other, both within and across communities, and may co-exist with “dwellings,”
or non-property-owning household groups (Carsten and Hugh-Jones 1995b; Gillespie 2000a;
Lea 1995). In addition to the primary lines of evidence I present above, Houses should occur in
conjunction with evidence for pronounced social inequality between households. Social
inequality may be apparent on two levels. First, Houses own specific parcels of property that
differ from each other in terms of productivity; this may foster inequality between property-
owning units. Second, if Houses co-exist with dwellings, Houses may hold higher social
ranking or prestige than non-propertied groups.
My interpretation, therefore, begins with a comparison of architectural and faunal data
from houses A and D at GbTo-77. Whether or not these house depressions are Houses, I
consider why these particular households might have constructed their houses within the same
community. I explore also what village-level faunal, stratigraphic, and architectural data might
reveal about the households that comprise them and consider what kinds of social and economic
relationships may have existed between villages in this area. The village was the basic
community on the Northwest Coast during the contact and post-contact period (Ames 2006:27).
There were, however, other important relationships between groups of related Houses that could
extend beyond villages (Roth 2008). Villages, or winter towns, were the physical correlate of
the Tsimshian tribes, or local groups (see chapter 4). Tsimshian villages were less stable than
Houses and, to quote Miller (1997:19), “functioned in terms of their constituent ranked
[H]ouses.” There are, however, important social, political and economic reasons for households
to live in close proximity to others. First, although land tenure was ultimately structured by
Houses, house-based lands were sometimes located within broader tribal-owned territories.
Second, according to Trieu Gahr (2006) Northwest Coast groups could rely on neighbours to
assist with tasks such as house building and maintenance. Third, winter village life was an

294
important time for feasts and ceremonies (Garfield 1966; Miller 1997:23). And, fourth, villages
were where Houses could best express their rank in relation to others (Ames 2006; Garfield
1966; Miller 1997:19; Vastokas 1966:102).
Interpretation of the Inter-House Depression Results
Architecture
The architectural data from GbTo-77 produced inconclusive evidence for Houses at this site. In
house A, I interpreted lot 8 as a living floor, but the structure lacks many of the hallmarks of
domestic dwellings (e.g., Coupland et al. 2000, 2003) such as evidence for a hearth, charcoal-
stained floor deposits, a bench area and resulting midden, and evidence for a levelled floor
toward the front. Moreover, thick deposits of refuse midden were found on top of the original
floor and show the area was also used for refuse disposal. Lot 6, on top of refuse midden, may
represent a later, but, short-term occupational surface. This suggests that a considerable amount
of time may have elapsed between the initial construction phase and the later occupational
deposit; it also suggests the builders of house A maintained no sense of entitlement to the
structure and its location over this time. Architectural features associated with this house
depression were equally scarce; lot 2a along the north wall of the house A depression may relate
to wall construction, but might also be a post-occupational pit. Lot 2c along the east wall is the
only definite post associated with the house A depression.
There are a number of ways to interpret this: house A may never have been finished, it
may have been used intermittently for short periods of time, or it may have served another
purpose such as additional storage or processing space. No artifacts or faunal data indicate that
house A was a special-purpose structure (see chapter 8). It is important to remember, however,
that a 2 m x 1 m area of the house floor was not excavated in house A and it is possible that

295
pertinent information concerning the life history and use of this structure might be revealed
through further excavation. Very few sites in the Prince Rupert area have produced structures
that might have been used for non-domestic purposes. There is some very limited evidence to
suggest that ceremonial, or at least non-domestic, structures were constructed at two very early
sites, one in the Dundas Islands and the other at the Paul Mason site (Ames and Maschner
1999:238; Ruggles 2007), but these were constructed well behind the main village. At sites
such as GcTo-6, where multiple house depressions were excavated, all structures appear to have
served as dwellings (Coupland et al. 2003). In other words, there is currently no evidence from
other sites to indicate that the depressions composing the village grid (even those oriented away
from the beach front) were anything other than domestic dwellings.
If indeed house A was constructed as a domestic dwelling, its small size, ephemeral
construction, paucity of clearly defined house floors, and evidence for periodic abandonment all
suggest that this house depression was not a House or wa’lp. There is no evidence for long-term
use and reuse of the structure, nor is there evidence for an investment in place that could reflect
continuity of ownership and transmission from one generation to the next.
The evidence from house D is more ambiguous. The evidence for repeated repair and at
least one reconstruction of house D reflects, at a minimum, reoccupation on a seasonal basis.
Evidence for more than one house floor and post replacements however, suggests that this house
may have been in use for a significant period of time, likely decades and may in fact represent
more than one generation. In particular, there is evidence to suggest that the south walls may
have shifted slightly to the north during a second construction episode. This house feature
however, is not dated well enough to elucidate the length of its use. There is some indication
that the size of the household inhabiting house D may have changed over time, but no evidence
for long-term abandonment of the dwelling throughout the course of its use. This suggests

296
greater stability than house A, but does not provide conclusive evidence for multi-generational
transfer of the structure itself. House D therefore, could represent the kind of short-lived House
that Ames (2006:26) envisions. For Ames, the history of the Northwest Coast includes an
understanding of the lifecycle of households, or Houses. Some Houses persisted for long
periods of time, perhaps hundreds, if not thousands, of years (Ames 1996; Grier 2006; Lepofsky
et al. 2009). These Houses were successful at maintaining membership through recruitment of
new members through adoption, slavery, and reproduction. Other Houses were in existence for
only a few generations prior to becoming extinct or absorbed by others; these Houses may be
visible archaeologically as short-lived dwellings. His model leaves room for entirely
unsuccessful Houses, which he hypothesizes might leave no trace in the archaeological record.
While the stratigraphy and architecture from house D may represent more than one generation,
these data do not reveal evidence for the long-term, multi-generational use that is necessary for
even short-lived Houses. The evidence from house A shows that structures, even very short-
lived ones, can, under the right circumstances, leave fairly robust archaeological signatures. In
other words, house depressions, in and of themselves, are not necessarily indications of Houses.
The evidence from house D, however, does raise a number of interesting questions about
the extent to which ethnographically derived models of house design may be applied to the
ancient past, and the relationship between architecture and certain aspects of social organization.
Some of the architectural features associated with house D appear to suggest that this dwelling
may have been walled using the sewing and tying technique (also called “slung” walls), where
horizontal wall planks are suspended between pairs of posts. This is different from what is
recorded ethnographically and has not been documented archaeologically elsewhere in Prince
Rupert Harbour, although there is some, rather slim, indication that this technique may have
been used at the Paul Mason site.

297
The sewing and tying method was used during the post-contact period in all areas across
the Northwest Coast. As discussed in chapter 7, Coast Salish and Nuu-chah-nulth groups
constructed exterior house walls in this way because the planks are easily removed (Marshall
2000; Suttles 1991; Vastokas 1966:22, 58, 62). Coast Salish houses were much larger than
those on the north coast and generally emphasized individuals and their families over the
extended kin group represented by the House. In this context, easily movable walls are part of a
suite of architectural features that reflect flexible rules of residence and kinship, as well as
mobility of individual family groups. Tlingit groups also used this method, on occasion, to
construct temporary interior screens and Tsimshian groups may have used this method in small
temporary structures at fish camps. In these instances, easy dismantling of walls seems related
less to social organization than it did to the fact that these were temporary features. Mortised
walls could be and were often dismantled on a seasonal basis as well, but Suttles (1991:219-
220) argues that this process would have been decidedly more difficult. Northern groups might
take some house planks with them on their seasonal moves “…but probably not those fitted into
the frame of the winter house” (Suttles 1991:219).
It is difficult to say what this kind of evidence for slung walls might reveal about the
inhabitants of house D at GbTo-77 and about the history of dwellings in Prince Rupert Harbour.
Easy dismantling of house walls might be important among small households with limited
access to labour and building materials (Ames and Maschner 1999:152). Tsimshian houses had
potentially two to three times the number of inhabitants of house D (Ames 1996:139; Trieu
Gahr 2006:68). Moreover, house building could take anywhere from a few days to years
depending on the number of people that could be called upon to assist in the construction
process (Trieu Gahr: 65-66). The large houses with mortised walls that define the Tsimshian
architecture of the 19th and 20
th centuries were costly and labour intensive to construct (Niblack

298
1970:306), even with metal tools. Hundreds of hours of labour were required to build these
structures and House members worked together to accumulate the wealth necessary to both
acquire raw materials, reward labourers and to potlatch in honour of the occasion. For example,
ethnographic records concerning the neighbouring Tlingit indicate that it could take the efforts
of 30 people an entire winter to acquire the planks sufficient for building very large dwellings
(Olson 1967). Among contact and post-contact Tsimshians, the construction of large houses
was a direct reflection of the owner‟s wealth and status. To quote Drucker (1965:120),
The winter houses were the Tsimshians‟ principal homes, which the people worked
most of the year to fill with food and valuables so they might spend the winter in
feasts and festivities. These houses were symbols of the people‟s wealth. Only a
prosperous family group was considered capable of building such a structure, and in
a sense this was true. Primitive methods of logging and lumbering required
numerous man-days of labour in the preparation of timbers and planking;
consequently surpluses of food had to be prepared to maintain the labour force while
they performed this work. In addition, both foods and treasure had to be
accumulated to “pay” other groups to perform certain tasks (carving, painting, and
setting up the house), and for the festivities deemed necessary on completion of the
structure.
Help from neighbours was essential to the construction of these dwellings because the
labour demands of large houses would have been beyond the capabilities of their members. Big
Houses not only had more members to assist with house building, but those that were
constructed in large villages may have been able to rely on more neighbours for construction
and maintenance simply by virtue of their proximity to greater numbers of people (Trieu Gahr
2006:67). As such, the role of the community is pertinent to understanding house construction
(Trieu Gahr 2006).
If access to labour is key to the construction of large dwellings, or Houses, those able to
call upon large labour pools may also have been able to construct completed houses in multiple
locations. Swan (1964:6) reports that among the Nuu-chah-nulth, only those who did not have
sufficient lumber dismantled their dwellings on a seasonal basis. Those who could afford it,

299
kept complete structures at both summer and winter villages. Among the Tsimshian, Miller
(1997:21-22) notes that “each house owned fishing sites occupied by standing structures or by
house frames walled over during the fishing season” (emphasis mine). The point of this is to
illustrate the importance of access to labour and building supplies in house construction. It also
suggests that mortised walls may indeed reflect a reluctance to dismantle house walls easily.
Small households in small villages such as GbTo-77 may have built their houses with
easily movable walls because they lacked the labour, and by extension building materials,
required to construct complete dwellings at multiple sites. The households, or Houses, that
developed later in the Prince Rupert Harbour area may have been able to mobilize the labour
required not only for constructing big houses (see Ames 1996; Blackman 1972; Coupland 1996;
Trieu Gahr 2006) but also to build houses at multiple locations. Mortised walls could also
provide greater insulation from the northern winter climate (Vastokas 1966:82,85) so that, in
this environment, mortised walls are part of well-built houses. It is worth noting that, to the best
of my knowledge, 19th-century Tsimshian houses are not illustrated with shell ridges between
structures. While it is true that shellfishing declined in importance over the course of the post-
contact period (Moss 1993; Norton 1985:84), shellfish remains may not have been required for
insulating houses constructed with tightly fitted planks. Stein (2000:65-72) has made the same
observation of contact and post-contact period Coast Salish houses.
Part of the problem of interpreting the significance of architectural features in the past is
that the pool of data is so small for this region. Structure types might relate to social ranking,
the skill of individual builders, building function, season of occupation or individual preference.
If mortised and slung walls existed at the same time in the past, then we might be able to discuss
with greater assurance how architectural styles could reflect social rank. Social ranking might
be most readily expressed at winter villages, as it was during the contact period (Ames 2006;

300
Garfield 1966; Miller 1997:19; Vastokas 1966:102). Although Lévi-Strauss did not discuss the
role of architecture in Houses, many scholars have since noted that among contemporary House
Societies, social rank is expressed through a variety of architectural features, including dwelling
size, internal differentiation of space, elaboration of the external façade, and a strong sense of
permanence in building (Carsten and Hugh-Jones 1995a; Hugh-Jones 1995; Lea 1995). In
many ways, these researchers are drawing upon some of the more prominent ideas about status
and the built environment (Blanton 1994; Cunningham 1964; Hillier and Hanson 1984; Hodder
1990). As Carsten and Hugh-Jones (1995b:37) contend, large, well-built, elaborately decorated
domestic structures “are all vividly permanent constructions, quintessential [H]ouses which
dominate and transform the landscape and stand in contrast to the more ephemeral structures in
which ordinary people live out their lives.” In other words, Houses (propertied groups) may
coexist with dwellings (non-propertied groups). If excavations at other house depressions in the
harbour produced good evidence for long-term occupation and transmission, as well as
elaboration and complexity of design, perhaps including mortised walls, we might be able to
infer that the house D evidence reflects low social ranking, or the buildings of ordinary people.
If, however, further excavation of house depressions reveals evidence only for slung
walls, then it is possible that sewing and tying predates mortised walls in this area. The fact that
there may be evidence for this kind of wall construction at the Paul Mason site in the interior
might give credence to this line of reasoning, but more examples would be necessary before we
could establish the chronology of house construction for this area.
Fauna
At first glance, there are broad similarities in the faunal remains from house D and house A at
GbTo-77. At the very minimum, both houses harvested the same kinds of local and regional

301
resources. This alone has provided tangible evidence to suggest that small households exploited
regions beyond their local catchment more than 2000 years ago. Most of the taxa represented
within the house A and house D assemblages are available within the harbour and most local
resources, including most shellfish, sea mammals, marine fish and deer, could have been
harvested within the immediate vicinity of the site. With respect to shellfish, barnacle species
(including thatched barnacles) were the most abundant taxa represented at the site, followed by
unidentified clams (mostly butter clams) and littleneck clams. All three shellfish taxa could
have been harvested along the shorelines in front of GbTo-77. A handful of shell fragments
may represent shellfish taxa that tend to favour more exposed shorelines, such as California
mussel, ribbed limpets and black katy chitons. I also uncovered three California mussel chisels
(two from the south side midden and one from the back midden deposits adjacent to house A)
from GbTo-77. Limpets and chitons might appear in more diverse ecological conditions than
expected from the biological literature. Alternatively, the presence of shellfish species that
favour exposed coastlines, including the California mussel chisels, suggests that the inhabitants
of GbTo-77 travelled on occasion well beyond the harbour, perhaps for a variety of reasons,
such as resource procurement, trade, social gatherings or warfare. This is not surprising, given
the strong evidence for travel to the Nass River and Skeena River. The closest exposed
coastlines to GbTo-77 are likely the western coast of Dundas Island and Stephens Island. These
“imported” goods may also have come to the harbour area through trade. Further evidence for
trade, or travel, beyond the Prince Rupert area is a single bead made of an unknown material,
found within house D (Appendix C); it is very similar in appearance to “amber” beads found in
burial contexts at GcTo-31 (Ames 2005) and in Haida Gwaii (Orchard 2006:527). Even small
households, therefore, participated to some degree in wider trade networks.
The vertebrate faunal remains reveal that the most abundant vertebrate taxa at GbTo-77

302
in terms of density are salmon and smelt. This is true not only for the site as a whole, but also
for both house depression assemblages. Salmons are available in small streams in the harbour,
but would have been available in much greater numbers at the Skeena watershed (see below).
Smelts, almost half of which are eulachon, can only be fished in large quantities on the north
coast at the Nass River. These factors indicate that people living at GbTo-77 could have
harvested many local resources from the village site itself, but that in order to procure the most
important vertebrate species (salmon and eulachon) in abundance, groups would have had to
leave the harbour and set up residence at the Nass and at Skeena tributaries on an annual basis.
Such moves likely involved the entire household. I estimated in chapter 7 that these house
depressions likely represent small households of 11-15 people. If these are composed of two
small families and some additional adult relatives, then most, or all, household members may
have been required to harvest and process salmon and eulachon in abundance.
As my model is premised on the notion that Houses should exhibit some evidence for
ownership of specific locations and their resources, the potential variability between house
depression assemblages is of primary interest here. The most notable differences between house
A and house D were in the proportion of sea mammal remains that were largely confined to the
deposits in and around house D, and in the density of smelt that was also greater in house D.
Any interpretation of this data however, is hampered by significant problems with sampling. As
noted in chapter 8, the single house A sample came from lot 8, the living floor, while the house
D samples came from multiple in-house contexts. As such, it is not possible to assess whether
the observed differences between the two house assemblages provide genuine insight into
household organization, or whether they reflect sampling.
In sum, the faunal and architectural data from GbTo-77 provide no conclusive evidence
for the existence of Houses at this site. The house D stratigraphic and architectural data are

303
intriguing, but fall short of demonstrating that this house depression in fact represents a House,
even a short-lived one. Most important, it lacks the evidence for long-term (i.e. multi-
generational) continuity in its occupation, repair and rebuilding. Similarly, the faunal data does
not show statistically meaningful differences in the assemblages that would demonstrate
exploitation of different resource patches.
I observed, however, interesting patterning in the distribution of small fish and barnacles
at GbTo-77 that may reveal how households processed, consumed and disposed of specific taxa.
Small fish (specifically herring and smelt) occurred more frequently in and around house
depressions than in back middens. As I discussed in chapter 8, this may reflect processing and
storage practices or simply the fact that small fish bones are more easily lost within houses than
larger bones. Similar practices may be reflected in the distribution of shellfish types. Barnacles
are well represented in back midden contexts, but are relatively infrequent in deposits from in
and around house depressions. This suggests that greater care was taken in the disposal of
barnacle shells than other shellfish. Back midden deposits dominated by barnacle species also
tend to contain relatively little gravel, perhaps reflecting the use of mats or baskets during the
processing, consumption and disposal of barnacles.
Inter-House Comparisons at Other Sites
House depressions were excavated at three of the four other sites in this study. Unfortunately,
only a single depression was excavated at GbTo-46 and GbTo-28 and as such, an inter-house
depression comparison is not possible at either of these sites. The stratigraphic and radiocarbon
evidence for house F at GbTo-28 might reflect the transfer of the house itself across multiple
generations but, only in conjunction with other lines of evidence, including inter-household
variability in economic systems. GcTo-6, however, provides the most thorough evidence for

304
Houses of any site in this study. Multiple house depressions were excavated at this site, some of
which appear to have been inhabited for hundreds of years; dates for house O, for example, are
as early as AD cal 215-555 and as late as AD cal 1045-1290 (95% confidence interval).
Moreover, there appears to be no stratigraphic evidence for a hiatus in occupation throughout
this time period. Although salmon dominates the assemblages that were excavated from all
house depressions at GcTo-6, sea mammals were found only in deposits in and around house O.
As noted in chapter 6, house O is also the largest house depression at this site and produced
substantial evidence that this structure served as an elite residence. Most notably, this house is
the largest within the village and it is the only feature to produce evidence for differential use of
the interior space. In this case, the concentration of sea mammal remains could suggest that the
inhabitants of house O owned these resources and controlled access to them (Coupland et al.
2003). This is precisely the kind of evidence, architectural, settlement and faunal, that we
would expect to find associated with the remains of Houses.
Interpretation of Inter-Site Comparisons
Groups inhabiting the study sites may have practiced some form of ownership over local and
regional resources at the village or site level. Equating sites with meaningful social units has
been justifiably critiqued (Blair 2004; Canuto and Yaeger 2000). Yet, there are a number of
characteristics of at least four of the five village sites in this study that suggest the arrangement
of house depressions we understand as a village likely reflect genuine social relations in the
past. House depressions are often organized in rows or clusters that suggest house inhabitants
considered their relationship to others. Moreover, from the surface, most house depressions
reflect dwellings that were abandoned close to the same time because none of them appear to
have been filled in with refuse. This point should be taken with caution, as the house A

305
stratigraphy suggests that evidence for refuse can be found during excavation. Even at GbTo-77
however, augers taken within the main row of house depressions suggest that these dwellings
remained clear of refuse throughout the use of the site. The midden itself indicates that some
degree of village level organization of labour and settlement must have permeated social
relations at all sites. Like most shell midden sites in the harbour and elsewhere on the
Northwest Coast, the edges of these middens are steeply sloped and well formed. Shell middens
were also cemeteries that likely contain the remains of those who lived in the village (Ames
2005). GbTo-31 is unique however, because there are no surface house depressions in the
terraced front area (B/D), despite stratigraphic evidence for house floors below the surface.
There are other indicators that this site is different from other villages in this study.
The results of the inter-village comparison of faunal assemblages suggests that the
ancient inhabitants of Prince Rupert Harbour adopted at least two, and possibly three, economic
strategies that are visible at the level of the village. These strategies can be characterized by
more or less evidence for salmon specialization and the apparently concomitant shifts in the
approach to local resources. The first, represented by GbTo-77, is a relatively diverse economy
that emphasizes three major fish taxa, salmon, smelt, and herring. There is also a relatively high
proportion of sea mammals and broad spectrum of local resources represented in this site‟s
assemblage. The second economic strategy is represented by GbTo-46, GbTo-28, GbTo-31
(B/D and A/C) and GcTo-6. These sites show more emphasis on salmon, because the density of
salmon at these sites is much higher than at GbTo-77, particularly in relation to other fish.
These sites are generally less diverse in terms of mammals, other fish and birds, although GbTo-
31 A/C is almost as diverse in terms of mammals as GbTo-77 and the most diverse in terms of
birds.

306
Sites exhibiting evidence for more intensive salmon specialization can be further divided
based on period of occupation; radiocarbon dates from GbTo-28, GbTo-46 and GbTo-31 A/C
suggest that these sites may be contemporaneous with GbTo-77 and were inhabited at some
point between approximately 400 cal BC and AD cal 200. Dates from GbTo-46 suggest that
this site (in particular house J) may have been inhabited within the same period as those listed
above. GbTo-46, however, also produced dates with age ranges as late as AD cal 400,
suggesting that this site may have been inhabited after the main occupations at GbTo-77, GbTo-
28 and GbTo-31 A/C. As discussed, GbTo-28 also produced later dates, but the faunal material
presented here is from contexts that probably date somewhere between 400 cal BC and AD cal
1.
GcTo-6 has dates that overlap with the GbTo-77, GbTo-28, GbTo-46 and GbTo-31 A/C
but, most dates fall later than AD cal 200 (at the 95% confidence interval). Four of these dates
are well within the Late Period and an additional eight could date to the Late Middle/Early Late
Period transition. In other words, the most intensive period of occupation at GcTo-6 likely post-
dates the early group of sites exhibiting specialized salmon economies. GbTo-31 B/D also has
one early date, but most of the dates fall well within the Late Period. In sum, the faunal samples
that appear to represent a more salmon-focussed economy fall into two loosely-defined
chronological groups. Group one consists of sites with dates that mostly fall prior to AD cal
200 and includes GbTo-28, GbTo-46, and GbTo-31 A/C. These sites were probably inhabited
within the same 600 year period as GbTo-77. I refer to this group as the Late Middle Period
sites. Dates associated with group two fall mostly after AD cal 200 and consist of GbTo-31 B/D
and GcTo-6. Although GcTo-6 in particular has dates in the Late Middle Period, I refer to this
group as the Transitional/Late Period sites because most of the dates from these sites are either
well within the Late Period, or may fall within the Early Late Period at the 2-sigma age range.

307
These later components differ slightly from GbTo-28, GbTo-46 and GbTo-31 A/C because they
are taxonomically richer in terms of mammals and birds and because they contain specific bird
taxa that may indicate some degree of summer occupation (Stewart and Stewart 2001:186). If
salmon were fished largely from the Skeena watershed over the course of the spring, summer
and fall, then the presence of summer bird remains in these faunal assemblages suggests either
that groups travelled to and from the harbour frequently over the course of the year, or that some
people remained at harbour sites while others carried out other tasks (specifically salmon
fishing) elsewhere.
In other words, these house groups needed to undertake more than one domestic task at
the same time. Managing multiple tasks in this way, or “task simultaneity” (Wilk and Rathje
1982:621), is considered to be a significant motivator behind the development of big houses
(Coupland and Banning 1996a:2) and Northwest Coast Houses are no exception (Ames 1996,
2006; Ames and Maschner 1999). Not only are larger Houses able to take advantage of
“diverse or scattered economic opportunities” (Wilk and Rathje 1982), they are also able to
more effectively maintain control of important resource locations and to engage in broader
networks that extend beyond the harbour. These data alone cannot prove that the organization
of these tasks was at the household and not the community level. Yet, in conjunction with the
evidence at GcTo-6 for household-based resource harvesting, perhaps reflecting ownership of
resources, evidence for task simultaneity may support the argument that the house depressions
at this site were, in fact, Houses.
The faunal data from all village sites is ambiguous with regards to site seasonality. The
abundance of salmon at all sites has been interpreted as evidence for stored salmon and winter
occupation. Yet, many salmon species are available within the harbour throughout the year,
particularly cutthroats, steelheads and fall-run chinooks. While I do not contend that all salmon

308
remains at these villages represent locally harvested salmon, some could have been harvested
locally and consumed fresh. The enormous abundance of salmon at the Skeena River, however,
was undoubtedly considered and used by groups in the harbour (see below). Shellfish are also
abundant at all village sites. While shellfish could be harvested throughout the year, people
likely considered the risks of paralytic shellfish poisoning (psp) as well as the benefits of
daylight low tides, both of which occur during the summer months. It is worth reiterating,
however, that Gonyyaulax, the algae that causes psp does not necessarily occur in the same
location each year. Moreover, we cannot be sure that Gonyyaulax was as prevalent in the past
as it is today (see Cannon 1998), or that pre-contact groups did not process shellfish to mitigate
the effects of psp, as some groups did during the contact period (Batdorf 1990:53).
What the faunal remains do suggest is that people living in the harbour during the Late
Middle Period may have practiced some form of control over local and regional resources at the
village level. Ownership and exclusive control of specific locations on the landscape is a
strategy that is often, although not always, adopted by hunter-gatherers under conditions where
resources are abundant and predictable, such as anadromous fish (Dyson-Hudson and Smith
1978; Kim 2006; Schalk 1977; Thom 2005:30). Many resources available in the harbour are
also abundant and predictable; this is particularly true with regards to most shellfish and herring.
As noted by a number of Tsimshian scholars (Beynon and Barbeau 1953 [in Marsden
2002:140]; Martindale 1999:49, 67; Nolan 1977:317), the harbour was coveted as a place to
live, especially during winter months, because of its mild climate and abundant local resources,
including kelp forests and productive shellfish beds. Kelp forests that provide an ideal habitat
for herring are also important ecological niches for many kinds of sea mammals, in particular
sea otters (Ames 2005a:280-281; Ames and Maschner 1999). Moreover, the intertidal zones in
front of many village sites within the harbour appear to have been cleared, a factor that suggests

309
to MacDonald (2006:23) that important shellfish-gathering locations were owned in the distant
past, just as they were through the contact and post-contact period (Drucker 1965:49-50). The
beaches in the vicinity of GbTo-77 (directly within the bay) are broad and clear of obstructions,
but have not been investigated with the question of “cleared beaches” in mind.
Differences in proportions of sea mammals to land mammals, as well as among shellfish
taxa, suggest that inhabitants of each village site in the study were extracting local resources
primarily from the area in and around where they lived. Despite how close villages such as
GbTo-46 and GbTo-28 are in relation to each other, the shellfish assemblages from these sites
are quite different from each other, which may indicate a highly localized foraging radius in
terms of the invertebrate resources represented within each site. GbTo-77 is dominated by
barnacle species (mostly thatched barnacles), which grow well on the rocky foreshore in front of
the site, while GbTo-28, GbTo-46 and GbTo-31 are dominated by shellfish taxa that favour
sand or gravel substrates. The presence of semi-permanent villages likely dissuaded outsiders
from using resources in another village‟s territory. In other words, travel and access to specific
locations might have been restricted to some degree by the presence of neighbouring villages.
As discussed in chapter 8, I assume that the local fauna represented in these site
assemblages results from activities undertaken from the residential base. This is because there
is some indication that the predominant shellfish types represented in shell midden sites in
Prince Rupert Harbour were likely processed where they were collected (Banahan and Patton
2008). Moreover, Case (1999) has shown that most deer elements are represented in the GcTo-
6 faunal assemblage, suggesting that whole deer carcasses were brought back to the village,
rather than being processed at camp sites. As such, my understanding of village faunal
assemblages is that they are palimpsests, each representing generations of activities that may
have occurred within the immediate vicinity of the village, enmeshed with those that represent

310
the exploitation of specific regional resources. It is clear, however, that we need to understand
the role of smaller sites, such as camps, in order to fully grasp the economic strategies adopted
by people living in the harbour at this time.
The second possible indication of ownership is in regards to resources that would have
been available outside the harbour. The variability in salmon remains, particularly in
comparison with other fish, suggests that productive salmon-fishing locations were not equally
distributed among coastal village estates. Salmon is less abundant at GbTo-77 than at the other
village sites in this study in terms of density and relative proportions. Moreover, the total
GbTo-77 assemblage reflects a more generalized economic strategy than the other Late Middle
Period sites. These differences in conjunction with an emphasis on resources such as salmon
that are abundant and predictable, seasonally and spatially restricted, may indicate that groups
held specific areas as owned territories, and that access to these locations was not open to all
(Betts 2005; Donald and Mitchell 1975; Dyson-Hudson and Smith 1978; Kelly 1995:189-193;
Kim 2002; Schalk 1981; Smith 1991). This is similar to Eerken‟s (2004) understanding of
changing ownership practices in the Great Basin of western North America. In this case, all
household remains produced high densities of piñion seeds, but he interprets a marked increase
in some households, in conjunction with increasing densities of pot shards, as evidence for a
rapid development of household ownership of particular piñion trees. Similarly, all villages in
this study specialized in salmon production to a degree, but some focussed on salmon at the
expense of other resources.
I argued in chapter 8 that some of the salmon represented within the GbTo-77
assemblage could have been harvested from a number of smaller salmon streams within the
harbour, or from coastal waters throughout the year. Indigenous groups, such as the Tsimshian,
fished salmon from multiple streams and rivers to ensure that specific salmon streams were not

311
over fished (Haggan et al. 2006; Menzies and Butler 2007; Prince 2005:70). The aboriginal
salmon fishery all over the Northwest Coast was likely as large as the modern commercial
fishery (Campbell and Butler 2010; Haggan et al. 2006; Meeges and Lacky 2005; Menzies and
Butler 2007), but it is not clear how large the salmon fishery was thousands of years ago. The
archaeological record provides little evidence for substantial changes in salmon-fishing
techniques over the course of millennia. Admittedly, nets and lines preserve poorly in most
archaeological contexts. Netsinkers, while seemingly absent from most sites in this study,
might also be lost during use. Unfortunately, these are precisely the kinds of data that might
reflect alternatives to weir fishing. It is difficult to judge the size of the pre-contact salmon
fishery in the Prince Rupert area, but, recent work by Coupland et al. (2010) demonstrates that
salmon specialization was more pronounced in Prince Rupert Harbour than anywhere else on
the Northwest Coast between 400 cal BC and AD cal 1000.
Over 90% of all fish remains, in the excavated samples from all five sites, is salmon.
This indicates that salmon was an important resource as early as 2400 years ago (Coupland et al.
2010). If pre-contact groups managed productive salmon fishing locations similar to contact
period groups, the inhabitants of the villages in this study may have harvested salmons at a
number of locations, including at local harbour streams and at the Skeena watershed. Assuming
a minimum of 11-15 people per house (many house depressions likely represent larger
households at these sites), the inhabitants of GbTo-46 and GbTo-28 would have consumed
annually between 9000 and 12000 and between 5800 and 8100 salmon respectively; the
inhabitants of all three Late Middle Period villages could have consumed as much as 18000 and
25000 salmon on an annual basis. Moreover, there are at least 18 other village sites in the
harbour that were inhabited at some point between 400 cal BC-AD cal 200 (Archer 1992: Figure
1). While we cannot say that these villages were inhabited at precisely the same time, they

312
appear to represent an increase in the number of village sites founded within the harbour.
Martindale and Marsden (2003) contend that this reflects an increase in population after 2500
years ago. If this was the case, increasing populations might foster ownership of particular
resource locations, including locations of the Skeena watershed. If the people who lived at
these sites were anything like their ethnographic counterparts, management of salmon resources
was a key component to maintaining a successful economy, which included harvesting salmon
from a variety of locations (Haggan et al. 2006; Menzies and Bulter 2007; Prince 2005:70).
To reiterate, the faunal remains from the five village sites I present in this study suggest
that people may have adopted different economic strategies rooted in village affiliation and that
these strategies may indicate that groups exercised some degree of control over locally available
resources and salmon. Ranges in the density of smelt across the same five villages, however,
suggest that people had very different ideas about access to this resource. This is not
uncommon, as hunter-gatherers, even those who control access to some resources, can adopt a
communal or common lands approach to others (Dyson-Hudson and Smith 1978; Eerkens 1999;
Kim 2006; Smith 1991:246). The variability in the density of smelt is much less variable across
all sites than salmon; what is most interesting however is that the densities of smelt at GbTo-77,
GbTo-28 and GbTo-46 are very similar, despite exhibiting significant differences in the
abundance of salmon remains. As I have established, most of these smelt remains are likely
eulachon and this suggests that members of all three Late Middle Period villages traveled to the
Nass River for the capture of these important fish. Eulachon spawn in only a handful of specific
locations up and down the Northwest Coast, and the Nass River is one of the most important
locations. The fact that eulachon gather in incredible numbers at the mouth of the Nass River
for up to 6 weeks prior to spawning, in conjunction with methods of capture from boats using
rakes and nets may have provided all groups with sufficient access (Mitchell and Donald 2001).

313
In other words, no one location on the Nass was more productive than any other. As a result,
control of owned locations was simply not necessary.
The density of smelt at the Transitional/Late Period sites is considerably different from
the Late Middle Period sites. GcTo-6 produced no smelt at all and the density of these remains
at GbTo-31 B/D is very low. A numbers of factors might account for the contrast between Late
Middle Period and Transitional/Late Period sites in terms of this resource. First, sampling may
be contributing to the lack of smelt at GcTo-6. As discussed, smelt, which were absent in
excavated samples, are much better represented in equal volume samples that are screened and
sorted using fine mesh and this likely explains the lack of these small fish from the excavated
assemblages. Second, smelt are also more abundant in and around houses than in back middens.
As all three auger samples from GcTo-6 were taken from the back midden, the lack of smelt in
this context is not surprising. As discussed in chapter 8, smelt and herring remains may be more
easily lost within house floor and bench midden deposits; because their bones are small, herring
and smelt are also less likely to be removed with larger refuse. House floor and bench midden
deposits are more likely to become mixed with side middens during house repair and rebuilding
episodes, which would explain the prevalence of these small fish in side midden contexts as
well as house deposits. The paucity of smelt and herring in the GcTo-6 back midden auger
samples may simply reflect differences in disposal practices between houses and back middens.
This site was, however, excavated at an enormous scale. As such, the lack of any smelts at
GcTo-6 is surprising, given that smelt remains were found in small numbers at all other sites in
this study.
The paucity of smelt and herring in the equal volume samples from GbTo-31 B/D is less
easily understood. In terms of relative proportion, herring is the second most common taxa in
the excavated faunal samples from both Area A/C and B/D, but smelt is poorly represented in

314
both contexts and in both excavated and equal volume samples. The topography and
stratigraphy of area B/D, in addition to its highly fragmented shell deposits, suggest heavy use
associated with living areas; based on the distribution of small fish at GbTo-77, GbTo-28 and
GbTo-46, we might expect that herring and smelt should be better represented in Area B/D.
GbTo-31, however, is very different from the other village sites in this study. There are no
surface house depressions in Area B/D, and this suggests that settlement at this site may have
been very different from other villages in terms of frequency, intensity and size.
If we are to understand the lack of smelt in the Transitional/Late Period sites, these
factors must be kept in mind. However, the low density of smelt could also indicate that
changes occurred with respect to how the inhabitants of coastal villages used the Nass River
area. In particular, it might suggest that people living in Prince Rupert Harbour had little or no
direct access to this region and subsequently to eulachon. Martindale and Marsden (2003; see
also Marsden 2000) have identified the period between 2000 and 1500 BP as one of heightened
warfare that, according to the adawx, include a period when Tsimshian groups in the harbour
lost control of the Nass River. In fact, even after the Tsimshian reestablished themselves in the
harbour, they had yet to reassert themselves at the Nass (Marsden 2000:30). The dates for these
sites are slightly later, but may reflect the same kind of process. Marsden (2000:33) admits that
“[t]he successful defense of the mouth of the Skeena and the Nass rivers by the Tsimshian
began a period of readjustment in which the nature of Tsimshain society underwent dramatic
change. Although often summarized in a sentence of two, the process almost certainly took
place over decades, if not centuries.”
An alternative interpretation is that the paucity of smelt (and in particular eulachon) in
Transitional/Late Period sites reflects a shift in how these fish were processed for storage. In
the 19th
and 20th
centuries, all Tsimshian had access to the eulachon fishing grounds at the Nass

315
River. The presence of smelt remains at all sites, even in very small numbers, suggests that
groups living in the harbour likely traveled to the Nass River each spring, just as the Coast
Tsimshian did in the 19th and early 20
th centuries. This annual migration could have been
orchestrated by the household or by the village as a whole. The abundance of smelt and herring
vertebrae in and around houses at Late Middle Period sites in contrast to the back midden
suggests that fish may have been strung and dried, and then stored inside the house (see chapter
8). The fact that later dated sites contain very low densities of smelt, and to a lesser degree
herring, could mean that groups were rendering eulachon, and perhaps herring, for their oil by
this point in time, rather than stringing or drying them. If this process was undertaken at the
Nass in the case of eulachon, and away from the main living area for herring, then the vertebrae
of these fish would likely not be found in and around house depressions or in the back midden.
MacDonald (2006:27-28) argues that oil rendering required a large body of labour, which might
have been available within larger households. The lack of smelt remains at GbTo-31 and GcTo-
6 therefore, may be yet another indication that household organization was more complex at
these later, larger sites.
Land Tenure, Labour and the Late Middle Period
In sum, the results of this work show that people living at the Late Middle Period sites described
in this study may have owned locations in the immediate vicinity of their villages, as well as at
the Skeena watershed, and that access to these owned estates was determined by community, or
village, affiliation. The patchy yet, abundant, and predictable resources in the harbour and in
the interior produced precisely the kinds of environmental conditions that foster systems of land
tenure. Competition between groups also thrives if resources are in demand and populations
sufficiently high (Kelly 1995:192). On the Northwest Coast, salmon was a desirable

316
commodity, because of their high fat content, particularly where good carbohydrate sources are
few and far between (Cannon 1995:56; Speth and Spielmann 1983); they are also large fish that
are relatively easily harvested and processed for storage. Stored goods may provide for a group
through a period of privation, but also may be converted into wealth that allows groups to
acquire other, scarcer goods and to promote prestige through feasting (Hayden 1994; Roth
2008). Distinguishing between these two kinds of stored goods in the archaeological record is
very difficult (Gould 1985) and it is unclear from the data presented here how much salmon
would have been needed to provide for people through the winter and how much could have
been saved and used for other purposes. Evidence for increasing population within the harbour
at this time (Ames 2005a:303; Martindale and Marsden 2003), however, may have ignited
competition for good salmon-fishing locations.
Land tenure may not have been practiced to the same degree with reference to smelt and
herring among Late Middle Period sites. As Eerkens (1999) notes, it is not unusual for hunter-
gatherers that practice individual ownership over some resources to adopt a common lands
approach to others. For example, although contact period Tsimshian Houses and local groups
were entrenched in systems of private ownership of harbour and interior resources, all
Tsimshian were permitted to harvest eulachon at the Nass River in the late winter/early spring.
Scholars have speculated that eulachon spawn across such a broad area of the Nass estuary in
such abundance that there was little benefit to exerting control over these resources among
Tsimshian groups (Mitchell and Donald 2001).
In some respects, these results imply that ownership strategies were remarkably stable
over thousands of years in this region. As early as 400 cal BC, harbour groups travelled
seasonally to the Nass River and the Skeena River, just as they did in the contact-and post-
contact periods. The essential difference between the recent and ancient past however, is the

317
scale at which people may have adopted land-tenure strategies with respect to salmon and local
resources. Although Tsimshian local groups, or villages, owned stretches of beach front, as well
as tracts of land centred on Skeena tributaries, specific, well-bounded locations on the landscape
were owned by the Houses that comprised them. Patterning that could be interpreted as
evidence for ownership at the household level is missing from the three Late Middle Period sites
in this study. As I have noted, however, the argument against Houses in the archaeological
record of the Late Middle Period sites is largely drawn from negative evidence.
Given the preponderance of other good fat sources such as sea mammals, herring and
smelt at GbTo-77, particularly in comparison with the other study sites, it is possible that the
inhabitants of GbTo-77 did not need to fish salmon in the same quantities as those living at
other villages. Many archaeologists working on the Northwest Coast however, have argued that
labour is key to the effective harvesting and processing of salmon (Ames 1996, 2005a;
Coupland 1996; Hayden 1994; Kim and Grier 2006). For Coupland (1996:126), “[c]ontrol of
productive fishing locations and the labour necessary to produce, process and store resources
was within the capacity of small, egalitarian, multi-family households at about 3000-2500 BP”
(emphasis mine). It is unclear from the fauna recovered from the Paul Mason site precisely how
the abundance observed demonstrates intensive salmon production (Butler and Campbell
2004:329) but, the location of the site on the Skeena River was likely central to the idea that
those living at the Paul Mason site participated in a stored salmon economy. While this may be
true for interior groups that lived year-round on the Skeena River (Matson 1992), the evidence
from this study suggests that this may not have been the case among all small households in the
harbour. It is possible therefore, that the disparity in terms of salmon at GbTo-77, in relation to
the other sites, could reflect essential differences in the composition, quantity and productivity
of owned locations. It may also reveal the limits of small households, or groups of households,

318
in terms of labour. There are fewer house depressions at GbTo-77 than at all other sites in this
study, other than GbTo-31. Although there are only two remaining house depressions at GbTo-
31, there is strong stratigraphic evidence for living floors, and perhaps very large houses at this
site, but these deposits date to the Transitional/Late Period. None of the Late Middle Period
sites exhibit significant variability in house depression sizes but, the house depressions at GbTo-
77 are generally smaller than those at GbTo-28 and GbTo-46. Larger groups of households,
such as at GbTo-28 and GbTo-46, may have been more successful at producing large quantities
of salmon, but may also have more easily acquired and protected owned territories.
When houses are Indeed Houses
The inter-site analysis produced data that I interpret as evidence for the ownership of local and
regional resources by village-groups during the Late Middle Period. As discussed, there is some
indication in the architectural remains and stratigraphy from house D at GbTo-77 for multiple
occupations and the transmission of the dwelling from one generation to the next. The house D
deposits, however, represent a much shorter period of time than has been exhibited at other sites
along the Northwest Coast (Ames 1996; Grier 2001, 2006; Lepofsky et al. 2009). There is some
intriguing, but very limited evidence from house F at GbTo-28 for longevity in habitation and
transmission. Both the GbTo-77 and GbTo-28 data, however, are equivocal and, in and of
themselves, are insufficient to prove the existence of Houses at these sites. Only GcTo-6
produced patterning in architectural, settlement and faunal data which suggest that Houses may
have structured social and economic relations at this village (see Coupland et al. 2003). Given
the dates that relate specifically to the house depressions at GcTo-6, Houses could have
developed here toward the end of the Late Middle Period and, may have continued to exist well
into the Late Period.
319
The argument for Houses at GcTo-6 would be strengthened with evidence for variability
between households in terms of salmon production. Evidence for this kind of disparity between
households may indicate that households, or in this case, Houses, owned specific salmon-fishing
locations. In particular, it would suggest that significant differences existed between Houses in
terms of key resources that undoubtedly influenced social relations between households.
Settlement data from the lower Skeena watershed hint that salmon fishing may indeed have
been household-based. Martindale (1999) and Archer (1984, 1986) identified small scattered
sites, containing one or two small house depressions, that are either circular or rectangular in
shape. They suggest that these different architectural forms may represent the use of this area,
probably on a seasonal basis, by two distinct groups, one from farther up the Skeena and one
from the coast. The few dates associated with this site type indicate that these locations were
inhabited during the Late Period. According to Prince (2005), weirs on the Kitwanga River on
the Skeena watershed also date to the Late Period. In conjunction with other evidence for
House-based ownership of local marine resources and social ranking at GcTo-6, this site type
may indicate that salmon-fishing locations were owned by House groups centred in the harbour.
In order to establish that these small, dispersed interior settlements represent the fishing
activities of coastal groups, we need to know more about them, including the antiquity of weirs
and house depressions. If some coastal groups travelled to the Skeena River to procure salmon
in vast numbers from owned fishing locations, it should be reflected in the presence of fish
weirs, but also in the kinds of weirs that were constructed during this time. Evidence for long-
term use and maintenance of specific weirs and associated house depressions might reflect
owned salmon fishing locations. A variety of weir types have been identified in archaeological
contexts across the Northwest Coast and these seem to reflect differences in fishing-related
labour organization. Favourite Bay fish weir in southeast Alaska, for example, consisted of a
320
large complex series of wooden stakes that may have been in use for almost 1000 years (Moss
and Erlandson 1998). According to Moss and Erlandson (1998:193), this kind of structure may
represent the efforts of corporate groups. Yet, many weirs identified in other locations on the
southern Northwest Coast, specifically on the Oregon coast, could have been built and
maintained by a few individuals. This weir type might not reflect household ownership; given
the relative simplicity of these small weirs, they may not reflect ownership at any scale.
My understanding of when and where Houses came into being in the harbour
corresponds well with Archer‟s (1996, 2001) interpretation of shifts in settlement patterns here.
According to Archer (2001), villages with relatively homogenous house depression sizes reflect
egalitarian social relations. Villages with significant variation in house depression size reflect
social ranking based on households, and this development occurred after AD 100. Neither
GbTo-77 nor GbTo-46 produced conclusive evidence for Houses, which we would expect if
these sites are in fact the remains of egalitarian villages. There is considerable variability in
terms of house depression sizes at GcTo-6, and this site also produced the most convincing
evidence for Houses.
The Tsimshian adawx may also validate the existence of Houses in the past, as well as
the idea that they were central to social, political and economic relations in this region. The
adawx records the migrations of Houses throughout the region and their acquisition of House-
owned territories through negotiations with supernatural beings, marriage alliances, and
assimilation (Martindale and Marsden 2003:22). Pre-existing coastal groups were generally
resistant to incursions from migrants into the area and thus remained distinct from interior
groups for some time (Marsden 2002; Martindale 2006). Although coastal groups were wary of
outsiders, migrants who brought wealth and status to coastal groups were welcomed (Marsden
2002:108; Martindale and Marsden 2003). According to the oral histories, the mechanisms by

321
which groups acquired important resource locations were House-based, not village based.
Scholars contend that these House-based migrations occurred throughout the latter half of the
Middle Period, most likely between 1500 and 2000 years ago (Marsden 2000; Martindale and
Marsden 2003; Martindale 2006).
Conclusions
My primary objective in this dissertation was to address the question of whether the house
depressions I excavated at GbTo-77 represent the remains of Houses, or, put another way, what
is the antiquity of the Tsimshian wa’lp. I considered also what the presence or absence of
Houses might reveal about social relations in the past. The results suggest that Houses may
have organized social, political, and economic relations during the Transitional/Late Period, but
perhaps not during the Late Middle Period. The faunal data provided inconclusive evidence for
owned resource territories, as all differences observed between house depressions in terms of
the faunal assemblage were due to sampling. The stratigraphic and architectural data from
GbTo-77 suggests that house A may have been an incomplete, or very short-lived, dwelling;
alternatively, it may not have been a domestic house at all. House D produced evidence for
habitation over a generation or two, but lacks definitive evidence for long-term multi-
generational use that has been observed elsewhere on the Northwest Coast (e.g., Grier 2006;
Lepofski et al. 2009). Although these data do not rule out the possibility that Houses operated
prior to 2000 years ago in Prince Rupert Harbour, they suggest that all house depressions are not
Houses, as is the case at GbTo-77.
Groups of households, or villages, however, may have influenced the way in which
resources were allocated, and perhaps the way lands were owned, during the Late Middle
Period. GbTo-77 produced the greatest proportion of sea mammals of any site in this study; it

322
was also the most diverse in terms of mammals and contained the lowest proportion of salmon
in excavated samples of any site. I argued that these factors, in conjunction with the low density
of salmon in the equal volume samples, indicate that a slightly different economic strategy was
adopted by the inhabitants of GbTo-77. I suggested that this variability within economic
systems may indicate that groups of households, or villages, owned specific salmon fishing
locations during the Late Middle Period that differed in terms of productivity. I argued also that
variability in shellfish taxa, reflecting a highly localized foraging radius, may indicate that
shellfish beds within the vicinity of village sites were also owned. Moreover, sub-sampling,
using small screens showed that smelts and herring were more abundant at GbTo-77 than
demonstrated in the excavated sample. I observed differences in the abundance of smelts
between sites that may reflect differences in sampling, processing, storage, or resource access.
These results also highlight the importance of sub-sampling midden deposits using small
screens (<2.8 mm); this has been noted by a number of Northwest Coast scholars (Moss 2007;
McKechnie 2005; Stewart et al. 2003).
Although GbTo-77 could rely on other important resources, such as sea mammals and
smelt, lower densities of salmon at this site might reflect broader socio-economic relations that
existed between villages. As Cannon describes for contact period Kwakwaka‟wakw:
Failure to possess a salmon stream did not preclude local groups from making a
living, but it did contribute to perceptions of social and economic disparity among
groups. Valued marine resources were not equally distributed and local
populations were not free to develop mobility strategies that would allow them
equal access to unevenly dispersed resources (Cannon 1995:51).
This passage captures what I believe may have been the social and economic milieu during the
Late Middle Period. Local groups, or villages, may have owned important resource locations
but, there appears to have been some disparity between villages, particularly with regards to
salmon. If, as Cannon contends, differences in owned marine resources influenced social

323
networks, then inequality may have been present between communities before it was present
within them. There are, however, significant gaps in data from the Late Middle Period sites that
may be masking the presence of Houses during this time. Further research that emphasizes
inter-household comparisons might reveal that Houses are older and more prevalent than they
appear to be from this study, at least during the Late Middle Period.
In this study I sought also to know whether Houses, if they existed, were independent, or
“sovereign.” The evidence from GbTo-77 is inconclusive due to the very small faunal samples
that I was able to recover from specific house depressions, but, some of the faunal evidence
from GcTo-6 suggests that house depressions at this site may, indeed, represent Houses. Why,
then, did these particular households choose to spend a portion of the year living side-by-side?
If Houses developed within communities that practiced land tenure, there may be some
inextricable link between households and communities with regards to property that begs further
exploration.

324
References Cited
Abbott, Donald
1981 The World is as Sharp as a Knife: An Anthology in Honour of Wilson Duff. British
Columbia Provincial Museum, Victoria.
Acheson, Steven R.
1991 In the Wake of the ya’áats’ xaatgáay: A Study of Changing Settlement Strategies among
the Kunghit Haida. BAR International Series 711, Oxford.
Ackerman, Robert
1974 Post-Pleistocene Cultural Adaptations on the Northern Northwest Coast. In Proceedings
of the International Conference on the Prehistory and Paleoecology of the Western Arctic
and Subacrtic, pp. 1-20. Univeristy of Calgary Archaeological Association, Calgary.
1992 Earliest Stone Industries on the North Pacific Coast of North America. Arctic
Anthropology 29(2):18-27.
Adams, John W.
1973 The Gitksan Potlatch: Population Flux, Resource Ownership and Reciprocity, Holt,
Rinehart and Winston of Canada, Toronto.
Alexcee, Frederick
n.d. Memory Drawing of Nass River Spring Fishing Camps. On file in the Glenbow Museum
Archives.
Allaire, Louis
1979 The Cultural Sequence at Gitaus: A Case of Prehistoric Acculturation. In Skeena River
Prehistory, edited by George F. MacDonald and Richard I. Inglis, pp. 18-52. National
Museum of Canada, Ottawa.
1993 A Native Mental Map of Coast Tsimshian Villages. In The Tsimshian:Images of The Past;
Views for the Present, edited by Margaret Seguin, pp. 82-98. UBC Press, Vancouver.
Ames, Kenneth M.
1985 Hierarchies, Stress and Logistical Strategies among Hunter-Gatherers in Northwestern
North America. In Prehistoric Hunter-Gatherers, The Emergence of Cultural Complexity,
edited by T. D. Price and J. Brown, pp. 155-180. Academic Press, Orlando.
1991 The Archaeology of the Long Duree: Temporal and Spatial Scale in the Evolution of
Social Complexity on the Southern Northwest Coast. Antiquity 65:935-945.
1996 Life in the Big House: Household Labour and Dwelling Size on the Northwest Coast. In
People who Lived in Big Houses: Archaeological Perspectives on Large Domestic
Structures, edited by Gary G. Coupland and E. B. Banning, pp. 131-150. Prehistory Press,
Madison.
2001 Slaves, Chiefs and Labour on the Northern Northwest Coast. World Archaeology 33(1):
1-17.

325
2002 Going by Boat: The Forager-Collector Continuum at Sea. In Beyond Foraging and
Collecting: Evolutionary Change in Hunter-Gatherer Settlement Systems, edited by Ben
Fitzhugh and Junko Habu, pp. 17-50. Kluwer/Plenum Press, New York.
2005a The North Coast Prehistory Project Excavations in Prince Rupert Harbour, British
Columbia: The artifacts. BAR Series 1342, Oxford.
2005b Intensification of Food Production on the Northwest Coast and Elsewhere. In Keeping it
Living: Traditions of Plant Use and Cultivation on the Northwest Coast of North America,
edited by Douglas Deur and Nancy J. Turner, pp. 67-100. UBC Press, Vancouver.
2006 Thinking about Household Archaeology on the Northwest Coast. In Household
Archaeology on the Northwest Coast, edited by Elizabth A. Sobel, D. A. T. Gahr and
Kenneth M. Ames, pp. 16-36. International Monographs in Prehistory, Ann Arbor.
Ames, Kenneth M., Doria F. Raetz, Stephen Hamilton, and Christine McAfee
1992 Household Archaeology of a Southern Northwest Coast Plank House. Journal of Field
Archaeology 19(3):275-290.
Ames, Kenneth M., Cameron M. Smith, William L. Cornett, Elizabeth A. Sobel, Stephen C.
Hamilton, John Wolf, and Doria Raetz
1999 Archaeological Investigations at 45CL1, Cathlapotle (1991 – 1996), Ridgefield Wildlife
Refuge, Clark County, Washington: A Preliminary Report. US Dept. of Interior, Fish and
Wildlife Service, Region 1. Cultural Resource Series Number 1.
Ames, Kenneth M. and Herbert D. G. Maschner
1999 Peoples of the Northwest Coast: Their Archaeology and Prehistory. Thames & Hudson,
London.
Anderson, Margaret S. and Tammy A. Blumhagen
1994 Memories and Moments: Conversations and Re-collections. BC Studeis 104:85-102.
Anderson, R.
2002 Castor canadensis (On-line), Animal Diversity Web. University of Michigan Museum of
Zoology
http://animaldiversity.ummz.umich.edu/site/accounts/information/Castor_canadensis.html
[accessed June 27, 2008].
Archer, David R. W.
1992 Results of the Prince Rupert Harbour Radiocarbon Dating Project. Unpublished
manuscript ed. Resource Information Centre, heritage Conservation Branch, Government
of British Columbia, Victoria, B.C.
2001 Village Patterns and the Emergence of Ranked Society in the Prince Rupert Area. In
Perspectives on Northern Northwest Coast Prehistory, edited by J. Cybulski, pp. 203-222.
Canadian Museum of Civilization, Gatineau, Quebec.
2008 The Development of a New Approach in the Investigation of Intact Village Sites on the
North Coast of British Columbia. Paper presented at the Society for Anerican
Archaeology annual conference, Vancouver.
Armia, Eugene, and John Dewhirst

326
1990 Nootkans of Vancouver Island. In Handbook of North American Indians, Vol. 7,
Northwest Coast, edited by Wayne Suttles, pp. 391-411. Smithsonian Institution,
Washington.
Arnold, Jeanne E.
1996 The Archaeology of Complex Hunter-Gatherers. Journal of Archaeological Method and
Theory 3(2):77-125.
Bailey, B. E.
1952 Marine Oils with Particular Reference to those of Canada. Bulletin of the Fisheries
Research Board of Canada 59, Fisheries Resource Board of Canada, Ottawa.
Balkwill, Darlene and Jerome S. Cybulski
1992 Faunal Remains. In A Greenville Burial Ground: Human Remains and Mortuary
Elements in British Columbia Coast Prehistory. Archaeological Survey of Canada,
Mercury Series Paper No. 146, Canadian Museum of Civilization, Gatineau.
Banahan, Joan
2005 Small Site Archaeology on the Northern Northwest Coast. Paper Presented at the Canadian
Archaeological Association annual conference in Nanaimo, British Columbia.
2007 Prehistoric Shellfishing in Prince Rupert Harbour, Northern British Columbia. Paper
presented at the Canadian Archaeological Association conference in St. John‟s,
Newfoundland.
Banahan, Joan, and A. K. Patton
2008 Pre-contact Shellfishing in Prince Rupert Harbour, B.C. Paper presented at the Society for
American Archaeology annual conference in Vancouver, British Columbia.
Banfield, A. W. F.
1974 The Mammals of Canada. National Museum of Natural Sciences, Buffalo.
Banner, A., Sybille Haeussler, Will MacKenzie, Jim Pojar, Sandra Thompson, and Rick
Trowbridge
1993 A Field Guide to Site Identification and Interpretation for the Prince Rupert Forest
Region. Province of British Columbia, Victoria.
Banner, A., J. Polgar, and G. E. Rouse
1983 Postglacial Paleoecology and Successional Relationships of a Bog Woodland near Prince
Rupert, British Columbia. Canadian Journal of Forest Research 13(5):938-947.
Banning, Edward B.
2000 The Archaeologist's Laboratory: The Analysis of Archaeological Data. Kluwer
Academic/Plenum Publishers, New York.
Banning, Edward B. and Brian F. Byrd
1987 Houses and the Changing Residential Unit: Domestic Architecture at PPNB „Ain Ghazal,
Jordan. Proceedings of the Prehistoric Society 53:309-325.

327
Barbeau, Marius
1917 Growth and Federation in the Tsimshian Phratries. In Proceedings of the 19th
International Congress of Americanists, pp. 402-408. Washington.
Barnard, Alan
1992 Social and Spatial Boundary Maintenance among Southern African Hunter-Gatherers. In
Mobility and Territoriality: Social and Spatial Boundaries among Foragers and
Peripatetics, edited by Michael J. Casimir and Aparna Rao, pp.91-134. Berg, New York.
Bar-Yosef, Ofer
2002 Natufian: A Complex Society of Foragers. In Beyond Foraging and Collecting:
Evolutionary Change in Hunter-Gatherer Settlement Systems, edited by Ben Fitzhugh and
Junko Habu, pp. 91-152. Klewer Academic, New York.
Batdorf, Carol
1990 Northwest Native Harvest. Hancock House, Blaine.
Begler, Elsie B. and Richard W. Keatinge
1979 Theoretical Goals and Methodological Realities: Problems in the Reconstruction of
Prehistoric Subsistence Economies. World Archaeology 2(2):208-226.
Bender, Barbara
1978 Gatherer-Hunter to Farmer: A Social Perspective. World Archaeology 10(2, Archaeology
and Religion):204-222.
1981 Gatherer-Hunter Intensification. In Economic Archaeology: Towards an Integration of
Ecological and Social Approaches, edited by Alison Sheridan and Geoff N. Bailey, pp.
149-157.
Bertram. D.F., G.W. Kaiser and R.C. Ydenberg
1991 Pattern in the Provisioning and Growth of Nestling Rhinoceros Auklets. The Auk
108:842-852.
Betts, Matthew W.
2005 Seven Focal Economies for Six Focal Places: The Development of Economic Diversity in
the Western Canadian Arctic. Arctic Anthropology 42(1):47-87.
Betts, Matthew W., and T. M. Friesen
2004 Quantifying Hunter-Gatherer Intensification: A Zooarchaeological Case Study from Arctic
Canada. Journal of Anthropological Archaeology 23(4):357-384.
Bigg, M. A.
1981 Harbour seal - Phoca vitulina and P. largha. In Handbook of marine mammals, edited by
Richard J. Harrison and Sam H. Ridgway, pp. 1-27. Academic Press, Toronto.
Binford, Lewis
1977 General Introduction. In For Theory Building in Archaeology, edited by Lewis R. Binford,
pp. 1-10. Academic Press, New York.
328
1978 Dimensional Analysis of Behavior and Site Structure: Learning from an Eskimo Hunting
Stand. American Antiquity 43(3):330-361.
1980 Willow Smoke and Dogs' Tails: Hunter-Gatherer Settlement Systems and Archaeological
Site Formation. American Antiquity 45(1):4-20.
1983 In Pursuit of the Past. Thames and Hudson, New York.
Bird-David, Nurit
1992 Beyond the “Original Affluent Society”: A Culturalist Reformation. Current
Anthropology, 33(1):25-47.
Blackman, Margaret B.
1972 Nei:wons, the "Monster" House of Chief Wi:ha: An Exercise in Ethnohistorical,
Archaeological and Ethnological Reasoning. Syesis 5:211-225.
1976 Creativity in Acculturation: Art, Architecture and Ceremony from the Northwest Coast.
Ethnohistory 23(4):387-412.
1981 Windows on the Past: The Photographic Ethnohistory of the Northern and Kaigani Haida,
Mercury Series Vol. 74, National Museums of Canada, Ottawa.
1990 Haida: Traditional Culture. In Handbook of North American Indians, Vol. 7, Northwest
Coast, pp. 240-260. Smithsonian Institution, Washington.
Blair, Susan E.
2004 Ancient Wolastoq'kew Landscapes: Settlement and Technology in the Lower Saint John
River Valley, Canada. Unpublished dissertation, University of Toronto [UMI, Ann
Arbor].
Blanton, Richard E.
1994 Houses and Households: A Comparative Study. Plenum Press, New York.
Blukis-Onat, A.R
1985 The Multi-functional Use of Shellfish Remains: From Garbage to Community
Engineering. Northwest Anthropological Research Notes 19:201-207.
Boas, Franz
1889 Fifth Report on the Northwestern Tribes of Canada. In Report of the British Association
for the Advancement of Science, The British Association for the Advancement of Science,
London.
1909 The Kwakiutl of Vancouver Island. E.J. Brill, Leiden.
1916 Tsimshian Mythology. Government Printing Office, Smithsonian Institution, Washington.
1921 Ethnology of the Kwakiutl. Bureau of American Ethnology Annual Report 35, Parts I and
II. Government Printing Office, Washington.
1928 Bella Bella Texts. Columbia University Press, New York.
Boehm, Christopher
1993 Egalitarian Behavior and Reverse Dominance Hierarchy. Current Anthropology
34(3):227-254.
Boserup, Esther.

329
1965 The Conditions of Agricultural Growth:The Economics of Agrarian Change under
Population Pressure. Aldine Publishing Company, Chicago.
Bourdieu, Pierre
1977 Outline of a Theory of Practice. Cambridge University Press, Cambridge.
Burch, Ernest and Linda J. Ellanna (eds.)
1994 Key Issues in Hunter-Gatherer Research. Berg, Oxford.
Burchell, Meghan
2004 Gender and Status Representation in Northwest Coast Burials. Unpublished MA Thesis,
McMaster University, Hamilton.
2006 Gender, Grave Goods and Status in British Columbia Burials. Canadian Journal of
Archaeology 30(2):251-272.
Burchell, Meghan and Natalie Brewster
2008 Faunal Indicators of Site Occupation and Marine Resource Use at the Dundas Island
Group, British Columbia. Poster presented at the Society for American Archaeology
annual conference in Vancouver.
Burchell, Meghan and Aubrey Cannon
2006 Shellfish analysis from the Dundas Islands Group. Paper presented at the 39th annual
meeting of the Canadian Archaeology Association, Toronto.
Butler, Virginia L. and Sarah K. Campbell
2004 Resource Intensification and Resource Depression in the Pacific Northwest of North
America: A Zooarchaeological Review. Journal of World Prehistory 18(4):327-405.
Casimir, Michael and Aparnu Rao
1992 Mobility and Territoriality: Social and Spatial Boundaries among Foragers, Fishers,
Pastoralists, and Peripatetics. St. Martin's Press, New York.
Caldwell, Megan
2008 A View From the Shore: Interpreting Fish Trap Use in Comox Harbour Through
Zooarchaeological Analysis of Fish Remains from the Q‟umu?xs Village Site (DkSf-19),
Comox Harbour, British Columbia. Unpublished MA thesis, University of Manitoba,
Winnipeg.
Cameron, Krystal, Meghan Burchell and Trevor Orchard
2008 Coveted Clams and Back-Up Barnacles? Species Identification of Shellfish from the
Dundas Islands Group, British Columbia
Campbell, Ken
1993 Hartley Bay, B.C.: A History. In The Tsimshian:Images of the Past; Views for the
Present, edited by Margaret Seguin, pp. ix. UBC Press, Vancouver
Campbell, Sarah K., and Virginia L. Butler

330
2010 Archaeological Evidence for Resilience of Pacific Northwest Salmon Populations and the
Socioecological System over the last ~7,500 years Ecology and Society 15(1): 17 [online]
Canada, Department of Energy, Mines and Resources
1980 Prince Rupert, Coast Lands District 5, British Columbia. [map] edition 3, 1:50 000, sheet
103J/8, Centre for mapping, Ottawa
Canadian Hydrographic Services
1998 Approaches to Prince Rupert Harbour, 1:40 000, Ministry of Fisheries and Oceans,
Ottawa.
Cannon, Aubrey
1995 The Ratfish and Marine Resource Deficiencies on the Northwest Coast. Canadian Journal
of Archaeology 19:49-60.
2000 Settlement and Sea-Levels on the Central Coast of British Columbia: Evidence from Shell
Midden Cores. American Antiquity 65(1):67-77.
2001 Was Salmon Important in Northwest Coast Prehistory. In People and Wildlife in Northern
North America: Essays in Honour of R. Dale Guthrie, edited by S. C. Gerlach and
Maribeth S. Murray, pp. 178-187. Archaeopress, Oxford.
2002 Sacred Power and Seasonal Settlement on the Central Northwest Coast. In Beyond
Foraging and Collecting: Evolutionary Change in Hunter-Gatherer Settlement Systems,
edited by Ben Fitzhugh and Junko Habu, pp. 311-338. Kluwer Academic/Plenum
Publishers, New York.
2005 Gender and Agency in Mortuary Fashion. In Interacting with the Dead: Perspectives on
Mortuary Archaeology in the New Millennium, edited by G. F. M. Rakita, J. E. Buikstra,
L. A. Beck and S. R. WIlliams, pp. 41-65. University Press of Florida, Gainesville.
Cannon, Aubrey and Meghan Burchell
2009 Clam Growth-Stage Profiles as a Measure of Harvest Intensity and Resource Management
on the Central Coast of British Columbia. Journal of Archaeological Science 36(4):1050-
1060.
Cannon, Aubrey and Meghan Burchell and Rhonda Bathurst
2008 Trends and Strategies in Shellfish Gathering on the Pacific Northwest Coast of North
America. In Early Human Impact on Megamolluscs, edited by A. R. C. Antczak, pp. 7-22.
BAR International Series, Oxford.
Cannon, Aubrey, and D. Y. Yang
2006 Early Storage and Sedentism on the Pacific Northwest Coast: Ancient DNA Analysis of
Salmon Remains from Namu, British Columbia. American Antiquity 71(1):123-140.
Cannon, Debbie Y.
1987 Marine Fish Osteology:A Manual for Archaeologists. Archaeology Press, Simon Fraser
University, Burnaby.
Canuto, Marcello A.
2002 A Tale of Two Communities: Social and Political Transformations in the Hinterlands of
the Maya Polity of Copan. Ph.D. University of Pennsylvania, Philadelphia.
331
Canuto, M. and Jason Yaeger
2000 The Archaeology of Communities: A New World Perspective. Routledge, New York.
Carsten, Janet, and Stephen Hugh-Jones (editors)
1995a About the House: Lévi-Strauss and Beyond. Cambridge University Press, New York.
Carsten, Janet, and Stephen Hugh-Jones
1995b Introduction. In About the House: Lévi-Strauss and Beyond, edited by Janet Carsten and
Stephen Hugh-Jones, pp. 1-46. Cambridge University Press, New York.
Case, Rebecca
1999 After Fish: Site Formation Processes and Deer use at McNichol Creek (GcTo-6).
Unpublished MSc thesis, University of Toronto, Toronto.
Casimir, Michael J. and Aparna Rao
1992 Mobility and Territoriality: Social and Spatial Boundaries among Foragers, Fishers,
Pastoralists, and Peripatetics. Berg, New York.
Childe, V. Gordon
1951 Social Evolution. Watts, London.
Claassen, Cheryl
1998 Shells. Cambridge University Press, Cambridge.
Clague, John J.
1989 Quaternary Geology of the Canadian Cordillera, Introduction. In Quaternary Geology of
Canada and Greenland, edited by R. J. Fulton, pp. 19-22. Minister of Supply and Services
Canada, Ottawa.
Clark, Terrence
2008 Integrative Archaeology: A New Method for Complex Data. Paper presented at the
Canadian Archaeological Association annual conference in Peterborough.
Cobb, Charles R.
1993 Archaeological Approaches to the Political Economy of Nonstratified Societies. In
Archaeological Method and Theory, vol. 5., edited by Michael B. Schiffer, pp. 43-100.
University of Arizona Press, Tucson.
Colley, Sarah M.
1990 The Analysis and Interpretation of Archaeological Fish Remains. Archaeological Method
and Theory 2:207-253.
Community Mapping Network
2009 Fish Information Summary System (FISS).
Cornwall, Ira

332
2010 The Barnacles of British Columbia. In E-Fauna BC: Electronic Atlas of the Fauna of
British Columbia [www.efauna.bc.ca], edited by Brian Klinkenberg, Lab for Advanced
Spatial Analysis, Department of Geography, University of British Columbia, Vancouver.
[October 15th, 2010].
Coupland, Gary
1985 Household Variability and Status Differentiation at Kitselas Canyon. Canadian Journal of
Archaeology 9:39-56.
1988a Prehistoric Cultural Change at Kitselas Canyon. Archaeological Survey of Canada
Mercury Series Paper No 138, Canadian Museum of Civilization, Gatineau.
1988b Prehistoric Economic and Social Change in the Tsimshian Area. In Research in
Economic Anthropology, edited by Barry L. Isaac. pp. 211-244. JAI Press, Greenwich.
1996 The Evolution of Multi-Family Households on the Northwest Coast of North America. In
People who Lived in Big Houses: Archaeological Perspectives on Large Domestic
Structures, edited by Gary G. Coupland and E. B. Banning, pp. 121-130. Prehistory Press,
Madison.
1999 Permit Report 1996-104: Archaeological Investigations at the McNichol Creek Site
(GcTo-6) in 1996 and 1997. Submitted to Ministry of Small Business, Tourism and
Culture, Archaeology Branch, Province of British Columbia, Victoria, B.C.
2004 Resource Ownership, Political Control: Evidence from the Boardwalk Site on the Northern
Northwest Coast. Paper presented at the annual Canadian Archaeology Association
meeting in Winnipeg.
2006 A Chief's House Speaks: Communicating Power on the Northern Northwest Coast. In
Household Archaeology on the Northwest Coast, edited by Elizabeth Sobel, D. A. T. Gahr
and Kenneth M. Ames, pp. 80-96. International Monographs in Prehistory, Ann Arbor.
Coupland, Gary G., and E. B. Banning
1996a Introduction: The Archaeology of Big Houses. In People who Lived in Big Houses:
Archaeological Perspectives on Large Domestic Structures, edited by Gary G. Coupland
and E. B. Banning, pp. 1-9. Prehistory Press, Madison.
1996b People who Lived in Big Houses: Archaeological Perspectives on Large Domestic
Structures, edited by Gary G. Coupland and E. B. Banning, pp. 1-9. Prehistory Press,
Madison.
Coupland, Gary G., Terrence Clark and Amanda Palmer
2009 Hierarchy, Communalism, and the Spatial Order of Northwest Coast Plank Houses.
American Antiquity (74)1:77-106.
Coupland, Gary G., C. Bissel, and S. King
1993 Prehistoric Subsistence and Seasonality at Prince Rupert Harbour: Evidence from the
McNichol Creek Site. Canadian Journal of Archaeology 17:59-73.
Coupland, Gary G., Roger H. Colton, and Rebecca Case
2003 Preliminary analysis of socioeconomic organization at the McNichol Creek Site, British
Columbia. In Emerging from the Mist: Studies in Northwest Coast Culture History, edited
by Gary G. Coupland, R. G. Matson and Quentin Mackie, pp. 152-169. UBC Press,
Vancouver.

333
Coupland, Gary G., Andrew R.C. Martindale and Susan Marsden
2001 “Does Reseource Abundance Explain Local Group Rank among the Coast Tsimshian?” In
Perspectives in Northern Northwest Coast Prehistory, edited by J. Cybulksi, Mercury
Series Archaeological Survey of Canada Paper 160, pp.221-248. National Museum of
Canada, Ottawa.
Coupland, Gary, Kathlyn Stewart, and T. J. Hall
2000 Archaeological Investigations in the Prince Rupert Area in 1999 and 2000: The
Differentiated Regional Economy at Prehistoric Prince Rupert. Archaeology Branch,
British Columbia Ministry of Sustainable Resource Development, Victoria.
Coupland, Gary, Kathlyn Stewart, and A. Katherine Patton
2010 Do You Never Get Tired of Salmon? Evidence for Extreme Salmon Specialization at
Prince Rupert Harbour, British Columbia. Journal of Anthropological Archaeology
29(2):189-207.
Coupland, Gary, Kathlyn Stewart, A. Katherine Patton, and Joan Banahan
2006 Archaeological Investigations in the Prince Rupert Area, 2002-2004: permit 202-208,
final report. Archaeology Branch, British Columbia Ministry of Sustainable Resource
Development, Victoria.
Cove, John J.
1987 Shattered Images: Dialogues and Meditations on Tsimshian Narratives. Carleton
University Press, Ottawa.
Cowles, David
2005a Mytilus trossulus
http://www.wallawalla.edu/academics/departments/biology/rosario/inverts/Mollusca/Bival
via/Mytiloida/Mytilidae/Mytilus_trossulus.html [accessed October 12th, 2010].
2005b Mytilus Californianus
http://www.wallawalla.edu/academics/departments/biology/rosario/inverts/Mollusca/Bival
via/Mytiloida/Mytilidae/Mytilus_californianus.html [accessed October 12th, 2010].
2005c Lottia digitalis
http://www.wallawalla.edu/academics/departments/biology/rosario/inverts/Mollusca/Gast
ropoda/Prosobranchia/Order_Patellogastropoda/Family_Lottiidae/Lottia_digitalis.html
[accessed October 12th, 2010].
2005d Tectura Scutum
http://www.wallawalla.edu/academics/departments/biology/rosario/inverts/Mollusca/Gastr
opoda/Prosobranchia/Order_Patellogastropoda/Family_Lottiidae/Tectura_scutum.html
[accessed October 10th, 2010].
2006 Semibalanus cariosus
http://www.wallawalla.edu/academics/departments/biology/rosario/inverts/Arthropoda/Crustace
a/Maxillopoda/Cirripedia/Semibalanus_cariosus.html [accessed October 10th, 2010].
Crawford, M.L., Crawford, W.A., and Gehrels, G.E.
2000 Terrain Assembly and Structural Relationships in the Eastern Prince Rupert Quadrangle,
British Columbia. In Tectonics of the Coast Mountains, Southeastern Alaska and British
334
Columbia, edited by H.H. Stowell, H.H. and W.C. McClelland, pp. 1-21. Geological
Society of America, Boulder.
.
Croes, Dale R.
1997 The North-Central Cultural Dichotomy on the Northwest Coast of North America: Its
Evolution as Suggested by Wet Site Basketry and Wooden Fish-hooks. Antiquity 7:594-
615.
Croes, Dale R., and S. Hackenberger
1988 Hoko River Archaeological Complex: Modeling Prehistoric Northwest Coast Economic
Evolution. In Research in Economic Anthropology supplement 3, edited by Barry L.
Isaac. pp.19-86. JAI Press Inc., Greenwich
Cybulski, Jerome S.
1992 A Greenville Burial Ground: Human Remains and Mortuary Elements in British Columbia
Coast Prehistory. Canadian Museum of Civilization, Gatineau.
2001 Perspectives on Northern Northwest Coast Prehistory. Canadian Museum of Civilization,
Gatineau.
Daly, Richard H.
2005 Our Box was Full: An Ethnography for the Delgamuukw Plaintiffs. UBC Press,
Vancouver.
Davis, Stanley
1989 The Hidden Falls Site, Baranof Island, Alaska. Aurora, Alaska Anthropological
Association Monograph Series V, Anchorage.
Day, Gordon M.
1953 The Indian as an Ecological Factor in the Northeastern Forest. Ecology 34(2):329-346.
Dean, Jeffrey S.
1978 Independent Dating in Archaeological Analysis. Advances in Archaeological Method and
Theory 1:223-255.
Deur, Douglas, and Nancy J. Turner (editors)
2005a Keeping it Living: traditions of plant use and cultivation on the Northwest Coast of North
America. UBC Press, Vancouver.
Deur, Douglas, and Nancy J. Turner
2005b Introduction: reassessing indigenous resource management, reassessing the history of an
idea. In Keeping it Living: traditions of plant use and cultivation on the Northwest Coast
of North America, edited by Douglas Deur and Nancy J. Turner, pp. 3-36. UBC Press,
Vancouver.
Dewey, T. and M. Potter.
2002 Falco peregrinus (On-line), Animal Diversity Web, University of Michigan Museum of
Zoology
http://animaldiversity.ummz.umich.edu/site/accounts/information/Falco_peregrinus.html
[accessed July 09, 2008].

335
Donald, Leland
1997 Aboriginal Slavery on the Northwest Coast of North America. University of California
Press, Berkeley.
Donald, Leland, and Donald Mitchell
1975 Some Correlates of Local Group Rank among the Southern Kwakiutl. Ethnology 14:325-
346.
Dorsey, George A.
1897 The Geography of the Tsimshian Indians. The American Antiquarian 19:276-282.
Drucker, Philip
1939 Rank, Wealth and Kinship in Northwest Coast Society. American Anthropologist 41:56-
65.
1943 Archaeological Survey on the Northern Northwest Coast. Smithsonian Institution, Bureau
of American Ethnology, Washington.
1951 The Northern and Central Nootkan Tribes. U.S. Government Printing Office, Washington
1955 Indians of the Northwest Coast. McGraw Hill Book Company Inc., New York.
1965 Cultures of the North Pacific Coast. Harper and Row, New York.
1983 Ecology and Political Organization on the Northwest Coast of America. In The
Development of Political Organization in Native North America:1979 Proceedings of the
American Ethnological Society, edited by Elisabeth Tooker, pp. 86-96. The American
Ethnological Society, Washington.
Drucker, Phillip, and Robert F. Heitzer
1967 To Make My Name Good: A Reexamination of the Southern Kwakiutl Potlatch. University
of California Press, Berkeley.
Dunn, John A.
1984 Tsimshian Grandchildren: Redistributive Mechanisms in Personal Property Inheritance.
In The Tsimshian and their Neighbours of the North Pacific Coast, edited by Jay Miller
and Carol M. Eastman.
1993 International Matri-moieties: The North Maritime Province of the North Pacific Coast. In
The Tsimshian:Images of the Past;Views for the Present, edited by Margaret Seguin, pp.
99-109. UBC Press, Vancouver.
Dyson-Hudson, Rada, and Eric A. Smith
1978 Human Territoriality: An Ecological Reassessment. American Anthropologist 80(1):21-41.
Eerkens, Jelmer W.
1999 Common Pool Resources, Buffer Zones, and Jointly Owned Territories: hunter-gatherer
land and resource tenure in Fort Irwin, southeastern California. Human Ecology
27(2):297-318.
2004 Privatization, Small-Seed Intensification, and the Origins of Pottery in the Western Great
Basin. American Antiquity 69(4):653-670.
Eldridge, Morley and Iain McKechnie

336
2008 (Re)calibrating regional chronologies on the North Coast: Data from Prince Rupert
Harbour. Paper presented at the Society for American Archaeology annual conference,
Vancouver.
Ellis, David W and Luke Swan
1981 Teaching of the Tides: Uses of Marine Invertebrates by the Manhousat People. Theytus
Books, Nanaimo.
Ellis, David W. and Solomon Wilson
1981 The Knowledge and Usage of Marine Invertebrates by the Skidegate Haida People of the
Queen Charlotte Islands. Monograph Series, No. 1, The Queen Charlotte Islands Museum
Society, Skidegate.
Ellis, E.
1999 Martes americana (On-line), Animal Diversity Web University of Michiag Museum of
Zoology
http://animaldiversity.ummz.umich.edu/site/accounts/information/Martes_americana.html
[accessed June 27, 2008] .
Els, S.
1974 Root System Morphology of the Western Hemlock, Western Red Cedar, and Douglas Fir.
Canadian Journal of Forestry Research 4:28-38.
Emmons, George T.
1916 The Whale House of the Chilkat. Vol. XIX, part 1, American Museum of Natural History,
New York.
Environment Canada
2010 Canadian Climate Normals.
http://www.climate.weatheroffice.gc.ca/climate_normals/index_e.html. Accessed January
15th 2010.
Fedje, Daryl W. and Tina Christensen
1999 Modeling Paleoshorelines and Locating Early Holocene Coastal Sites in Haida Gwaii.
American Antiquity 64(4):635-652.
Feinman, Gary, and Jill Neitzel
1984 Too Many Types: An Overview of Sedentary Pre-state Societies in the Americas.
Advances in Archaeological Method and Theory 7:39-102.
Fisheries and Oceans Canada
2008 Pacific Salmon. http://www.pac.dfo-mpo.gc.ca/fm-gp/species-especes/salmon-
saumon/index-eng.htm [accessed October 12th, 2010].
2009a Underwater World. Pacific Salmon: Habits and History of Salmon. http://www.dfo-
mpo.gc.ca/science/publications/uww-msm/articles/pacificsalmon-saumonpacifique-
eng.htm [accessed September 22nd, 2010].
2009b What you Should Know about Shellfish Contamination. http://www.pac.dfo-
mpo.gc.ca/fm-gp/rec/points/contamination-

337
eng.htm#PARALYTIC_SHELLFISH_POISON_%28PSP_or_Red_Tide%29 [accessed
November 10th, 2010]
2010 Mapster v 2.2. Retrieved from http://www.pac.dfo-mpo.gc.ca/gis-sig/maps-cartes-eng.htm.
[accessed January 9th 2009].
Fiske, Jo-Anne
1991 Colonization and the Decline of Women's Status: the Tsimshian Case. Feminist Studies
17(3):509-335.
Fitch, J., B. Guilliams, W. Mowbray, A. Patton, S. Gloss, K. Francis and E. Ellis.
1999 Oreamnos americanus (On-line), Animal Diversity Web University of Michigan Museum
of Zoology.
http://animaldiversity.ummz.umich.edu/site/accounts/information/Oreamnos_americanus.
html. [accessed July 23, 2010]
Fitzhugh, Ben
2002 Residential and Logistical Strategies in the Evolution of Complex Hunter-Gatherers on the
Kodiak Archepelago. In Beyond Foraging and Collecting: Evolutionary Change in
Hunter-Gatherer Settlement Systems, edited by Ben Fitzhugh and Junko Habu, pp. 257-
306. Kluwer Academic/Plenum Publishers, New York.
Fitzhugh, Ben, and Junko Habu
2002 Beyond Foraging and Collecting: Evolutionary Change in Hunter-Gatherer Settlement
Systems. Kluwer Academic/Plenum Publishers, New York.
Fladmark, Knut R.
1975 A Palaeoecological Model for Northwest Coast Prehistory. Mercury Series Paper 43.
Archaeological Survey of Canada, Gatineau.
Fladmark, Knut R., Kenneth M. Ames, and Patricia D. Sutherland
1990 Prehistory of the North Coast of British Columbia. In Handbook of North American
Indians, Vol. 7, Northwest Coast, edited by Wayne Suttles, pp. 229-239. Smithsonian
Institution, Washington.
Flenniken, J.J.
1981 Replicative Systems Analysis: A Model Applied to the Vein Quartz Artifacts from the
Hoko River Site. Washington State University, Laboratory of Anthropology Reports No.
59, Pullman
Ford, Pamela
1989 Archaeological and Ethnographic Correlates of Seasonality: Problems
and Solutions on the Northwest Coast. Canadian Journal of Archaeology 13:133-150.
1992 Interpreting the Grain Size Distributions of Archaeological Shell. In Deciphering a Shell
Midden, edited by Julie K. Stein, pp. 283-326. Academic Press, New York.
Fournier, Judith A. and John Dewhirst

338
1980 Zooarchaeological Analysis of Barnacle Remains from Yuquot, British Columbia. In The
Yuquot Project, Volume 2, edited by William Folan and John Dewhirst, pp. 59-102.
National Historic Parks and Sites Branch, Environment Canada, Gatineau.
Galois, Robert M.
2004 A Voyage to the Northwest Side of America: The Journals of James Colnett. UBC Press,
Vancouver.
Garfield, Viola E.
1939 Tsimshian Clan and Society. University of Washington Publications in Anthropology
7(3), Seattle.
1966 The Tsimshian Indians and their Arts. Douglas & McIntyre, Vancouver.
1984 The Tsimshian and their Neighbors of the North Pacific Coast. University of Washington
Press, Seattle.
Gifford-Gonzalez, D., S. D. Newsome, P. L. Koch, T. P. Guilderson, J. J. Snodgrass, and R. K.
Burton
2005 Archaeofaunal Insights on Pinniped-Human Interactions in the Northeastern Pacific. In
The Exploitation and Cultural Importance of Sea Mammals. edited by G. G. Monks, pp.
19-38. Oxbow Books, Oxford.
Gillespie, Susan D.
2000a Rethinking Ancient Maya Social Organization: Replacing "Lineage" with "House".
American Anthropologist 102(3):467-484.
2000b Beyond Kinship: an introduction. In Beyond Kinship: Social and Material Reproduction
in House Societies, edited by Rosemary Joyce and Susan D. Gillespie, pp. 1-21.
University of Pennsylvania Press, Philadelphia.
2000c Lévi-Strauss: Maison and Société à Maisons. In Beyond Kinship:Social and Material
Reproduction in House Societies, edited by Rosemary Joyce and Susan D. Gillespie, pp.
22-52. University of Pennsylvania Press, Philadelphia.
Godfrey, W. E.
1986 The birds of Canada. National Museum of Natural Sciences, Ottawa.
Gott, C.
2001 Gallinago gallinago (On-line), Animal Diversity Web, University of Michigan Museum
of Zoology.
http://animaldiversity.ummz.umich.edu/site/accounts/information/Gallinago_gallinago.ht
ml. [accessed July 09, 2008].
Gozdzik, A.
2001 Ovis dalli (On-line), Animal Diversity Web, University of Michigan Museum of Zoology.
http://animaldiversity.ummz.umich.edu/site/accounts/information/Ovis_dalli.html.
[accessed July 23, 2010].
Gómez-Pompa, Arturo, and Andrea Kaus
1992 Taming the Wilderness Myth. BioScience 42(4):271-279.

339
Gottesfeld, L. M.
1994 Conservation, Territory and Traditional Beliefs: An Analysis of Gitksan and Wet'suwet'en
Subsistence, Northwest British Columbia, Canada. Human Ecology 22(4):443-465.
Gould, Richard
1985 Now Let's Invent Agriculture. In Prehistoric Hunter-Gatherers, edited by T. D. Price and
J. Brown, pp. 427-435. Academic Press, San Diego.
Grayson, Donald K.
1978 Minimum Numbers and Sample Size in Vertebrate Faunal Analysis. American Antiquity
43(1):53-65.
1984 Quantitative zooarchaeology : topics in the analysis of archaeological faunas. Academic
Press, Orlando.
Grayson, Donald K. and Françoise Delpech
2002 Specialized Early Upper Palaeolithic Hunters in Southwestern France? Journal of
Archaeological Science 29(12):1439-1449.
Grayson, Donald K., Françoise Delpech, Jean-Philippe Rigaud, and Jan F. Simek
2001 Explaining the Development of Dietary Dominance by a Single Ungulate Taxon at Grotte
XVI, Dordogne, France. Journal of Archaeological Science 28:115-125.
Grier, Colin
2001 The Social Economy of a Prehistoric Plank House. Unpublished dissertation, Arizona
State University.
2006 Temporality in Northwest Coast Households. In Household Archaeology on the
Northwest Coast, edited by Elizabeth A. Sobel, D. Ann Trieu Gahr and Kenneth M. Ames.
Pp. 97-119 International Monographs in Prehistory, Archaeological Series 16, Ann Arbor.
Grier, Colin, Jangsuk Kim, and Junzo Uchiyama
2006 Beyond Affluent Foragers: Rethinking Hunter-Gatherer Complexity. Oxbow Books,
Oxford.
Haegele, C.W. and J.F. Schweigert
1985 Distribution and Characteristics of Herring Spawning Grounds and Description of
Spawning Behavior. Canadian Journal of Fisheries and Aquatic Sciences 42 (Suppl. I):
39-55.
Haggan, Nigel, Nancy Turner, Jennifer Carpenter, James T. Jones, Quentin Mackie, and Charles
Menzies
2006 12,000+ Years of Change: Linking Traditional and Modern Ecosystem Science in the
Pacific Northwest. Working Paper 2006-02, Fisheries Centre, University of British
Columbia, Vancouver.
Halpin, Marjorie and Margaret Seguin
1990 Tsimshian Peoples:Southern Tsimshian, Coast Tsimshian, Nisga, and Gitksan. In
Handbook of North American Indians, Vol. 7, Northwest Coast, edited by Wayne Suttles,
pp. 267-284. Smithsonian Institution, Washington.
340
Ham, Leonard
1976 Analysis of Shell Samples from Glenrose. In Prehistoric Adaptations at the Glenrose
Cannery Site (DgRr-6), Fraser Delta, BC, edited by R.G. Matson, pp 42-78.
Archaeological Survey of Canada, Mercury Series Paper 52, National Museums of
Canada, Gatineau.
Hamori-Torok
1990 Haisla. In Handbook of North American Indians, Vol. 7, Northwest Coast, edited by
Wayne Suttles, pp. 306-311. Smithsonian Institution, Washington.
Harbo, Rick M.
1997 Shells and Shellfish of the Pacific Northwest: A Field Guide. Harbour Publishing,
Madeira Park.
Hart, John L.
1988 Pacific Fishes of Canada. Fisheries Research Board of Canada, Ottawa.
Hayden, Brian (editor)
1992 A Complex Culture of the British Columbia Plateau : Traditional Stl'âatl'imx Resource
Use. UBC Press, Vancouver.
Hayden, Brian
1990 Nimrods, Piscators, Pluckers and Planters: The Emergence of Food Production. Journal of
Anthropological Archaeology 9(1):31-69.
1994 Competition, Labour, and Complex Hunter-Gatherers. In Key Issues in Hunter-Gatherer
Research, edited by Ernest S. Burch and Linda J. Ellanna, pp.223-239. Berg, Oxford.
1996 Pathways to Power: Principles for Creating Socioeconomic Inequalities. In Foundations of
Social Inequality, edited by T. D. Price and Gary Feinman, pp. 15-85. Plenum Press, New
York.
Hayden, Brian, and Aubrey Cannon
1982 The Corporate Group as an Archaeological Unit. Journal of Anthropological Archaeology
1:132-158.
Hebda, R.
2007 Biodiversity: Geological History in British Columbia. [online] Biodiversity BC Technical
Subcommittee [accessed October 15th, 2010].
Hebda, R.ichard and S.Gay Fredericks
1990 History of Marine Resources of the Northeast Pacific Since the Last Glaciation.
Transactions of the Royal Society of Canada, Series I 1:319-342.
Hebda, Richard and Rolf W. Mathewes
1984 Holocene History of Cedar and Native Indian Cultures of the North American Pacific
Coast. Science 225:711-713.
Hejna, M.

341
2002. Lagopus muta (On-line), Animal Diversity Web, University of Michigan Museum of
Zoology.
http://animaldiversity.ummz.umich.edu/site/accounts/information/Lagopus_muta.html.
[accessed July 09, 2008].
Henderson, M.A. and C.C. Graham
1998 History and Status of Pacific Salmon in British Columbia. North Pacific Anadromous
Fish Commission Bulleitn No. 1:13-22.
Hillier, Bill, and Julienne Hanson
1984 The social logic of space. Cambridge University Press, New York.
Hintze, J.
2004 NCSS. Kaysville, Utah.
Hitztaler, S.
2001 Lagopus leucura (On-line), Animal Diversity Web, University of Michigan Museum of
Zoology
http://animaldiversity.ummz.umich.edu/site/accounts/information/Lagopus_leucura.html
[accessed July 09, 2008].
Hodder, Ian
1982 Symbolic and Structural Archaeology. Cambridge University Press, New York
1990 The Domestication of Europe: Structure and Contingency in Neolithic Societies.
Blackwell, Cambridge.
Hoos, Lindsay M.
1975 The Skeena River Estuary, Status of Environmental Knowledge to 1975: Report of the
Estuary Working Group, Department of the Environment, Regional Board, Pacific
Region. Environment Canada, Ottawa.
Huber, Keturah and Jade Sommer
2003 Barnacles: Fed up with being Unappreciated. Journal of Northwest Anthropology
37(2):207-226.
Huelsbeck, David R.
1988 The surplus Economy of the Central Northwest Coast. In Research in Economic
Anthropology, supplement 3, edited by Barry L. Isaac. pp. 149-178. JAI Press, Greenwich.
Inglis, Richard
1973 Archaeological Project in the Prince Rupert Harbour, 1972. In Archaeological Survey of
Canada Annual Review, 1972, edited by George F. MacDonald. pp. 101-105. National
Museums of Canada, Gatineau.
1976 Wet Site Distributions-- the northern case GbTo-33-- the Lachane Site. In The Excavation
of Water-Saturated Archaeological Sites (Wet Sites) on the Northwest Coast of North
America, edited by Dale R. Croes, pp. 158-185. National Museums of Canada, Gatineau.
Inglis, Gordon, Douglas R. Hudson, Barbara K. Rigsby and Bruce Rigsby

342
1990 Tsimshian of British Columbia since 1900. In Handbook of North American Indians, Vol.
7, Northwest Coast, edited by Wayne Suttles, pp. 285-293. Smithsonian Institution,
Washington.
Ingold, Tim
1986 The Appropriation of Nature. Manchester University Press, Manchester.
2000 The Perception of the Environment: Essays in Livelihood, Dwelling and Skill. Rutledge,
London.
Jerardino, A.
1997 Changes in Shellfish Species Composition and Mean Shell Size from a Late-Holocene
Record of the West Coast of Southern Africa. Journal of Archaeological Science 24 (11):
1031-1044
Johnson, Allen W. and Timothy Earle
2000 The Evolution of Human Societies: From Foraging Group to Agrarian State. 2nd ed.
Stanford University Press, Stanford.
Johnson, Matthew
1993 Housing Culture: Traditional Architecture in an English Landscape. Smithsonian
Institution Press, Washington.
Johnstone, David P.
2003 Early Architecture from the Southern Georgia Strait Region. In Archaeology of Coastal
British Columbia: Essays in Honour of Professor Philip M. Hobler, edited by Roy L.
Carlson, pp. 109-112. Archaeology Press, Simon Fraser University, Burnaby.
Joyce, Rosemary A., and Susan D. Gillespie (editors)
2000 Beyond Kinship: Social and Material Reproduction in House Societies. Univeristy of
Pennsylvania Press, Philadelphia.
Kelly, Robert L.
1995 The Foraging Spectrum: Diversity in Hunter-Gatherer Lifeways. Smithsonian Institution,
Washington.
Kent, Susan
1991 Partitioning Space: Cross-cultural Factors Influencing Domestic Spatial Segmentation.
Environment and Behavior 23:438-473.
Kim, Jangsuk
2006 Resource Patch Sharing among Foragers: Lack of Territoriality or Strategic Choice? In
Beyond Affluent Foragers: Rethinking Hunter-Gatherer Complexity, edited by Colin
Grier, Jangsuk Kim and Junzo Uchiyama, pp. 168-191. Oxbow Books, Oxford.
Klinka, K. and C. Chourmouzis
2000 The Mountain Hemlock. Zone of British Columbia. Forest Sciences Department.
University of British Columbia, Vancouver.

343
Kolb, Michael J., and James E. Snead
1997 It's a Small World after All: Comparative Analyses of Community Organization in
Archaeology. American Antiquity 62(4):609-628.
Kroeber, A. L.
1963 Culture: A Critical Review of Concepts and Definitions. Vintage Books, New York.
de Laguna, Frederica
1990a Eyak. In Handbook of North American Indians, Vol. 7, Northwest Coast, edited by
Wayne Suttles, pp. 189-196. Smithsonian Institution, Washington.
1990b Tlingit. In Handbook of North American Indians, Vol. 7, Northwest Coast, edited by
Wayne Suttles, pp. 203-228. Smithsonian Institution, Washington.
Lawrence, D. L., and S. M. Low
1990 The Built Environment and Spatial Form. Annual Review of Anthropology 19:453-505.
Lawrence, R. J.
1990 Public Collective and Private Space: A Study of Urban Housing in Switzerland. In
Domestic Architecture and the Use of Space: An Interdisciplinary Cross-Cultural Study,
edited by Susan Kent, pp. 73-91. Cambridge University Press, New York.
Lea, Vanessa
1995 The Houses of the Mebengokre (Kayapo) of Central Brazil-A New Door to their Social
Organization. In About the House: Lévi-Strauss and Beyond, edited by Janet Carsten and
Stephen Hugh-Jones, pp. 206-225. Cambridge University Press, New York.
Lepofsky, Dana, Michael Blake, D. Brown, S. Morrison, N. Oakes, and N. Lyons.
2000 The archaeology of the Scowlitz site, Southwestern British Columbia. Journal of Field
Archaeology 27(4): 391–416.
Lepofsky, Dana and Natasha Lyons
2003 Modeling Ancient Plant Use on the Northwest Coast: Towards an Understanding of
Mobility and Sedentism. Journal of Archaeological Science 30:1357-1371.
Lepofsky, Dana, Teresa Trost, and Jesse Morin
2007 Coast Salish Interaction: A View from the Inlets. Canadian Journal of Archaeology
31:190-223.
Lepofsky, Dana, David Schaepe, A. Graesch, M. Lenert, P. Ormerod, K. Carlson, J. Arnold, M.
Blake, P. Moore and J. Clague
2009 Exploring Stó:lo-Coast Salish Interaction and Identity in Ancient Houses and Settlements
in the Fraser Valley, British Columbia. American Antiquity 74:595-626.
Lévi-Strauss, Claude
1982 The Way of the Masks. University of Washington Press, Seattle.
1987 Anthropology and Myth: Lectures 1951-1982. Blackwell, Oxford.
Limas, B.

344
2001 Circus cyaneus (On-line), Animal Diversity Web, University of Michigan Museum of
Zoology.
http://animaldiversity.ummz.umich.edu/site/accounts/information/Circus_cyaneus.html. .
[accessed July 09, 2008].
Losey, Robert J., and Dongya Y. Yang
2007 Opportunistic Whale Hunting on the Southern Northwest Coast: Ancient DNA, Artifact,
and Ethnographic Evidence. American Antiquity 72(4):657-676.
Lovisek, Joan
2007 The Lax Kw’alaams Indian Band and Others v. The Attorney General of Canada and Her Majesty the Queen in Right of the Province of British Columbia. Prepared for James
M. Mackenzie Department of Justice British Columbia Regional Office Vancouver,
British Columbia [accessed on line October 25th 2010].
Loy, T. and G.R. Powell
1977 Archaeological Data Recording Guide. British Columbia Provincial Museum, Heritage Record Series No. 3, Victoria.
Lyman, R. L.
1991 Prehistory of the Oregon Coast: The Effects of Excavation Strategies and Assemblage Size
on Archaeological Inquiry. Academic Press, San Diego.
MacDonald, George F.
1969 Preliminary Culture Sequence from the Coast Tsimshian Area, British Columbia.
Northwest Anthropological Research Notes 3(2):240-254.
1984 Painted Houses and Woven Blankets: Symbols of Wealth in Tsimshian Art and Myth. In.
The Tsimshian and their Neighbours of the North Pacific Coast, edited by Jay Miller and
Carol M Eastman. pp.109-136. University of Washington Press, Seattle.
1993 The Epic of Nekt. In The Tsimshian: Images of the Past; Views for the Present, edited by
Margaret Seguin, pp. 65-81. UBC Press, Vancouver.
2002 Haida Monumental Art: Villages of the Queen Charlotte Islands. UBC Press, Vancouver.
MacDonald, George F., and Richard I. Inglis (editors)
1976 The Dig: An Archaeological Reconstruction of a West Coast Village. Archaeological
Survey of Canada, Museum of Civilization, Gatineau.
1979 Skeena River Prehistory. National Museum of Canada, Ottawa.
1981 An Overview of the North Coast Prehistory Project (1966-1980). BC Studies 48:37-63.
MacDonald, George F. and Jerome S. Cybulski
2001 The Prince Rupert Harbour Project. In Perspectives on Northern Northwest Coast
Prehistory, edited by Jerome S. Cybulski. pp. 1-24. Archaeological Survey of Canada,
Canadian Museum of Civilization. Canadian Museum of Civilization, Gatineau.
MacDonald, George F., Gary Coupland and David Archer
1987 The Coast Tsimshian, ca. 1750. Historical Atlas of Canada: From the Beginning to 1800.
Mackie, Alexander P., and Laurie Williamson

345
2003 Nuu-chah-nulth Houses: Structural Remains and Cultural Depressions on Southwest
Vancouver Island. In Emerging from the Mist: Studies in Northwest Coast Culture
History, edited by Gary G. Coupland, R. G. Matson and Quentin Mackie, pp. 105-151.
UBC Press, Vancouver.
Marsden, Susan
2000 Defending the Mouth of the Skeena: Perspectives on Tsimshian Tlingit Relations. Tin Ear
Press, Prince Rupert.
2002 Adawx, Spanaxnox and the Geopolitics of the Tsimshian. BC Studies 135:101-144.
Marshall, Yvonne
2000 Transformations of Nuu-chah-nulth Houses. In Beyond Kinship: Social and Material
Reproduction in House Societies, edited by Rosemary A. Joyce and Susan D. Gillespie,
pp. 73-102. University of Pennsylvania Press, Philadelphia.
2006 Houses and Domestication on the Northwest Coast. In Household Archaeology on the
Northwest Coast, edited by Elizabeth Sobel, D. A. T. Gahr and Kenneth M. Ames, pp. 37-
56. International Monographs in Prehistory, Ann Arbor.
Martindale, Andrew R. C.
1999 The River of Mist: Cultural Change in the Tsimshian Past. Unpublished Ph.D. dissertation,
University of Toronto, Toronto [UMI, Ann Arbor].
2003 A Hunter-Gatherer Paramount Chiefdom: Tsimshian Developments through the Contact
Period. In Emerging from the Mist: Studies in Northwest Coast Culture History, edited by
Gary G. Coupland, R. G. Matson and Quentin Mackie, pp. 12-50. UBC Press, Vancouver.
2006a Methodological Issues in the Use of Tsimshian Oral Traditions (Adawx) in Archaeology.
Canadian Journal of Archaeology 30(2):158-192.
2006b Tsimshian Houses and Households through the Contact Period. In Household
Archaeology on the Northwest Coast, edited by Elizabeth Sobel, D. A. Trieu Gahr and
Kenneth M. Ames, pp. 140-158. International Monographs in Prehistory, Ann Arbor.
Martindale, Andrew, Bryn Letham, Duncan McLaren, David Archer, Meghan Burchell,
and Bernd R. Schöne
2009 Mapping of Subsurface Shell Midden Components through Percussion Coring: Examples
from the Dundas Islands. Journal of Archaeological Science 36(7):1565-1575.
Martindale, Andrew R. C. and Susan Marsden
2003 Defining the Middle Period (3500 BP to 1500 BP) in Tsimshian History through a
Comparison of Archaeological and Oral Records. BC Studies 138:13-50.
Matson, R. G.
1983 Intensification and the Development of Cultural Complexity: The Northwest versus the
Northeast coast. In The Evolution of Maritime Cultures on the Northeast and Northwest
Coasts of America, edited by R. Nash, pp. 124-148. Simon Fraser University, Burnaby.
1992 The Evolution of Northwest Coast Subsistence. In Long-Term Subsistence Change in
Prehistoric North America, Vol. Supplement 6, edited by Dale R. Croes, R. A. Hawkins
and Barry L. Isaac, pp. 367-430. JAI Press, Greenwich.

346
2003 The Coast Salish House: Lessons from Shingle Point, Valdes Island, British Columbia. In
Emerging from the Mist: Studies in Northwest Coast Culture History, edited by Gary G.
Coupland, R. G. Matson and Quentin Mackie, pp. 76-104. UBC Press, Vancouver.
Matson, R. G. and Gary Coupland
1995 The prehistory of the Northwest Coast. Academic Press, San Diego.
Matson, R. G., G. Coupland, and Q. Mackie
2003 Emerging from the Mist: Studies in Northwest Coast Culture History. UBC Press,
Vancouver.
May, J.
1979 Archaeological Investigations at GbTn-19, Ridley Island, a Shell Midden in the Prince
Rupert Area. Manuscript no. 1530, Archaeological Survey of Canada, Gatineau.
McCartney, Allen P.
1979 A Processual Consideration of Thule Whale Bone Houses. In Thule Eskimo Culture: An
Anthropological Retrospective, edited by Allen P. McCartney, pp. 301-323.
Archaeological Survey of Canada Mercury Series Paper 88, Gatineau.
McCollough, K.
2001. Falco sparverius (On-line), Animal Diversity Web, Universsity of Michigan Museum of
Zoology.
http://animaldiversity.ummz.umich.edu/site/accounts/information/Falco_sparverius.html.
[accessed July 09, 2008].
McDonald, James
1983 An Historic Event in the Political Economy of the Tsimshian: Information on the
Ownership of the Zimacord District. British Columbia: A Place for Aboriginal Peoples, a
special issue of BC Studies (No.57), edited by Paul Tennant, pp 24-37.
2005 Cultivating in the Northwest: Early Accounts of Tsimshian Horticulture. In Keeping it
Living: Traditions of Plant Use and Cultivation on the Northwest Coast of North America,
edited by Douglas Deur and Nancy J. Turner, pp. 240-273. UBC Press, Vancouver.
McGuire, Randall, and Michael B. Schiffer
1983 A Theory of Architectural Design. Journal of Anthropological Archaeology 2(3):277-303.
McKechnie, Iain
2005 Column Sampling and the Archaeology of Small Fish at Ts‟ishaa. In Ts‟ishaa:
Archaeology and Ethnography of a Nuu-chah-nulth Origin Site in Barkley Sound, edited
by A.D. McMillan and D.E. St. Claire. pp. 206-223. Archaeology Press, Burnaby.
McLaren, Duncan
2008 Sea Level Change and Archaeological Site Locations on the Dundas Island Archipelago of
North Coast British Columbia. Unpublished Ph.D. dissertation, University of Victoria,
Victoria.
McMillan, Alan D.

347
2000 Since the Time of the Transformers. UBC Press, Vancouver.
McMillan, Alan D., Iain McKechnie, Denis E. St. Claire, and S. G. Frederick
2008 Exploring Variability in the Maritime Resource Use on the Northwest Coast: a case study
from Barkley Sound, Western Vancouver Island. Canadian Journal of Archaeology
32(2):214-238.
Meengs, Chad C. and Robert T. Lackey
2005 Estimating the Size of Historical Oregon Salmon Runs. Reviews in Fisheries Science
13(1):51-66.
Meidinger, Del, and Jim Pojar
1991 Ecosystems of British Columbia. Special Report Series 6, Province of British Columbia,
Victoria.
Menzies, Charles, and Caroline F. Butler
2007 Returning to Selective Fishing through Indigenous Fisheries Knowledge: The Example of
K'moda, Gitxaala Territory. American Indian Quarterly 31(3):441-464.
Miller, Jay
1997 Tsimshian Culture: A Light through the Ages. University of Nebraska Press, Lincoln.
Mitchell, Donald
1981 Sebassa'a Men. In The World is as Sharp as a Knife: An Anthology in Honour of Wilson
Duff, edited by Donald K. Abbott, pp. 79-88. Bristish Columbia Provincial Museum,
Victoria.
1983 Seasonal Settlements, Village Aggregations and Political Autonomy on the Central
Northwest Coast. In The Development of Political Organization in Native North America:
1979 Proceedings of the American Ethnological Society, edited by Elisabeth Tooker, pp.
97-107. The American Ethnological Society, Washington.
1990 Prehistory of the Coasts of Southern British Columbia and Northern Washington. In
Handbook of North American Indians, Vol. 7, Northwest Coast, edited by Wayne Suttles,
pp. 340-358. Smithsonian Institution, Washington.
Mitchell, Donald and Leland Donald
2001 Sharing Resources on the North Pacific Coast of North America: The Case of the
Eulachon Fishery. Anthropologica 43(1):19-35.
Monks, Gregory G.
1987 Prey as Bait: the Deep Bay Example. Canadian Journal of Archaeology 11:119-142.
Morgan, K. H., K. Vermeer and R.W. McKelvey
1991 Atlas of pelagic birds of western Canada. Canadian Wildlife Service, Delta.
Morrison, K.
1994 The Intensification of Production: Archaeological Approaches. Journal of Archaeological
Method and Theory 1(2):111-159.

348
Moss, Madonna L.
1989 Archaeology and Cultural Ecology of the Prehistoric Angoon Tlingit. Ph.D. University of
California, Santa Barbara, Santa Barbara [UMI, Ann Arbor].
1993 Shellfish, Gender and Status on the Northwest Coast: Reconciling Archaeological,
Ethnographic and Ethnohistorical Records of the Tlingit. American Anthropologist
95(3):631-652.
1996 Gender, Social Inequality, and Cultural Complexity: Northwest Coast women in
prehistory. In Debating Complexity: proceedings of the 26th annual conference of the
Archaeological Association of the University of Calgary, edited by D. A. Meyer, P. C.
Dawson and D. T. Hanna, pp. pp. 81-88. University of Calgary, Calgary.
1998 Northern Northwest Coast Regional Overview. In: North Pacific and Bering Sea Maritime
Societies: the Archaeology of Prehistoric and Early Historic Coastal Peoples. Arctic
Anthropology 35(1):88-111.
2004 The Status of Archaeology and Archaeological Practice in Southeast Alaska in Relation to
the Larger Northwest Coast. Arctic Anthropology 41(2):177-196.
2005 Tlingit Horticulture: an Indigenous or Introduced Development? In: Keeping it Living:
Traditions of Plant Use and Cultivation on the Northwest Coast of North America, edited
by Douglas Deur and Nancy J. Turner, pp. 274-295. University of Washington Press,
Seattle.
2007 The Killisnoo Picnicground Midden (49-SIT-124) Revisited: Assessing Archaeological
Recovery of Vertebrate Faunal Remains from Northwest Coast Shell Middens. Journal of
Northwest Anthropology 41(1):1-17.
Moss, Madonna L., and Jon M. Erlandson
1995 Reflections on North American Pacific Coast Prehistory. Journal of World Prehistory
9(1):1-45.
1998 A Comparative Chronology of Northwest Coast Fishing Features. In Hidden Dimensions:
The Cultural Significance of Wetland Archaeology, edited by Kathryn Bernick, pp. 180-
198. University of British Columbia Press, Vancouver.
2010 Diversity in North Pacific Shellfish Assemblages: the Barnacles of Kit‟n‟Kaboodle Cave,
Alaska. Journal of Archaeological Science 37:3359-3369.
Moss, Madonna, Jon Erlandson M., and R. Stuckenrath
1990 Wood Stake Fish Weirs and Salmon Fishing on the Northwest Coast: Evidence from
southern Alaska. Canadian Journal of Archaeology 14:143-158.
Moss, Madonna L. Dorothy M. Peteet and Cathy Whitlock
2007 Mid-Holocene Culture and Climate on the Northwest Coast of North America. In
Climate Change and Cultural Dynamics: A Global Perspective on Mid-Holocene
Transitions, edited by David G Anderson, Kirk A. Maasch and Daniel H. Sandweiss, pp.
491-521. Elsevier, Amsterdam.
Nabokov, Peter and Robert Easton
1989 Native American Architecture. Oxford University Press, Oxford.
Natural Resources Canada.
2009 Rivers. Atlas of Canada, Retrieved from
http://atlas.nrcan.gc.ca/auth/english/learningresources/biblio_atlases/index.html

349
Newell, Diane
1993 Tangled Webs of History: Indians and the Law in Canada’s Pacific Coast Fisheries.
University of Toronto Press, Toronto.
Newsome, S.D., Etnier, M.A., Gifford-Gonzalez, D., Phillips, D.L., van Tuinen, M., Hadly,
E.A., Costa, D.P., Kennett, D.J., Guilderson, T.P., Koch, P.L.
2007 The shifting baseline of northern fur seal (Callorhinus ursinus) ecology in the northeast
Pacific Ocean. Proceedings of the National Academy of Sciences 104(23): 9709-9714
Neylan, Susan
2003 The Heavens are Changing: Nineteenth-Century Protestant Missions and Tsimshian
Christianity. McGill-Queen's University Press, Montreal.
Niblack, A. P.
1970 Coast Indians of Southern Alaska and Northern British Columbia. Johnson Reprint
Company, New York.
Nolan, Richard W.
1977 The Utilization of Fish Resources by the Coast Tsimshian: Predicting Optimal Patterns of
Exploitation. Unpublished MA thesis, Trent University, Peterbourgh.
Norton, Helen
1985 Women and Resources of the Northwest Coast: Documentation from the 18th and Early
19th Centuries. Ph.D. University of Washington, Seattle, Washington.
Olson, R.
1967 Social Structure and Social Life of the Tlingit in Alaska. University of California
Anthropological records, No. 26, University of California, Berkeley.
Orchard, Trevor J.
2007 From Otters to Urchins: Continuity and Change in Haida Economy during the Late
Holocene and Maritime Fur Trade Periods. Ph.D. University of Toronto, Toronto,
Ontario.
Orchard, Trevor J., and Terrance Clark
2005 Multidimensional Scaling of Northwest Coast Faunal Assemblages: A Case Study from
Southern Haida Gwaii. Canadian Journal of Archaeology 29:88-112.
Pajerski, L.
2005 Accipiter gentilis (On-line), Animal Diversity Web, University of Michigan Museum of
Zoology.
http://animaldiversity.ummz.umich.edu/site/accounts/information/Accipiter_gentilis.html
[accessed July 09, 2008].
Parker Pearson, Mike

350
1982 Mortuary Practices, Society and Ideology: An Ethnoarchaeological Study. In Symbolic
and Structural Archaeology, edited by Ian Hodder, pp. 99-113. Cambridge University
Press, Cambridge.
Pauketat, Timothy R.
2000 Politicization and Community in the Pre-Columbian Mississippi Valley. In The
Archaeology of Communities: A New World Perspective, edited by Marcello A. Canuto
and Jason Yaeger, pp. 16-43. Routledge, London.
2001 Practice and History in Archaeology: An Emerging Paradigm. Anthropological Theory
1(1):73-98.
2007 Chiefdoms and Other Archaeological Delusions. Altamira Press, Lanham, MD.
Pauketat, Timothy R., and Susan M. Alt
2005 Agency in a Postmold? Physicality and the Archaeology of Culture-Making. Journal of
Archaeological Method and Theory 12(3):213-237.
Paynter, Robert
1989 The Archaeology of Equality and Inequality. Annual Review in Anthropology 18:369-399.
Pilsbry, Henry A.
1916 The Sessile barnacles (Cirripedia) Contained in the Collections of the U.S. National
Museum; Including a Monograph of the American Species. Smithsonian Institution,
Bulletin 93, Washington.
Price, T. D., and A. Brown (editors)
1985 Prehistoric Hunter-Gatherers: The Emergence of Cultural Complexity. Academic Press,
Orlando.
Prince, Paul
1998 Settlement, Trade and Social Ranking at Kitwanga, British Columbia. Unpublished Ph.D.
dissertation McMaster University, Hamilton.
2005 Fish Weirs, Salmon Productivity, and Village Settlement in an Upper Skeena River
Tributary, British Columbia. Canadian Journal of Archaeology 29(1):68-87.
Quayle, D. B.
1960 Intertidal Bivalves of British Columbia. British Columbia Provincial Museum, Victoria,
B.C.
Quayle, D.B. and N. Bourne
1972 Clam Fisheries of British Columbia. Fisheries Research Board of Canada, Ottawa.
Quitmyer, I.R. and D.S.Jones
2000 The over-exploitation of hard clams (Mercenaria spp.) from five archaeological sites in the
southeastern United States. The Florida Anthropologist 53(2-3): 160-168.
Rapoport, Amos
1969 House Form and Culture. Prentice-Hall, Englewood Cliffs, N.J.

351
Reimer PJ, Baillie MGL, Bard E, Bayliss A, Beck JW, Blackwell PG, Bronk Ramsey C, Buck
CE, Burr GS, Edwards RL, Friedrich M, Grootes PM, Guilderson TP, Hajdas I, Heaton
TJ, Hogg AG, Hughen KA, Kaiser KF, Kromer B, McCormac FG, Manning SW, Reimer
RW, Richards DA, Southon JR, Talamo S, Turney CSM, van der Plicht J, Weyhenmeyer
CE.
2009. IntCal09 and Marine09 radiocarbon age calibration curves, 0–50,000 years cal BP.
Radiocarbon 51(4):1111–50.
Reitz, Elizabeth J., and Elizabeth S. Wing
1999 Zooarchaeology. Cambridge University Press, New York.
Renker, Ann M and Erna Gunther
1990 Makah. In Handbook of North American Indians, Vol. 7, Northwest Coast, edited by
Wayne Suttles, pp. 422-430. Smithsonian Institution, Washington.
Ricketts, Edward F., Jack Calvin and Joel W. Hedgepeth
1985 Between Pacific Tides. Fifth edition, Stanford University Press, Stanford.
Ringrose, T.J.
1993 Diversity Indices and Archaeology. In Computing the Past: Computer Applications and
Quantitative Methods in Archaeology, CAA92, edited by J. Andersen, T. Madsen and I
Scollar. pp. 279-285. Aarhus University Press, Aarhus.
Roper, Donna C.
2007 The effect of the Direct Historical Approach on the Development of Theory in Plains
Archaeology: A Comment on Mitchell's Analysis of the MBP Legacy. American Antiquity
72(4):785-788.
Roth, Christopher F.
2002 Goods, Names and Selves: Rethinking the Tsimshian Potlatch. American Ethnologist
29(1):123-150.
2008 Becoming Tsimshian: The Social Life of Names. University of Washington Press, Seattle.
Rowley-Conwy, Peter
2001 Time, Change and the Archaeology of Hunter-Gatherers: How Original is the "Original
Affluent Society"? In Hunter-Gatherers: An Interdisciplinary Perspective, edited by C.
Painter-Brick, R. H. Layton and Peter Rowley-Conwy, pp. 39-72. Cambridge University
Press, Cambridge.
Ruggles, Angela
2007 Home is Where the Hearth is? Evidence for an Early Non-Domestic Structure on the
Dundas Islands of North Coastal British Columbia. Unpublished MA thesis, Univeristy of
British Columbia, Vancouver.
Ryder, June M.
1978 Geology, Landforms and Surficial Materials. In The Soil Landscapes of British Columbia,
edited by K. W. G. Valentine, P. N. Sprout, T. E. Baker and L. M. Lavkulich, pp. 11-34.
Ministry of the Environment, Victoria.

352
1989 Quaternary Geology of the Canadian Cordillera, Climate. In Quaternary Geology of
Canada and Greenland, edited by R. J. Fulton, pp. 26-31. Geological Survey of Canada,
Ottawa.
Sahlins, Marshall D.
1972 Stone Age Economics. Aldine-Atherton, Chicago.
Samuels, S. R.
1991 Patterns in Ozette Floor Middens: Reflections of Social Units. In Ozette Archaeological
Project Research Reports, Volume I, House Structure and Floor Midden, edited by S. R.
Samuels, pp. 175-270. Wasington State University, Department of Anthropology Reports
of Investigations 63, Pullman.
Sandstrom, Alan R.
2000 Toponymic Groups and House Organization: The Nahuas of Northern Veracruz, Mexico.
In Beyond Kinship: Social and Material Reproduction in House Societies, pp. 53-72.
University of Pennsylvania Press, Philadelphia.
Sassaman, Kenneth E.
2004 Complex Hunter–Gatherers in Evolution and History; A North American Perspective.
Journal of Archaeological Research 12(3):227-280.
Schaefer, D. G.
1978 Climate. In The Soil Landscapes of British Columbia, edited by K. W. G. Valentine, P. N.
Sprout, T. E. Baker and L. M. Lavkulich, pp. 3-10. Ministry of the Environment, Victoria.
Schaepe, David
2003 Validating the Maurer House. In Archaeology of Coastal British Columbia: Essays in
Honour of Professor Philip M. Hobler, edited by Roy L. Carlson, pp. 113-152.
Archaeology Press, Simon Fraser University, Burnaby.
Schalk, R. F.
1977 The Structure of an Anadromous Fish Resource. In For Theory Building in Archaeology,
edited by Lewis R. Binford, pp. 207-249. Academic Press, Orlando.
1981 Land Use and Organizational Complexity among Foragers of Northwestern North
America. In Affluent Foragers: Pacific Coasts East and West, edited by Shuzo Koyama
and David Hurst Thomas, pp. 53-76. National Museum of Ethnology, Osaka.
Schiffer, Michael B.
1972 Archaeological Context and Systemic Context. American Antiquity 37(2):156-165.
1976 Behavioral Archeology. Academic Press, New York.
1983 Toward the Identification of Formation Processes. American Antiquity 48(4):675-706.
Schlimme, K.
2003 Neovison vison (On-line), Animal Diversity Web, University of Michigan Museum of
Zoology
http://animaldiversity.ummz.umich.edu/site/accounts/information/Neovison_vison.html.
[accessed June 27, 2008].

353
Schortman, Edward M.
1989 Interregional Interaction in Prehistory: The Need for a New Perspective. American
Antiquity 54(1):52-65.
Schrire, Carmel
1984 Past and Present in Hunter Gatherer Studies. Academic Press, Orlando, Fla.
Seguin, Margaret
1984 Lest There Be No Salmon: Symbols in Traditional Tsimshian Potlatch. In The Tsimshian,
Images of the Past; Views from the Present, edited by Margaret Seguin, pp. 110-136.
UBC Press, Vancouver.
1993 Introduction. In The Tsimshian: Images of the Past; Views for the Present, edited by
Margaret Seguin, pp. ix. UBC Press, Vancouver.
Shefferly, N. and K. Joly.
2000 Rangifer tarandus (On-line), Animal Diversity Web, University of Michigan Museum of
Zoology,
http://animaldiversity.ummz.umich.edu/site/accounts/information/Rangifer_tarandus.html
[accessed June 27, 2008].
Shennan, Stephen
1997 Quantifying Archaeology. Academic Press, San Diego, Calif.
Simonsen, Bjorn O.
1973 Archaeological Investigations in the Hecate Strait-Milbanke Sound Area of British
Columbia. National Museums of Canada, Ottawa.
Smith, Cameron M.
2006 Formation Processes of a Lower Columbia River Plankhouse Site. In Household
Archaeology on the Northwest Coast, edited by Elizabeth Sobel, D. A. T. Gahr and
Kenneth M. Ames, pp. 233-269. International Monographs in Prehistory, Ann Arbor.
Smith, Eric Alden
1991 Risk and Uncertainty in the Original "Affluent Society": Evolutionary Ecology of
Resource-Sharing and Land Tenure. In Hunters and Gatherers: History, Evolution
and Social Change, edited by T. Ingold and D. Riches. pp. 222-51, Berg, Oxford.
Smith, Harlan I.
1909 Archeological Remains on the Coast of Northern British Columbia and Southern Alaska.
American Anthropologist 11(4):595-600.
1929 Kitchen-Middens of the Pacific Coast of Canada. National Museum of Canada Annual
Report for 1927, Bulletin 56:42-46.
1997 Ethnobotany of the Gitksan Indians of British Columbia. Mercury Series Paper/ Canadian
Ethnology Services no. 132. Canadian Museum of Civilization, Ottawa.
Spaete, L. and K. Wehrly.

354
2006. Oncorhynchus clarkii (On-line), Animal Diversity Web, University of Michigan Museum
of Zoology,
http://animaldiversity.ummz.umich.edu/site/accounts/information/Oncorhynchus_clarkii.h
tml [accessed October 06, 2010].
Speth, J.D. and K.A. Speilman
1983 Energy Source, Protein Metabolism, and Hunter-Gatherer Subsistence Strategies. Journal
of Anthropological Archaeology 2:1-31.
Southon, J. R., D. E. Nelson, and J. S. Vogel
1990 A Record of Past Ocean-Atmosphere Radiocarbon Differences from the Northeast Pacific.
Paleoceanography 5:197-206.
Statistics Canada
1947 Canada Year Book, 1947; The Official Statistical Annual of the Resources, History,
Institutions, and Social and Economic Conditions of the Dominion. Minister of Trade and
Commerce, Ottawa.
Stein, Julie K.
1992 Deciphering a Shell Midden. Academic Press, San Diego.
2000 Exploring Coast Salish Prehistory: The Archaeology of San Juan Island. University of
Washington Press/Burke Museum of Natural History and Culture, Seattle.
Stein, Julie K., Jennie N. Deo, and Laura S. Phillips
2003 Big Sites;Short Time: Accumulation Rates in Archaeological Sites. Journal of
Archaeological Science 30(3):297-316.
Steinway, M.
2003 Phoca vitulina (On-line), Animal Diversity Web, University of Michigan Museum of
Zoology,
http://animaldiversity.ummz.umich.edu/site/accounts/information/Phoca_vitulina.html.
[accessed June 27, 2008]
Steneck, R.S., M.H. Graham, B.J. Bourque, D. Corbett, J.M. Erlandson, J.A. Estes and M.J.
Tegner
2002 Kelp Forest Ecosystems: Biodiversity, Stability, Resilience and Future. Environmental
Conservation 29: 436-549.
Stewart, Hilary
1977 Indian Fishing: Early Methods on the Northwest Coast. Douglas & McIntyre, Vancouver.
1984 Cedar. Douglas and McIntyre, Vancouver.
1996 Stone, Bone, Antler & Shell.Douglas & McIntyre, Vancouver.
Stewart, Kathlyn, Gary Coupland, and Donna Naughton
2003 Effects of Screen Size on Fish Element Recovery in Northern Northwest Coast Middens.
In Transitions in Zooarchaeology, edited by Kathlyn Stewart and Frances Stewart, pp. 53-
63. Canadian Museum of Nature, Ottawa.

355
Stewart, Kathlyn, and Frances Stewart
2001 Prehistoric Subsistence and Seasonality at Prince Rupert Harbour: History and Synthesis
of Zooarchaeological Research. In Perspectives on Northern Northwest Coast Prehistory,
edited by Jerome Cybulski, pp. 173-202. Canadian Museum of Civilization, Gatineau.
Stewart, Kathlyn, Frances Stewart and Gary Coupland
2009 Boardwalk, Northern Northwest Coast, Canada: A New Face to an Old Site. Canadian
Journal of Archaeology 33(2):205-33
Strathmann, M.F.
1987 Reproduction and Development of Marine Invertebrates of the North Pacific Coast.
University of Washington Press, Seattle.
Sutherland, Patricia
2001 Revisiting an Old Concept: The North Coast Interaction Sphere. In Perspectives on
Northern Northwest Coast Prehistory, edited by Jerome Cybulski, pp. 49-60. Canadian
Museum of Civilization, Gatineau.
Suttles, Wayne
1987a Affinal Ties, Subsistence and Prestige Among the Coast Salish. In Coast Salish Essays,
pp.16-25. Talonbooks, Vancouver.
1987b Coping with Abundance: Subsistence on the Northwest Coast. In Coast Salish Essays,
pp.45-66. Talonbooks, Vancouver.
1990 Central Coast Salish. In Handbook of North American Indians, Vol. 7, Northwest Coast,
edited by Wayne Suttles, pp. 453-475. Smithsonian Institution, Washington.
1991 The Shed-Roof House. In A Time of Gathering, edited by Robin K. Wright, pp. 73-87.
University of Washington Press,
Swadesh, M.
1948 Motivations in Nootka Warfare. Southwestern Jounral of Anthropology 4:73-88.
Swan, James G.
1964 The Indians of Cape Flattery, at the Entrance to the Strait of Juan de Fuca, Washington
Territory. Shorey Book Store, Seattle.
Testart, Alain
1982 The Significance of Food Storage Among Hunter-Gatherers: Residence Patterns,
Population Densities, and Social Inequalities. Current Anthropology 23(5):523-537.
Thom, Brian D.
2005 Coast Salish Sense of Place: Dwelling, Meaning, Power, Property and Territory in the
Coast Salish World. Unpublished dissertation, McGill University.
Thomas, J.
1999 Haliotis kamtschatkana (On-line), Animal Diversity Web University of Michigan
Museum of Zoology,
http://animaldiversity.ummz.umich.edu/site/accounts/information/Haliotis_kamtschatkana
.html. [accessed July 09, 2008].

356
Trieu Gahr, D.
2006 Architects to Ancestors: The Life Cycle of Plankhouses. In Household Archaeology on the
Northwest Coast, edited by Elizabeth Sobel, D. A. T. Gahr and Kenneth M. Ames, pp. 57-
79. International Monographs in Prehistory, Ann Arbor.
Trigger, Bruce G.
1989 A History of Archaeological Thought. Cambridge University Press, Cambridge
1990 Monumental Architecture: A Thermodynamic Explanation of Symbolic Behaviour. World
Archaeology 22(2):119-132.
1991 Distinguished Lecture in Archeology: Constraint and Freedom - A New Synthesis for
Archeological Explanation. American Anthropologist 93(3):551-569.
Turner, Nancy J. and Sandra Peacock
2005 Solving the Perennial Paradox: Ethnobotanical Evidence for Plant Resource Management
on the Northwest Coast. In Keeping it Living: Traditions of Plant Use and Cultivation on
the Northwest Coast of North America, edited by Douglas Deur and Nancy J. Turner, pp.
101-150. UBC Press, Vancouver.
Turner, Nancy J., Robin Smith, and James T. Jones
2005 "A Fine Line Between Two Nations": Ownership Patterns for Plant Resource
Management on the Northwest Coast. In Keeping it Living: Traditions of Plant Use and
Cultivation on the Northwest Coast of North America, edited by Douglas Deur and Nancy
J. Turner, pp. 151-180. UBC Press, Vancouver.
Turunen, Carrie, and Jukka Turunen
2003 Development History and Carbon Accumulation of a Slope Bog in Oceanic British
Columbia, Canada. The Holocene 13(2):225-238.
Vastokas, Joan M.
1966 Architecture of the Northwest Coast Indians of America. Unpublished dissertation,
Columbia University.
Wason, Paul K.
1994 The Archaeology of Rank. Cambridge University Press, New York.
Waterson, Roxana
1995 Houses and Hierarchies in Island Southeast Asia. In About the House: Lévi-Strauss and
Beyond, edited by Janet Carsten and Stephen Hugh-Jones, pp. 47-68. Cambridge
University Press, New York.
Wessen, Gary C.
1988 The Use of Shellfish Resources on the Northwest Coast: The View from Ozette. In
Prehistoric Economies of the Pacific Northwest Coast, edited by Barry L. Isaac, pp. 179-
210. JAI Press Inc., Greenwich.
Whitaker, A. R.
357
2008 Incipient Aquaculture in Prehistoric California?: Long-term Productivity and
Sustainability vs. Immediate Returns for the Harvest of Marine Invertebrates. Journal of
Archaeological Science 35(4):1114-1123.
Wilk, Richard
1997 Household Ecology: Economic Change and Domestic Life Among the Kekchi Maya of
Belize. Northern Illinois University Press, De Kalb.
Wilk, Richard R. and W. L. Rathje
1982 Household Archaeology. American Behavioral Scientist 6:617-639.
Williams, Judith
2006 Clam Gardens: Aboriginal Mariculture on Canada's West Coast. New Star Books,
Vancouver.
Williams, Nancy M., and Eugene S. Hunn (editors)
1982 Resource Managers: North American and Australian Hunter-Gatherers. Westview Press
for the American Association for the Advancement of Science, Boulder.
Wilson, P.J.
1988 The Domestication of the Human Species. Yale University Press, New Haven.
Woodburn, James
1980 Hunter-Gatherers Today and Reconstructing the Past. In Soviet and Western
Anthropology, edited by E. Gellner, pp. 94-118. Columbia University Press, New York.
1982 Egalitarian Societies. Man 17(3):431-451.
Yagoda, S.
2004 Pycnopodia helianthoides (On-line), Animal Diversity Web, University of Michiagn
Museum of Zoology,
http://animaldiversity.ummz.umich.edu/site/accounts/information/Pycnopodia_helianthoid
es.html. [accessed July 09, 2008].
Yee Cannon, Debbie
1987 Marine Fish Osteology: A Manual for Archaeologists. Archaeology Press, Burnaby.
Yesner, David R.
1987 Life in the Garden of Eden: Causes and Consequences of the Adoption of Marine Diets by
Human Societies. In Food and Evolution, edited by Marvin Harris and E. Ross, pp. 285-
310. Temple University Press, Philadelphia.

358
Appendix A. Auger Samples
Table A-1. Location and depth of augers taken at GbTo-77.
Auger # Location Stratigraphy
1
Side midden between D
and E 0-55cm. humus. No sample taken
55-85cm. sand
85-143cm. mixed shell
85-143cm. brown mud
175cm. orange/brown schist and mud" water table (like beach)
2 House floor house D 0-65cm. humus and black organic soil
96-109cm. black organic with schist
109-146cm. mud and schist. Water table (beach material). Some shell in lab
146-168cm. mud and schist
3 House floor house D 0-83cm. humus. No sample taken
83-101cm. black organic soil with schist
101-110cm. black organic soil with schist
110-115cm. black organic soil with schist. Stopped due to large subsurface
rock. Some shell in lab
4
Side midden
between C and D 0-60cm. humus. No sample taken
60-105cm. mixed shell
139-147cm. small quantities of mixed shell
147-152cm. small quantities of fragmented mixed shell
152 to 160cm. small quantities of fragmented mixed shell
164cm. schist gravel
5
Side midden between
house C and D
0-59cm. humus. No sample taken
59-84cm. mixed shell black soil, medium grain shell
84-100cm. mixed shell
100-109cm. mixed shell
109-122cm. black soil, small particles of mixed shell
122-139cm. mixed shell
139-154cm. mixed shell
154-165cm. dense mussel layer 165-174cm. dense mussel layer
174-200cm. mud and schist
6 Back midden house C 0-20cm. humus
20-100cm. dense and compact mixed shell with pockets of urchin
100-111cm. mixed shell in black soil
111-129cm. grey soil, finely crushed mixed shell
129-145cm. grey soil, finely crushed mixed shell
145-165cm. dense barnacle layer
165-189cm. mixed shell in black soil and brown sand
189-194cm. mixed shell in black soil; water table
194-205cm. mud and schist

359
Auger # Location Stratigraphy
7 Back midden, house C 0-20cm. humus. No sample taken
20-65cm. mixed shell (some mussel)
65-83cm. mixed shell with lots of urchin
83-100cm. mixed shell in black soil
100-109cm. mixed shell in grey soil, very large pieces
109-134cm. mixed shell (some barnacle) in black soil
134-155cm. mixed shell (some whole shell, some barnacle) in black soil
155-159cm. dense mixed shell in black soil, some very large pieces of
shell
159-168cm. mixed shell black soil, med to large fragments
168-179cm. mixed shell (some mussel) black soil, med to large pieces of
shell
179-200cm. mixed shell med to large pieces of shell and then smaller part
200cm. mud and schist mud and schist, very wet
8
House C interior south
wall 0-50cm. humus
50-75cm. dense shell layer mixed shell
75-105cm. black organic soil very little shell identified during analysis
105-130cm. black organic soil with schist
130-155cm. mud and schist; water table
155-175cm. mud and schist
9
house C interior back
wall 0-75cm. humus. No sample taken
75-113cm. black organic soil with schist soil has green tint toward bottom
of this sample
113-146cm. black organic soil with schist greenish with red
146-181cm. mud and schist; water table
10
house c interior north
wall back 0-77cm. humus. No sample taken
77-100cm. mixed shell small quantities
100-114cm. black organic soil with schist
114-123cm. schist gravel
123-132cm. schist gravel (earthy solid) dark grey/black
11
Side midden between
houses B and C. 0-54cm. humus. No sample taken
54-80cm. Mussel and other shell
80-119cm. mixed shell/schist (some mussel)
119-137cm. mixed shell
137-165cm. mixed shell thinning out
165cm. schist gravel
12 0-52cm. humus. No sample taken
52-100cm. mixed shell
100-117cm. mixed shell thinning out
? 132-140cm. no visible shell
13 House floor 0-45cm. humus. No sample
45-77cm. sand (grey) no visible shell
77-95cm. no visible shell

360
Auger # Location Stratigraphy
14 0-70cm. humus. No sample taken.
70-105cm. mixed shell
105-130cm. mixed shell less shell more schist
130-150cm. schist gravel
15
Side Midden between
house A and B 0-42cm. humus. No sample taken
42-57cm. black organic soil matrix mixed shell
57-100cm. mixed shell black organic soild matrix
100-108cm. mixed shell (mussel and clam visible), some large pieces in
black soil
108-123cm. many small particles, but still some large mixed shell
123-145cm. mixed shell grey matrix and schist
145-155cm. grey earthy matrix, some shell may be from sides schist gravel
16 North Periphery 0-40cm. humus. No sample taken
40-100cm. mixed shell black soil matrix. Small to med particles
100-128cm. mixed shell black soil matrix
128-145cm. mixed shell black soil. Small to med particles
145cm. schist gravel grey soil. Through midden a few cm above
17
North Periphery, front
area 0-75cm. humus. No sample taken.
75-121cm. mixed shell black soil matrix. Small to med particles
121-164cm. mixed shell black soil matrix. Some schist, dense shell
164-182cm. mixed shell earthy brown with schist, less shell
182-200cm. schist gravel grey soil
18
North Periphery, back
area 0-72cm. humus. No sample taken
72cm. mixed shell stopped due to large subsurface obstruction-rock.
19
North Periphery, back
area 0-77cm. humus. No sample taken
77-106cm. mixed shell (barnacle)
106-129cm. dense barnacle layer
129-142cm. mixed shell and schist beach sand at bottom
20
North periphery, back
area 0-46cm humus. No sample taken
46-100cm. mixed shell (some mussel) black soil matrix
100-131cm. mixed shell black soil, large shell particles
131-140cm. mixed shell black soil, large and small particles
140-148cm. mixed shell last 5cm grey schist
21 Back midden, house B 0-44cm. humus. No sample taken.
44-100cm. mixed shell mixed with dark soil
100-133cm. mixed shell grey soil, lots of shell in
133-176cm. mixed shell (some mussel) grey soil
176-205cm. mixed shell (some mussel and urchin) grey soil
205-221cm. mixed shell grey soil
221-236cm. schist gravel densely packed schist

361
Auger # Location Stratigraphy
22
Back Midden between
house D and E 0-49cm humus. No sample taken.
49-100cm. mixed shell black soil, small to med particles
100-137cm. mixed shell black soil, larger shell particles
137-172cm. mixed shell grey soil
172-185cm. schist gravel
23 Back Midden, house F 0-60cm. humus. No sample taken, off midden
60-80cm. schist gravel grey soil, sandy, like beach
80-100cm. mud and schist brown, large particle sand, water table
24
South periphery, back
area 0-40cm. humus. No sample taken
40-60cm. humus and sand
60-90cm. mixed shell black soil, fine particle shell, wet
90-100cm. schist gravel grey soil
100-130cm. large particle sand, water table, sm bits of shell schist gravel
25
South periphery, back
area 0-40cm. humus. No sample taken
40-95cm. mixed shell black soil, small to med particles
95-105cm. mixed shell fine shell particles, schist matrix
105-115cm. mud and schist
26
South periphery, front
area 0-50cm. humus. No sample taken
50-90cm. mixed shell black soil, fine to med shell particles
90-105cm. mixed shell black soil, fine to med shell particles
105-113cm. schist gravel
113-140cm. mixed shell black soil
140-150cm. schist gravel
150-162cm. mud and schist water table
27 Front area, house D 0-75cm. humus. No sample taken
75-105cm. mixed shell black soil, some schist
75-114cm. black organic soil, some very few shell particles shell
114-124cm. schist gravel
28 Front area, house C Humus
schist gravel
29 Front area, house B 0-42cm. humus
42-65cm. No samples taken, stopped due to subsurface obstruction. schist
gravel
30
Side midden, between
house A and B 0-48cm. humus
48-65cm. mixed shell black soil, small particles
65-100cm. black soil, small particles, hit rock at 100 cm mixed shell

362
Appendix B
Table B-1. NISP for the GbTo-77 mammal remains in excavated faunal sample arranged by site context and screen size. Back midden house A house D North Side Midden South side midden Total by taxon
Latin name Common
name 1/4 inch 1/8 inch 1/4 inch 1/8 inch 1/4 inch 1/8 inch 1/4 inch 1/8 inch 1/4 inch 1/8 inch 1/4 inch 1/8 inch
Odocoileus sp. Deer 1
1
16 2 18 2
Cervidae cf deer 11 1
1
8 1 20 2
Oreamnos
americanus Goats
2
1 1 1 2 4 3
Carnivora
Ursus sp. Bear 1
1
1
3 0
Enhydra lutris Sea otter
3
7 1 10 1
Tamiasciurus
hudsonicus Mink
1 0 1
Zalophus
californianus
Northern
sea lion
3
3 0
Callorhinus
ursinus
cynocephalus
Northern
fur seal
1
1 0
Phoca vitulina Harbour
seal 2
14 2 4
10 5 30 7
Felis concolor Cougar
1
1 0
Vulpis fulva
abietorum Red fox
2
2
4 0
Cetacea
Cetacea Whale
7 0 7
Rodentia
Marmota
monax
Red
squirrel
1
1 0
Castor
canadensis Beaver
4
2
6 0
Total identified mammals 15 1 1
24 2 10 1 51 19 101 23
Peromyscus
sp.
deer
mouse
5 0 5
Small
rodent 1
1
1
2
3 3 5
Unidentified sea mammal 1
5
7 4 4 5 17 9
Canis sp. cf dog 8
0 1 2 3 10 4
Canis lupus
familiaris dog
26 3
5
1
7
39 3
Unidentified
mammals
large mammal 4
2
10 1 16 1
med to large mammal 1 1
8
1 5
3 2 9 12

363
medium mammal
10 7 10 7
antler/sea mammal
5
5 0
other unid
mamals 46 31 4
62 36 14 10 190 85 316 162
total unid mammals 51 32 4 8 62 37 21 10 218 95 356 182
Total mammals 102 36 6 8 97 39 39 18 282 130 526 231
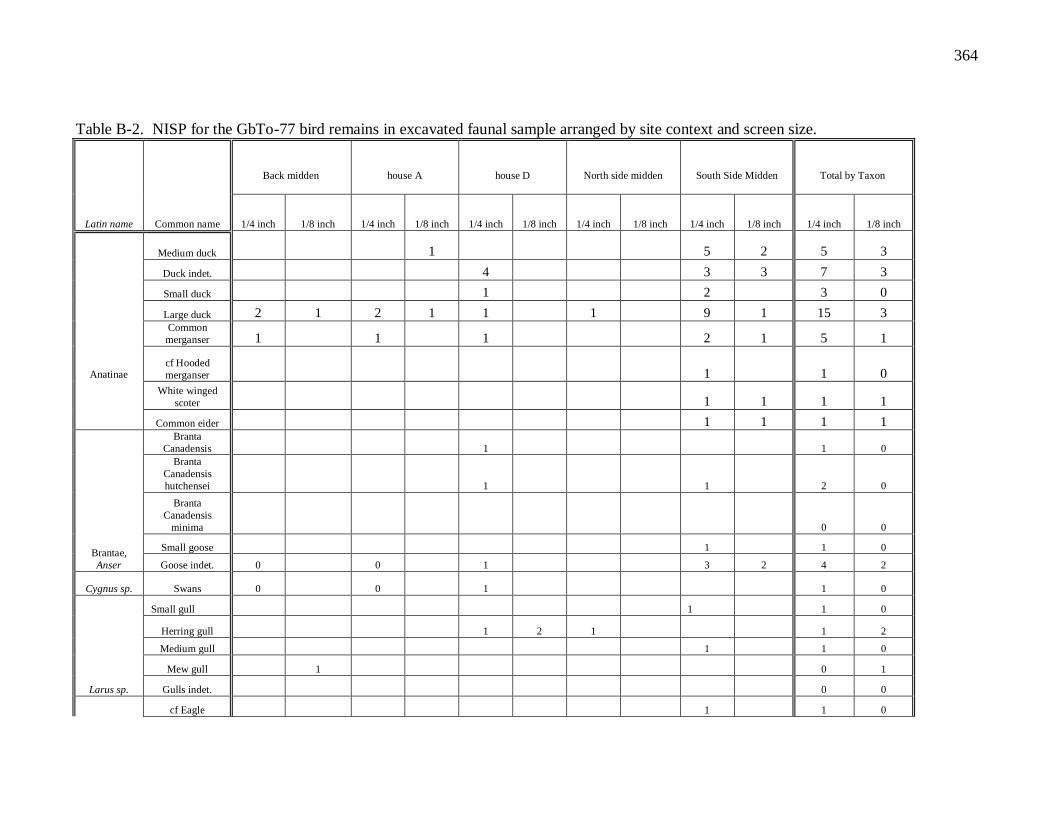
364
Table B-2. NISP for the GbTo-77 bird remains in excavated faunal sample arranged by site context and screen size.
Back midden
house A
house D
North side midden
South Side Midden
Total by Taxon
Latin name Common name 1/4 inch 1/8 inch 1/4 inch 1/8 inch 1/4 inch 1/8 inch 1/4 inch 1/8 inch 1/4 inch 1/8 inch 1/4 inch 1/8 inch
Anatinae
Medium duck 1 5 2 5 3
Duck indet. 4 3 3 7 3
Small duck 1 2 3 0
Large duck 2 1 2 1 1 1 9 1 15 3 Common
merganser 1 1 1 2 1 5 1
cf Hooded
merganser 1 1 0
White winged
scoter 1 1 1 1
Common eider 1 1 1 1
Brantae,
Anser
Branta
Canadensis 1 1 0
Branta
Canadensis
hutchensei 1 1 2 0
Branta
Canadensis
minima 0 0
Small goose 1 1 0
Goose indet. 0 0 1 3 2 4 2
Cygnus sp. Swans 0 0 1 1 0
Larus sp.
Small gull 1 1 0
Herring gull 1 2 1 1 2
Medium gull 1 1 0
Mew gull 1 0 1
Gulls indet. 0 0
cf Eagle 1 1 0

365
Accipitridae,
Falconidae Birds of Prey 0 0 0 1 1 0
Gaviidae Loons 0 1 0 2 2 1
Turdidae Song bird 0 0 0 2 2 0
Sphyrapicus
sp. Woodpecker 0 0 1 1 0
Total identified per assemblage
3 2 3 3 13 2 2 0 37 11 56 18
Large bird 2 1 2 1
Medium bird 1 1 1 1
Small bird 2 1 1 2 1 5 1
Unidentified Birds
2 2 2 1 9 1 24 8 37 12
Total birds per assemblage
7 4 5 4 23 3 3 0 66 22 104 33

366
Table B-3. NISP for the GbTo-77 fish remains in excavated faunal sample arranged by site context and screen size.
Latin name Common name
Back Midden house A house D North side midden South side midden
1/4 inch
screen
1/8 inch screen
1/4 inch
screen
1/8 inch screen
1/4 inch
screen
1/8 inch screen
1/4 inch
screen
1/8 inch screen
1/4 inch
screen
1/8 inch screen
Thaleichthys pacificus Eulachon 1 2 3
Osmeridae
Osmerid
indeterminate 3 1
Lepidopsetta bilineata Rock Sole 1
Platichthys sp. Starry type 1 1 1
Pleuronectiformes
Flatfish
indeterminate 3 16 1 1 2 2 37 10
Gadid sp.
Cods
indeterminate 1 0 1 1
Gadus macrocephalus Pacific Cod 1
Hexagrammidae
Greenlings
indeterminate 3 7 3 4 2 3 22 23
Hexagrammos
decgrammus kelp greenling 1 2 1 2 1 1
Clupea harengus pallasi Pacific herring 5 97 9 16 47 5 50 43 243
Ophiodon elongatus Lingcod 1 1 3 3 1
Xiphister sp.
Prickleback
indeterminate 2 2 2
Sebastes sp. Rockfish 4 3 4 8 5

367
Oncorhynchus sp.
Salmon 1349 1410 29 35 450 258 701 336 2769 1675
cf pink 3
cf coho 1 1 2
Hemilepidotus
hemilepidotus Irish lord 2 3 1 1 1 3 6 4
Cottidae
Sculpins
indeterminate 10 6 1 4 2 1 18 11
Myoxocephalus sp. 1
Hippoglossus stenolepis Pacific halibut 1
Theragra chalcogramma Walleye pollock 1
Hydrolagus colliei Ratfish 2 5 5 4 1 20 14
Squalus acanthias Dogfish 3 6 2 2 28 27
Total identified fish 1383 1561 30 48 484 317 722 402 2964 2023
Unidentified fish 304 2322 35 26 383 451 283 585 1707 2980
Salmon/trout/char 1 1 2 1
Large non-salmon fish 1 1
Total fish
1688 3884 65 74 867 768 1005 987 4674 5005

368
Table C-4. NISP for the GbTo-77 equal volume samples (column, bulk and auger samples) arranged by site context and screen size.
Back Midden house A house D South Side Midden Auger 11
6.3 mm 2.8 mm 1.4 mm 2.8 mm 1.4mm 1.4 mm 2.8 mm 6.3 mm 1.4 mm 2.8 mm 6.3 mm 1.4 mm 2.8 mm
Salmon 2 1 15 0 1 0 0 1 13 6 1 2 5
Herring 0 2 5 0 2 4 3 0 9 1 0 1 0
Smelt 0 1 3 0 0 13 2 0 18 2 0 0 0
Large non-salmon fish 0 0 0 0 0 0 2 1 0 0 0 0 0
Unidentified fish 33 24 2 2 10 54 40 1 71 21 3 4 4
Unidentified bird 1 0 0 1 0 0 0 0 0 0 0 0 0
Unidentified mammal 2 1 0 0 0 0 0 0 1 0 0 0 0

369
Appendix C: The Artifacts
Eighty-five artifacts were uncovered during the excavations at GbTo-77. A summary of these
artifacts is presented in table c-1 (following Ames 2005). Most artifacts were fashioned from
mammal bone, though slate, shell, bird and fish bone are also represented. Artifacts were
uncovered from all excavated contexts and recovery rates proved to be very different in each
context. As the vast majority of artifacts uncovered were formed from mammal bone, it is not
surprising that house depressions, which lack high concentrations of shell, produced so few
artifacts. I used Ames (2005a), Loy and Powell (1977) and Stewart (1977, 1996) to identify and
categorize the GbTo-77 artifacts.
Piercing tools consist of awls, points and chisels. Flakes are not common in this region,
but a number of small quartzite flakes were uncovered and may have been used for cutting
particularly with regards to fish processing (Ames 2005:171; Flenniken 1981). Adornment
artifacts consist of bone pendants and shell and stone beads. Most miscellaneous ground stone
and bone are likely part of larger points or awls. I discuss each category below.
Items of Adornment
This is a relatively diverse category of artifacts that includes slate and shell beads, a possible
amber bead, as well as grooved mammal teeth. There is also a possible shell pendant; the
drilled hole whoever, may also result from Moonsnail drilling. Slate beads are well made and
common in other sites throughout the harbour. The shell beads may be fashioned from
dentalium as they are very similar to the denatlium beads pictures in Ames (2005: Figure 8.10).

370
Table c-1 Summary table of artifacts recovered from GbTo-77 by class.
Adornment
Quartz
Flake
Slate
Point
Bone Points/Awls/
Barbs Adze/Chisels
Antler
Wedge
Misc. Ground
Stone
Misc. Worked
Bone Other Total
South Side
Midden 5 3 5 11 4 1 1 9 0 39
North Side
Midden 2 1 0 2 1 1 0 3 0 10
Back Midden 3 0 2 5 2 0 0 8 1 21
house A 0 1 0 0 0 0 0 1 0 2
house
D 2 2 2 2 0 0 1 2 2 13
Total 12 7 9 20 7 2 2 23 3 85
At other harbour sites, shell beads are generally quite restricted in terms of their context. In
Ames‟ (2005) harbour-wide analysis of materials excavated by the National Museum in the late
1960s and early 1970s, dentalium beads were only recovered in burial contexts at Boardwalk.
There is no evidence to suggest that we encountered a human burial in the back midden at
GbTo-77 and the beads were not found in the same stratigraphic context as the dog remains.
Moreover, dentalium beads were found in other contexts within this site. It is likely then that
these beads were lost while worn, either within the house and later deposited in the midden with
other household refuse, or during activities that took place on the back midden. A bead of an
unknown material (possibly amber) was found toward the front of the house on the surface of
the house floor (Figure C-1). I am aware of only a few other instances on the northern coast
where beads of a similar material have been found, namely in burial contexts at the nearby
Boardwalk site (Ames 2005; MacDonald and Cybulski 2001:11-12) and at village sites in Haida
Gwaii (Trevor Orchard, personal communication 2004). A photograph of an “amber” bead in
Ames (2005:217) is nearly identical to the GbTo-77 bead, as are the beads from Haida Gwaii.
According to the Canadian Museum of Civilization (CMC 2006), amber beads from the

371
Figure C-1. Stone bead of unknown material (possibly amber).
Boardwalk site may have come from an amber quarry north of Prince George, British Columbia.
I cannot be certain of the raw material used for this bead. Bead of this nature are, however, very
rare in the harbour, it is possible the source of this bead is quite a distance away in the plateau,
the same as those from Boardwalk. I also uncovered two slate beads from the south side midden
between houses D and E (Figure C-2). Both beads have squared, or flat, sides and are very
similar to those pictures in Ames (2005). A pendant made from a long, thin, curved piece of
mammal or bird bone, was found within the south side midden (Figure C-3). The distal end of
the pendant is broken. Ames (2005:119) notes that pendants, perhaps such as this one, may
have been made from broken bracelets.

372
Figure C-2. Slate Bead (Scale: 1 square= 1cm).
Figure C-3. Bone pendant (Scale: 1 square= 1cm).
Piercing tools
These include items made from slate and bone, though slate and bone points may have served
very different functions. Slate points are trapezoidal or triangular in cross section, many have
beveled edges. Other distinguishing characteristics include general shape of the midsection; this
is often hard to determine because many points are broken. According to Ames (2005:158),

373
complete points are relatively rare in harbour sites. Of those that I was able to determine an
overall shape, one point is side-notched and two are lanceolate in shape (e.g., Figure C-5, C-6).
Many of the broken points are incomplete in terms of grinding which suggests that they may
have broken during manufacture. According to Ames (2005:157), ground stone points such as
these were used as lance heads or daggers. The lanceolate points closely resemble the daggers
in Fladmark et al (1990:233).
Figure C-5. Side-notched slate point (Scale: 1 square= 1cm).
Figure C-6. Slate lanceolate-shaped point (Scale: 1 square=
1cm).

374
There are 18 bone points in this assemblage; while these would be useful as projectiles
in hunting and fishing, they could also be used as punches, in constructing other tools and
basketmaking and hide working. These points are variable in terms of shape. Most point tips
are squared (7), but some are also round(3), triangular (2), trapezoidal (2), flat (1) and ovate (1).
Only three points are complete. Square tipped points are rare in the harbour village sites and
have been found at Boardwalk, Lachane, Kitandach, Grassey Bay and K‟nu. They are made
mostly of terrestrial mammal bone; it is uncertain, but they are consistent with descriptions of
fishing lances and barbs, salmon harpoons or awls (Ames 2005; Loy and Powell 1977, Stewart
1977:97-98, 110, 1996), but also as punches (Ames 2005:153. A thin, likely stemmed, point
with a slight torque could have been hafted or a self-arming or channeling harpoon valve (Loy
and Powell 1977). Possible functions for other bone points include an awl and a barb or halibut
hook. There is also a possible composite toggling harpoon for salmon (Stewart 1977: 97-98;
110).
Round tip points are relatively rare in the harbour, but they do occur at Boardwalk,
Lachane, Kitandach , Baldwin and K‟nu- usually made from terrestrial mammal bone which is
very effective in absorbing shock. Artifacts 15, 16 and 17 (Figure C-7) form a large complete
point that may have served as a fixed point for salmon or halibut fishing (Ames 2005:151).
Round tip points may also have been used as blunt projectiles points or punches. They may also
be used as or reworked worn points. Triangular tip points may be awls; Stewart (1977:96,111)
and Ames (2005:124-125) show that awls are often made from metapodials. One possible
barbed point may reflect the sea otter hunting practices that are apparent in the faunal
assemblage (Stewart 1996:106).

375
Figure C-7. Round tipped bone point (Scale: 1 square=
1cm).
A small bipoint (Figure C-8) may have served as a fish gorge, a component of a
composite harpoon, or herring rake (Stewart 106; Ames 2005:132). According to Ames
(2005:132) bipoints occur irregularly throughout the harbour, suggesting a highly localized use.
They occur almost exclusively in sites around extensive shallow waters, such as Metlakatla Pass
and Dodge Cove. This is consistent also with the area surrounding GbTo-77. Ames (2005) has
argued that the high number of bipoints at the Boardwalk site in conjunction with the high
number of sea otter shows that inhabitants at this site exploited the kelp beds in front of the site
for a wide variety of fauna. GbTo-77 produced a relatively high number of sea otter remains, in
addition to herring, perhaps indicating a similar subsistence strategy was employed at this site.
At least one point, and perhaps a point tip, is comparable to Stewart‟s drawings fish hooks, used
in trolling for salmon or jigging for deep water fish such as halibut. Most of the miscellaneous
ground bone was likely awls.

376
Figure C-8. Bone bipoint (Scale: 1 square= 1cm).
In addition, two beaver incisors with bevelled edges were found within house d. The
use-wear that is visible on these incisors however, could have occurred while the animals were
alive, not their use as artifacts (Ames 2005:130-131). At the very least however, these incisors
may have been saved for intended use as chisels.
A ground ratfish spine may have been used as an incising tool. This piece was found
within berm midden slump toward the front of House D. Also a ground bird ulna- chisel or fine
woodworking tool or incising.
Chisels
Three California mussel chisels were uncovered at GbTo-77 (Figure C-9 and C-10); one from
the midden adjacent to house A and the other two from the south side midden between houses D
and E. All three exhibit evidence for grinding; two of the three have bevelled edges and one
(e.g., Figure C-9) exhibits notched that might indicate binding or hafting (Stewart 1996).

377
Figure C-9. California mussel chisel (Scale: 1
square= 1cm).
Figure C-10. Ground California mussel.
Antler Wedges
Ground or worked antler may be wedges, or a part of the woodworking kit. See also Stewart
(1977:86). These are often fragmentary, which these are. Basic to local carpentry kit (Ames
2005). A large piece of badly decayed, but worked antler may have served as an antler wedge
(Ames 2005:126-127; Stewart 1996:88-89).

378
Ground Stone Fragments
Two fragments of ground stone, probably slate, were found within House D. These are
probably parts of broken points or blanks for beads.
Chipped Stone
Three possible quartzite flakes were found in House D. Most are clear quartz (e.g., Figure C-
11), but one is made from a piece of unknown material, possibly banded agate (Figure C-12).
These are unusual because lithic assemblages after 4000 B.P. from the northern coast are
dominated by ground stone material (Matson and Coupland 1995:125). The harbour sites
produce very few chipped stone tools, which makes them similar to the west coast of Vancouver
Island and late period sites in Haida Gwaii (Fladmark et al 1990). Ames (2005:173) however,
discusses quartzite flakes found at a number of sites within the harbour. Flenniken (1981)
argued that quartzite microblades found at the Hoko River Shelter could be hafted and used to
fillet salmon. The quartz pieces from GbTo-77 are rough flakes, not fine blades, and will
require further study before I am able to confirm that they are artifacts, and not a natural
fractioning of beach quartz pebbles.

379
Figure C-11. Possible quartz flake.
Figure C-12. Possible flake (unknown
material).

380
Miscellaneous
Two large stone objects were found immediately adjacent to hearth. Although they could be
natural, their proximity to the hearth and fact that they look very different from other natural
stone materials found within the house floor, suggests they may have been put in the house floor
intentionally. It is difficult to determine whether they have been modified, but one could be a
boiling stone and the other possibly a tool used to strip bark. While striae are visible on the
latter, no grinding marks were observed.
The clay object is the most peculiar of the artifacts found and it is possible that it is not
an artifact at all (Figure C-13). One face of the object is rough, while the other is smooth and
may have an imprint of another object on it, perhaps wood, creating straight lines a row of small
punctures. I have not yet determined the function of this object, but the imprint suggests it may
have adhered to wood.
Figure C-13. Clay object.

381
Appendix D. Shellfish
Table D-1. Mass of all material and shellfish taxa within each column, bulk and auger samples taken from the Back Midden and Auger
11.
Back Midden Auger 11
Material
Taxa
Unit 1
Lot 4a
cs1
Unit 1
Lot4c
cs3
Unit 1
Lot 4e cs5
Unit 1
Lot 4g
cs7
Unit 1
Lot 4i cs9
Unit 22
Lot 3 cs 2
Unit 22
Lot 4 cs 4 auger 11-1 auger 11-3
Rock
168.275 97.99 94.195 66.81 131.055 61.7 357.72 302.51 586.91
Charcoal
4 1.32 1.42 0.63 8.055 7 0.34 0 0.01
Flora
0.24 0.735 0 0 0 0.06 0.04 9.49 3.34
Bone
0.35 0.15 0.71 0.415 0.3 0 0.11 0.09 0.08
Residue
137.61 93 61.98 90.18 276.84 48.67 154.34 208.61 18.66
Remainder (>1.40mm only 271.975 151.775 100.775 160.45 504.7 45 120.81 123.76 519.54
Shellfish
General Mussel 59.34 28.07 3.9 2.405 186.445 10.64 4.11 0.25 0.8
Cal. Mussel 0 0 0 0 0 0 0 0 0
Blue Mussel 7.7 0 0 0 0 0 0 0 0
Barnacle 203.515 328.565 521.42 451 4.74 331.96 90.84 28.87 36.72
Land Snail 0.04 0 0.08 0.025 0.065 0.01 0.01 0 0
Marine Snail 10.32 9.345 0.55 6.415 2.27 0.14 8.48 4.17 11.7
Chiton 0.83 0.025 0 3.45 1.21 0 0.58 0.02 0
Cockle 2.4 0.22 0 2.66 0 2.02 0.1 0.23 1.13
General Clam 14.785 104.55 95.875 62.055 15.32 16.36 38.39 18.6 22.26
Butter Clam 62.91 0 0 18 2.54 0 2.6 0 0
Littleneck 46.615 126.33 45.955 124.98 7.05 15.68 31.61 21.13 14.09
Sea Urchin 18.865 8.22 8.125 11.05 0.155 3.33 2.72 0.02 0.49
Limpet 0.615 0.13 1.1 0.09 0.21 0.01 0 0.01 0.08
Horse Clam 0 1.45 0 0 0 0 0 0 0
Unid 10.57 2.365 3.2 11.985 3.39 0.68 13.06 1.4 3.34
Total Mass 1020.955 954.24 834.735 848.725 638.885 429.5 346.84 719.16 1219.15

382
Table D-2. Mass of all material and shellfish taxa within each column, bulk and auger sample taken from the South Side Midden.
South Side Midden
Unit 5 Unit 5 Unit 5 Unit 5 Unit 5 Unit 5 Unit 5 Unit 6 Unit 17
Lot 5a Lot 5 cs 2 Lot 5 cs3 Lot 5 cs 4 Lot 5 cs5 Lot 5 cs7 Lot 5 cs 8 Lot 21 Lot 3 lv 1
Material Taxa
Rock
281.73 495.89 448.16 479.14 367.33 341.62 294.24 64.23 386.34
Charcoal 2.07 1.63 2.54 1.15 0.37 0.5 0.83 0.3 2.59
Flora 0.23 0.13 1.18 0.09 0.21 1.04 0.86 0.19 0.02
Bone 0.03 0.86 0.35 0.19 0.44 0.14 0.44 1.6 0.6
Residue 119.97 185 199.77 164.12 174.07 188.37 190.68 242.51 192.45
Remainder (>1.40mm only 57.84 234.66 110.95 94.84 82.05 83.79 81.39 71.29 119.06
Shellfish
General Mussel 8.03 3.08 0 0.66 2.12 1.43 2.25 13.81 0.47
Cal. Mussel 0 0 0 0 0 0 0 0 0
Blue Mussel 0 0 0.55 0 0 0 0 0 0
Barnacle 192.41 54.61 55.65 26.99 30.39 39.51 38.42 3.16 24.17
Land Snail 0.34 0.41 0.01 0 0.02 0.37 0 0 0
Marine Snail 6.14 6.84 5.41 2.99 8.15 4.15 4.94 3.91 19.16
Chiton 1.37 0.2
0.38 0.75 0.26 1.03 2.19 0.34
Cockle 1.94 1.75 0.79 0.7 2.1 0 0.17 13.17 1.01
General Clam 69.31 80.36 48.25 66.51 109.53 79.98 70.79 211.57 38
Butter Clam 137.24 2.15 30.06 0 3.81 0 0 24.12 7.36
Littleneck 35.59 52.44 31.44 35.09 62.05 36.1 24.97 21.04 30.55
Sea Urchin 4.68 0.11 0.43 0.3 1.85 1.37 0.3 17.05 0.43
Limpet 2.05 0 0 0 0 0 0 0.03 0
Horse Clam 7.92 0 0 0 0 0 0 1.63 0.3
Unid 19.86 13.23 20.25 24.55 7.46 15.6 17.67 18.28 16.3
Total Mass 948.75 1133.35 955.79 897.7 852.7 794.23 728.98 710.08 839.15

383
Table D-3. Mass of all material and shellfish taxa within the house d, North Side
Midden and house A column, bulk and auger samples.
house D North Side Midden house A
Unit 21 Unit 21 Lot 10 Auger 5-1 Auger 5-3 N16W21
Lot 3a Lot 3b S0W6 84-104 cm
154- 174
cm lot 8
Material Taxa
Rock
309.5 535.39 250.51 266.71 183.01 519.53
Charcoal 1.64 1.9 2.71
0.07 0.4
Flora 0.15 0.06 0.36 0.16 0.07
Bone 0.66 0.78 0.06 2.05 0.27 0.69
Residue 127.08 211.38 273.37 238.64 307.42 203.78
Remainder (>1.40mm only 58.44 149.31 163.33 152.82 131.38 158.2
Shellfish
General Mussel 3.84 6.67 30.05 0.41 11.07 1.32
Cal. Mussel 0 0 0 0 0.2 0
Blue Mussel 0 0 0 0 0 0
Barnacle 22.74 10.22 31.2 36.49 5.68 1.82
Land Snail 0 0 0 0 0 0
Marine Snail 27.99 13.38 10.43 1.49 4.62 1.95
Chiton 0.56 0 0 0.36 0.1 0
Cockle 7.22 0.3 0 3.24 0.36 0
General Clam 64.51 57.61 20.51 40.38 34.33 9.19
Butter Clam 57.83 7.66 0.78 0 0 0
Littleneck 12.89 7.01 7.71 16.71 2.25 5.29
Sea Urchin 0.26 0 0.06 0.16 0.02 0.07
Limpet 0 0.01 0 0 0 0
Horse Clam 13.64 0 0 0 0 0
Unid 18.05 12.87 9.14 8.15 10.02 4.41
Total Mass 727 1014.49 799.92 767.97 690.96 906.72