reconceptualizing the effects of lean on production costs
TRANSCRIPT

Reconceptualizing the Effects of Lean on Production Costs with
Evidence from the F-22 Program
Tyson R. Browning* Ralph D. Heath Neeley School of Business Texas Christian University
TCU Box 298530 Fort Worth, TX 76129
Lockheed Martin Aeronautics Company P.O. Box 748
Fort Worth, TX 76101
This version: March 24, 2008
Final version later published as: Browning, Tyson R. and Ralph D. Heath (2009) “Reconceptualizing the Effects of Lean on Production Costs with Evidence from the F-22 Program,”
Journal of Operations Management, 27(1): 23-44.
*Corresponding author The authors would like to thank Jack Coffman, Yung Le, Brian Tenney, Brian Drummond, Brian Marinelli, Don Handell, Jim Bailey, Mike Packer, Dave Trawinski, Nadia Sanders, Tom Shields, and Art Smalley for their provision of information, assistance, review, and comments in the preparation of this paper. Terry Leek, Jeff Peck, Jim Sprouse, Terry White, and other Lockheed Martin Aeronautics Company employees also provided valuable inputs and assistance. Two Associate Editors and three reviewers provided helpful comments that greatly improved the manuscript. The first author is grateful for support from the Neeley Summer Research Award Program at the Neeley School of Business at Texas Christian University.

Reconceptualizing the Effects of Lean on Production Costs with
Evidence from the F-22 Program Abstract
A central tenet in the theory of lean production is that the implementation of lean practices will reduce
waste and thereby decrease costs. However, not all lean implementations have produced such results.
Apparently, this effect is moderated by several factors, potentially even to the point of reversal. It is
important to increase our understanding of how this might occur. In this paper, we explore how novelty,
complexity, instability, and buffering affect the relationship between lean implementation and production
costs. An interest in these factors drew us to study the case of Lockheed Martin’s production system for the
F-22, an extremely complex and innovative product. To build theory, we synthesize our empirical data from
the case with other existing theory, such as theories of learning and complexity. Through this analysis, we
develop a revised framework that reconceptualizes the effect of lean on production costs and use it to
develop 11 propositions to direct further research. Included among these are propositions about how the
timing, scale, and extent of lean implementation can regulate the benefits of lean. Furthermore, when the
objective of lean is construed as the provision of value, we propose that this value is an emergent property of
a complex process, different from the mere sum of the values provided by its constituent tasks. Therefore, the
elimination of tasks will not guarantee cost reduction, and lean may provide even greater value by
incorporating some aspects of agile manufacturing. Overall, we develop a fuller range of the effects of lean
practices on production costs and illuminate how operations managers might control key variables to draw
greater benefits from lean implementation.
Keywords: Lean production, lean manufacturing, process improvement, agile, aircraft manufacturing,
learning curves, case/field study
1
1. Introduction
A central tenet in the theory of lean production is that the implementation of lean practices will reduce waste
and thereby decrease costs. However, not all lean implementations have led to such results. Apparently, this
effect is moderated by several factors, potentially even to the point of reversal. It is important to increase our
understanding of how this might occur.
We believe that a key limitation of most past studies is that they have failed to consider the impact of
environmental context or organizational contingencies, which can affect the relationship between lean practices
and production cost reduction. For example, White et al. (1999) and Shah and Ward (2003) found that plant size
had a significant effect on the implementation of lean practices. This shows that, regardless of establishing what
lean is, it remains important to establish how best to become lean in varied contexts. Good theory must address
both what and how (Handfield and Melnyk 1998), yet lean implementation has so far received much less
attention in the scholarly literature. According to Shah and Ward (2003), “There is not only a lack of empirical
attention given to contextual factors’ relationship with lean practices, but there is also a paucity of theory to
guide our expectations about the direction of possible effects.” Reports of lean implementations in several
industries led us to explore the effects of novelty, complexity, instability, and buffering on lean implementation.
In an age of increasing product functionality, diversification, customization, and change, novel and complex
products are becoming more common, and they account for a significant portion of the economic output of
developed countries (Wallace and Sackett 1996).
In this paper, we look deeper into the mechanisms by which lean affects production costs. An interest in
novelty and complexity drew us to conduct an in-depth case study of Lockheed Martin’s production system for
the F-22, the most sophisticated aircraft ever produced in a flow shop. To build theory, we synthesized the
empirical data with other existing theories of complexity and learning and to develop a revised framework that
reconceptualizes the effect of lean on production costs. This analysis led to 11 propositions which can be tested
in future research. In brief, we propose that the timing, scale, and extent of lean implementation matter, and we
discuss how. Also, when the objective of lean is conceptualized as the provision of value, we propose that this
value is an emergent property of a complex process, different from the mere sum of the values provided by its
constituent tasks. Therefore, the elimination of tasks will not guarantee cost reduction, and lean may provide
even greater value by incorporating some aspects of agile manufacturing.
The remainder of the paper is organized as follows. Section 2 establishes the conventional expectations of
lean production, as well as some of the problems, and presents our initial framework for investigation. §3

2
explains our research methodology and site selection, after which §4 summarizes the case study data. §5 builds
theory through a synthesis of the empirical data with extant theory. §6 concludes.
2. Background of Lean Production
2.1 Theory
While stemming from the roots of the mass production concepts developed in the U.S. by pioneers such as
Samuel Colt and Henry Ford (Chase et al. 2006, p. 471; Flanders 1925; Ford 1926; Womack et al. 1990), lean
production (hereafter, just “lean” for short) is broadly considered to have emerged from the innovations in the
Toyota Production System (TPS) in Japan since the 1940s (Fujimoto 1999), especially the just-in-time (JIT)
delivery of materials between work stations to minimize work-in-process (WIP) inventories. While several
historical reviews of lean are available (e.g., Hines et al. 2004; Holweg 2007; Hopp and Spearman 2004), a
commonly accepted specification of the “theory of lean” in the scholarly literature is not. Therefore, we review
the literature to isolate the theoretic tenets underpinning lean.
We begin by noting that the mere definition of lean varies widely. Various authors have equated or
differentiated the TPS, JIT, and lean. Sugimori et al. (1977) wrote the first paper in English about the TPS,
emphasizing JIT production and the use of good thinking by all employees to continuously improve
performance. Several books and papers on JIT and the TPS emerged in the 1980s (e.g., Hall 1983a; Hall 1983b;
Monden 1983; Ohno 1988; Schonberger 1982a; Schonberger 1982b; Schonberger 1982c; Shingo 1989).
According to Hopp and Spearman (2004), Ohno (1988) described the TPS as designed for continuous flow and
based on two main principles: autonomation (best practices and standard work) and JIT (kanban and level
production). Autonomation gives rise to practices pertaining to visual control, mistake-proofing, and
housekeeping (or “5S”—sort, straighten, sweep, standardize, and self-discipline), while JIT drives change-over
reduction. Sohal et al. (1989) and Waters-Fuller (1995) provided fuller reviews of the literature on JIT, and
Fullerton et al. (2003) found a significant relationship between the implementation of JIT practices and
improved financial performance at the firm level.
The term “lean production” was first used by Krafcik (1988) and popularized by Womack et al. (1990). To
some, lean is just a repackaging of JIT. For example, according to Hopp and Spearman (2004), Womack et al.
(1990) “freshened JIT by recasting it as ‘Lean Manufacturing.’” Gaither and Frazier (2002, p. 464) equated lean
with “the philosophies and approaches embodied in JIT.” Krafcik (1988) and McLachlin (1997) viewed lean
and JIT as closely related. Meanwhile, other authors such as Chase et al. (2006) equated lean instead with the
3
TPS and considered it a compilation of many practices, of which JIT is only one. Some have made an effort to
distinguish JIT and lean—e.g., “The major difference between JIT and lean production is that JIT is a
philosophy of continuing improvement with an internal focus, while lean production begins externally with a
focus on the customer” (Heizer and Render 2006, p. 641, emphasis in original).
Despite these differences, there is much stronger agreement that the salient characteristic of lean, JIT, and
the TPS is an emphasis on the reduction of waste (Brown and Mitchell 1991; Chase et al. 2006; Hines et al.
2004; Monden 1983; Ramarapu et al. 1995; Schonberger 1982a; Sugimori et al. 1977). “Most sources describe
the essence of lean production as waste reduction” (Hopp and Spearman 2004). Ohno’s “main focus was to
reduce cost by eliminating waste” (Holweg 2007). This emphasis on waste reduction drove practices such as
inventory reduction (e.g., Hall 1983a; Hall 1983b), process simplification (e.g., Hall 1983a; Schonberger 1986),
and the identification and elimination of non-value-adding tasks (e.g., Blackstone and Cox 2004), for which
Womack and Jones (2003, p. 20) classified tasks into three types:
1. Those that add value (by directly transforming the product into the form desired by its user),
2. Those that do not add value but are necessary with current production methods (“Type 1 muda”), and
3. Those that do not add value and are unnecessary (“Type 2 muda” or “obvious waste”).
Some authors have given prominence to other key practices in their definitions of lean, such as respect for
people (e.g., de Treville and Antonakis 2006; Sugimori et al. 1977), quality management (e.g., Brown and
Mitchell 1991; Monden 1983; Schonberger 1982a), pull production (e.g., Brown and Mitchell 1991), and
mistake-proofing (poka-yoke) (e.g., Stewart and Grout 2001). Many of these practices relate to each other and
the underlying philosophy of waste reduction. For example, the main benefit of kanban and pull systems is that
they place a cap on WIP inventory, and lower inventory levels reveal problems sooner (Hopp and Spearman
2004). Similarly, quality management helps establish control of the manufacturing process, which allows the
reduction of buffer inventories, which exposes quality issues sooner (Nakamura et al. 1998). Indeed, Hopp and
Spearman (2004) defined lean operations generally as producing goods or services with minimum buffering
costs. After examining the literature on lean, Narasimhan et al. (2006) noted that “the essential aspect of
leanness is the efficient use of resources through the minimization of waste” (emphasis in original) and defined
lean as production “accomplished with minimal waste due to unneeded operations, inefficient operations, or
excessive buffering in operations.” Indeed, ample scholarly sources have concluded that efficiency through
waste and buffer minimization is the hallmark of lean. Thus, in Figure 1 we distill the fundamental relationship

4
between lean and its expected results: the implementation of lean principles and practices will reduce waste and
buffering, and, since these add to production costs, implementing lean will therefore reduce production costs.
Figure 1: Theoretical relationship between lean and production costs
We now look at lean principles and practices more closely. Efforts to understand lean, JIT, and the TPS
have identified a number of important practices which are now variously considered to be part of lean. The left
column of Table 1 compiles a superset of lean practices from several sources (Chase et al. 2006; de Treville and
Antonakis 2006; Fullerton et al. 2003; Hopp and Spearman 2004; McLachlin 1997; Narasimhan et al. 2006;
Santos et al. 2006; Shah and Ward 2003). (We will discuss the right column of the table later, in § 4.1.) Each of
these practices may contain several sub-practices. We sought to include in this list only practices mentioned by
multiple authors, heeding the caution by Narasimhan et al. (2006): “In their fervor to enrich such paradigms,
writers often hasten to include any and all aspects of practice and performance that are currently popular (e.g.,
environmentally benign manufacturing), thus diluting their potentially unique attributes.”
The appropriate mix and extent of these practices would seem to vary by context, although the literature
gives relatively little guidance to operations managers in this respect. Nevertheless, Womack et al. (1990)
promoted a thesis of “transference”—that lean applied to non-Japanese and non-automotive contexts—based on
a premise that the challenges facing operations managers were “universal problems” (Hines et al. 2004). Hence,
Womack and Jones’ later work (1994; 2003) turned its focus to lean implementation, moving from “what” to
“how” (Holweg 2007). Through this work, Womack and Jones (2003) distilled five principles of lean: (1) Spec-
ify value in terms of the ultimate customer; (2) Identify all of the tasks required to get a product or service to
that customer—i.e., map the value stream—and eliminate the non-value-added tasks; (3) Create continuous,
single-piece flow wherever possible; (4) Only flow product when a customer pulls it; and (5) Seek perfection
through an environment of continuous improvement.
As it became better understood, lean grew from a focus on JIT and other specific practices performed in the
TPS into an overarching philosophy or paradigm of world-class operations. Recent emphasis has been put on
approaching lean using a scientific method (Spear and Bowen 1999) as part of a dynamic learning capability
(Holweg 2007). Hines et al. (2004) noted that many criticisms of lean fail to acknowledge its continuing
maturation. However, this maturation seems to have advanced more rapidly in philosophy than in actual theory,
Production costs
Waste and buffering
Implementation of Lean principles and
practices
_ +

5
and the mechanisms governing how and when to apply lean principles and practices require further elucidation.
Lean Practices Identified in the Literature The F-22 Program’s Lean Practices • Just-in-time (JIT) manufacturing and delivery; pull production;
kanban production control; small lot sizes • Waste, inventory, and variability reduction; elimination of non-
value-adding tasks • Production leveling and smoothing; uniform plant loading
(heijunka); pacing by takt time (the rate of customer demand) • Minimized setup/changeover times • New process equipment/technologies • Point-of-use materials • Standardized operating procedures; standard work • Visual control • Mistake-proofing (poka-yoke) • Specific equipment configurations (group technology, cellular
layouts, continuous flow); production process reengineering • Quality improvement and quality at the source; total quality
management (TQM) • Cross-functional work force • Design for manufacturing and assembly (DFMA) • Total preventive maintenance • Housekeeping; 5S (sort, straighten, sweep, standardize, and
self-discipline) • Continuous improvement (kaizen); root cause analysis (five
whys) • Respect for people; human resource training and involvement;
increased span of control; safety improvement programs • Supplier management (keiretsu); focused factory networks • Value stream mapping • Dynamic learning capability • Shared vision of perfection
• Single-piece flow; first-in-first-out materials; visual replenishment systems
• Cost reduction; elimination of non-value-adding tasks; reduced transport times; “no walking, searching, or waiting”
• Pacing by takt time; balanced distribution of work • Quick-change or no-change tools (e.g., drills and reamers) • New technologies and tools for fabrication and assembly • Point-of-use parts and tools; kitting • Standard work methods; “simple, visual, portable work
instructions” • Visual management control • “Single placement of parts” (i.e., self-locating parts); “simple,
clear visual indicators” • Flow shop layout; “single worker lifting/locating of tools” • Concurrent engineering; cross-functional teams • DFMA; part count reduction • 6S (sort, straighten, shine, standardize, safety, and sustain) • Kaizen events (discontinuous improvements); root cause
analysis • Ergonomic work stations; assembly accessibility; “minimum
hoses and lines on floor” • Dissemination of lean through supplier network; fewer
suppliers; longer-term supplier relationships • Work sequencing and content analysis
Table 1: Characterizing lean production in terms of its constituent practices
2.2 Practical Results, Further Questions, and an Initial Framework for Investigation
Many U.S. manufacturers in a variety of industries have applied lean principles and practices to achieve
impressive production cost reductions (e.g., Liker 1997; Womack and Jones 2003), especially in localized
settings, although many have also had trouble replicating the overall success of the TPS (Safayeni et al. 1991).
One key reason may be that many organizations have merely implemented isolated lean practices, something
short of its underlying philosophy (Holweg and Pil 2001; Shirouzu and Moffett 2004; Smalley 2005b; Spear and
Bowen 1999). That is, in implementing lean, perhaps some organizations allowed the means (the practices) to
become ends in themselves, losing sight of the true end, an overall efficient and effective production system. In
any case, our understanding of lean continues to evolve. A major source of knowledge continues to be studies of
successful applications, including the TPS (e.g., Liker 2003), although much of the available literature tends to

6
be biased towards successes (Safayeni et al. 1991).
However, many efforts to focus on waste and buffer reduction have drawn criticism. Lawson (2002)
mentioned numerous examples of problems caused by organizations that focused too heavily on efficiency—
from nuclear and naval accidents, to California’s recent energy woes, to the U.S. healthcare system. General
Motors’ reliance on JIT was seen to have contributed to the vulnerability of its entire North American operations
to a labor strike at a single parts plant in 1998—ultimately resulting in lost production of 576,000 vehicles and
an estimated $2.2 billion in lost sales (Blumenstein 1998; Blumenstein and White 1998). JIT was blamed for
production stoppages at Japan’s auto makers following a recent earthquake (Chozick 2007). Failures in some of
NASA’s Mars missions have been attributed to attempts at more efficient product development. Cusumano and
Nobeoka (1998) described how focusing too much on lean at a “local” level can compromise “global” (portfolio
level) lean. Therefore, the possibility of compromising effectiveness by going too far in the name of efficiency
is clear.
In response, proponents of lean have argued that a myopic focus on efficiency is misguided, and that lean
has matured into an overarching philosophy, paradigm, or vision of world-class competitive operations (e.g.,
Hines et al. 2004). Nevertheless, if waste reduction is to be at all affiliated with lean—let alone its hallmark—
then it remains essential to understand how best to pursue it, and not just in a philosophical sense. This prompts
questions such as the following. Is there such a thing as “too lean”? If so, then how lean is enough? What factors
affect the answer?
Thus, the theory of lean needs to be enriched to include (1) a fuller concept of how lean and waste reduction
affect the overall value of a production system and (2) how contextual variables might moderate these effects.
White et al. (1999) and Shah and Ward (2003) showed that context matters, although it is not surprising that
lean practices and their implementation would require some customization to circumstances: organizational
contingency theory long ago recognized the importance of contextual factors and the implausibility of a single
“best practice” approach being appropriate for all organizations (e.g., Donaldson 2001; Galbraith 1977;
Lawrence and Lorsch 1967). “The biggest challenges in adopting the lean approach … are to know which of its
tools or principles to use and how to apply them effectively. …[T]he approach must be tailored to the realities of
specific environments” (Corbett 2007). According to Handfield and Melnyk (1998), good theory must address
both what and how. Yet, Shah and Ward (2003) noted: “There is not only a lack of empirical attention given to
contextual factors’ relationship with lean practices, but there is also a paucity of theory to guide our expectations
7
about the direction of possible effects.” They submitted that a failure to consider context may help explain why
the evidence of the impact of improvement practices on performance has been mixed (e.g., Adam 1994; Powell
1995; Samson and Terziovski 1999). According to Hines et al. (2004), organizations with the ability to adjust
lean implementation to their context characterize the highest stage of maturity, which is why they called for
research that “will clearly require a contingent application.” Thus, exploring the moderating effects of
contextual variables represents a natural progression in building a theory of lean.
Our examination of issues with lean implementation in several firms and industries, as well as evidence
from the practitioner literature (e.g., Smalley 2005a), pointed to uncertainty and instability as key variables in
lean implementation. We initially identified five major factors driving uncertainty and instability in a production
process—two external and three internal—as shown in Figure 2: externally, (1) supply volatility (variation in
inputs) and (2) demand volatility (variation in outputs), and, internally, process (3) complexity, (4) novelty (or
unfamiliarity), and (5) buffers, which insulate from disturbances. While supply and demand volatility have long
been recognized as sources of production process instability (e.g., the impetus for keiretsu and heijunka,
respectively, in Table 1), and buffers have been recognized as a mitigation (Hopp and Spearman 2004), the
internal complexity and novelty of the tasks and interactions comprising the production process, while not new
to general operations management theory, have received less attention in the theory of lean. A complex entity
contains “a large number of parts that interact in non-simple ways” such that “given the properties of the parts
and the laws of their interactions, it is not a trivial matter to infer the properties of the whole” (Simon 1981).
Complexity increases uncertainty and instability by making it less clear how to perform tasks in such a way that
guarantees their outcomes and how the varied outputs of one task might affect other tasks. The novelty of
production tasks to the workforce also increases the uncertainties both within tasks (how to do them) and
between tasks (their implications for each other). Complexity and novelty essentially serve to commute input
and output uncertainty and instability down to the task level in a process.
Thus, while buffers serve a purpose in uncertain and unstable situations, lean seeks to reduce them, and in
doing so could conceivably go too far. At a micro level, a need for balance is not entirely new to lean practices.
For example, kanban systems seek an appropriate buffer size based on demand uncertainty, lead time, and
container size. At the macro level of an entire production process, we suspected that other variables might also
be important in the determination of an appropriate amount of buffering. Therefore, we sought to improve
understanding of the factors involved in these relationships, which might affect the ability of lean (through

8
waste and buffer reduction) to reduce production costs. The purpose of the initial framework in Figure 2 was not
to be comprehensive or proven, but rather to provide a “focusing proposition” (Stuart et al. 2002; Yin 2003) as
we began our field work.
Figure 2: Initial framework relating production process uncertainty and instability and lean theory
3. Research Methodology
To explore these questions and build theory, we used an in-depth case study (Stuart et al. 2002), which is
advantageous for observing and describing a complicated research phenomenon in a way that increases
understanding (Eisenhardt and Graebner 2007; Handfield and Melnyk 1998; McCutcheon and Meredith 1993;
Meredith 1998). It is especially appropriate when the case serves a revelatory purpose and provides a basis for
and prelude to further empirical research (Yin 2003). In operations management research, the case study
methodology has been described as “essential … where theory exists but the environmental context is different”
(Stuart et al. 2002, p. 423). The case study approach allowed us to exercise “controlled opportunism”
(Eisenhardt 1989, p. 539), the ability to respond flexibly to discoveries made while collecting data. Thus, like
Adler and Clark (1991), our approach traded some generalizability for the richness of interviews across many
levels of an organization, the opportunity to observe the production system in action, and the possibility of
exploring patterns in the data through discussions with the managers responsible for these operations.
Through experiences with the aerospace industry, we knew that its results with lean implementation had
been mixed. Via theoretical sampling (Yin 2003), we approached the F-22 program as an “extreme case” where
the phenomena of theoretical interest are more transparent (Eisenhardt 1989). For example, while the F-22
program epitomizes novelty and complexity (as we will describe in § 4.1), it did not face the demand volatility
encountered by many operations: its production rate was predictable and stable. Hence, the F-22 production
system naturally emphasized variables of particular interest while controlling for some others.
We collected, validated, and analyzed the empirical data through a rigorous, two-stage, iterative process.
The first of these stages focused on constructing the issue’s history as depicted in the circumstances, actors,
Production process uncertainty and
instability
Novelty+
Complexity+Demand volatility
+
_
Production costs
Waste and buffering
Implementation of Lean principles and
practices
_M
Supply volatility
+
9
events, decisions, and outcomes. From November 2004 to June 2005, the first author interviewed 18 individuals
at two company sites (Marietta and Fort Worth), reviewed a variety of internal company documents, and
collected further data from secondary informants at the company (both internal and external to the F-22
program). The 18 primary informants were selected because of their roles as key actors in the pertinent events
and their diversity of functional backgrounds and levels of responsibility (Eisenhardt and Graebner 2007). They
included engineers and managers in the areas of manufacturing tooling, quality, and planning; lean and
affordability; and production process modification. They included three vice-presidents (a current and former
V.P. of Manufacturing and the current F-22 Program Manager) and the company president (who had formerly
managed the F-22 Program from November 2002 to January 2005). Data collection began in November 2004
with 10 initial, loosely-structured interviews. (While it is important to conduct a case study with a research focus
(which we described in Figure 2), it is also important to remain open to modifications (Stuart et al. 2002; Yin
2003).) The interviews began with an opportunity to express observations and perspectives on the lean
implementation. To encourage openness and candidness, we agreed not to attribute data or quotations to
individuals unless specifically approved. Most of the informants supplemented their responses with company
records. As these initial interviewees represented different areas of the organization, they did not see the events
and decisions the same way and therefore provided alternative explanations. Next, the first author toured the F-
22’s assembly line, followed up with the initial informants, and conducted interviews with eight additional
informants—all to gather further data, clarify explanations, and reconcile retrospective inputs with formal
documentation (reports, plans, briefings, archival data, etc.). This discovery process sought to unearth additional
evidence where needed to triangulate the data and analysis through multiple sources (Fielding and Fielding 1986;
Jick 1979). It included evidences from several perspectives and noted alternative explanations for observed
patterns to maximize the study’s internal validity (Stuart et al. 2002; Yin 2003). Efforts were made to eliminate
unsubstantiated statements, including presumptions of causality, by cross-checking facts and sources. The eight
additional interviews were deemed to provide “theoretical saturation,” the point of data recurrence (Glaser and
Strauss 1967). By the end of this initial stage, the first author had organized the data and initial analysis into a
report describing and explaining the history of lean implementation on the F-22 program.
The second stage, from July 2005 to March 2006, served to further validate the case study data and analyses.
The initial, historical report was subjected to several iterations of intensive review and scrutiny by over 30
individuals at Lockheed Martin from many levels of the organization, including the president, vice presidents,
10
program managers, directors, senior managers, project managers, team leaders, manufacturing engineers,
industrial engineers, quality engineers, mechanical engineers, and lean and six sigma experts. During these
reviews, the first author improved the report until convergence was achieved on its descriptions and
explanations. Next, a number of individuals in the U.S. Air Force (USAF) reviewed the revised report and
provided their comments (which invoked few changes by that point). Throughout these reviews, we were
impressed by the willingness of these groups to admit the challenges the F-22 program had faced and allow the
public release of the data. Finally, several external experts in lean and the TPS kindly provided comments on the
report. The diminishing number of comments and corrections received through the successive iterations of this
process gave us reason to accept the data and initial analyses as sufficiently reliable and valid.
To build theory, we synthesized the empirical data with other existing theories, an approach advocated for
inspiring and guiding the development of grounded theory (Eisenhardt and Graebner 2007; Miles and Huberman
1984; Mintzberg 1979). In this regard, even a single case study can be useful for theory building (Flynn et al.
1990; March et al. 1991). We sought first to identify the key issues, variables, relationships, and/or patterns in
the data, paying special attention to patterns that ran counter to the established theory. We repeatedly compared
the data and the theory to develop conceptual groupings, both to organize the data (in § 4) and the emerging
theory (in § 5). Gaps between the data and existing theory led us to propose key variables and new relationships
and to explain how and why these matter (Handfield and Melnyk 1998). Since human creativity and intuition,
not just data, are essential for developing theory (Mintzberg 1979), we constantly compared the emerging theory
with the data and progressively reconsidered it. In so doing, we had to adjust our framework, both to eliminate
some of the initial propositions (because of less sufficient evidence or theoretical connection) and to strengthen
the remaining propositions. In the end, the match between our proposed theoretical elements and the case
evidence is substantial but imperfect. However, even in quantitative research one does not expect a set of
independent variables to explain 100% of the variation in a set of dependent variables (Mintzberg 1979), so, like
Sutton and Callahan (1987), we sought a good rather than a perfect fit between theory and data.
4. Case Study: Lean Implementation in the F-22 Program
4.1 Background
Modern military aircraft are some of the most complex and innovative products ever developed, combining
cutting edge technologies for aerodynamics, structures, materials, avionics, and stealth with extensive
computerization and millions of lines of software code. Not only do the latest military aircraft contain a huge

11
number of highly specialized components, all of their functions must be tightly integrated within the highly
constrained space and weight of an efficient, stealthy, and aerodynamic airframe. Since new military aircraft
programs may come around only once a decade or less at a given company, the technologies for the product and
its design and production processes will have changed significantly since the last program, implying a novel
situation. The growth in capability and complexity of modern military aircraft has increased their price tag
tremendously, making the production of large quantities cost-prohibitive. Production systems are extremely
capital-intensive, and planned production volumes are often relatively low, in the tens or hundreds. At these low
volumes, the threshold for justifying capital investments to change the production system is difficult to achieve,
because it is unclear if they will have time to demonstrate a return. Thus, in many military aircraft production
systems, subassemblies are still moved from one station to another by large cranes above the factory floor. In
some cases, especially with older lines or in factories where more than one type of aircraft is produced, these
stations are not adjacent. Hence, military aircraft production had been heavily criticized for its recalcitrant “craft”
production methods, extremely capital-intensive WIP inventories, enormous transportation and waiting times
between manufacturing steps, and overall lack of efficient flow.
In the early 1990s, the industry seemed rife with opportunity to implement lean. Some researchers and
practitioners wondered about its applicability to the military aircraft industry, where growing costs had raised
alarms. Prompted by the book by Womack et al. (1990), in 1993 the USAF and the Massachusetts Institute of
Technology launched the Lean Aircraft Initiative, a consortium of industry, government, labor, and academic
participants, to study possibilities for applying lean to military aircraft production (Kandebo 1997; Murman et al.
2002; Shields et al. 1997). The consortium members participated in various pilot applications of lean (Lang and
Hugge 1995; Weiss et al. 1996). Yet, by the end of the decade, it was unclear if lean had made a significant
impact on the overall costs of military aircraft (Cook and Graser 2001).
The F-22 is one of several major aircraft programs for which Lockheed Martin is the primary contractor
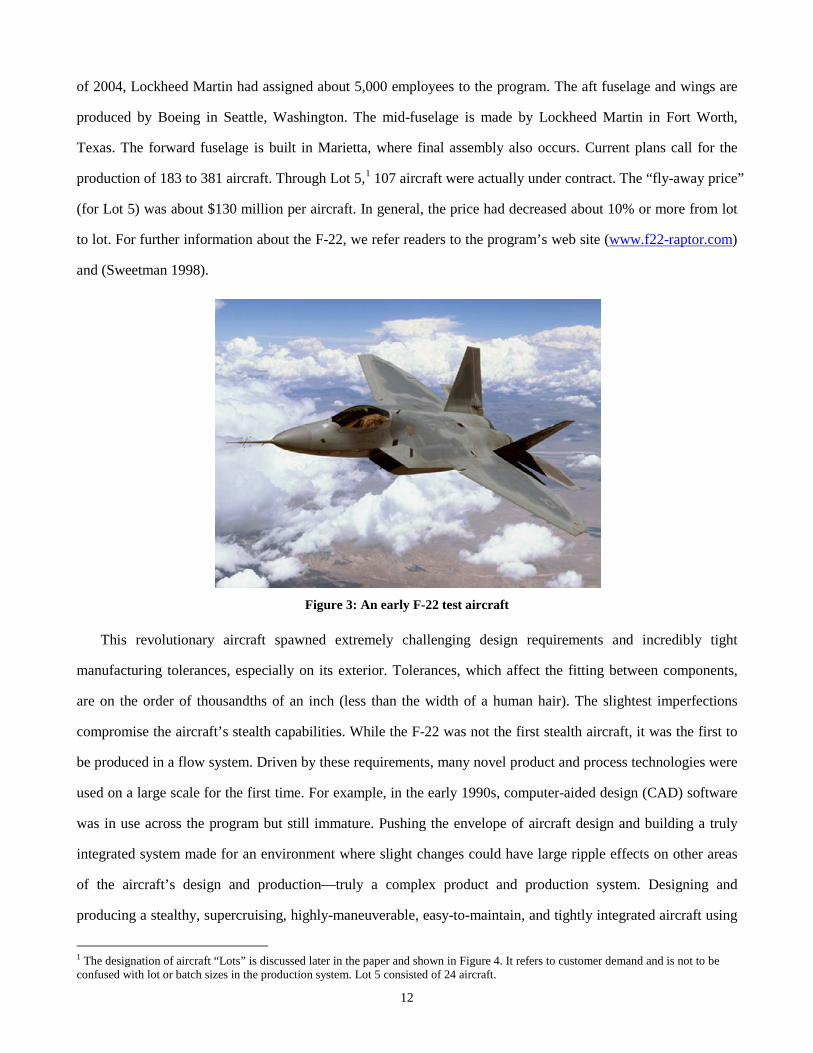
(others include the F-16, F-35, F-117, and C-130). As the world’s only fifth-generation fighter aircraft, the F-22
Raptor (Figure 3) is unprecedented in its integration of stealth and advanced avionics and provides a
revolutionary leap in capability for multiple missions. Much information about the aircraft has been classified
for national security reasons, and information about the program is difficult to release publicly.
The F-22 is assembled in Marietta, Georgia from parts built across the U.S. The program has three team
members—Lockheed Martin, Boeing, and Pratt & Whitney—as well as around 1100 suppliers in 42 states. As
12
of 2004, Lockheed Martin had assigned about 5,000 employees to the program. The aft fuselage and wings are
produced by Boeing in Seattle, Washington. The mid-fuselage is made by Lockheed Martin in Fort Worth,
Texas. The forward fuselage is built in Marietta, where final assembly also occurs. Current plans call for the
production of 183 to 381 aircraft. Through Lot 5,1 107 aircraft were actually under contract. The “fly-away price”
(for Lot 5) was about $130 million per aircraft. In general, the price had decreased about 10% or more from lot
to lot. For further information about the F-22, we refer readers to the program’s web site (www.f22-raptor.com)
and (Sweetman 1998).
Figure 3: An early F-22 test aircraft
This revolutionary aircraft spawned extremely challenging design requirements and incredibly tight
manufacturing tolerances, especially on its exterior. Tolerances, which affect the fitting between components,
are on the order of thousandths of an inch (less than the width of a human hair). The slightest imperfections
compromise the aircraft’s stealth capabilities. While the F-22 was not the first stealth aircraft, it was the first to
be produced in a flow system. Driven by these requirements, many novel product and process technologies were
used on a large scale for the first time. For example, in the early 1990s, computer-aided design (CAD) software
was in use across the program but still immature. Pushing the envelope of aircraft design and building a truly
integrated system made for an environment where slight changes could have large ripple effects on other areas
of the aircraft’s design and production—truly a complex product and production system. Designing and
producing a stealthy, supercruising, highly-maneuverable, easy-to-maintain, and tightly integrated aircraft using
1 The designation of aircraft “Lots” is discussed later in the paper and shown in Figure 4. It refers to customer demand and is not to be confused with lot or batch sizes in the production system. Lot 5 consisted of 24 aircraft.
13
novel technologies spawned many challenges, especially when it came to containing the costs.
As a company, Lockheed Martin participated in the Lean Aerospace Initiative and strove to implement lean
practices in a number of areas. At the Marietta site, lean applications had been underway since the early 1990s
in several aircraft programs, including the F-22 (Kandebo 1999b). Localized successes with implementation,
coupled with a keen interest in lean by the USAF customer, increased the company’s momentum for lean. The
Fort Worth site applied for and won the Shingo Prize in 1999. By 2000, a corporate-wide effort to train lean
experts was underway. As the F-22 program came under cost reduction pressures in the mid- and late-1990s, the
USAF and its contractors increasingly saw lean approaches as the answer. The program sought to depart
significantly from traditional aircraft production methods and become the “leanest in the aerospace field”
(Kandebo 1999a). Overall, these proposals and changes conceived of lean in terms of the practices listed in the
right column of Table 1, where the practices are ordered to facilitate comparison with the left column.
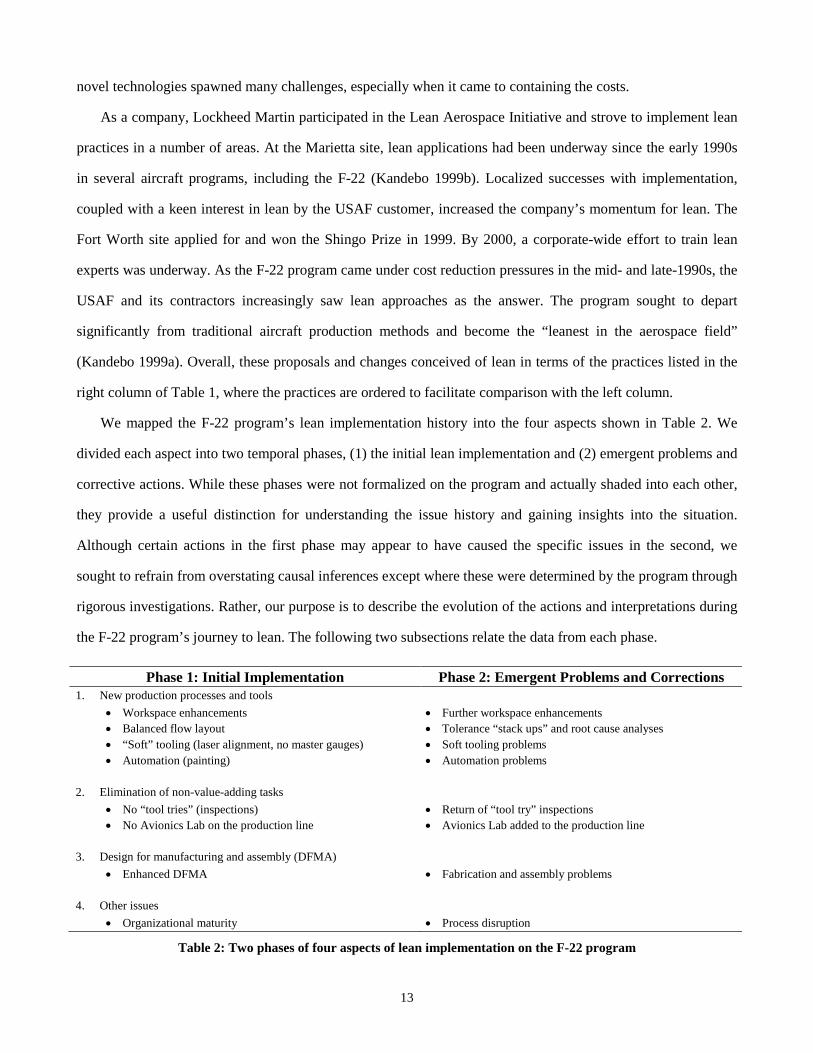
We mapped the F-22 program’s lean implementation history into the four aspects shown in Table 2. We
divided each aspect into two temporal phases, (1) the initial lean implementation and (2) emergent problems and
corrective actions. While these phases were not formalized on the program and actually shaded into each other,
they provide a useful distinction for understanding the issue history and gaining insights into the situation.
Although certain actions in the first phase may appear to have caused the specific issues in the second, we
sought to refrain from overstating causal inferences except where these were determined by the program through
rigorous investigations. Rather, our purpose is to describe the evolution of the actions and interpretations during
the F-22 program’s journey to lean. The following two subsections relate the data from each phase.
Phase 1: Initial Implementation Phase 2: Emergent Problems and Corrections 1. New production processes and tools
• Workspace enhancements • Balanced flow layout • “Soft” tooling (laser alignment, no master gauges) • Automation (painting)
• Further workspace enhancements • Tolerance “stack ups” and root cause analyses • Soft tooling problems • Automation problems
2. Elimination of non-value-adding tasks • No “tool tries” (inspections) • No Avionics Lab on the production line
• Return of “tool try” inspections • Avionics Lab added to the production line
3. Design for manufacturing and assembly (DFMA) • Enhanced DFMA
• Fabrication and assembly problems
4. Other issues • Organizational maturity • Process disruption
Table 2: Two phases of four aspects of lean implementation on the F-22 program

14
4.2 Phase 1: Initial Lean Implementation
4.2.1 Use of New Processes and Tools
Many of the F-22 program’s early efforts to implement lean channeled through “kaizen events.” Each event
was typically a one-week meeting of a cross-functional group, led by a process improvement expert (in this case,
a member of the F-22 “Lean Team”). While each event necessitated some pre- and post-work, the group was
charged to come up with significant improvement within a week. (In contrast, in much of the literature on lean,
kaizen refers to continuous improvement rather than a singular event, which is called kaikaku.) For example, a
kaizen event in October 1998 focused on an assembly area where video recordings of workers (obtained with
their consent) showed that they were walking more than 7,000 feet per day to accomplish their tasks and that
some tasks were difficult to perform because of restricted workspaces. Parts often sustained minor damage as
workers struggled to carry them up narrow stairs to an upper platform where workers accessed the top of the
aircraft. The kaizen event led to moving workbenches, tools, and computer terminals that display work instruc-
tions and drawings to the upper platform, thereby cutting average daily walking distances at the station to 100
feet. The station’s lighting was improved, work areas were expanded, and the platform’s steps were widened
and straightened. Scrap and rework subsequently decreased while the production rate doubled (Kandebo 1999a).
These and other similar, early changes reduced production costs and increased momentum for the lean efforts.
Thus inspired to implement lean on a larger scale, the F-22 program sought to establish a balanced flow
process, particularly on the forward fuselage assembly line (FFAL). Striving for the ideal lot size of one (single-
piece flow) had implications for equipment layout (Nakamura et al. 1998). In mid-2000, the program imple-
mented four multi-month improvement projects (Table 3) on the largest section of the FFAL. Moreover, a June
2000 kaizen event sought to radically change the entire FFAL to a balanced flow layout. The event entailed
deciding between two options: retaining the conventional tool design currently used for producing the test air-
craft, or implementing a radical flow layout. The conventional layout, sometimes called “monument tooling,”
retained the disadvantages of traditional aircraft manufacturing approaches. It implied large, massive, “hard”
tools each designed to support hundreds to thousands of labor hours (weeks) of assembly tasks at a single work
station. Yet, it had proven to be effective for locating multiple product features at once—i.e., for holding a par-
tially assembled aircraft in perfect position so that many parts could be added within tight tolerances. However,
conventional tools impeded worker accessibility to the product, and their many details required extensive inven-
tory controls. In contrast, the flow layout would spread the work across a series of relatively simple tools,

15
improving flow and worker ergonomics and accessibility (Helander 1995). It provided the opportunity to move
tasks to any workstation to redistribute the workload on a temporary or permanent basis. Work could be
allocated to an appropriate number of stations in accordance with the takt time of the desired production rate.
For example, the maximum expected demand rate (at the time) of 36 aircraft per year (~250 work days) implied
a takt time of about seven days per aircraft. Ideally, the line would balance work so that each station entailed
about seven days of assembly tasks. Setting a takt time equal to demand would establish “strategic pull” and
limit the WIP inventory in the system (Hopp and Spearman 2004). The participants in this kaizen event focused
investigation on a qualitative analysis of the seven criteria compared in Table 4 and elected to implement the
flow layout. Subsequent, higher-level reviews with program and functional management and the customer
affirmed this decision. The customer especially favored the flow system and its emphasis on lean concepts and
agreed to transfer several million dollars of downstream, variable cost funding upstream for its implementation.
Project Objective(s) Work Content Analysis Verify the work content, standard labor hours, and critical path; provide data to
support the other projects; provide the basis for the other projects’ return on investment calculations
Assembly Task Sequence Implement single-piece flow in the FFAL; reduce cycle time by 40%, mainly by eliminating out-of-station waiting and transportation time
Point-of-Use (POU) Enhancement
Provide parts, tools, kits, and utilities to the immediate area of each work station, effectively eliminating the need to walk to the tool cribs and wait in lines; install custom tables and racks, overhead utility stanchions, a material lift, and improved lighting throughout; reduce standard labor hours by 4%
Parts Availability Improve the visibility and forecasting of parts availability; develop lean processes for parts and material presentation and replenishment
Table 3: Lean projects for part of the FFAL
Criteria Conventional Layout Flow Layout
Accessibility Limited; certain tools impede worker access Increased Technical Challenge Limited interchangeability of tool details Increased interchangeability of tool details Learning Advantages Workers would perform a much wider variety of
tasks less frequently Workers would repeat a smaller number of tasks more frequently
Ability to handle work stoppages
Assembly would be stuck in the tool and block other work
Assembly could be removed from the line, increasing work-around options
Material movement Disruptive to work force Moving line provides flexibility; conveys sense of progress and signals urgency to workforce
Work stations required Ability to meet production rate requirements with current tooling would present a moderate risk
In tandem with lean practices, lowers risk (e.g., accelerated learning, increased work piece accessibility, etc.)
Cost May result in increased tool investment over contract life; limited profit improvement because tool is not readily adaptable to process improvements
Likely to reduce total recurring production costs; should require one-third of the point-of-use storage and work-in-process inventory
Table 4: Criteria used to compare the conventional and flow layout options for the FFAL

16
The conversion of the FFAL to a flow layout began in February 2001 and took 11 months. The
implementation team was heavily influenced by the Lean Team to incorporate lean practices, with particular
emphasis on increased accessibility and lighting and reduced movement for people and materials. For example,
air and vacuum access was provided at the point of use via retractable hoses from overhead, so that long cords
and hoses no longer had to be stretched and left running across the work areas. Improved stationary lighting
reduced the need for portable lights and enhanced worker safety. Raised access stands put the workers in more
ergonomically-correct positions. Most significantly, an innovative rail system enabled the assembly to flow
easily from one station to the next. When work finished at a station, rail connectors could be manually lowered
and locked, enabling the aircraft structure to glide to the next station. Besides enabling the line to flow without
time-consuming crane movements, the rail system made the aircraft structure highly accessible to workers from
all sides at each station. The FFAL’s flow layout was first used partially on the 19th Raptor and fully on the 20th.
The program also implemented flow layouts for other areas of assembly.
The F-22’s tight manufacturing tolerances, coupled with pressures to cut costs with lean practices and new
technologies, also led the program to switch from large, expensive, so-called “hard” tooling in the production
process to so-called “soft tooling,” such as new computer-aided design (CAD) tools (which could specify parts
more exactly) and new laser-based measurement systems (to situate and align parts). To eliminate waste, the
program issued a policy not to use expensive “master gauges” (hard tools that initialize and verify other tools)
and rely on the new soft tooling instead. (Various research and pilot studies from the USAF’s Manufacturing
Technology Center had proved that master gauges could be obviated in similar contexts. The customer wanted
to cut costs on the F-22 and show the benefits of implementing the findings from its funded research.) Also, to
improve efficiency and worker safety, new, automated tools were brought in to handle coating (painting) the
aircraft. Layers of specialized coatings were a critical aspect of the Raptor’s stealth capabilities. In particular,
coating the interior of the engine air inlets was difficult for workers, as accessibility was limited and prolonged
exposures to the chemicals could be unhealthy. Hence, robotic tools were set up to automate both the interior
and exterior coating operations.
4.2.2 Elimination of Non-Value-Adding Tasks
The program made several additional efforts to eliminate non-value-adding tasks. For one, the program
issued a policy not to do “tool tries”—tests that had traditionally been done simply to verify a tool’s ability to
produce a particular part or assembly. Since it should be possible to “self verify” parts instead, inspection and

17
testing tasks were deemed non-value-added. (In keeping with the definition of three types of tasks in §2.1, tasks
which did not directly transform the product into the form desired by the customer were seen as non-value-
adding and candidates for elimination.) In another example, the program declined to build an avionics lab near
the end of the production line, as had been done on previous programs. Since the lab’s primary purpose was to
test the avionics equipment before it went on each aircraft, it was seen as wasteful: testing would be done at the
point of production instead of at the point of installation.
4.2.3 Design for Manufacturing and Assembly (DFMA)
The F-22 program incorporated DFMA practices (e.g., Boothroyd et al. 1994; Wallace and Sackett 1996;
Whitney 2004) such as “self-locating” features in parts that would facilitate quick and error-free assembly. CAD
systems and advanced machining techniques enabled designers in many cases to reduce product weight and
eliminate assembly steps by using a single, complex part to replace what would otherwise be a subassembly of
hundreds of parts and fasteners. For example, a proposed assembly of over 100 parts was redesigned into a
single, machined part.
4.2.4 Organizational Maturity in Regard to Lean Implementation
On the 1-4 scale of lean maturity defined by Hines et al. (2004), where four is highest, the evidence places
the F-22 program at Stage 3, a “thinking organization.” Organizations at this stage have moved beyond shop
floor applications, but they often fail to adjust lean practices for contextual differences, exhibit piecemeal
implementation (many ongoing initiatives, often with conflicting priorities), and do not well integrate lean
production with product development. While the F-22 program realized their distinctiveness from other lean
implementations in many ways, and that they should account for it at some level, they nevertheless focused on
the waste reduction aspects of lean and local applications of lean tools. While there was a high degree of
questioning and challenging of existing practices, this usually focused on a single process (such as the FFAL)
rather than the entire program. However, it should be noted that some of these “single processes” are larger and
more complex than many entire production systems for simpler products. In essence, a Stage 3 organization has
already made major strides in the journey to lean and is not completely naïve about implementation.
4.3 Phase 2: Emergent Problems and Corrections
Implementing an innovative, lean production system for a revolutionary aircraft was challenging, even for
experienced operations managers. Problems were bound to emerge. In hindsight, many seem obvious. However,
they emerged in an environment characterized by complexity and novelty, with many experienced individuals

18
and groups making locally rational decisions about lean implementation.
4.3.1 Problems with the New Processes and Tools
The investments in lean-inspired processes and tools proved difficult to restrict. As workers saw the
improvements to their workspaces, they came up with ideas for further changes. Changes seemed to “come out
of the woodwork.” Workers essentially said, “While we’re implementing the flow layout, wouldn’t it be great if
we….” Out of a “respect for people” mindset, many of the newly proposed changes were implemented. The
FFAL received still more electrical, compressed air, and vacuum outlets: 13 vacuum ports per station, an
electrical outlet every six feet, and approximately 2000 compressed air outlets for use by the 350 or so
employees. More lighting was added below the upper work deck, and large stadium lights were added above it.
Additional raised access stands were added. The look and feel of the factory and “6S” (sort, straighten, shine,
standardize, safety, and sustain) were emphasized. Many of these elaborations stemmed from stated rules, such
as “lighting must be greater than x lumens at all points” and “there must be an outlet every six feet,” which were
enforced regardless of the actual tasks to be done in an area. However, the costs of all of these additional
changes had not been planned. While the original changes had been analyzed in terms of their expected return in
reduced labor hours, cost-benefit analyses were not done on all of the further changes. Momentum seemingly
carried them through, causing lean “scope creep.” Before long, the lean implementation was well over budget.
Some other issues with the new processes and tools were less obvious. In the case of the new flow layout of
the FFAL, the F-22’s incredibly tight tolerance requirements and an inability to precisely align each assembly
combined to wreck havoc. Structurally, aircraft are usually built from the bottom-up or the inside-out. For
instance, internal spars are assembled before the external skins are attached. As many parts go together, slight
deviations from their planned sizes will accumulate or “stack up,” especially when workers add shims along the
way to make the parts fit. Before long, the whole assembly can be several hundredths or even tenths of an inch
off in certain dimensions. While this is not a big deal on other types of aircraft, achieving the F-22’s
aerodynamic and stealth capabilities made it imperative that its exterior remain very smooth. Unfortunately,
building from the inside-out, many of the tolerance accumulations would manifest themselves on the exterior. If
a worker found a “self-locating” feature out of position on an assembled part, the reason was not immediately
obvious. Was the design wrong, was something previously misassembled, or was the entire assembly out of
alignment? While workers could make the next few parts fit anyway—e.g., by making a hole larger—the
downstream implications of such actions were difficult to discern. At one level, these problems suggested

19
inadequate DFMA in the omission of tolerance “wash out” locations, places in the assembly robust enough to
absorb such accumulations (Whitney 2004). In hindsight, while designers did not adequately account for
tolerance absorption needs in their CAD models (as we will discuss further in §4.3.3), root cause analysis
pointed to the primacy of another issue.
The program discovered that the FFAL’s innovative rail system, which had been implemented to enable a
balanced flow layout, contributed to this problem. A minute skewness in the rails caused slight discrepancies in
an assembly’s alignment at each work station, which led to minor misalignments of the parts added there.
Dimensional errors accumulated at each station, yet the workers proceeded believing that the assembly fixture
(the rails) was reliable. The misalignments propagated and amplified (“tolerance stack-up”) from the bottom of
the assembly to the top as the product moved down the line. For instance, a critical part of the forward fuselage
on aircraft 23 was misaligned for this reason. The unit progressed through assembly for several months with a
series of “work arounds” to accommodate the installation of additional parts, but its slow progress blocked
successive units, bogging down the entire production line. Ultimately, aircraft 23 had to be lifted off the FFAL
by crane for extensive correction. (This highlighted a limitation of the flow layout: its initial design did not
anticipate having to remove an entire assembly from the rail line, so each assembly was “boxed in” by the
adjacent assemblies.) Several other units also had assembly problems, including canopy misfit and engine air
inlet interference. The latter instance was not discovered until some six months into assembly, and it
necessitated extensive rework to resolve. As the problems were being diagnosed, the tools that held the
assembly on the rails were expensively redesigned and rebuilt, two or three times each. However, none of these
fixes got to the root cause of the problems.
What caused the rail skewness problem? Eventually, a root cause analysis discovered that, while the original
rail design had included cross-braces to maintain rail alignment, these had been removed from the design
because of fears that they would hamper worker accessibility. To correct the rail problems, several compromises
were eventually made. Instead of the diagonal cross-braces which had been proposed originally, horizontal
braces were added between the rail supports to improve stability while maintaining accessibility. Also, two
previously separate tools for holding an aircraft on the rails were joined to form an open-bottomed sled, again
providing both stability and accessibility. After these corrections, all units met tolerance requirements and labor
budgets, and throughput times showed marked reductions.
Beyond the technical solution to the issue, the process of reaching it was very interesting. The team that had
20
implemented the flow layout on the FFAL had tried to balance many competing requirements, including ones
for stability and accessibility. At first, the instability issues were just a hunch on the part of the mechanical
engineers, while the benefits of accessibility had been “proven” in previous lean implementations and had “the
political wind at their back.” The program later agreed that, had all of the various decision criteria been
addressed more evenly to begin with, the ensuing dialogue would very likely have unearthed the win-win
solution earlier. However, deference to accessibility in the name of lean had short-circuited such discussions.
Thus, the program’s consensus was that the efforts to achieve a flow line and a work environment that showed
greater respect for people not only caused the problem but also impaired the discovery of its root cause.
The switch to so-called “soft tooling” was also found to be the source of many unforeseen problems. Hard
tooling such as “master gauges” had been eliminated as wasteful in light of the new, soft tools such as the rail
system, laser-based measurement systems, and CAD tools. While these changes reduced some costs, they also
were found to have caused some critical problems. First, in many areas the program had to revert to “harder”
tooling such as gauges, tooling accessories, and templates. For example, a “hard” tool was built to lock the rail
sled in an initialized position at each station on the FFAL. Before this new tool came into use, the initial
assembly of the forward fuselage’s supporting structure would tend to pull apart under the force of gravity as it
rolled to the next station. Workers would have to “laser shoot” the arriving assembly to ensure it would be
shimmed properly before the addition of a side beam. Then, the following station had to add still more shims be-
cause of the unstable structure. With the new “hard tool” gauge, this shimming was no longer required. Its use
on aircraft 62 and following cut FFAL quality issues by about 45%. Having the new gauge meant that the rail
would no longer serve as a locating mechanism; it would exist purely for transportation. In all, on the FFAL
alone, about 25% of the soft tools eventually had to be “hardened” (and redesigned, rebuilt, and re-verified) to
eliminate problems.
Second, the laser-based measurement systems, implemented to enable assembly alignment and the detection
of problems, presented problems of their own. In theory, the lasers could provide exact measures. In practice,
however, they did not provide the same measures twice; they were potentially accurate but not precise. As one
manufacturing manager noted, “They wanted the lasers to work so badly, but each measure was different.” Here,
the root cause was determined to be the training of the workers, as attaining the desired precision took no small
amount of expertise. Moreover, a typical “laser shoot” took two people an average of six hours, and no one else
was allowed to work on the aircraft during the shoot. Since the workers using the lasers were unable to confirm

21
alignments, “hard” tooling had to be brought back to verify accuracy, fitness, and the location of problems.
Third, while the new CAD tools supported the specification of parts and assemblies to exacting tolerances,
many parts did not initially meet these specifications. Complex, contoured, composite parts such as the inlet
skins caused the worst problems. The curing cycle, temperature changes, and uneven layering caused some of
these parts to warp or spring back. Moreover, even when the parts met their CAD specifications, as determined
by a coordinate measurement device, often they still would not fit on the aircraft. It was hard to find the reason.
The parts seemed right, but they would not fit. Was something wrong with the rest of the assembly? As in the
case of the rail system, a lot of time was spent chasing culprits, attempting to get to the root cause. It turned out
that the coordinate measurement device was not accurate enough for the complex, contoured parts. Individually,
each point on the part would fall within its specification limits, but only when the other points were at their
extreme positions. (As Taguchi stressed with the quality loss function (Taguchi and Wu 1980), merely falling
within the specification limits does not guarantee sufficient overall quality.) Again, the program had to go back
and develop hard tools to help fabricate the complex, novel parts.
Fourth, without hard tooling to specify locations and alignments precisely, quality depended on the
experience of the workers. They began by having to sift through over 60 sheets of work instructions, which
consisted of statements like “Drill all remaining holes in details full-size per blueprint. Approximate (50) places.”
They spent up to half their time looking at drawings and instructions and trying to figure out what to do. Then,
they had to locate, shim, and drill by hand. The Marietta mechanics’ and inspectors’ experience had come from
building large transport aircraft like the C-130, which did not have such exacting tolerances. In their experience,
it had often been practical to make parts fit without the extensive tooling required on F-22. Despite the
program’s stated desire for “simple, visual, portable work instructions,” these did not ubiquitously materialize.
In hindsight, clearer, unambiguous, and more user-friendly work instructions—and a clearer process for
scientifically and systematically improving them—would have saved a lot of time and revealed many problems
earlier (Spear and Bowen 1999). Having hard tooling would have relieved the workers from performing hand
layouts and chasing blueprints. In their absence, the program eventually had to add many other expensive forms
of mistake-proofing.
For example, drilling caused some particularly acute problems. During production of the early aircraft,
many of the holes on the aircraft were drilled by hand, without any templates or tools. Clearly, with such slim
margins for error, this invited mistakes in positioning the holes. Moreover, the feed rate and rotation speed of
22
the drill also caused problems, especially when drilling through dissimilar materials. Many areas of the aircraft
contained layers of aluminum, titanium, and composite parts, for instance. The appropriate drill bit, bit
sharpness, feed rate, and rotation speed differed for each of these materials. Drilling through varied layers often
burned out drills, and melted or splintered the composites. Mis-drillings were costly when elaborate composite
parts had to be scrapped. Fixing this problem involved acquiring drills that would lock into place on drilling
templates and allow computer-controlled feeds and speeds, better training for the workers, and a statistical
quality control program to check every fifth hole.
The new robotic tools to automate the coating operations also ran into problems. While the automated
coating of the interior of the inlets was highly successful, it proved to be a drawback in coating the exterior.
Stealth-enhancing coatings are not easy to apply. It turned out that one robotic sprayer was not as effective and
precise as 25 concurrent, manual ones, operated by “people who knew how to paint.” The maskings and
unmaskings required as the different types of coatings were applied were not trivial or well-understood. Each
type of coating also had a different cure time, and it was difficult with the robotic system to monitor the flows
and viscosities appropriately. When the program quit using the big robot, the operation’s cycle time improved
by a factor of five. In this case, what in foresight had appeared to be an effective way to eliminate waste had
actually turned out to be unhelpful.
4.3.2 Problems with the Eliminated Tasks
Several of the so-deemed non-value-adding tasks turned out to be more important than realized. The
absence of “tool tries” meant that many producibility problems were not found until they showed up on the
production line. Unfortunately, each part could be within its specification limits but still not assemble correctly.
Again, a lot of time was spent chasing culprits. “Tool tries” were later reinstituted as part of formal acceptance
testing. In regard to the avionics lab removed from the production line, it so happened that a number of avionics
components did not work correctly upon installation, and these had to be removed and sent back to their supplier
for further investigation—at least a two-week activity—while having the lab right on the line would have
reduced this time substantially. As an initial response, to allow final testing of each aircraft to occur, parts
intended for—or even already installed on—other aircraft were borrowed (due to a lack of inventory). Any parts
so removed caused a “break of inspection” for the other aircraft. Before the parts could be reinstalled on the
lending aircraft, and especially if any part had been part of a test failure on another aircraft, the parts had to be
returned to their supplier for requalification. All of this caused a configuration control nightmare. Eventually,

23
the program made a significant investment to build an avionics lab near the production line to address these
issues. Thus, in this example also, the elimination of supposedly non-value-adding tasks ironically led to an
increase in travel, wait time, and other waste.
4.3.3 DFMA Difficulties
Despite increased efforts towards DFMA, the designers missed several important aspects. First, in striving
for part count reduction, designers sometimes forgot to test the assembly sequence. In one instance, a single-
piece, horseshoe-shaped structure was designed to wrap around the fuel tank, but an attempt to assemble the
structure revealed that the mouth of the piece was not big enough to do so. Hence, the two upper ends of the U-
shape had to be cut off and added back after the mating with the tank. Second, despite the program’s proactive
efforts to improve communications between designers and assemblers—such as using cross-functional design
teams that included both product and manufacturing process designers—new problems arose. Some assembly
problems stemmed from product design assumptions that changed without the manufacturing process designers
knowing it. For example, some of the structure and fasteners in the original design was abridged to meet weight
targets. However, the lighter airframe, once partially assembled on the line, could not be moved as easily
without causing stability problems. That is, weight reductions decided late in the design process sacrificed some
of the DFMA considerations made earlier. Since the airframe design was not complete when the production
tooling design began, assumptions had been made that were later invalidated. One issue here was determined to
be a lack of close communication between the product designers and the assemblers. In other cases, however, it
was determined that many of the assemblers that worked on the design teams did not fully appreciate the
incredibly tight tolerance requirements and therefore failed to catch many of the producibility issues during the
design phase. They had difficulty internalizing the true notion of a thousandth of an inch and its implications for
production (fabricating, drilling, aligning, etc.). The program learned the importance of having more
experienced assemblers on the design teams—and of having an ultra-experienced team of manufacturing
engineers review the production system design before its implementation. Third, a cross-functional team was
typically assigned to design each small group of parts. Even when each team could show that its own parts met
their design requirements and specifications, problems such as tolerance stack ups occurred when the parts
designed by different teams were assembled. Hence, it was determined that the design teams did not always
coordinate enough with each other, causing integration issues (Browning 1998). In at least these three cases,
insufficient DFMA was seen to contribute to the program’s production problems.

24
4.3.4 Process Disruption
The initial lean implementation had led the F-22 program to anticipate certain reductions in production costs.
However, these savings did not materialize until much later, leaving the program to face interim cost overruns.
The situation is apparent in Figure 4, which shows the expected and actual labor hours per aircraft (forward
fuselage section only). The first 17 aircraft (which include what are formally called the Production Readiness
Test Vehicles, PRTV) were supposed to verify the manufacturing process. However, the flow layout on the
FFAL (described in § 4.2) was not fully implemented until Raptor 20, which was completed in March 2003 but
started approximately 16 months earlier. (The lean implementation had originally been planned to begin with
Raptor 10, but the customer elected to delay the requisite funding. The capital investment decision-making
process did not account for any negative effects of delayed implementation.)
Figure 4: Expected and actual labor hours per aircraft (forward fuselage section only)
To derive their cost expectations, the F-22 program had used a learning curve, modified by assumptions
about the benefits of lean implementation. The program had projected an overall learning curve of 74% for
aircraft 28 to 85. Based on earlier experiences from local lean implementations, it had also assumed that:
“Lean implementation [is] a step function [that] usually results in a step down and then resumes the current curve.”
“[A] step function [reduction] occurs after implementation; [the] learning curve is [the] same after [the] step function.”
While the expected cost curve in Figure 4 smoothes out this step reduction over several units, the main point is
that lean was assumed to provide an immediate cost benefit, and that this benefit would not otherwise affect the
10 15 20 25 30 35 40 45 50 55 60
Aircraft #
Labo
r Hou
rs
Implementationof flow layout
Lot 1 Lot 2 Lot 3PRTV
2001 2003 20042002
All dates are completiondates (not start dates)
2005
Actual
Expected

25
learning curve. However, the aircraft in Lots 1 and 2 ended up requiring more manufacturing labor hours than
expected.
A few months after the implementation of the flow layout, the FFAL also experienced a significant amount
of workforce turnover. During the assembly of aircraft 24-26, about 150 new employees joined the FFAL as
production ramped up, bringing the total to around 350 people. Due to a lack of time for formal training, the
workers passed “tribal knowledge” to each other. Mentoring the new employees, who were less productive at
first, took time from the seasoned workers. The FFAL always got the newest workers on the F-22 program,
because working there did not require a security clearance. They could work on the FFAL until their clearances
were approved, at which time they could move to another area of production. Consequently, the FFAL
experienced 10-15% turnover per month during the production of aircraft 24-40, including in the supervisory
and lead positions.
Today, the F-22 program is on a positive track and meeting expectations. Further improvements are in work
to provide additional cost reductions. For example, the flow layout now enables the FFAL to be rebalanced to
prevent blocking, so that time savings in one station do not simply become waiting time before the next.
Lockheed Martin and the USAF learned valuable lessons from the F-22 production system and lean
implementation that will benefit future programs such as the F-35.
5. A Revised Framework for How Lean Implementation Affects Production Costs
While the F-22 program’s story continues to unfold, the history presented in §4 is sufficiently suggestive to
allow us to extract, examine, and build on several important themes concerning the variables and relationships
influencing the effect of lean implementation on production costs. According to Flynn et al. (1990), theory
building entails combining existing theory with new empirical data to propose an enriched, modified theory for
further testing. In this section, we synthesize the empirical data with existing theory to propose a revised
framework. By constantly comparing the emerging theory with the data, we converged on the following
conceptual categories: novelty and learning, complexity, uncertainty and instability, reconceptualizing waste,
and relations to agile manufacturing. The proposed framework emerges from these categories and explicitly
addresses new variables and relationships that moderate the relationship between lean and production costs. In
so doing, it reconceptualizes the view of lean as waste reduction. Since theory building initially leads to
propositions rather than formal hypotheses (Handfield and Melnyk 1998), we summarize our main results as
propositions. The purpose of these propositions is to direct further empirical research, which will use the

26
propositions to develop testable hypotheses.
5.1 Novelty and Learning
Our initial framework in Figure 2 suggested that novelty could contribute to uncertainty and instability in
production processes. The F-22 program was clearly novel due to many new production tasks and relationships.
Novelty is reduced through learning. Organizational and operational learning has been the subject of much
research and has been found to be driven by manifold factors (e.g., Argote et al. 2003; Muth 1986). We use
Figure 5 to frame our discussion of several of these factors and relationships.
Figure 5: Some factors and relationships pertaining to novelty and learning
Learning theorists distinguish between autonomous (also called first-order or single-loop learning) and
induced (second-order, double-loop) learning (Dutton and Thomas 1984). First-order learning is informal: the
workforce, by itself, through repetition, experience, and experimentation, finds smarter ways of doing work.
Second-order learning is where management provides training, invests in new technologies, or changes policies,
processes, or the product design (Wiersma 2007). First-order learning tends to occur in stable, routine processes,
whereas second-order learning often takes place in less well-defined contexts (Fiol and Lyles 1985).
In production operations, first-order learning has been modeled primarily with learning curves (e.g.,
Wiersma 2007), which were originally developed in aircraft manufacturing (Wright 1936) to relate production
cost reductions to increases in the cumulative number of units produced. Hence, the literature often advocates
increasing production volume to “get down the learning curve” faster. Conversely, low volume retards learning,
since tasks occur less frequently, which gives workers less ability to benefit from repetition and more
opportunity to forget best practices. While the F-22 was produced in low volume, certain tasks in its production
system were repeated many times per aircraft and thus had the potential to benefit from learning. The program
had forecasted a 74% learning curve.
Another key assumption behind learning curves is that the workforce will be relatively stable and thus able
NoveltyImplementation of lean principles and
practices
First-order learning
Production volume
_
Workforce turnover
+
Production costs
_
Production process uncertainty and
instability
+
_
∩
+
Buffering
+
±

27
to benefit from repetition (Argote et al. 1997). Bateman and Rich (2003) identified workforce turnover as an
inhibitor to process improvement, and Stratman et al. (2004) demonstrated it to be a significant driver of
production costs increases. The F-22 FFAL exhibited a workforce turnover of about 10-15% per month. On the
other hand, March (1991) argued and Wiersma (2007) found that introducing a moderate amount of new
workers facilitates first-order learning by bringing new ideas.
Learning also requires stability (Lapré and Wassenhove 2003). Organizational theory contends that group
effectiveness and improved performance do not come from radical or breakthrough change (Greenwood and
Hinings 1996) but from consistent development and continuous improvement of the routines over time (Bessant
and Caffyn 1996), and that volatility and instability will reduce learning (Benkard 2000; Sorenson 2003). The F-
22 program was characterized by a variety of instabilities from several sources (including novelty and
complexity, as we will discuss below). Since instability can hamper learning, buffering (notably in the form of
spare capacity or slack resources) can facilitate learning (March 1981; Wiersma 2007). Thus, we know that first-
order learning can be decreased by (1) uncertainty and instability, increased by (2) higher volume and (3)
buffering from instability, and increased to a point but then decreased by (4) workforce turnover. In turn, first-
order learning reduces production costs and novelty. Figure 5 summarizes these relationships.
However, the implementation of lean principles and practices on the F-22 program more closely aligns with
the definition of second-order learning. The program invested in new processes and tools and changed the
product design and the production processes, all of which characterize second-order learning (Wiersma 2007).
Adler and Clark (1991) found that second-order learning can both aid and inhibit first-order learning: second-
order learning is complex and can be disruptive, even to the point of causing sizable, if temporary, negative
effects on performance. This aligned with evidence from the F-22 program’s lean implementation.
In an effort to better understand the relationship between lean implementation and learning, we use the
general variable novelty (of production tasks). While first-order learning reduces novelty, second-order learning
increases it. On the F-22 program, product design changes increased novelty by redesigning parts, disrupting
where first-order learning had accrued. However, even more disruptions (replacing familiar tasks with
unfamiliar ones) were due to the lean implementation, both initially (§4.2) and to fix the emergent problems
(§4.3). For example, the new processes and tools (soft tooling, lasers, rail system, etc.) implied new production
tasks, and then, when these new practices led to unforeseen problems and issues, the corrections implied still
more new tasks. This recurring novelty was seen as a cause of production process uncertainty and instability,
28
and it made it difficult to establish a working “baseline” process from which to compare proposed improvements
via the scientific method (Spear and Bowen 1999).
As shown in Figure 5, a reinforcing loop exists between novelty, instability, and first-order learning. As
novelty increases uncertainty and instability, it undermines the very efforts that seek to mitigate it through first-
order learning. In more-stable contexts, first-order learning is strong enough to drive out novelty and enhance
stability, which further facilitates learning. However, in less-stable contexts, first-order learning will not achieve
as much traction. Hence, these relationships help us describe how the implementation of lean principles and
practices might influence a tipping point where the benefits of first-order learning can start to accrue. In other
words, will the changes wrought by lean implementation increase novelty faster than first-order learning can
reduce it?
These relationships also point to the timing of lean implementation as an important consideration. The
elimination of long-standing (even if non-value-adding) tasks, as well as the establishment of new processes and
tools, causes disruptions. While lean seeks stability, the period of lean implementation does not provide it to an
existing production system. In the F-22 program, a significant change to the FFAL occurred at aircraft 19.
Earlier implementation of the lean production system would have prevented the disruption of the learning curve.
The improved—yet novel and unproven—processes prevented achievement of the expected learning and cost
reductions. Lean practices, the very changes intended to reduce the cost of the process, ironically contributed to
its novelty and instability because of their timing.
The F-22 program also sought to standardize work, albeit perhaps prematurely. Early emphasis on certain
practices listed in Table 1 (like 6S, visual management, and mistake proofing)—before the overall product and
production process designs had stabilized—turned out not to be cost-effective. It was not worth optimizing the
placement of tools and materials until it had been proven that such were the appropriate tools and materials to
use (Stewart and Grout 2001). The right work needed to be determined before mechanisms were instituted to
help do the work right. Hence, if implemented at the wrong time, even lean practices can be wasteful. In the F-
22 program, the timing of the implementation of certain lean practices increased the number of decisions
required, tradeoffs to make, and new things to learn in an already novel situation. Taken together, learning
theory and the evidence from the F-22 program strongly suggest the following proposition that timing matters:
Proposition 1: The cost reduction benefits of lean practices will vary depending on the timing of their
implementation, even to the point that these benefits may be negative (costs).

29
Thus, research is needed to clarify the relationships between the costs and benefits of lean over time. Many
business cases for lean implementations collapse the time dimension to arrive at single numbers for costs and
savings. While these analyses may account for the present value of the investments and returns, they may not
deal with the dynamic interactions between existing tasks and improved (but novel) ones. This can cloud impor-
tant assumptions and fail to distinguish the lean implementation phase from the desired steady state. For exam-
ple, in contrast with the F-22 program’s learning curve assumption, research has found that performance initially
diminishes after process changes before improving (Adler and Clark 1991; Repenning and Sterman 2001).
Also, while lean has recently been described in connection with organizational learning (Hines et al. 2004;
Spear and Bowen 1999), the scholarly literature on lean does not say much specifically about learning curves. In
the more general area of process improvement, Upton and Kim (1998) explore on-line versus off-line learning
and managerial choices of learning modes. The F-22 program learned that careful experiments should be
performed first to demonstrate producibility and process capability in realistic circumstances (Cammarano 1996,
p. 28)—what Pisano (1996) has called “learning before doing” as opposed to “learning by doing.” A clearer
explanation of the relationship between lean implementation and learning curves would seem to be an important
area for further research. While first-order learning decreases production costs, there is no theory of how to
balance this benefit versus the cost of the process disruptions caused by changes—even improvements—to the
former process. Evidence from the F-22 program suggests that the costs can sometimes outweigh the benefits.
Therefore, we also propose:
Proposition 2: There is a tradeoff between the costs of learning curve disruption and the benefits of lean
implementation.
5.2 Complexity
While comprehensive definitions of complexity have proven elusive (Tang and Salminen 2001), they have
typically stressed the interconnected nature of the parts of a whole (e.g., Simon 1962). It is not uncommon for
various disciplines and areas of research, including some in operations management, to customize definitions of
complexity (e.g., Choi and Krause 2006; Makens et al. 1990). The literature on biological and artificial systems
has defined complexity in terms of the number of components and relationships in a system (e.g., the NK
model—Kauffman and Levin 1987), and then recursively with the complexity of these constituent components
and relationships (Tang and Salminen 2001). An entity’s complexity has also been said to depend on the amount
of information required to describe it, which depends on the entity’s number of distinct possible states (Bar-Yam

30
1997). Thus, variety can influence complexity, since a system of five different components can be more
complex (requiring more information to describe) than a system of ten identical components, and a system of ten
components with a standard type of relationship can be less complex than five components with a variety of
possible relationships. Hence, in Figure 6 we note four factors as a minimal set of drivers of production process
complexity. Without arguing that these four factors exhaustively determine complexity, they provide a richer
definition than many others proposed in the operations management literature. Operational complexity has
furthermore been shown to stem from multiple domains, including the product, process, organization, tool, and
objectives domains (Danilovic and Browning 2007). In each of these domains, a greater variety of components,
tasks, people, tools, and goals, as well as a greater variety of relationships between them, increases
complexity—and interactions across domains compound this effect. Thus, a complex product, organization,
and/or tool set will, all else being equal, amplify the complexity of an associated production process.
Figure 6: A portion of the new framework related to production process complexity
Despite the challenges in pinning down all of its determinants, complexity clearly has several implications
for production operations. For one, it increases production costs directly through what have been called
complexity costs, the costs of performing a heterogeneous rather than a homogeneous set of tasks (related to
diseconomies of scope) (Lovejoy and Sethuraman 2000). Second, complexity can increase uncertainty and
instability (Bonabeau 2007). As tasks increase their internal complexity and variety, and as they relate to each
other in increasingly complex and varied ways, workers will, all else being equal, have less certainty about the
effects that can emerge from the production system. Moreover, if the interactions are difficult to identify—e.g.,
due to the novelty of the situation—then it becomes even more likely that some important ones will be
overlooked. In complex processes, a seemingly small change in one area has the possibility of leveraging a
much larger change in the whole process (e.g., Lorenz’s famous “butterfly effect”) (Holland 1998). This
emergence will often perturb the process in unforeseen ways, thereby contributing to instability. On the F-22
program, the large number of product components, manufacturing tasks, people in various organizational groups,
Production process uncertainty and
instability
Production process
complexity
Complexity of actions (tasks)
Variety of actions (tasks)
Variety of interactions
Complexity of interactions
+
+
+
+
+
Production costs
+
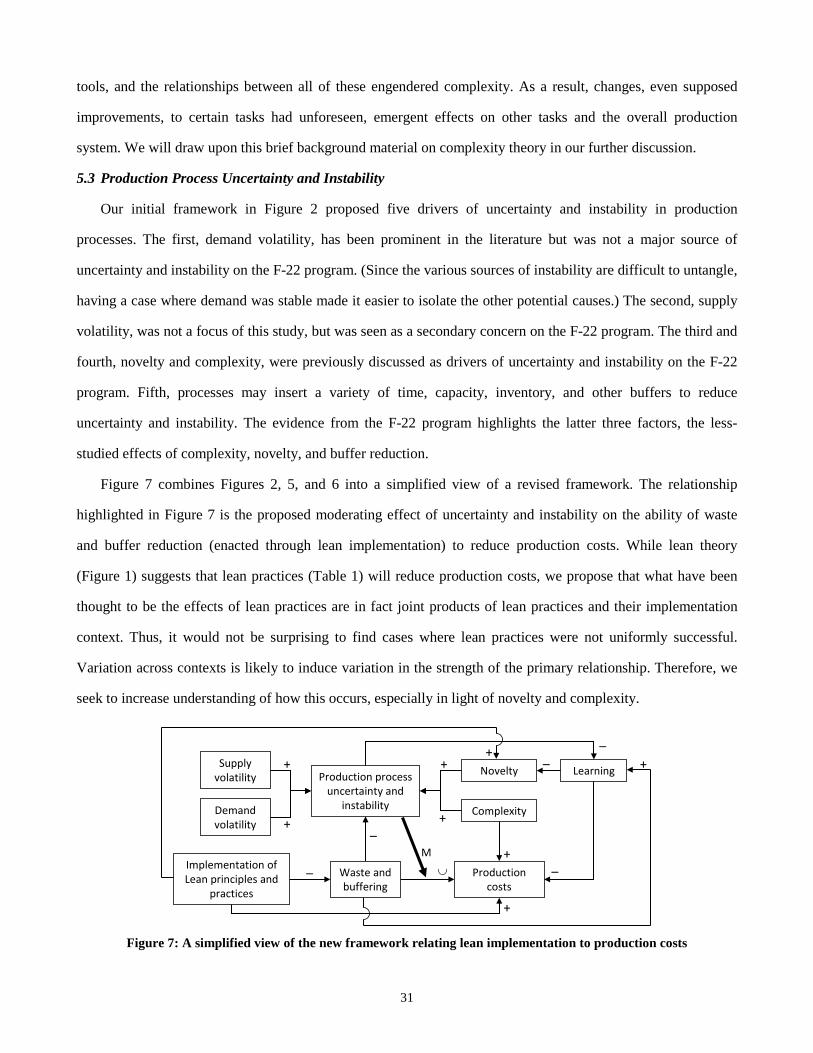
31
tools, and the relationships between all of these engendered complexity. As a result, changes, even supposed
improvements, to certain tasks had unforeseen, emergent effects on other tasks and the overall production
system. We will draw upon this brief background material on complexity theory in our further discussion.
5.3 Production Process Uncertainty and Instability
Our initial framework in Figure 2 proposed five drivers of uncertainty and instability in production
processes. The first, demand volatility, has been prominent in the literature but was not a major source of
uncertainty and instability on the F-22 program. (Since the various sources of instability are difficult to untangle,
having a case where demand was stable made it easier to isolate the other potential causes.) The second, supply
volatility, was not a focus of this study, but was seen as a secondary concern on the F-22 program. The third and
fourth, novelty and complexity, were previously discussed as drivers of uncertainty and instability on the F-22
program. Fifth, processes may insert a variety of time, capacity, inventory, and other buffers to reduce
uncertainty and instability. The evidence from the F-22 program highlights the latter three factors, the less-
studied effects of complexity, novelty, and buffer reduction.
Figure 7 combines Figures 2, 5, and 6 into a simplified view of a revised framework. The relationship
highlighted in Figure 7 is the proposed moderating effect of uncertainty and instability on the ability of waste
and buffer reduction (enacted through lean implementation) to reduce production costs. While lean theory
(Figure 1) suggests that lean practices (Table 1) will reduce production costs, we propose that what have been
thought to be the effects of lean practices are in fact joint products of lean practices and their implementation
context. Thus, it would not be surprising to find cases where lean practices were not uniformly successful.
Variation across contexts is likely to induce variation in the strength of the primary relationship. Therefore, we
seek to increase understanding of how this occurs, especially in light of novelty and complexity.
Figure 7: A simplified view of the new framework relating lean implementation to production costs
Production process uncertainty and
instability
Novelty+
Complexity+Demand volatility
+
_
Production costs
Implementation of Lean principles and
practices
_M
Supply volatility
+
Learning_
_+
+
+
∪
_
Waste and buffering
+

32
One aspect to consider involves the scale of lean implementation. The F-22 program exhibited several cases
where lean practices and results on a local level failed to scale up to the entire production system. For instance,
the program assumed a step-function improvement in the learning curve as the result of lean implementation.
This assumption was based on actual savings from earlier, detailed line analysis, in which workers had been
videotaped doing a task and this information used to improve the work sequence. In several such cases, the step-
function reduction in unit costs and the resumption of the learning curve had been verified. However, the same
effect did not materialize for the overall production system, or even just the FFAL. One explanation is that the
earlier lean implementations had looked at relatively stable tasks for which a pattern (albeit an inefficient one)
had already been established, whereas the FFAL tasks were novel and dynamic. The earlier implementations
had also addressed individual tasks with relatively stable inputs, whereas the FFAL tasks had numerous tasks
changing around them, altering their outputs and thus other tasks’ inputs. (Indeed, it seems to be a common but
dangerous assumption in many process improvement contexts that a process or task can be improved in isolation,
with its inputs taken for granted.) On the F-22 program, what worked at the task level did not always work the
same way at the process level. Hence, we propose that scale matters:
Proposition 3: The benefits of specific lean practices will vary depending on the scale and interconnectedness of
the tasks and processes to which they are applied.
5.4 Reconceptualizing Waste and Value
As the evidence from the F-22 program led us to dig deeper into the problem of scale motivated by, this
pointed to a more general issue regarding the value of an individual tasks to an overall process, and it became
clear that we needed to look at waste and value in a different way. As discussed in §2, the hallmark of lean is the
minimization of waste. However, the F-22 program encountered a problem in determining what was in fact
wasteful. Ohno (1988) originally distinguished seven categories of waste: defects, overproduction, inventories,
unnecessary processing, unnecessary movement of people, unnecessary transport of goods, and waiting—to
which Womack and Jones (2003) added an eighth—the design of goods and services that do not meet users’
needs. However, these categories are quite general, and they beg the question of what is “unnecessary.”
Womack and Jones (2003) defined waste (muda) as the antithesis of customer value, thereby turning the
question to one of ascertaining customer value. Murman et al. (2002) argued for a balance between minimizing
waste and providing value. Browning (2003) and Hines et al. (2004) contended that the core objective of lean
was not minimizing waste but rather maximizing customer value, and Browning further suggested that the value
33
to all stakeholders (including customers, users, suppliers, employees, and shareholders) must be satisficed, since
maximizing customer value alone (where the customer ideally wants a great product, immediately, for free)
would lead a company down the road of Netscape. Of course, achieving such a balance poses challenges, since
stakeholders have competing preferences. Moreover, these preferences may be difficult to articulate and will
change over time. Having noted these issues, however, we leave them aside to focus on a more specific one:
assuming that an operation has a clear definition of desired value, how can it identify the specific actions which
do not contribute to providing that value (i.e., the waste)?
We found it helpful to consider this question using the construct of a process. A process is an organized
collection of related tasks working together to produce a result of value (Hammer 2001). According to Womack
and Jones (2003), some of the tasks in a process contribute directly to the overall value of its result while others
do not. As discussed in § 2.1, some of those that do not (Type 1 muda) are necessary (to support the tasks that
do), while others (Type 2 muda) may be unnecessary. However, differentiating the Type 1 and 2 muda tasks
may be quite daunting: it may be difficult to distinguish “muscle” from “fat” and lean from “emaciated”
(Browning 2003). That is, it is possible to commit both type 1 and type 2 errors (errors of omission and commis-
sion) while attempting to find Type 1 and Type 2 tasks. Therefore, a deeper understanding of a process—its
constituent tasks and their relationships—seems necessary. This realization leads to three propositions.
First, the large number of interrelationships in a complex process leads to the possibility of a seemingly
small change in one area leveraging a much larger, emergent change in the whole process. To insulate against
such effects, most complex, novel processes contain a variety of time, capacity, and inventory buffers.
Diminishing these buffers effectively magnifies the interdependencies by increasing the ability of one task to
affect another (Safayeni and Purdy 1991). The F-22 data provide several examples. First, the program’s
complexity and novelty obscured a number of what turned out to be important interrelationships in the product
design and its manufacturing processes. Many of the process and tool changes made to implement lean practices
had unforeseen effects, and many of the buffers that had restrained these problems in the past had been
identified as wasteful and removed. For instance, the FFAL’s innovative rail system, designed to enable single-
piece flow and worker accessibility, precipitated a major stability problem in the assembly. The elimination of
hard tooling and “tool tries” also caused problems, and the introduction of new tools (such as CAD systems and
laser alignment) proved insufficient as a replacement. Occurring together, many of these problems took a long
time to diagnose and correct, requiring searches through complex webs of interactions. (In this context, “five

34
whys” were not always enough to trace through all of the interrelationships.) Thus, much of the so-called waste
in the production process may not have been “fat” but perhaps just currently unused muscle. It has been
previously noted that the complexity of a system must be understood before attempts are made to improve it, or
else interventions may lead to sub-optimization (Gottinger 1983). A synthesis of complexity theory and
evidence from the F-22 program suggests that:
Proposition 4: In a context of novelty and complexity, it will be more difficult to pinpoint waste.
Second, since Proposition 4 is quite general, we want to look more deeply at the determinants of waste and
value (anti-waste). The importance of the interactions in a process (vice the tasks or actions) leads one to
question the approach of identifying waste by classifying tasks into three types. Depending on its inputs and
outputs, a task can switch categories. For example, a completely efficient, effective, and value-adding task, if it
receives bad inputs (e.g., mistaken data or assumptions), will produce bad outputs and not add value—the
“garbage in, garbage out” problem. Hence, the task interrelationships, as determined by the inputs they need and
the outputs they produce, help govern a process’s value (Browning 2003). That is, value would seem to be a
dynamic attribute linked to the utility of a task’s outputs rather than a completely intrinsic property of a task—a
function of what is accomplished rather than what is done. In the F-22 production system, some tasks were
rendered less valuable because their inputs changed, such as when some of the self-locating parts were
eliminated. A complex process will have a greater number and variety of task interactions. Thus, to get more
specific on how to identify waste, we propose:
Proposition 5: Much of the waste in a process is attributable to the interactions, not just the tasks, and this
amount will increase with process complexity and novelty.
Third, despite this new emphasis on the value of the interactions between tasks, we are not sanguine that
interactions alone will explain all of the value or waste in a process, any more than just the tasks could. An
important property of complex systems is emergence, wherein certain behaviors arise from the interactions
between the system’s constituent components. Often these behaviors cannot be fully understood in terms of the
components or their relationships alone. Therefore, especially in a context of complexity magnified by novelty,
we propose:
Proposition 6: Value is an emergent property of a complex process that cannot be completely decomposed and
allocated to the process’s constituent tasks and interactions.

35
5.5 Relating Lean and Agile
If scale matters in relation to tasks and processes, then it could matter for buffer placement as well. Agile
manufacturing methods have been proposed as a more general way of essentially buffering against uncertainties
and instabilities. Several scholars have sought to compare and integrate lean and agile (e.g., Narasimhan et al.
2006; Prince and Kay 2003). While sharing some practices with lean, agile emphasizes dealing with demand
variety and volatility (Naylor et al. 1999; van Hoek et al. 2001) by producing small, highly customized batches
and emphasizing availability over cost (Brown and Bessant 2003; Christopher and Towill 2001). Agility has
also been noted to apply in a context of product and process complexity (Sharifi and Zhang 2001). Hines et al.
(2004) suggested that agile is potentially applicable where lean breaks down, such as in a dynamic, low-volume
context. Despite the stable demand rate for the F-22, agile nevertheless seems relevant in addressing the
uncertainty and instability driven by novelty and complexity. Comparing lean and agile in light of the evidence
from the F-22 program leads to three more propositions.
First, agile essentially entails devoting a portion of manufacturing resources to “just in case” practices that
enable rapid response capability and sensing leading indictors of potential problems. While a purely lean
perspective would declare some of these tasks to be non-value-added, their value becomes apparent in many
scenarios. In using the metaphor of an athlete to distinguish lean from emaciated, Browning (2003) noted that
value is maximized by the most competitive athletes, not just the ones that weigh the least. Spear and Bowen
(1999) deemed that the flexibility of the TPS was enabled by the ability to quickly compare a potential change
against a standardized process. Feedback of timely and accurate information on the performance of a
manufacturing process is essential (Hayes 1981). Similarly, TQM provides earlier problem detection, diagnosis,
and correction, in line with the scientific method. However, an abundance of monitoring and control tasks would
be deemed non-value-added in a strict application of lean. These arguments lead us to propose:
Proposition 7: Greater uncertainty and instability will increase the proportion of “just in case” and “sense and
respond” tasks and resources (that enable agility) in a value-maximizing process.
Second, in Figure 7, the uncertainty and instability caused by novelty and complexity differ from that driven
by other sources in that the root causes could be more difficult to anticipate a priori. Any novel, complex
product will have a number of unexpected problems and issues arise during its development and production.
Rather than attempt to confront this variation entirely with targeted, predetermined contingency buffers, and
forecasts of the value (or lack thereof) provided by individual tasks, more general pools of mobile resources can

36
be used (Bateman and Rich 2003). (This idea is similar to the critical chain approach to project management
(Goldratt 1997), which consolidates individual task buffers into project-level buffers.) The F-22 program
eventually created such a group of resources to respond more quickly to issues that arose. Hence, we propose:
Proposition 8: As the uncertainty and instability caused by novelty and complexity increase, a value-maximizing
process will incorporate more general buffers (increased agility) rather than more specialized buffers.
Third, as discussed above, many view lean as process improvement by carving away the waste to reveal the
value-adding work. Yet, other approaches to process improvement do not necessarily place the same emphasis
on waste reduction. For example, according to Nakamura et al. (1998), a key difference between lean and TQM
is that the former emphasizes cost reduction, while the latter adds good practices without always accounting for
their cost. Agile also places less emphasis on efficiency than lean. Thus, the expectation of cost savings that is
often associated with lean might need to be tempered. “Cost reduction efforts introduce rigidities that may make
the organization slower and less flexible” (Day and Montgomery 1983). Our earlier discussion of the sources of
value and waste in a process, and the often-perceived emphasis of lean on improving operations by eliminating
tasks, leads to the following proposition:
Proposition 9: In the presence of the uncertainty and instability, the overall value of a process may be increased
by the addition rather than the elimination of tasks.
5.6 Lean Implementation Benefits and Costs
The F-22 program also attributed its lack of production cost reductions to the unforeseen costs of lean
implementation itself. As shown in Figure 7, lean implementation has costs (viewed as an investment in the
production system) which are expected to be outweighed by the benefits of waste and buffer reduction (the
return on investment). However, an overabundance of lean practices could potentially fail to recoup the
investment. The F-22 program encountered this situation in two ways, each of which motivates a theoretical
proposition.
First, our analysis of the data is congruent with the view that the program carried some lean practices too far.
Lean practices which had proven helpful in certain areas and to certain extents were carried even further,
perhaps even (ironically) to the point of being wasteful. Thus, it would be helpful to find ways to identify the
points of diminishing and negative returns. Certain lean practices do this already. For example, in kanban
systems, the goal is not zero inventory but rather the minimum inventory given the replenishment lead time and
any supply and demand uncertainties. Inventory reduction is helpful, to a point, past which it becomes

37
problematic. More generally, then, what are the indicators of the situations in which, and the extents to which,
other lean practices should be implemented? For example, how much mistake-proofing is appropriate? If
unchecked, the addition of policies and indicators to prevent mistakes can lead to a cumbersome bureaucracy
that requires “leaning” in its own right (e.g., Esterl 2007). Thus, as an area for continued research, we propose:
Proposition 10: The implementation of lean practices will exhibit negative returns past a point, which depends
on the prevailing uncertainties and instabilities.
Second, the F-22 program exhibited strong support for lean from top management and other key
stakeholders. To support the implementation and sustenance of process improvements, many works on lean, six
sigma, TQM, reengineering, and change management have noted the importance of such support (e.g., Flynn et
al. 1994; Leonard and Sasser 1982). However, this support could potentially be so strong that managers fail to
count the costs of lean implementation. In a study of new products, Cooper and Kleinschmidt (1987) found the
same amount of top management support for both successes and failures. Zipkin (1991) claimed that many top
managers fail to distinguish between “romantic JIT” and “pragmatic JIT,” where the former entails idealistic
goals and slogans such as zero inventories, zero defects, and lot sizes of one. Senior managers without much
day-to-day involvement on the shop floor are apt to find “romantic lean” appealing, envisioning it as a quick fix
to problems and as a way to cut costs. Believing lean to be a relatively simple concept, they expect quick results
from lower-level managers and workers. However, the TPS took decades to develop. Making lean changes on
the shop floor without dealing with the reasons for the supposed waste can quickly lead to chaos, delays, and
missed deliveries. Hence, top management support must not be dogmatic and must be qualified by asking tough
questions with the overall situation in mind. Thus, in parallel with Proposition 10, we propose:
Proposition 11: Top management support of lean implementation can contribute to pushing lean
implementation into the region of negative returns.
6. Conclusion
Beginning with the central proposition of lean theory, that the implementation of lean principles and
practices will reduce production costs, this paper explores the effects of other variables on this relationship. The
case study of the F-22 program—an exemplary case of uncertainty and instability driven by novelty and
complexity—serves a revelatory role, adding to understanding “by refuting some widely held beliefs” (Stuart et
al. 2002). It also provides motivation, inspiration, and illustration of a revised view (Siggelkow 2007). The
synthesis of existing theory with empirical data led to a revised framework that reconceptualizes the relationship

38
between lean and production costs. The number of factors and relationships in the revised framework suggest
that lean implementation is not simple and may help explain the mixed results in various organizations. We find
that the timing, scale, and extent of lean implementation matter, that the reduction of waste is better construed as
the provision of value, and that this value is an emergent property of a process—implying that lean is not the
guaranteed result of the elimination of tasks. Certainly, our propositions point to the need for further empirical
research, which should in turn result in further enhancements to the theory of lean. Additional study is needed to
explore the relative intensities and effects of the proposed relationships. Nevertheless, our revised framework
expands theory by significantly reconceptualizing the relationship between lean implementation and production
costs and then grounding these predictions with a combination of conceptual arguments, existing theory, and
case study evidence. If our analysis has encouraged moving beyond a simple model of lean implementation and
its associated heuristics, then it will have served its purpose.
References Adam, E.E. 1994. Alternative Quality Improvement Practices and Organization Performance. Journal of Operations
Management, 12(1) 331-347.
Adler, P.S., K.B. Clark. 1991. Behind the Learning Curve: A Sketch of the Learning Process. Mgmt Sci, 37(3) 267-281.
Argote, L., D. Epple, R.D. Rao, K. Murphy. 1997. The Acquisition and Depreciation of Knowledge in a Manufacturing Organization: Turnover and Plant Productivity. Carnegie Mellon University, Working Paper.
Argote, L., B. McEvily, R. Reagans. 2003. Managing Knowledge in Organizations: An Integrative Framework and Review of Emerging Themes. Management Science, 49(4) 571-582.
Bar-Yam, Y. 1997. Dynamics of Complex Systems. Addison-Wesley, Reading, MA.
Bateman, N., N. Rich. 2003. Companies' Perceptions of Inhibitors and Enablers for Process Improvement Activities. International Journal of Operations & Production Management, 23(2) 185-199.
Benkard, C.L. 2000. Learning and Forgetting: The Dynamics of Aircraft Production. American Econ Rev, 90(4) 1034-1054.
Bessant, J., S. Caffyn. 1996. High Involvement Innovation through Continuous Improvement. International Journal of Technology Management, 14(1) 7-28.
Blackstone, J.H., J.F. Cox. 2004. APICS Dictionary. 11th Edition, APICS--The Association for Operations Management, Falls Church, VA.
Blumenstein, R. 1998. Strike Pushes GM to Shut Down All North American Operations, Wall Street J, June 25, A2.
Blumenstein, R., G. White. 1998. In Aftermath of UAW Strikes, GM Seeks to Justify the Costs, Wall Street J, July 30, A2.
Bonabeau, E. 2007. Understanding and Managing Complexity Risk. MIT Sloan Management Review, 48(4) 62-68.
Boothroyd, G., P. Dewhurst, W. Knight. 1994. Product Design for Manufacture and Assembly. Marcel Dekker, New York.
Brown, K.A., T.R. Mitchell. 1991. A Comparison of Just-In-Time and Batch Manufacturing: The Role of Performance Obstacles. Academy of Management Journal, 34(4) 906-917.
Brown, S., J. Bessant. 2003. The Manufacturing Strategy-Capabilities Links in Mass Customisation and Agile Manufacturing – An Exploratory Study. Int Journal of Operations & Production Management, 23(7) 707-730.
Browning, T.R. 1998. Integrative Mechanisms for Multiteam Integration: Findings from Five Case Studies. Systems Engineering, 1(2) 95-112.
Browning, T.R. 2003. On Customer Value and Improvement in Product Development Processes. Sys Eng, 6(1) 49-61.

39
Cammarano, J.R. 1996. Turn Out the Lights? IIE Solutions, 28(11) 25-33.
Chase, R.B., F.R. Jacobs, N.J. Aquilano. 2006. Operations Management for Competitive Advantage. 11th Edition, McGraw-Hill/Irwin, New York.
Choi, T.Y., D.R. Krause. 2006. The Supply Base and Its Complexity: Implications for Transaction Costs, Risks, Responsiveness, and Innovation. Journal of Operations Management, 24(5) 637-652.
Chozick, A. 2007. A Key Strategy of Japan's Car Makers Backfires, The Wall Street Journal, July 20, B1, B5.
Christopher, M., D. Towill. 2001. An Integrated Model for the Design of Agile Supply Chains. International Journal of Physical Distribution & Logistics Management, 31(4) 235-246.
Cook, C.R., J.C. Graser. 2001. Military Airframe Acquisition Costs: The Effects of Lean Manufacturing. RAND, Santa Monica, CA.
Cooper, R.G., E.J. Kleinschmidt. 1987. New Products: What Separates Winners from Losers? Journal of Product Innovation Management, 4(3) 169-184.
Corbett, S. 2007. Beyond Manufacturing: The Evolution of Lean Production. McKinsey Quarterly (3) 94-95.
Cusumano, M.A., K. Nobeoka. 1998. Thinking Beyond Lean. The Free Press, New York.
Danilovic, M., T.R. Browning. 2007. Managing Complex Product Development Projects with Design Structure Matrices and Domain Mapping Matrices. International Journal of Project Management, 25(3) 300-314.
Day, G.S., D.B. Montgomery. 1983. Diagnosing the Experience Curve. Journal of Marketing, 4744-58.
de Treville, S., J. Antonakis. 2006. Could Lean Production Job Design Be Intrinsically Motivating? Contextual, Configurational, and Levels-of-Analysis Issues. Journal of Operations Management, 24(2) 99-123.
Donaldson, L. 2001. The Contingency Theory of Organizations. Sage Publications, Thousand Oaks, CA.
Dutton, J.M., A. Thomas. 1984. Treating Progress Functions as a Managerial Opportunity. Academy of Management Review, 9(2) 235-247.
Eisenhardt, K.M. 1989. Building Theories from Case Study Research. Academy of Management Review, 14(4) 532-550.
Eisenhardt, K.M., M.E. Graebner. 2007. Theory Building from Cases: Opportunities and Challenges. Academy of Management Journal, 50(1) 25-32.
Esterl, M. 2007. Germans Hack at Forest of Signs Distracting Drivers, The Wall Street Journal, July 25, A1.
Fielding, N.G., J.L. Fielding. 1986. Linking Data. Sage, Newbury Park, CA.
Fiol, C.M., M.A. Lyles. 1985. Organizational Learning. Academy of Management Review, 10(4) 803-813.
Flanders, R.E. 1925. Design, Manufacture and Production Control of a Standard Machine. Transactions of the American Society of Mechanical Engineers (ASME), 46(1933) 691-713.
Flynn, B.B., S. Sakakibara, R.G. Schroeder, K.A. Bates, E.J. Flynn. 1990. Empirical Research Methods in Operations Management. Journal of Operations Management, 9(2) 250-284.
Flynn, B.B., R.G. Schroeder, S. Sakakibara. 1994. A Framework for Quality Management Research and an Associated Measurement Instrument. Journal of Operations Management, 11 339-366.
Ford, H. 1926. Today and Tomorrow. William Heinemann, Ltd., London.
Fujimoto, T. 1999. The Evolution of a Manufacturing System at Toyota. Oxford University Press, Oxford, England.
Fullerton, R.R., C.S. McWatters, C. Fawson. 2003. An Examination of the Relationships Between JIT and Financial Performance. Journal of Operations Management, 21(4) 383-404.
Gaither, N., G. Frazier. 2002. Operations Management. 9th Edition, South-Western, Mason, OH.
Galbraith, J.R. 1977. Organization Design. Addison-Wesley, Reading, MA.
Glaser, B., A. Strauss. 1967. The Discovery of Grounded Theory. Wiedenfeld and Nicholson, London.
Goldratt, E.M. 1997. Critical Chain. The North River Press, Great Barrington, MA.
Gottinger, H.W. 1983. Coping With Complexity. D. Reidel, Dordrecht, Holland.

40
Greenwood, R., C.R. Hinings. 1996. Understanding Radical Organizational Change: Bringing Together the Old and the New Institutionalism. Academy of Management Review, 21(4) 1022-1054.
Hall, R.W. 1983a. Zero Inventories. Dow Jones-Iewin, Homewood, IL.
Hall, R.W. 1983b. Zero Inventories Crusade--Much More than Materials Management. Production and Inventory Management Journal, 24(3) 1-8.
Hammer, M. 2001. Seven Insights About Processes. Proceedings of the conference The Strategic Power of Process: From Ensuring Survival to Creating Competitive Advantage, Boston, Mar. 5-6.
Handfield, R.B., S.A. Melnyk. 1998. The Scientific Theory-Building Process: A Primer using the Case of TQM. Journal of Operations Management, 16(4) 321-339.
Hayes, R.H. 1981. Why Japanese Factories Work. Harvard Business Review, 59(4) 56-66.
Heizer, J., B. Render. 2006. Operations Management. 8th Edition, Pearson Prentice Hall, Upper Saddle River, NJ.
Helander, M. 1995. A Guide to the Ergonomics of Manufacturing. Taylor & Francis, London.
Hines, P., M. Holweg, N. Rich. 2004. Learning to Evolve: A Review of Contemporary Lean Thinking. International Journal of Operations & Production Management, 24(10) 994-1011.
Holland, J.H. 1998. Emergence: From Chaos to Order. Helix (Addison-Wesley), Reading, MA.
Holweg, M. 2007. The Genealogy of Lean Production. Journal of Operations Management, 25(3) 420-437.
Holweg, M., F. Pil. 2001. Successful Build-to-Order Strategies Start With the Customer. Sloan Mgmt Review, 43(1) 74-83.
Hopp, W.J., M.L. Spearman. 2004. To Pull or Not to Pull: What Is the Question? Mfg & Service Ops Mgmt, 6(2) 133-148.
Jick, T.D. 1979. Mixing Qualitative and Quantitative Methods: Triangulation in Action. Admin Sci Quarterly, 24 602-611.
Kandebo, S.W. 1997. Lean Initiative Spurs Industry Transformation. Aviation Week & Space Technology, 147(4) 56-61.
Kandebo, S.W. 1999a. Lean Thinking Prompts Line Shift for F-22. Aviation Week & Space Technology, 151(2) 61f.
Kandebo, S.W. 1999b. Lean Thinking Spurs Culture Shift at LMAS. Aviation Week & Space Technology, 151(2) 56f.
Kauffman, S.A., S. Levin. 1987. Towards a General Theory of Adaptive Walks on Rugged Landscapes. Journal of Theoretical Biology, 128(1) 11-45.
Krafcik, J.F. 1988. Triumph of the Lean Production System. Sloan Management Review, 30(1) 41-52.
Lang, J.D., P.B. Hugge. 1995. Lean Manufacturing for Lean Times. Aerospace America, 33(5) 28-33 & 39.
Lapré, M.A., L.N.V. Wassenhove. 2003. Managing Learning Curves in Factories by Creating and Transferring Knowledge. California Management Review, 46(1) 53-71.
Lawrence, P.R., J.W. Lorsch. 1967. Organization and Environment. Harvard Business School Press, Boston.
Lawson, M.B.B. 2002. In Praise of Slack: Time Is of the Essence. IEEE Engineering Management Review, 30(1) 4-13.
Leonard, F.S., W.E. Sasser. 1982. The Incline of Quality. Harvard Business Review, 60(5) 163-171.
Liker, J.K., Ed. 1997. Becoming Lean. Productivity Press, New York.
Liker, J.K. 2003. The Toyota Way. McGraw-Hill, New York.
Lovejoy, W.S., K. Sethuraman. 2000. Congestion and Complexity Costs in a Plant with Fixed Resources that Strives to Make Schedule. Manufacturing & Service Operations Management, 2(3) 221-239.
Makens, P.K., D.F. Rossin, M.C. Springer. 1990. A Multivariate Approach for Assessing Facility Layout Complexity. Journal of Operations Management, 9(2) 185-208.
March, J.G. 1981. Footnotes to Organizational Change. Administrative Science Quarterly, 26(4) 563-577.
March, J.G. 1991. Exploration and Exploitation in Organizational Learning. Organization Science, 2(1) 71-87.
March, J.G., L.S. Sproull, M. Tamuz. 1991. Learning from Samples of One or Fewer. Organization Science, 2(1) 1-13.
McCutcheon, D.M., J.R. Meredith. 1993. Conducting Case Study Research in Operations Management. Journal of Operations Management, 11(3) 239-256.
McLachlin, R. 1997. Management Initiatives and Just-in-Time Manufacturing. J of Operations Management, 15271-292.

41
Meredith, J.R. 1998. Building Operations Management Theory Through Case and Field Research. Journal of Operations Management, 16(4) 441-454.
Miles, M.B., A.M. Huberman. 1984. Qualitative Data Analysis. Sage Publications, Beverly Hills, CA.
Mintzberg, H. 1979. An Emerging Strategy of 'Direct' Research. Administrative Science Quarterly, 24(4) 582-589.
Monden, Y. 1983. The Toyota Production System. Productivity Press, Portland, OR.
Murman, E., T. Allen, K. Bozdogan, J. Cutcher-Gershenfeld, H. McManus, D. Nightingale, E. Rebentisch, T. Shields, F. Stahl, M. Walton, J. Warmkessel, S. Weiss, S. Widnall. 2002. Lean Enterprise Value. Palgrave, New York.
Muth, J.F. 1986. Search Theory and the Manufacturing Progress Function. Management Science, 32(8) 948-962.
Nakamura, M., S. Sakakibara, R. Schroeder. 1998. Adoption of Just-in-Time Manufacturing Methods at U.S.- and Japanese-Owned Plants: Some Empirical Evidence. IEEE Transactions on Engineering Management, 45(3) 230-240.
Narasimhan, R., M. Swink, S.W. Kim. 2006. Disentangling Leanness and Agility: An Empirical Investigation. Journal of Operations Management, 24(1) 440-457.
Naylor, J.B., M.M. Naim, D. Berry. 1999. Leagility: Integrating the Lean and Agile Manufacturing Paradigms in the Total Supply Chain. International Journal of Production Economics, 62(1/2) 107-118.
Ohno, T. 1988. Toyota Production System: Beyond Large-Scale Production. Productivity Press, Cambridge, MA.
Pisano, G.P. 1996. Learning-Before-Doing in the Development of New Process Technology. Res Policy, 25 1097-1119.
Powell, T.C. 1995. Total Quality Management as Competitive Advantage: A Review and Empirical Study. Strategic Management Journal, 16(1) 15-37.
Prince, J., J.M. Kay. 2003. Combining Lean and Agile Characteristics: Creation of Virtual Groups by Enhanced Production Flow Analysis. International Journal of Production Economics, 85 305-318.
Ramarapu, N.K., S. Mehra, M.N. Frolick. 1995. A Comparative Analysis and Review of JIT “Implementation” Research. International Journal of Operations and Production Management, 15(1) 38-49.
Repenning, N.P., J.D. Sterman. 2001. Nobody Ever Gets Credit for Fixing Problems that Never Happened: Creating and Sustaining Process Improvement. California Management Review, 43(4) 64-88.
Safayeni, F., L. Purdy. 1991. A Behavioral Case Study of Just-in-Time Implementation. J of Ops Mgmt, 10(2) 213-228.
Safayeni, F., L. Purdy, R.v. Engelen, S. Pal. 1991. Difficulties in Just-in-Time Implementation: A Classification Scheme. International Journal of Operations & Production Management, 11(7) 27-36.
Samson, D., M. Terziovski. 1999. The Relationship Between Total Quality Management Practices and Operational Performance. Journal of Operations Management, 17(5) 393-409.
Santos, J., R.A. Wysk, J.M. Torres. 2006. Improving Production with Lean Thinking. Wiley, New York.
Schonberger, R.J. 1982a. Japanese Manufacturing Techniques. Free Press, New York.
Schonberger, R.J. 1982b. Some Observations on the Advantages and Implementation Issues of Just-in-Time Production Systems. Journal of Operations Management, 3(1) 1-12.
Schonberger, R.J. 1982c. The Transfer of Japanese Manufacturing Management Approaches to U.S. Industry. Academy of Management Review, 7(3) 479-488.
Schonberger, R.J. 1986. World Class Manufacturing: The Lessons of Simplicity Applied. Free Press, New York.
Shah, R., P. Ward. 2003. Lean Manufacturing: Context, Practice Bundles, and Performance. J of Ops Mgmt, 21 129-149.
Sharifi, H., Z. Zhang. 2001. Agile Manufacturing in Practice: Application of a Methodology. International Journal of Operations & Production Management, 21(5/6) 772-794.
Shields, J.T., A. Kilpatrick, M. Pozsar, L.G. Ramirez-de-Arellano, V. Reynal, M. Quint, J. Schoonmaker. 1997. Lean Implementation Considerations in Factory Operations of Low Volume/High Complexity Production Systems. MIT Lean Aircraft Initiative, Report #RP97-04-152.
Shingo, S. 1989. A Study of the Toyota Production System. Revised Edition, Productivity Press, Cambridge, MA.
Shirouzu, N., S. Moffett. 2004. As Toyota Closes In on GM, Quality Concerns Also Grow, The Wall Street J, Aug. 4, A1.
Siggelkow, N. 2007. Persuasion with Case Studies. Academy of Management Journal, 50(1) 20-24.

42
Simon, H.A. 1962. The Architecture of Complexity. Proceedings of the American Philosophical Society, 106(6) 467-482.
Simon, H.A. 1981. The Sciences of the Artificial. 2nd Edition, MIT Press, Cambridge, MA.
Smalley, A. 2005a. Basic Stability is Basic to Lean Manufacturing Success. Lean Enterprise Institute, Report.
Smalley, A. 2005b. TPS versus Lean and the Law of Unintended Consequences. <http://www.superfactory.com/articles/Smalley_TPS_vs_Lean.htm>.
Sohal, A.S., A.Z. Keller, R.H. Fuoad. 1989. A Review of Literature Relating to JIT. International Journal of Operations and Production Management, 9(3) 15-26.
Sorenson, O. 2003. Interdependence and Adaptability: Organizational Learning and the Long-Term Effect of Integration. Management Science, 49(4) 446-463.
Spear, S., H.K. Bowen. 1999. Decoding the DNA of the Toyota Production System. Harvard Bus Review, 77(5) 97-106.
Stewart, D.M., J.R. Grout. 2001. The Human Side of Mistake-Proofing. Production & Operations Mgmt, 10(4) 440-459.
Stratman, J.K., A.V. Roth, W.G. Gilland. 2004. The Deployment of Temporary Production Workers in Assembly Operations: A Case Study of the Hidden Costs of Learning and Forgetting. Journal of Operations Mgmt, 21 689-707.
Stuart, I., D. McCutcheon, R. Handfield, R. McLachlin, D. Sampson. 2002. Effective Case Research in Operations Management: A Process Perspective. Journal of Operations Management, 20 419-433.
Sugimori, Y., K. Kusunoki, F. Cho, S. Uchikawa. 1977. Toyota Production System and Kanban System Materialization of Just-In-Time and Respect-For-Human System. International Journal of Production Research, 15(6) 553-564.
Sutton, R.I., A.L. Callahan. 1987. The Stigma of Bankruptcy: Spoiled Organizational Image and Its Management. Academy of Management Journal, 30(3) 405-436.
Sweetman, B. 1998. F-22 Raptor. MBI, Osceola, WI.
Taguchi, G., Y. Wu. 1980. Introduction to Off-Line Quality Control. Central Japan Quality Association, Nagoya, Japan.
Tang, V., V. Salminen. 2001. Towards a Theory of Complicatedness: Framework for Complex Systems Analysis and Design. Proceedings of the 13th International Conference on Engineering Design (ICED), Glasgow, Scotland, Aug.
Upton, D.M., B. Kim. 1998. Alternative Methods of Learning and Process Improvement in Manufacturing. Journal of Operations Management, 16(1) 1-20.
van Hoek, R.I., A. Harrison, M. Christopher. 2001. Measuring Agile Capabilities in the Supply Chain. International Journal of Operations & Production Management, 21(1/2) 126-147.
Wallace, G., P. Sackett. 1996. Integrated Design for Low Production Volume, Large, Complex Products. Integrated Manufacturing Systems, 7(3) 5-16.
Waters-Fuller, N. 1995. Just-in-Time Purchasing and Supply: A Review of the Literature. International Journal of Operations and Production Management, 15(9) 220-236.
Weiss, S.I., E.M. Murman, D. Roos. 1996. The Air Force and Industry Think Lean. Aerospace America, 34(5) 32-38.
White, R.E., J.N. Pearson, J.R. Wilson. 1999. JIT Manufacturing: A Survey of Implementations in Small and Large U.S. Manufacturers. Management Science, 45(1) 1-15.
Whitney, D.E. 2004. Mechanical Assemblies. Oxford University Press, New York.
Wiersma, E. 2007. Conditions That Shape the Learning Curve: Factors That Increase the Ability and Opportunity to Learn. Management Science, 53(12) 1903-1915.
Womack, J.P., D.T. Jones. 1994. From Lean Production to the Lean Enterprise. Harvard Business Review, 72(2) 93-103.
Womack, J.P., D.T. Jones. 2003. Lean Thinking. Revised Edition, Free Press, New York.
Womack, J.P., D.T. Jones, D. Roos. 1990. The Machine That Changed the World. Rawson Associates, HarperCollins, NY.
Wright, T.P. 1936. Factors Affecting the Cost of Airplanes. Journal of the Aeronautical Sciences, 3(Feb.) 122-128.
Yin, R.K. 2003. Case Study Research: Design and Methods. 3rd Edition, Sage, Newbury Park, CA.
Zipkin, P.H. 1991. Does Manufacturing Need a JIT Revolution? Harvard Business Review, 69(1) 40-50.