recommending news articles in the clef news ...ferro/clef-wn-drafts/clef2017/paper...recommending...
TRANSCRIPT

Recommending News Articles in the CLEFNews Recommendation Evaluation Lab with the
Data Stream Management System Odysseus
Cornelius A. [email protected]
University of OldenburgDepartment of Computer Science
Escherweg 2, 26121 Oldenburg, Germany
Abstract. A crucial aspect of recommending news articles is the rele-vance of currentness of articles. Every day, news portals add plenty of newarticles. Typically, users are more interested in recently published articles(or articles that provide background information to recently publishedarticles) than in older ones. That leads to the demand to continuouslyadapt the set of recommendable items in a recommender system.In this paper, we share our experiences with the usage of the generic andopen source Data Stream Management System (DSMS) Odysseus as aRecommender System in the CLEF NewsREEL 2017. We continuouslycalculate the currently most read articles based on a stream of impressionevents. Our approach uses operators of a stream-based variant of therelational algebra that respects validity intervals of events. This allowsus to continuously calculate the K most popular articles (Top-K setregarding to the number of views) in a sliding time window based on wellestablished relational operations. The flexible composition of operatorsallows us to variate, e.g., the grouping of impressions to get differentrecommendation sets for different user groups or the exclusion of articlesthe user already knows.
Keywords: Recommender Systems, Data Stream Processing
1 Introduction
A recommender system as a component of modern information systems providesa user with a set of items (e.g., news articles, movies, or products) which mightbe of interest to him or her. The challenge is to select a small sample from a bigcollection of items that hopefully meets the taste of the user. A common approachis to learn from previous actions (e.g., page impressions of a web news portal) toestimate the usefulness of items. The K most useful items are presented to theuser as recommendations.
The CLEF News Recommendation Evaluation Lab [4] (NewsREEL) allowsresearchers to evaluate recommender systems with real user data in real-time.They provide a platform, called Open Recommendation Platform (ORP), that
sends the participants events (impressions and clicks on recommendations) ofreal commercial news portals. The participants have to analyze the data andmust answer requests for recommendations with a set of news articles within atimespan of 100 ms. The recommendations are displayed on the news portal nextto the article a user currently reads. For each participant, the organizers measurethe clicks on the recommendations and calculates the Click Through Rate (CTR).
In order to participate, a participant needs to implement a server that pro-cesses the events and replies to recommendation requests. The organizers providea framework1 that parses the events and lets one implement his/her own algo-rithms. However, using that framework means you need to take care of the datamanagement and processing of potentially unbounded data streams of events.
In this paper we present our solution that uses the general purpose Data StreamManagement System (DSMS) called Odysseus2 [1]. It adapts the concepts ofDatabase Management Systems (DBMS) to process data streams with continuousqueries.
2 Background
In this section we give a summary of the ORP platform, the CLEF NewsREEL,and the DSMS Odysseus.
2.1 ORP and CLEF NewsREEL
ORP as the technical platform for NewsREEL provides events of user activityof different news web portals in real-time. Participants are invited to use theseevents to calculate recommendations. The recommendations have to be returnedupon request within 100 ms. ORP selects a set of recommendations at randomout of all valid recommendation responses of all participants and displays therecommendations to the users next to the articles. As evaluation criteria, ORP usesclick through rate (CTR). It counts how many of the requested recommendationsget clicks by the users of the news portals. The fraction of clicks divided by thenumber of displayed recommendation sets is the CTR.
Participants have to subscribe the following data streams:1. Notifications about user events (e.g., a user reads a news article).2. Requests for recommendations, to which the participants have to respond to.3. Notifications about new or updated news articles.4. Error notifications (e.g., a participant response could not be parsed).
In our approach we use the first two streams: The user events stream providesimpressions for news articles in real-time. It comprises the news article ID,publisher ID, user/session ID, user geolocation code, and other information aboutthe impression. That is our source of data to calculate recommendation sets.1 https://github.com/plista/orp-sdk-java2 http://odysseus.uni-oldenburg.de/
The requests stream triggers the reply of an ordered set of article IDs—therecommendations. A request consists of similar attributes as the impressions:The article the user reads currently, the publisher of the article, the user, etc.
The events are pushed via HTTP POST request as JSON documents. Theresponse of a request for recommendations has to be the article IDs intendedto recommend to the user. For each participant ORP sends the data with anindividual data rate. Participants that are able to process more data in time get ahigher data rate. ORP determines the individual data rate by increasing it untilthe participant is not able to answer in time anymore. According to the organizers,each algorithm has to give at least 75 % of the amount of recommendations thebaseline approach gave in order to be considered. That should ensure that thealgorithms are able to handle the workload and allows the comparison of differentapproaches.
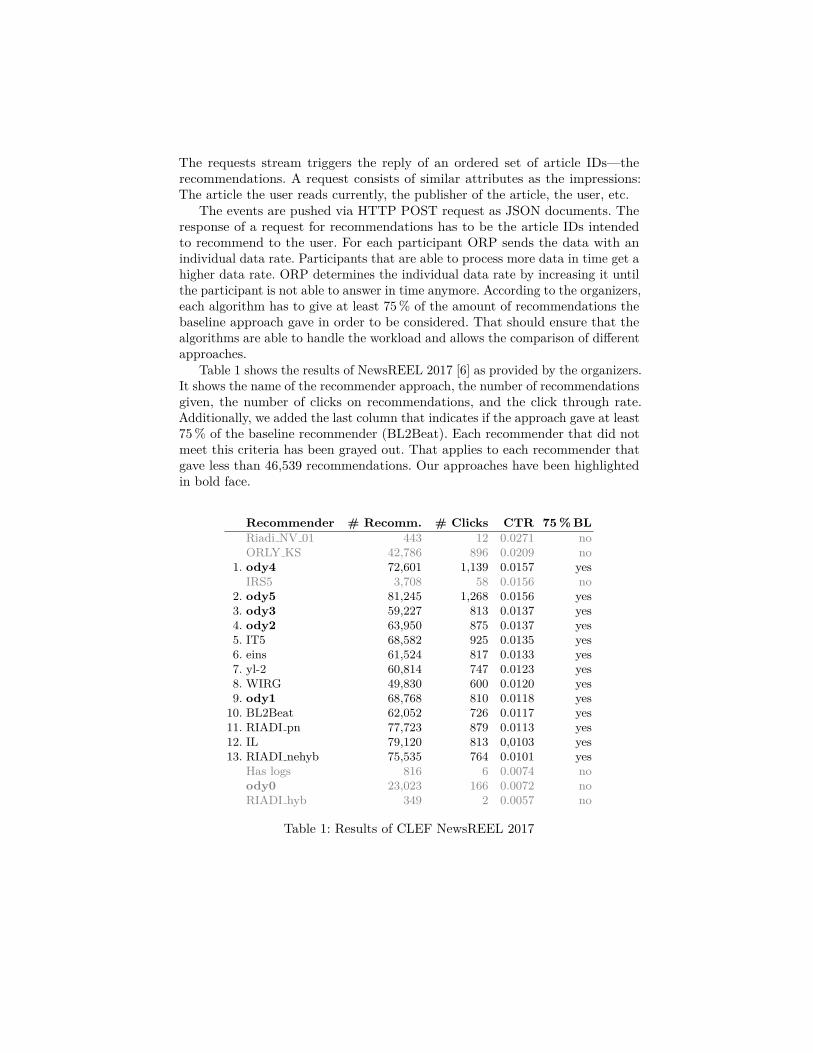
Table 1 shows the results of NewsREEL 2017 [6] as provided by the organizers.It shows the name of the recommender approach, the number of recommendationsgiven, the number of clicks on recommendations, and the click through rate.Additionally, we added the last column that indicates if the approach gave at least75 % of the baseline recommender (BL2Beat). Each recommender that did notmeet this criteria has been grayed out. That applies to each recommender thatgave less than 46,539 recommendations. Our approaches have been highlightedin bold face.
Recommender # Recomm. # Clicks CTR 75 % BLRiadi NV 01 443 12 0.0271 noORLY KS 42,786 896 0.0209 no
1. ody4 72,601 1,139 0.0157 yesIRS5 3,708 58 0.0156 no
2. ody5 81,245 1,268 0.0156 yes3. ody3 59,227 813 0.0137 yes4. ody2 63,950 875 0.0137 yes5. IT5 68,582 925 0.0135 yes6. eins 61,524 817 0.0133 yes7. yl-2 60,814 747 0.0123 yes8. WIRG 49,830 600 0.0120 yes9. ody1 68,768 810 0.0118 yes
10. BL2Beat 62,052 726 0.0117 yes11. RIADI pn 77,723 879 0.0113 yes12. IL 79,120 813 0,0103 yes13. RIADI nehyb 75,535 764 0.0101 yes
Has logs 816 6 0.0074 noody0 23,023 166 0.0072 noRIADI hyb 349 2 0.0057 no
Table 1: Results of CLEF NewsREEL 2017

102 103 104 105 106 107 108 109 110 111 112Application Time t
Time ofObservationw = 5
. . . E58 E59 E60E61 E62 E63 E64 E65 . . .
WindowOut-dated Elements Prospective Elements
E58E59 E60
E61E62
E63E64
E65Valid
ityIn
terv
als
Overlapping Intervals at t = 109
Fig. 1: Snapshot Reducibility
2.2 DSMS—The Odysseus System
The concept of a DSMS bases on the relation algebra of Database ManagementSystems (DBMS). Instead of managing a static database of relations, a DSMSmanages volatile data that is pushed to the system by active sources. That resultsin a potentially unbounded sequence of elements—the data stream. Similar toa DBMS, a user of a DSMS writes a query by the use of a query language andthe system builds a Query Execution Plan (QEP), which consists of reusableoperators. Each operator is responsible for a certain operation. Examples ofcommon operators are selection (filtering of elements), projection (filteringof attributes of elements), join (combining of elements of two data streams), andaggregation (combining a set of elements to a single resulting value).
A relational DSMS extends the concept of a relational DBMS by time-awareand incremental data processing. The underlying concept has been extensivelystudied, e.g. in [3, 2, 5, 1].
We treat events as tuples with a fixed schema. Each event occurs at a certainpoint in time t ∈ T with T as set of discrete and ordered time instances, e.g., theUNIX timestamp or an arbitrary application/event time (cf. [5]).
The most important differences to a DBMS are that a DSMS holds its data inmemory and supports (sliding time) windows.3 That allows to define a finite setof valid tuples for each point in time t ∈ T , e.g., to calculate a moving average ofall elements not older than 60 seconds. The term snapshot reducibility [5] claimsthat the resulting tuples of a query of a stream processing system at a specific
3 In this paper we limit ourselves to sliding time windows. However, there are also othertypes of windows, e.g., element windows, tumbling windows etc. that are supportedby our DSMS.
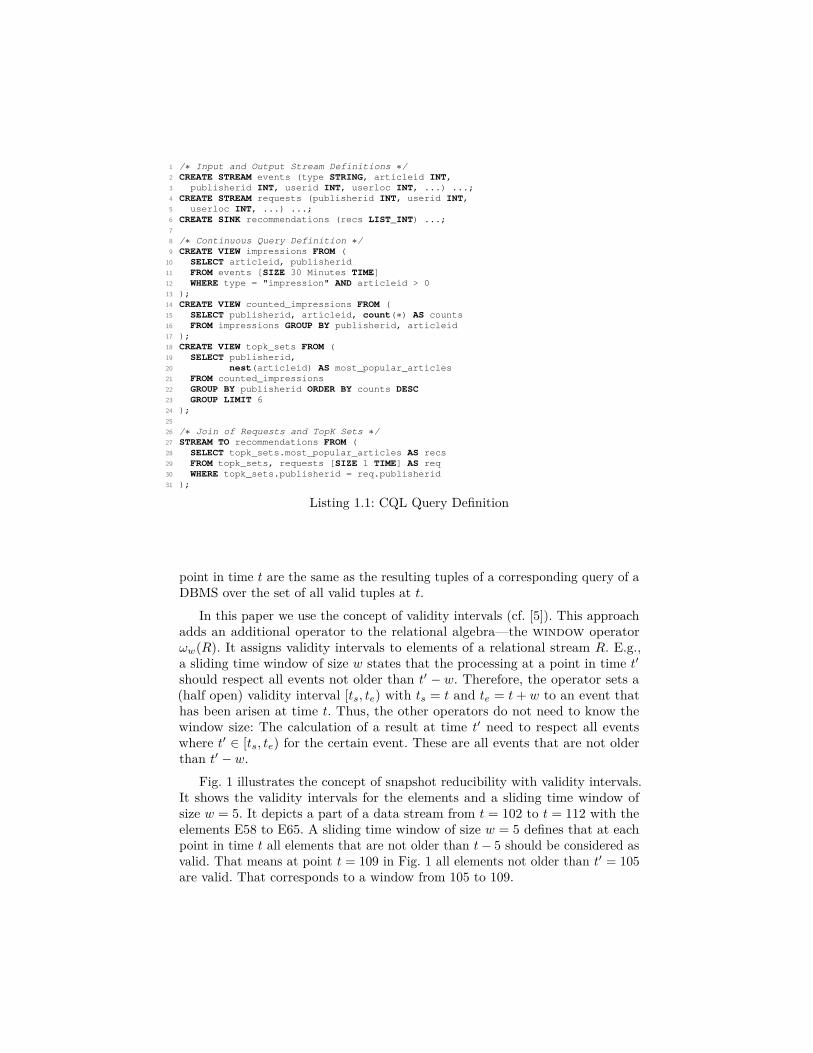
1 /∗ Input and Output Stream Definitions ∗/2 CREATE STREAM events (type STRING, articleid INT,3 publisherid INT, userid INT, userloc INT, ...) ...;4 CREATE STREAM requests (publisherid INT, userid INT,5 userloc INT, ...) ...;6 CREATE SINK recommendations (recs LIST_INT) ...;78 /∗ Continuous Query Definition ∗/9 CREATE VIEW impressions FROM (
10 SELECT articleid, publisherid11 FROM events [SIZE 30 Minutes TIME]12 WHERE type = "impression" AND articleid > 013 );14 CREATE VIEW counted_impressions FROM (15 SELECT publisherid, articleid, count(∗) AS counts16 FROM impressions GROUP BY publisherid, articleid17 );18 CREATE VIEW topk_sets FROM (19 SELECT publisherid,20 nest(articleid) AS most_popular_articles21 FROM counted_impressions22 GROUP BY publisherid ORDER BY counts DESC23 GROUP LIMIT 624 );2526 /∗ Join of Requests and TopK Sets ∗/27 STREAM TO recommendations FROM (28 SELECT topk_sets.most_popular_articles AS recs29 FROM topk_sets, requests [SIZE 1 TIME] AS req30 WHERE topk_sets.publisherid = req.publisherid31 );
Listing 1.1: CQL Query Definition
point in time t are the same as the resulting tuples of a corresponding query of aDBMS over the set of all valid tuples at t.
In this paper we use the concept of validity intervals (cf. [5]). This approachadds an additional operator to the relational algebra—the window operatorωw(R). It assigns validity intervals to elements of a relational stream R. E.g.,a sliding time window of size w states that the processing at a point in time t′should respect all events not older than t′ − w. Therefore, the operator sets a(half open) validity interval [ts, te) with ts = t and te = t+ w to an event thathas been arisen at time t. Thus, the other operators do not need to know thewindow size: The calculation of a result at time t′ need to respect all eventswhere t′ ∈ [ts, te) for the certain event. These are all events that are not olderthan t′ − w.
Fig. 1 illustrates the concept of snapshot reducibility with validity intervals.It shows the validity intervals for the elements and a sliding time window ofsize w = 5. It depicts a part of a data stream from t = 102 to t = 112 with theelements E58 to E65. A sliding time window of size w = 5 defines that at eachpoint in time t all elements that are not older than t− 5 should be considered asvalid. That means at point t = 109 in Fig. 1 all elements not older than t′ = 105are valid. That corresponds to a window from 105 to 109.

To process the events of a data stream, the user writes one or more queries.In contrast to queries of a DBMS, a query will be executed until the user stopsit explicitly. Such a query is called a continuous query since it processes the datacontinuously. To write a query, the users take advantage of a query language,as the SQL-like stream-based query language CQL [2] or the functional querylanguage PQL [1].
Similar to a DBMS, the stream processing system translates the query to aQuery Execution Plan (QEP; in the streaming context also called data flow graph).A QEP is a directed graph of operators. It determines the order of processingand can be optimized, e.g., by changing the order of operators.
In addition to the actual stream processing, a DSMS is also responsible forresource and user management, authentication, authorization, accounting, etc.
3 General Approach
To illustrate how to use a DBMS as a RecSys in the CLEF NewsREEL challenge,we present an approach that recommends the most popular articles of the last 30minutes as basis query for further improvements. Listing 1.1 shows the definitionof the query in CQL. This is very similar to SQL and consists of a data definition(DDL) and a data manipulation (DML) part.
The first part is the definition of the input streams (Lines 2-5) and the outputstream (called sink, Line 6). This is similar to a CREATE TABLE statement ofa DBMS. It consists of the name of the stream (e.g., events) and a schemadefinition (truncated in Listing 1.1). The stream or sink definition includes alsoinformation about the data connection (e.g., HTTP, TCP) and data format (e.g.,CSV, JSON). This is omitted in Listing 1.1 because this is out of the scope ofthis paper. After parsing the incoming data each event results in a tuple with afixed schema.
The second part is the definition of the actual queries. It consists of threeparts: the pre-processing of the events (lines 9-13), the counting of the numberof impressions for each article (lines 14-17) and the aggregation of the six mostpopular articles for each publisher (lines 18-24). Each of this is expressed as a viewdefinition, which allows to reference the results in the subsequent queries. Theimpressions view selects the article ID and publisher ID of all events of type“impression” that have an article ID. Additionally, it defines a sliding time windowof a fixed size (e.g., 30 minutes). The result is used in the counted_impressionsview. It counts the number of impressions (in the time window) of each uniquepair of publisher and article ID. When a new impression arrives or an eventgets invalid, the count changes and a new tuple is produced that updates theprevious value. The topk_sets view aggregates the counted impressions to a listof articles IDs of the six most popular articles for each publisher.
The third part uses the list of most popular articles to answer the recom-mendation requests (lines 27-31). For this, we join a request event with an eventof the topk_sets view for the events where publisher ID of request and recom-mendation set are the same. The stream-based join operator solely joins events
that are valid at the same time (which means they have overlapping validityintervals). Because the aggregation of the topk_sets view updates the mostpopular articles set when they change, all resulting tuples of the same publisherhave non-overlapping validity intervals: For each point in time there is exactly onevalid aggregation result for the same group. By defining a sliding time windowof size 1 (validity of 1 time slice) over the stream of requests, the join assignsexactly one set of article IDs to each request event.
Reco
mm
end.
π./
γγπσωImpr.
ωReq.
1
2
3 4 5 6
7 8
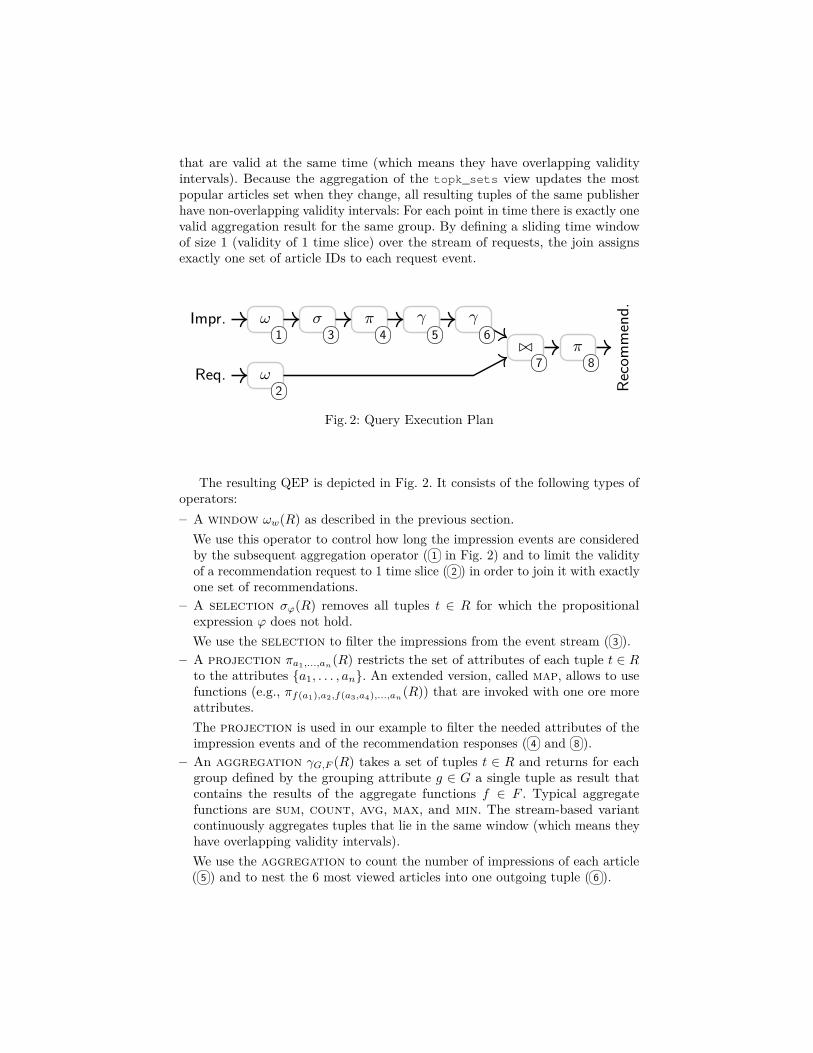
Fig. 2: Query Execution Plan
The resulting QEP is depicted in Fig. 2. It consists of the following types ofoperators:– A window ωw(R) as described in the previous section.
We use this operator to control how long the impression events are consideredby the subsequent aggregation operator ( 1 in Fig. 2) and to limit the validityof a recommendation request to 1 time slice ( 2 ) in order to join it with exactlyone set of recommendations.
– A selection σϕ(R) removes all tuples t ∈ R for which the propositionalexpression ϕ does not hold.We use the selection to filter the impressions from the event stream ( 3 ).
– A projection πa1,...,an(R) restricts the set of attributes of each tuple t ∈ R
to the attributes {a1, . . . , an}. An extended version, called map, allows to usefunctions (e.g., πf(a1),a2,f(a3,a4),...,an
(R)) that are invoked with one ore moreattributes.The projection is used in our example to filter the needed attributes of theimpression events and of the recommendation responses ( 4 and 8 ).
– An aggregation γG,F (R) takes a set of tuples t ∈ R and returns for eachgroup defined by the grouping attribute g ∈ G a single tuple as result thatcontains the results of the aggregate functions f ∈ F . Typical aggregatefunctions are sum, count, avg, max, and min. The stream-based variantcontinuously aggregates tuples that lie in the same window (which means theyhave overlapping validity intervals).We use the aggregation to count the number of impressions of each article( 5 ) and to nest the 6 most viewed articles into one outgoing tuple ( 6 ).

1 State[] state % the current state for each group2 Event[] events % events in the current window34 for each incoming Event e:5 for each Event r in events with r.endts ≤ e.startts:6 state[group(r)]← remove(state[group(r)], r)7 events← events − r8 output: eval(state[group(r)])9 end for
10 state[group(e)]← add(state[group(e)], e)11 output: eval(state[group(e)])12 events← events + e13 end for
Listing 1.2: Algorithm of the aggregation operator.
– A join R ./θ S combines the tuples of R and S for which a condition θ holds.The stream-based variant claims also that the tuples have overlapping timeintervals. The validity interval of a resulting tuple is the intersection of thevalidity intervals of the input tuples.The join ( 7 ) is responsible for the matching of the requests to the recommen-dation sets.The important parts of the query are the calculating of a ranking score
(aggregation 5 ), the building of the recommendation sets (aggregation 6 ),and the matching of requests and recommendation sets (join 7 ). These operatorsare heavily influenced by validity intervals of the events, that are assigned by thewindow operator.
The calculation of the recommendation sets is implemented by two aggrega-tion operators: One to calculate the popularity of an article and one to combinethe most popular articles to a recommendation set. Our aggregation operatoris data driven. That means it outputs an updated result for every incoming event.The operator internally holds a state s for each group and updates this state usingan aggregation function add(s, e) 7→ s for each incoming event e. For the countfunction in Listing 1.1 the aggregation function is defined as: add(s, e) = s+ 1.
Since the aggregation is defined over a sliding time window the operatorhas to remove all values that do not lie in the window anymore. For that, allevents whose end timestamp of their validity intervals are lower or equal thanthe start timestamp of the incoming event have to be removed. This is donebefore adding a new event by using a function remove(s, e) 7→ s, e.g., for count:remove(s, e) = s− 1.
After each change of the state the operator outputs a result by calling thefunction eval(s) 7→ e, which calculates the resulting event based on the state. Forcount, it just outputs the state value s. Other functions as for example avgneed to calculate the resulting value. Consider a state for avg that consists of acount and a sum, the eval function is eval(s) = s.sum
s.count . Listing 1.2 illustrates thealgorithm of the aggregation operator.
The second aggregation operator uses the nest function with add(s, e) =s. insertSorted(e) (sorted by count), remove(s, e) = s. remove(e), and eval(s) =

s. sublist(0, 6). The output is an ordered set of the article IDs of the 6 events onthe top.
Since the recommendation sets are calculated incrementally and continuously,the calculation of the response to a request is the executing of the join operator.This leads to very short latencies. The join holds for each group (here the publisherID) the latest known recommendation set in a hash map. The operator appendsthe matching recommendation sets to each request and gives the result to thesink that transfers it back to the inquirer.
4 Variations
During the CLEF NewsREEL 2017, we evaluated six different approaches thatare based on the general approach presented in the previous section. Table 2shows an overview over our approaches and their resulting CTRs.
The approach ody0 uses the aggregation function nest over a sliding timewindow of 60 min. to aggregate a set of unique item IDs that have been read inthe past 60 min. After that, a map function is used to randomly draw 6 items torecommend them. This approach acts as our internal baseline.
All other approaches follow the same pattern. Given a data stream of articleIDs and optional further attributes:1. Define a sliding time window of size w over the data stream. (In our DSMS,
this is done by annotating validity intervals.)2. Partition the data by the article IDs and optional other attributes p1, p2, . . . , pn.3. Apply an aggregation function over each partition that calculates a score for
each item in each partition (over the sliding time window). (In our approachwe used the count function. In case of explicit item rating, the average functionwould be an alternative.)
4. Optional: Combine the results of different approaches to prevent underfullrecommendation sets.This results in a incrementally and data-driven calculated stream of recom-
mendation sets for each partition.The approaches ody1 and ody2 partition the data by publisher IDs as described
in the previous section. They differ solely in the window size. ody1 considers allimpressions of the past 30 min., ody2 of the past 5 min. The evaluation shows,that the 5 min. window leads to a higher CTR than the 30 min. window.
ody3 uses the same window size as ody2 but adds as partition attribute theuser location. Because more partitions lead to less data in each partition, ourtests show that a larger window size than 5 min. is necessary to have enoughdata in each partition and each window. This approach reaches a similar CTRthan ody2.
In contrast, ody4 and ody5 calculate the recommendations by aggregatingthe previously successfully given recommendations of the past 12 hours. Thisinformation is part of the user events stream. For each news article i we cal-culated the set of news articles that have been successfully recommended to

visitors of item i the most. Additionally, ody5 fills the recommendation set upwith recommendations of ody1 in case that there are less than six successfullyrecommended items in the past 12 hours.
Approach CTR
ody0: Random sample of 60 min. sliding time window. 0.0072
ody1: Most viewed articles of 30 min. sliding time window partitionedby publisher.
0.0118
ody2: Most viewed articles of 5 min. sliding time window partitioned bypublisher.
0.0137
ody3: Most viewed articles of 30 min. sliding time window partitionedby publisher and user location.
0.0137
ody4: Most clicked recommendations of 12 hour sliding time windowpartitioned by item.
0.0157
ody5: Most clicked recommendations of 12 hour sliding time windowpartitioned by item filled up with most viewed articles of 30 min.sliding time window partitioned by publisher.
0.0156
Table 2: Overview over our approaches in the CLEF NewsREEL 2017
5 Evaluation of the Window Size
A crucial parameter is the window size of the impression events. Since we wantto count the current views of each article we have to figure out which time spanleads to a set of impression events that represent the current popularity of articles:Is the size too large the system is not sensitive to popularity changes (conceptdrifts). Is it too small there is not enough data to distinguish the popularity ofarticles.
To determine an appropriate window size we conducted an experiment. Weran 21 queries as shown in Listing 1.1 with different window sizes in parallel overthe same stream (1 to 10 min, 20 min, 30 min, 40 min, 50 min, 60 min, 90 min,2 hrs, 3 hrs, 6 hrs, 12 hrs, 24 hrs). Similar to the Interleaved Test-Then-Train(ITTT) evaluation method we calculated the reciprocal rank of each article of animpression event before it has influenced the recommendation set. That gave usa mean reciprocal rank (MRR) for each query resp. window size. A higher MRRmeans there are frequently viewed articles more often near the top. Additionally,we calculated how often an article is part of the top 6 of the most popular itemsin the different time windows (Precision@6).
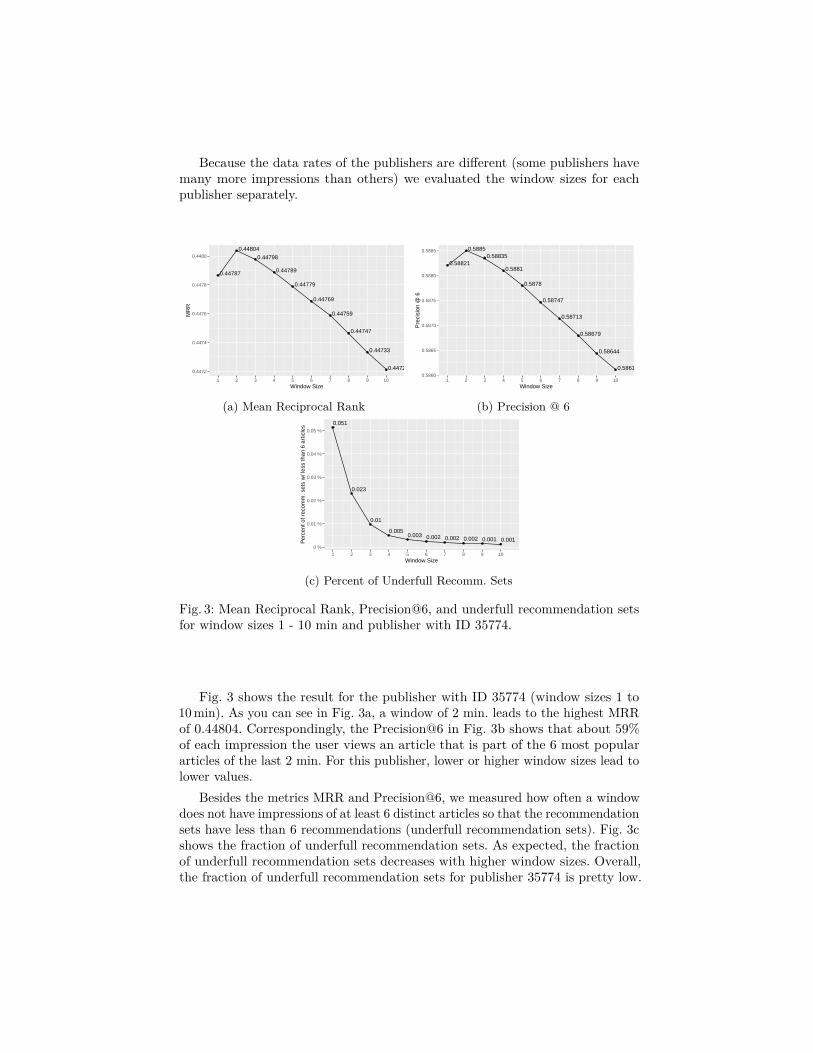
Because the data rates of the publishers are different (some publishers havemany more impressions than others) we evaluated the window sizes for eachpublisher separately.
0.44787
0.44804
0.44798
0.44789
0.44779
0.44769
0.44759
0.44747
0.44733
0.447210.4472
0.4474
0.4476
0.4478
0.4480
1 2 3 4 5 6 7 8 9 10Window Size
MR
R
(a) Mean Reciprocal Rank
0.58821
0.58850.58835
0.5881
0.5878
0.58747
0.58713
0.58679
0.58644
0.586110.5860
0.5865
0.5870
0.5875
0.5880
0.5885
1 2 3 4 5 6 7 8 9 10Window Size
Pre
cisi
on @
6
(b) Precision @ 60.051
0.023
0.01
0.0050.003 0.002 0.002 0.002 0.001 0.001
0 %
0.01 %
0.02 %
0.03 %
0.04 %
0.05 %
1 2 3 4 5 6 7 8 9 10Window Size
Per
cent
of r
ecom
m. s
ets
w/ l
ess
than
6 a
rtic
les
(c) Percent of Underfull Recomm. Sets
Fig. 3: Mean Reciprocal Rank, Precision@6, and underfull recommendation setsfor window sizes 1 - 10 min and publisher with ID 35774.
Fig. 3 shows the result for the publisher with ID 35774 (window sizes 1 to10 min). As you can see in Fig. 3a, a window of 2 min. leads to the highest MRRof 0.44804. Correspondingly, the Precision@6 in Fig. 3b shows that about 59%of each impression the user views an article that is part of the 6 most populararticles of the last 2 min. For this publisher, lower or higher window sizes lead tolower values.
Besides the metrics MRR and Precision@6, we measured how often a windowdoes not have impressions of at least 6 distinct articles so that the recommendationsets have less than 6 recommendations (underfull recommendation sets). Fig. 3cshows the fraction of underfull recommendation sets. As expected, the fractionof underfull recommendation sets decreases with higher window sizes. Overall,the fraction of underfull recommendation sets for publisher 35774 is pretty low.

Even a window size of 2 min. has just 0.023% recommendation sets with lessthan 6 recommendations.
The results of the other publisher follow this pattern, even though publisherwith lower data rates get better results with bigger window sizes. As a tradeoffbetween different publishers we made good experiences with a window size offive minutes.
6 Conclusions
In this paper we presented an approach for the CLEF NewsREEL 2017. Weimplemented a RecSys by using a generic Data Stream Management System.By analyzing impression events of users we calculated a set of recommendationsbased on the popularity in a given time window. To find an appropriate timewindow we evaluated different sizes in parallel.
References
1. Appelrath, H.J., Geesen, D., Grawunder, M., Michelsen, T., Nicklas, D.: Odysseus:A highly customizable framework for creating efficient event stream managementsystems. In: DEBS’12. pp. 367–368. ACM (2012)
2. Arasu, A., Babu, S., Widom, J.: The CQL continuous query language: semanticfoundations and query execution. VLDB Journal 15(2), 121–142 (2006)
3. Babcock, B., Babu, S., Datar, M., Motwani, R., Widom, J.: Models and issues indata stream systems. In: PODS 2002. pp. 1–16. ACM (2002)
4. Hopfgartner, F., Brodt, T., Seiler, J., Kille, B., Lommatzsch, A., Larson, M., Turrin,R., Sereny, A.: Benchmarking news recommendations: The clef newsreel use case. In:ACM SIGIR Forum. vol. 49, pp. 129–136. ACM (2016)
5. Kramer, J., Seeger, B.: Semantics and implementation of continuous sliding windowqueries over data streams. ACM TODS’09 34(1), 4 (2009)
6. Lommatzsch, A., Kille, B., Hopfgartner, F., Larson, M., Brodt, T., Seiler, J., Ozgobek,O.: Clef 2017 newsreel overview: A stream-based recommender task for evaluationand education. In: CLEF 2017. Springer Verlag (2017)