recommended walking speeds for pedestrian clearance timing
TRANSCRIPT

Paper No. 06-1826
Recommended Walking Speeds for Pedestrian Clearance Timing Based on Pedestrian Characteristics By Tim J. Gates, David A. Noyce, Andrea R. Bill, and Nathanael Van Ee Tim J. Gates, P.E. (Corresponding Author) Graduate Research Fellow University of Wisconsin-Madison Department of Civil and Environmental Engineering B243 Engineering Hall 1415 Engineering Drive Madison, WI 53706 [email protected] Phone: (608)-265-8583 David A. Noyce, Ph.D., P.E. Assistant Professor University of Wisconsin-Madison Department of Civil and Environmental Engineering 1210 Engineering Hall 1415 Engineering Drive Madison, WI 53706 [email protected] Phone: (608)-265-1882 Andrea R. Bill Graduate Research Fellow University of Wisconsin-Madison Department of Civil and Environmental Engineering B243 Engineering Hall 1415 Engineering Drive Madison, WI 53706 [email protected] Phone: (608)-265-8583 Nathanael Van Ee (affiliation at time of study) Undergraduate Research Assistant University of Wisconsin-Madison Department of Civil and Environmental Engineering B243 Engineering Hall 1415 Engineering Drive Madison, WI 53706 [email protected] Phone: (608)-265-8583 Resubmitted to TRB for CD-ROM November 10, 2005
TRB 2006 Annual Meeting CD-ROM Paper revised from original submittal.

Tim J. Gates, David A. Noyce, Andrea R. Bill, Nathanael Van Ee
ABSTRACT Data from 1,947 pedestrian crossing events measured at eleven intersections in Madison and Milwaukee, Wisconsin were analyzed to determine the effect of subject age and disability, intersection traffic control condition, group size, and sex on walking speed. A multi-factor analysis of variance showed that pedestrian walking speed was dependent upon age and disability, traffic control condition, and group size. Pedestrians over the age of 65 (n = 326) were the slowest among all age groups with a mean and 15th percentile walking speed of 3.81 and 3.02 ft/s, respectively. Children hand-assisted by adults and physically disabled persons showed crossing speeds similar to those of persons over the age of 65. Furthermore, groups of two or more pedestrians crossed 0.4 to 0.6 ft/s slower than individual crossers. Thus, the commonly used 4.0 ft/s walking speed was found to not provide ample clearance time for the majority of pedestrians over the age of 65, children assisted by adults, physically disabled persons, and large groups of pedestrians. Based on the data reported here, a 3.8 ft/s walking speed is recommended for timing pedestrian clearance intervals (i.e., Flashing Don’t Walk indication) at locations with normal pedestrian demographics (i.e., downtown areas, shopping areas, most neighborhoods, schools areas) or locations where the age or physical disability status of the pedestrian population is unknown. When the proportion of pedestrians over the age of 65 exceeds 20, 30, 40, and 50 percent of the total pedestrians at a location, walking speeds of 3.6, 3.5, 3.4, and 3.3 ft/s, respectively, are recommended for pedestrian clearance timings. A 2.9 ft/s walking speed is recommended for intersections where nearly all of the pedestrians are over age 65. A 4.0 ft/s walking speed is appropriate only for locations with very few older pedestrians, assisted children, or disabled persons, such as college campuses.
Key words: pedestrian, walking speed, signalized intersection, clearance interval, human factors
TRB 2006 Annual Meeting CD-ROM Paper revised from original submittal.

Tim J. Gates, David A. Noyce, Andrea R. Bill, Nathanael Van Ee
1
INTRODUCTION Pedestrian walking speeds have become the subject of recent debate as the U.S. population continues to grow older and increasingly more mobile later in life. Past research of pedestrian walking speeds has provided the basis for guidelines that aid in the safe and efficient design of signal timings for pedestrian crossings, but some of these guidelines may now be outdated. Traffic signals are typically timed to accommodate pedestrians based on an assumed walking speed of 4.0 ft/s (1,2,3,4). But research has shown that this assumption may not be suitable for all pedestrians, including older and disabled persons, children, and large groups (5,6,7). Thus, research is needed to determine appropriate walking speeds for signal timing based on pedestrian characteristics. The objective of the research described herein was to determine the walking speeds of pedestrians based on a variety of characteristics, including: subject age and disability, sex, group size, and intersection traffic control condition and to make appropriate recommendations based on the findings for use in the design of pedestrian clearance intervals.
LITERATURE REVIEW Pedestrian traffic signals are often used to enhance the safety and flow of pedestrians at signalized intersection crossings. Typical pedestrian signal phasing includes time for pedestrians to depart from the curb (displayed by the WALK indication), followed by suitable pedestrian clearance time (displayed by the FLASHING DON’T WALK [FDW] indication), followed by time when it is unsafe to be in the roadway (displayed by the steady DON’T WALK [DW] indication). The WALK indication is typically at least seven seconds in length, although WALK indications as low as four seconds are allowed (3).
The most critical, yet challenging aspect of designing pedestrian signal timing involves providing ample time for pedestrians to clear the intersection. The most important variable for determining necessary pedestrian clearance time is walking speed, which is know to vary widely based on the characteristics of the pedestrian, intersection, and environment. The Manual on Uniform Traffic Control Devices (MUTCD) suggests that the pedestrian clearance time should allow enough time for a pedestrian who has left the curb during the WALK signal indication to travel at a walking speed of 4.0 ft/s, to at least the far side of the traveled way or to a median of sufficient width for pedestrians to wait (3). However, there seems to be ambiguity as to what portion of the population the 4.0 ft/s walking speed actually represents. For example, depending on the source, a walking speed of 4.0 ft/s may be assumed as the “normal” walking speed (3), the 15th percentile walking speed (4), or the “recommended” walking speed at locations where less than 20 percent of the pedestrian population is over the age of 65 (2).
It is widely recognized that pedestrian walking speed is greatly influenced by age and disability, with the slowest walking speeds typically observed in older adults, children younger than age five, and disabled persons (1). Research has shown that many of these persons would not be accommodated by pedestrian clearance intervals based on 4.0 ft/s (5,6,7). To provide ample pedestrian clearance time in these cases, the MUTCD states that traffic signals at crossings regularly used by pedestrians walking slower than 4.0 ft/s should be timed to accommodate the slower walkers, although no values are recommended (3). However, using slower walking speeds may have a negative impact on vehicular delay and corridor progression due to the longer pedestrian clearance times needed to safely cross (8).
The Traffic Control Devices Handbook (TCDH) suggests that if slower walking speeds occur frequently, pedestrian clearance times should accommodate pedestrians walking at 3.5
TRB 2006 Annual Meeting CD-ROM Paper revised from original submittal.

Tim J. Gates, David A. Noyce, Andrea R. Bill, Nathanael Van Ee
2
ft/sec (9). The Traffic Engineering Handbook (TEH) published by the Institute of Transportation Engineers suggests that signals at crossings with a high number of older or disabled pedestrians should be designed for slower pedestrian walking speeds (1). Similarly, the Highway Capacity Manual (HCM) states that if more than 20 percent of pedestrians using a crosswalk on a regular basis are over the age of 65, a walking speed of 3.3 ft/s is recommended (2). The HCM goes on to say that this walking speed should be further reduced by 0.3 ft/s for each additional ten percent of older pedestrians.
In June 2002, the United States Access Board released draft accessibility guidelines requiring pedestrian signal phase timing to be calculated according to a walking speed of 3.0 ft/s in order to accommodate a broader range of pedestrians and offer greater access (10). In response to these draft guidelines and other recommendations by LaPlante and Kaeser (8), the National Committee on Uniform Traffic Control Devices (NCUTCD) recently discussed recommendations to lower the MUTCD normal walking speed from 4.0 ft/s to 3.5 ft/s for curb-to-curb pedestrian clearance (8). Further discussion was also made on how to better accommodate the additional crossing distance for pedestrians waiting at the top of the sidewalk ramp or at the pedestrian pushbutton. In these cases, LaPlante and Kaeser suggest extending the WALK interval based on the additional time needed to complete the total crossing distance (i.e., from top of ramp to far curb) using a 3.0 ft/s walking speed. Please note that to date, the NCUTCD has not formally adopted or recommended these or any other changes to the 4.0 ft/s walking speed.
Although the MUTCD, TCDH, TEH, and HCM all make reference to the effect of age on walking speed, other factors influence walking speeds as well. For example, a study performed by Knoblauch, et al. (5) determined that site-related and environmental factors such as pedestrians walking in groups or walking in inclement weather tended to make pedestrians walk slower. To account for slower walking speeds for groups of pedestrians, the HCM and TCDH provide consideration for large pedestrian volumes crossing at once. The TCDH suggests longer pedestrian clearance times (9) while the HCM incorporates group size explicitly into the signal timing equations (2).
METHODOLOGY
Site Characteristics Pedestrian crossing data were collected at ten intersections in Madison, Wisconsin (population 208,000) and one intersection in Milwaukee, Wisconsin (population 597,000) during the summers of 2004 and 2005. The sites included: eight signal-controlled intersections with pedestrian signals (including two mid-block crossings) and three unsignalized intersections (including one four-way stop controlled intersection, one two-way stop controlled intersection, and one uncontrolled mid-block crossing). All crosswalks had existing pavement markings that were in compliance with MUTCD guidelines (3). Five of the intersections were on or near the campus of the University of Wisconsin-Madison, three intersections were near shopping and residential areas on the near-west side of Madison, two intersections were in the downtown shopping area of Madison, and one intersection was near Marquette University in central Milwaukee. Figure 1 shows an example of a signalized crossing used in this study. Table 1 summarizes the site characteristics for the eleven intersections.
TRB 2006 Annual Meeting CD-ROM Paper revised from original submittal.

Tim J. Gates, David A. Noyce, Andrea R. Bill, Nathanael Van Ee
3
FIGURE 1 Signalized crosswalk at Park St. crossing University Ave. in Madison, WI. TABLE 1 Site Characteristics Traffic Control Intersection and Location
Intersection Type
General Land Use Lanes
Segoe Rd./Sawyer St. (West Madison) 3-leg Residential 4 (median), 2
Randall Ave./Dayton St. (UW-Madison Campus) 3-leg Campus 4, 3
University Ave./Park St. (UW-Madison Campus) 4-leg Campus 5, 4
Gorham St./State St. (Downtown Madison) 4-leg Downtown 4, 2
Wisconsin Ave./16th St. (Central Milwaukee) 4-leg Campus 5, 2
Johnson St./State St. (Downtown Madison) 5-leg Downtown 4, 2
University Ave./Babcock Dr. (UW-Madison Campus) Mid-block Campus 7 (median)
Signalized
Johnson St./University Square (UW-Madison Campus) Mid-block Campus 4
Randall Ave./Johnson St. (UW-Madison Campus) 2-way stop Campus 4 (median), 2
Hilldale Mall Dr./Sentry (West Madison) 4-way stop Shopping 2, 2 Unsignal-ized
Hill Farms Dr./DMV Office (West Madison) Uncontrolled State Office 2
Data Collection Pedestrian crossing data were measured in the field either by an inconspicuously placed human or a video camera. In either case, a stopwatch was used to measure pedestrian crossing times, which were recorded on a data collection form. The video camera provided the advantage of allowing for every crossing event to be measured. The on-site human data collectors attempted to measure every pedestrian, but this was often not possible during busy periods.
TRB 2006 Annual Meeting CD-ROM Paper revised from original submittal.

Tim J. Gates, David A. Noyce, Andrea R. Bill, Nathanael Van Ee
4
The crosswalk lengths were measured from the center of the crosswalk (laterally) at the joint between the pavement and curb/gutter to the same location on the other side of the street. In each case, the start and end measurement points were clearly visible to the data collector or video camera. Locating the reference lines at the street edge allowed for capturing both the acceleration period and steady state velocities of pedestrians waiting at the curb. Walking speeds, reported in feet per second (ft/s), were determined by dividing the distance between reference lines by the pedestrian crossing time.
At 10 of the 11 sites, data were collected during sunny weather. The remaining site was observed while it was lightly raining, although the rain appeared to have little effect on pedestrian walking speeds when compared to the other sites.
Pedestrian Characteristics Crossing times for individual and groups of pedestrians were observed at each of the intersections. The data collectors also recorded the following characteristics for each pedestrian crossing: sex, age group, group size, and pedestrian signal indication (signalized intersections only).
Age
Determining a subjects’ age presented a challenge because of subjectiveness of the observation. To counter the uncertainty of determining age, subjects were placed into four categories: child hand-assisted by an adult, unassisted child to 29 years old, 30 to 64 years old, and 65 years or older. Please note that all references to “older” pedestrians made in this paper refer to those aged 65 years and older. For groups of pedestrians of varying ages, the age and time recorded was that for the person who appeared to be the slowest in the group, typically a hand-assisted child or older person. As expected, a majority of the pedestrians observed near campus areas were under the age of 30. Most of the other locations provided a mix of ages.
Disability
Physically disabled pedestrians were recorded and the type of disability was noted. For purposes of this study, persons with physical disabilities included: wheelchair users, visually impaired persons, persons on crutches, etc. Most of the disabled persons observed in this study were motorized wheelchair users. Please note that older persons using canes were not classified as disabled. Also note that for purposes of the analysis, “disability” was included in the age group factor.
Group Size
Group size was recorded and was used to classify crossing events into one of three categories: individual, groups of two to four people, and groups of five or more. Unlike Knoblauch who defined a group as “two or more pedestrians crossing the roadway at about the same time, regardless of whether or not they were apparently friends or associates,” (5) a group was defined in this analysis as two or more pedestrians crossing the street at the same time who appeared to be friends or associates. This definition was adopted because initial observations showed that groups of unassociated people tended to break apart into smaller groups soon after stepping off the curb. The only deviation from this definition was in the case of large groups (i.e., greater than 10 persons) when it was sometimes impossible to determine whether or not the entire group was associated with each other. These cases were recorded as long the entire group stayed
TRB 2006 Annual Meeting CD-ROM Paper revised from original submittal.

Tim J. Gates, David A. Noyce, Andrea R. Bill, Nathanael Van Ee
5
tightly clustered and crossed at roughly the same pace. Please note that hand-assisted children were counted as groups rather than individuals. Sex was not recorded for groups.
Pedestrian Signal Indication
At signalized intersections, the data collectors recorded the pedestrian signal indication present at the start of the crossing (i.e., WALK, FDW, DW). Although the pedestrian signal indication often changed after the pedestrian had begun to cross, only the initial signal indication present at the start of the crossing maneuver was recorded.
Excluded Pedestrians
Certain pedestrian characteristics were identified as anomalous for purposes of this study. Thus, to avoid confounding the analysis, a crossing event was not recorded if any of the following characteristics were displayed:
• The person was carrying a heavy object, or pushing a cart or stroller, or walking with a pet;
• The crosswalk was blocked or impeded by a vehicle; • The person paused or rested within the crosswalk; • The person started crossing at a point outside of the crosswalk; • The person veered from a direct perpendicular crossing such that their total traveled
distance was at least one foot greater than the perpendicular crossing distance. o This translated to leftward or rightward deviations of 7 ft and 10 ft for 2 lane and
4 lane streets, respectively; or • The person jogged or ran at anytime during the cross
o The data collectors occasionally had difficulty classifying a brisk walker vs. slow jogger. The authors thus used a 7.33 ft/s (5.0 mi/hr) pace to discriminate between walking and jogging.
Statistical Analysis Walking speed observations were made for 1,947 individuals or groups of pedestrians. The data were tabulated, organized, and coded into a single data file for detailed analysis of walking speed as a function of the various factors. To determine any obvious trends in the data, sources for potential bias, and data distributions, the authors initially compared the descriptive statistics (i.e., mean, standard deviation, percentiles, etc.) and simple graphical representations (i.e., histogram, Q-Q plot, box plot) of the walking speeds for each of the pedestrian categories.
A Kolmogorov-Smirnov test for normality showed the data to be statistically non-normal. However, because of both the large sample size and the data being near-normal (by visual observation) the authors determined that data transformation was not needed prior to performing further analysis. Furthermore, although many of the between-group standard deviations were slightly different from each other (see Table 3), they were all well within an acceptable order of magnitude from each other (typically assumed up to 4σi) again implying that data transformation was not necessary (11).
From there, the walking speed data were analyzed using univariate multi-factor analysis of variance (ANOVA) to investigate the effect of the main factors and interactions of the main factors (where applicable). The ANOVA analyses were performed in SPSS v11.5 using the Univariate General Linear Model command (12). All testing was performed at a 95%
TRB 2006 Annual Meeting CD-ROM Paper revised from original submittal.

Tim J. Gates, David A. Noyce, Andrea R. Bill, Nathanael Van Ee
6
confidence level. Type IV sums of squares were used because some of the categories did not contain data. The main factors for the ANOVA included: Subject Age (five levels: hand-assisted child, unassisted child to 29 years old, 30 to 64 years old, 65 years or older, disabled), Sex (male, female), Group Size (individual, two to four persons, five or more persons), and Traffic Control Condition (WALK, FDW, DW, stop-controlled, uncontrolled).
It was necessary to construct two ANOVA models because not all two-way interactions were relevant (i.e., Sex*Group Size), thus eliminating the ability to create a single comprehensive model. The authors were primarily interested in the main effects and two-way interactions of the main effects. Higher-order interactions (i.e., three-way) were of little value due to small sample sizes in some categories. Tukey’s Homogeneous Subsets post hoc procedure was performed in SPSS after completing the multi-factor ANOVA.
RESULTS Table 2 displays the site-by-site summary statistics for the pedestrian data collected for this study. The number of pedestrians observed per site ranged from 68 to 270. As expected, most of the pedestrians observed at sites near the UW-Madison campus were under the age of 30. Faster walking speeds were also typically observed at the campus sites. Older persons were mostly observed at the west-Madison locations and near downtown Madison. The following sections present results of the analyses. TABLE 2 Site-by-Site Summary Statistics
Traffic Control Intersection and Location Intersection Type
Avg. Age of Peds.
Total Peds. In Sample
Mean Walking Speed (ft/s)
Segoe Rd./ Sawyer St. (West Madison) 3-leg > 30 68 4.21
Randall Ave./ Dayton St. (UW-Madison Campus) 3-leg < 30 102 5.41
University Ave./ Park St. (UW-Madison Campus) 4-leg < 30 157 4.91
Gorham St./ State St. (Downtown Madison) 4-leg Mixed 136 4.45
Wisconsin Ave./ 16th St. (Central Milwaukee) 4-leg < 30 200 4.24
Johnson St./ State St. (Downtown Madison) 5-leg Mixed 209 4.49
University Ave./ Babcock Dr. (UW-Madison Campus) Mid-block < 30 136 4.89
Signalized
Johnson St./ Univ. Square (UW-Madison Campus) Mid-block < 30 155 4.71
Randall Ave./ Johnson St. (UW-Madison Campus) 2-way stop < 30 270 4.91
Hilldale Mall Dr./ Sentry (West Madison) 4-way stop > 65 261 4.03 Unsignalized
Hill Farms Dr./ DMV Office (West Madison) Uncontrolled Mixed 253 4.67
TRB 2006 Annual Meeting CD-ROM Paper revised from original submittal.

Tim J. Gates, David A. Noyce, Andrea R. Bill, Nathanael Van Ee
7
ANOVA Table 3 displays the general statistics for all levels of each factor in the analysis, including: number of samples collected, the mean and standard deviation, 15th, 25th, 50th, 75th, and 85th percentile walking speeds, and multi-factor ANOVA results.
TABLE 3 Walking Speed Summary Statistics and ANOVA Results Percentiles (ft/s)a ANOVA
Factor Level Count Mean (ft/s)
St. Dev. (ft/s) 15th 25th 50th 75th 85th
F-value
p-value
Child w/adult 55 3.99 0.59 3.36 3.52 3.95 4.34 4.61 < 30 894 4.84 0.67 4.17 4.39 4.77 5.27 5.47 30-64 662 4.72 0.70 4.00 4.24 4.67 5.13 5.45 ≥ 65 326 3.81 0.81 3.02 3.33 3.78 4.34 4.72
Age
Disabled 10 3.88 0.80 2.83 3.30 3.91 4.34 4.90
48.62 0.000
Individual 1,398 4.72 0.82 3.93 4.27 4.74 5.24 5.48 2 to 4 466 4.32 0.68 3.67 3.92 4.33 4.74 5.00 Group
Size 5 or more 83 4.09 0.54 3.47 3.68 4.09 4.50 4.60
8.25 0.000
DW 199 5.01 0.77 4.24 4.50 5.00 5.45 6.00 FDW 89 5.15 0.80 4.30 4.50 5.00 5.73 6.09 WALK 875 4.50 0.68 3.77 4.06 4.50 4.96 5.23 Stop-controlled 350 4.20 0.89 3.21 3.62 4.31 4.88 5.00
Traffic Control Conditionb
Uncontrolled 422 4.82 0.77 4.06 4.35 4.79 5.28 5.56
2.83 0.024
Male 757 4.83 0.80 4.09 4.38 4.84 5.33 5.61 Sexc
Female 611 4.60 0.82 3.73 4.13 4.67 5.07 5.37 0.57 0.451
All Data 1,947 4.60 0.80 3.78 4.10 4.64 5.09 5.38 22.8 0.000 Note: a Italicized 15th percentile walking speeds indicates values that are below 4.00 ft/s. b The signalized intersections had a disproportionately low percentage of older pedestrians, while the stop-
controlled intersections had a disproportionately high percentage of older pedestrians. c Individual pedestrians only.
The multi-factor ANOVA models showed each of the main factor effects except sex to have a statistically significant effect on pedestrian walking speed at a 95 percent level of confidence. Of the main effects, the most significant (in descending order based on F-value from multi-factor ANOVA) were: Age (F = 48.62), Group Size (F = 8.25), and Traffic Control Condition (F = 2.83). Some two-way factor interactions were statistically significant, including Traffic Control Condition*Sex (F = 3.85) and Traffic Control Condition*Age (F = 2.03) and will be explained later.
Post Hoc Analysis of Homogeneous Subsets
Post hoc testing was performed in addition to the initial ANOVA analyses. Tukey’s Homogeneous Subsets procedure was used to create distinct subsets within each factor based on levels with similar walking speeds. The homogeneous subsets for each of the statistically significant factors are shown in Figure 2 (indicated by brackets) along with the 95 percent confidence intervals for the mean values (indicated by error bars).
TRB 2006 Annual Meeting CD-ROM Paper revised from original submittal.

Tim J. Gates, David A. Noyce, Andrea R. Bill, Nathanael Van Ee
8
1055326662894N =
AGE GROUP
disabledchild w/adultover 6530 to 65under 30
95%
CI W
ALK
ING
SP
EE
D (f
ps)
5.0
4.8
4.6
4.4
4.2
4.0
3.8
3.6
3.4
3.2
3.0
42235087589199N =
TRAFFIC CONTROL CONDITION
UncontrolledStop Controlled
WALKFDW
DW
95%
CI W
ALK
ING
SP
EE
D (f
ps)
5.4
5.2
5.0
4.8
4.6
4.4
4.2
4.0
3.8
FIGURE 2 Confidence intervals and homogeneous subsets of similar data.
95% Confidence Interval for Mean
Mean = 4.79, 15th p’tile = 4.09
Mean = 3.84, 15th p’tile = 3.08
Mean = 5.06, 15th p’tile = 4.25
Homogeneous Subset
Mean = 4.50, 15th p’tile = 3.77
Mean = 4.20, 15th p’tile = 3.21
Mean = 4.82, 15th p’tile = 4.06
TRB 2006 Annual Meeting CD-ROM Paper revised from original submittal.

Tim J. Gates, David A. Noyce, Andrea R. Bill, Nathanael Van Ee
9
834661398N =
GROUP SIZE
5 or more2 to 4individual
95%
C.I.
WA
LKIN
G S
PE
ED
(fps
)5.0
4.8
4.6
4.4
4.2
4.0
3.8
FIGURE 2 (Continued) Confidence intervals and homogeneous subsets of similar data.
Discussion of Results
Walking Speed vs. Age
As expected, age had the most significant effect on walking speed. Table 3 showed that the 15th percentile walking speed for the entire set of 1,947 observations was 3.78 ft/s – slightly lower than the commonly used 4.0 ft/s. However, the overall mean was found to be greater than 4.0 ft/s. Nearly 17 percent (n = 326) of all observations were of persons over the age of 65. The mean and 15th percentile walking speeds of 3.81 and 3.02 ft/s, respectively, observed for the 65 and over age group were the slowest among all age groups. Furthermore, the standard 4.0 ft/s walking speed was found to be the 58th percentile walking speed for people over the age of 65. In other words, greater than half of the older pedestrians observed in the study would not be accommodated by traffic signals with pedestrian clearance intervals timed for walking speeds of 4.0 ft/s. The walking speeds for older pedestrians presented in Table 3 were very similar to those reported by Knoblauch, who found the mean and 15th percentile walking speeds for persons aged 65 and older to be 3.94 and 3.08 ft/s, respectively (5).
People under the age of 30 (excluding hand-assisted children) made up the largest portion of the observations (45.9 percent) and were found to have the fastest 15th percentile walking speed at 4.17 ft/s. The 30-64 year old category was slightly slower than the under 30 category with a 15th percentile walking speed of 4.00 ft/s. The post hoc analysis of homogeneous subsets found the walking speeds for the under 30 and 30-64 age groups to be statistically similar with a combined mean of 4.79 ft/s and 15th percentile of 4.09 ft/s (see Figure 2). These findings were
Mean = 4.72 15th p’tile = 3.93
Mean = 4.32 15th p’tile = 3.67
Mean = 4.09, 15th p’tile = 3.47
TRB 2006 Annual Meeting CD-ROM Paper revised from original submittal.

Tim J. Gates, David A. Noyce, Andrea R. Bill, Nathanael Van Ee
10
again similar to those observed by Knoblauch, who found the mean and 15th percentile walking speeds for persons younger than 65, to be 4.79 and 3.97 ft/s, respectively (5).
Although only a small sample of hand-assisted children was observed, they possessed a relatively slow 15th percentile walking speed of 3.36 ft/s. A 15th percentile walking speed of 2.83 ft/s was observed for disabled pedestrians, although very few observations were made. Most of the ten disabled observations were for persons using motorized wheelchairs. Because age was found to have a the greatest influence on walking speed, it was appropriate to report each of the other factors broken down by age group, as shown in Table 4.
TABLE 4 Walking Speed Summary Statistics by Age Group Percentiles (ft/s)a
Factor Level Age Group Count Mean (ft/s)
St. Dev. (ft/s) 15th 50th 85th
Two-way Interaction with Age?
< 30 105 5.14 0.69 4.44 5.00 6.00 30-64 82 4.96 0.80 4.21 4.82 6.00 DW ≥ 65 12 4.30 0.78 3.45 4.23 5.28 < 30 64 5.10 0.83 4.15 5.00 6.21 FDW 30-64 23 5.34 0.68 4.47 5.56 6.03 Child w/adult 37 3.98 0.60 3.34 3.86 4.62 < 30 445 4.68 0.63 4.06 4.67 5.33 30-64 289 4.52 0.61 3.91 4.50 5.19
WALK
≥ 65 95 3.87 0.66 3.24 3.86 4.54 Child w/adult 13 4.10 0.47 3.40 4.19 4.67 < 30 90 4.81 0.57 4.38 4.95 5.38 30-64 82 4.63 0.62 3.99 4.64 5.27
Stop-Controlled
≥ 65 165 3.66 0.84 2.75 3.67 4.55 < 30 181 4.99 0.65 4.35 4.93 5.78 30-64 183 4.89 0.72 4.15 4.86 5.60
Traffic Control Condition
Uncontrolled ≥ 65 53 4.07 0.84 3.29 4.12 4.98
Yes, older peds walked slowest at the stop controlled intersection, while all other ages walked slowest under the WALK indication.
< 30 631 5.00 0.64 4.38 4.96 5.64 30-64 508 4.83 0.71 4.09 4.74 5.61 Individual ≥ 65 251 3.85 0.83 3.00 3.79 4.76 Child w/adult 45 4.05 0.60 3.38 4.08 4.65 < 30 211 4.53 0.61 3.93 4.50 5.01 30-64 136 4.43 0.54 3.90 4.38 5.02
2 to 4
≥ 65 69 3.70 0.74 2.99 3.70 4.47 Child w/adult 7 3.65 0.54 3.26 3.43 4.59 < 30 52 4.21 0.52 3.58 4.20 4.74 30-64 18 4.04 0.50 3.29 4.11 4.55
Group Size
5 or more
≥ 65 6 3.70 0.49 3.08 3.67 4.40
No
< 30 380 5.04 0.62 4.40 5.00 5.70 30-64 260 4.91 0.73 4.17 4.87 5.77 Male ≥ 65 117 3.95 0.88 2.95 4.10 4.82 < 30 245 4.92 0.66 4.37 4.80 5.63 30-64 236 4.72 0.68 4.05 4.68 5.38
Sex
Female ≥ 65 130 3.75 0.78 3.01 3.64 4.73
No
Note: a Italicized 15th percentile walking speeds indicates values that are below 4.00 ft/s.
TRB 2006 Annual Meeting CD-ROM Paper revised from original submittal.

Tim J. Gates, David A. Noyce, Andrea R. Bill, Nathanael Van Ee
11
Walking Speed vs. Traffic Control Condition
The traffic control condition was found to have a significant effect on walking speed. At unsignalized intersections, pedestrians crossing at uncontrolled crossings crossed approximately 0.6 ft/s faster than those at stop-controlled crossings. Similarly, at signalized intersections, regardless of age, pedestrians who began to cross under DON’T WALK and FLASHING DON’T WALK indications crossed roughly 0.5 – 0.6 ft/s faster on average than those who began under the WALK indication. This difference was likely due to the confidence of having ample crossing time when initiating a crossing under the WALK indication, contrasted with the haste generated by the threat of conflicting traffic when initiating a crossing during the DW and FDW indications. Differences between the walking speeds for the WALK versus FDW indications may suggest that pedestrians understand that the FDW indication implies impending release of oncoming traffic. The findings also suggest that pedestrians can walk at a slightly faster pace if necessary. Knoblauch reported similar findings at signalized intersections and recommended including only crossing events that began under the WALK indication when developing design recommendations for pedestrian clearance timing (5).
Two-way Interaction between Traffic Control Condition and Age As shown in Table 4, the two-way interaction of Traffic Control Condition*Age was found to have a statistically significant effect on walking speed. This interaction appeared to be due in large part to the finding that pedestrians over the age of 65 walked slowest at the stop-controlled crossings, while all other ages walked slowest under the WALK indication. This finding may be due to older pedestrians having lower confidence that they will be provided with ample crossing time at signalized intersections, thus feeling the need to walk at a faster pace versus stop-controlled crossings where they can wait for a gap of ample size. However, a better explanation may be that the stop-controlled intersection where most of the older persons were observed was near senior living centers and thus the older pedestrians appeared to be older and frailer than those observed at other intersections. Most signalized intersections where older pedestrians were observed were located in the vibrant downtown shopping area of Madison where the older pedestrians appeared to be younger and more active.
Two-way Interaction between Traffic Control Condition and Sex The two-way interaction of Traffic Control Condition*Sex was found to have a statistically significant effect on walking speeds. Females walked 0.2 – 0.3 ft/s faster than males under the FDW and DW indications and 0.2 – 0.3 ft/s slower than males under the WALK indication and at uncontrolled intersections. Females and males walked at the same rate at stop-controlled intersections.
Walking Speed vs. Group Size
Group size had an inversely proportional effect on walking speed. This finding was not surprising as pedestrians in a group are more likely to be distracted from the traffic situation than those crossing individually. Post hoc testing showed that individuals, groups of two to four, and groups of five or more each had significantly different mean walking speeds. Please note that adult assisted children were counted as groups rather than individuals. Groups of two to four were on average 0.4 ft/s slower than individual crossers, and groups of 5 or more were about 0.6 ft/s slower than individual crossers. Group size had a lesser effect on older crossers than on younger crossers, although the interaction of age and group size was not statistically significant. Knoblauch found similar effects for groups as younger persons were found to walk
TRB 2006 Annual Meeting CD-ROM Paper revised from original submittal.

Tim J. Gates, David A. Noyce, Andrea R. Bill, Nathanael Van Ee
12
approximately 0.4 ft/s slower when in a group versus crossing individually, while older persons were found to walk only 0.15 ft/s slower when grouped (5).
Walking Speed vs. Sex
Sex had a small, but statistically insignificant, effect on walking speed. Depending on age group, women walked on average approximately 0.1 - 0.2 ft/sec slower than men of the same age group. Young men were the fastest of all pedestrians with mean and 15th percentile walking speeds of 5.04 and 4.40 ft/s, respectively, while older women were the slowest with mean and 15th percentile walking speeds of 3.75 and 3.01. These findings were again similar to those found by Knoblauch (5).
RECOMMENDED WALKING SPEEDS FOR PEDESTRAIN CLEARANCE TIMING In light of the recent walking speed discussions within the NCUTCD, the U.S. Access Board, and elsewhere, a primary objective of this research was to recommend walking speeds for pedestrian clearance timing based on characteristics of the pedestrians using the crosswalk. Pedestrian clearance timing is typically computed to provide suitable clearance for persons entering the crosswalk prior to the termination of the WALK indication. As described earlier, the analysis showed that pedestrians were found to cross at significantly faster speeds when beginning to cross under the FDW and DW indications compared to pedestrians crossing under the WALK indication. Thus, prior to development of design walking speed recommendations, the authors removed data for pedestrians who began their crossing under the FDW or DW indications, or crossed at uncontrolled crosswalks. Similar exclusions were made by Knoblauch, whose design walking speed recommendations were based solely on crossings that began under the WALK indication (5).
In addition to including crossings that began under the WALK indication, pedestrians who crossed at stop-controlled intersections were also included in the data subset. This was because subsequent ANOVA (after removal of data for FDW, DW, and uncontrolled crossings) showed that walking speeds at stop-controlled intersections were not statistically different from crossings made under the WALK indication (p-value = 0.970). The final data subset upon which the recommendations were based contained 1,225 pedestrian observations.
Walking Speed Based on Age and Disability Demographics
The literature showed substantial ambiguity in determining a walking speed suitable for timing pedestrian clearance for a “normal” pedestrian population. Part of the difficulty may lie in defining the demographics of a normal or typical pedestrian population because of the strong effects that age and physical disability have on walking speed. The authors decided that for purposes of the research presented here a normal pedestrian population should reflect the age and disability demographics of the United States population.
The post hoc analysis found that the various age and disability levels could be condensed into two homogeneous groups: traditionally slower pedestrians (i.e., ≥ 65, hand-assisted children, and disabled) and traditionally faster pedestrians (< 30, 30-64). Thus to simplify the demographic analysis, the authors used data from the 2000 United States Census (13) and other sources (14,15) to estimate the percent of Americans falling into both the slower and faster pedestrian categories. The following list shows the estimated proportions of slower and faster pedestrians in the United States compared to the sample of 1,225 pedestrians included in the subset of WALK and stop-controlled intersection crossing data.
TRB 2006 Annual Meeting CD-ROM Paper revised from original submittal.

Tim J. Gates, David A. Noyce, Andrea R. Bill, Nathanael Van Ee
13
• Traditionally Slower Pedestrians o Age 65 and over
United States: 12.4% (13) Observed Sample: 21.2%
o Children requiring crossing assistance United States: 2.7% (13) Observed Sample: 4.1%
o Physically disabled persons under age 65 United States: 0.4% (14,15) Observed Sample: 0.7%
o Total Slower United States: 15.5% Observed Sample: 26.0%
• Traditionally Faster Pedestrians o Total Faster
United States: 84.5% Observed Sample: 74.0%
The preceding list shows that the pedestrian sample used in this analysis was overrepresented by slower crossers (particularly older persons) when compared to demographic estimates for the United States. Therefore, a randomly selected subset of the 1,225 WALK and stop-controlled pedestrian crossings was created such that 15.5 percent were over the age of 65, hand-assisted children, and disabled with the remaining 84.5 percent made up of persons under the age of 65 (excluding hand-assisted children and disabled).
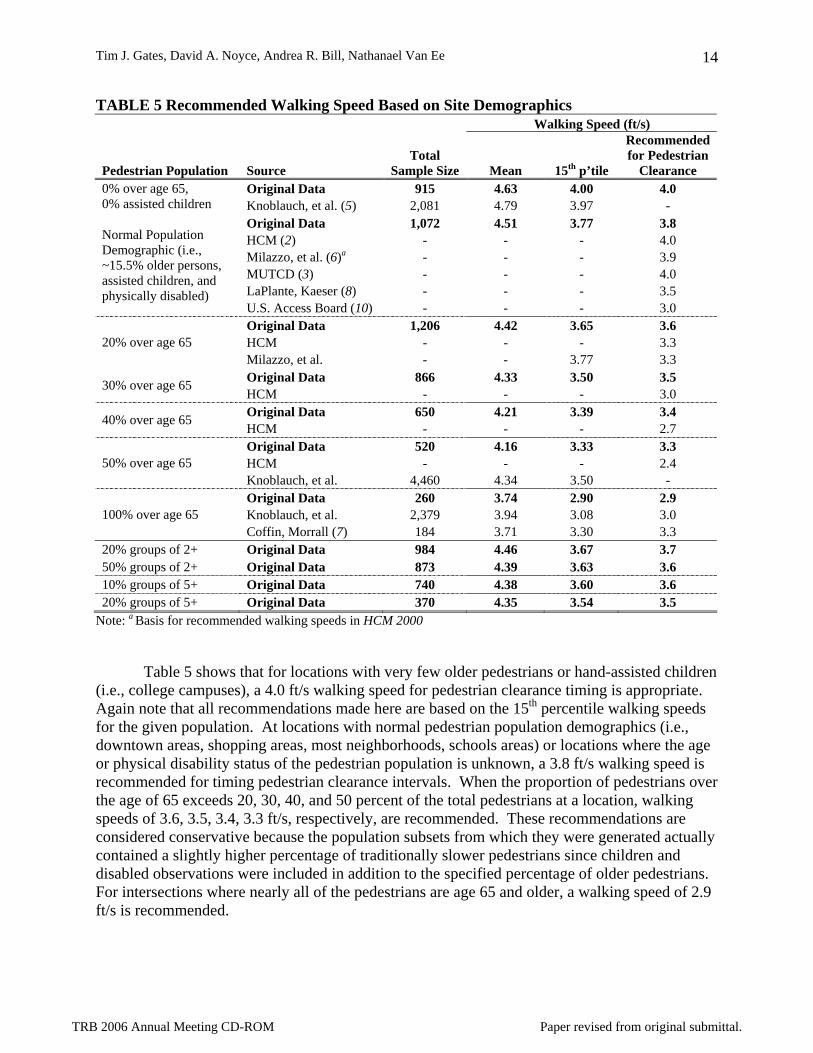
Furthermore, it was also necessary to develop recommendations based on various percentages of older pedestrians (i.e., 20%, 30%, 40%, and 50%) for comparison with the Highway Capacity Manual’s recommended walking speeds. To mirror the HCM conditions, these subsets were created by fixing the percentage of older persons and randomly selecting from the remaining pedestrian observations. Thus, the subsets actually contained a slightly higher percentage of traditionally slower pedestrians because in addition to the specified percentage of older pedestrians, children and disabled were included with the randomly selection portion. Table 5 presents a summary of the mean, 15th percentile, and recommended walking speeds from the population subsets analyzed here compared to similar findings from a variety of relevant literature sources. The recommendations made here for each demographic category were based on the observed 15th percentile walking speeds for that category.
TRB 2006 Annual Meeting CD-ROM Paper revised from original submittal.
Tim J. Gates, David A. Noyce, Andrea R. Bill, Nathanael Van Ee
14
TABLE 5 Recommended Walking Speed Based on Site Demographics Walking Speed (ft/s)
Pedestrian Population Source Total
Sample Size Mean 15th p’tile
Recommended for Pedestrian
Clearance Original Data 915 4.63 4.00 4.0 0% over age 65,
0% assisted children Knoblauch, et al. (5) 2,081 4.79 3.97 - Original Data 1,072 4.51 3.77 3.8 HCM (2) - - - 4.0 Milazzo, et al. (6)a - - - 3.9 MUTCD (3) - - - 4.0 LaPlante, Kaeser (8) - - - 3.5
Normal Population Demographic (i.e., ~15.5% older persons, assisted children, and physically disabled)
U.S. Access Board (10) - - - 3.0 Original Data 1,206 4.42 3.65 3.6 HCM - - - 3.3 20% over age 65 Milazzo, et al. - - 3.77 3.3 Original Data 866 4.33 3.50 3.5 30% over age 65 HCM - - - 3.0 Original Data 650 4.21 3.39 3.4 40% over age 65 HCM - - - 2.7 Original Data 520 4.16 3.33 3.3 HCM - - - 2.4 50% over age 65 Knoblauch, et al. 4,460 4.34 3.50 - Original Data 260 3.74 2.90 2.9 Knoblauch, et al. 2,379 3.94 3.08 3.0 100% over age 65 Coffin, Morrall (7) 184 3.71 3.30 3.3
20% groups of 2+ Original Data 984 4.46 3.67 3.7 50% groups of 2+ Original Data 873 4.39 3.63 3.6 10% groups of 5+ Original Data 740 4.38 3.60 3.6 20% groups of 5+ Original Data 370 4.35 3.54 3.5
Note: a Basis for recommended walking speeds in HCM 2000
Table 5 shows that for locations with very few older pedestrians or hand-assisted children (i.e., college campuses), a 4.0 ft/s walking speed for pedestrian clearance timing is appropriate. Again note that all recommendations made here are based on the 15th percentile walking speeds for the given population. At locations with normal pedestrian population demographics (i.e., downtown areas, shopping areas, most neighborhoods, schools areas) or locations where the age or physical disability status of the pedestrian population is unknown, a 3.8 ft/s walking speed is recommended for timing pedestrian clearance intervals. When the proportion of pedestrians over the age of 65 exceeds 20, 30, 40, and 50 percent of the total pedestrians at a location, walking speeds of 3.6, 3.5, 3.4, 3.3 ft/s, respectively, are recommended. These recommendations are considered conservative because the population subsets from which they were generated actually contained a slightly higher percentage of traditionally slower pedestrians since children and disabled observations were included in addition to the specified percentage of older pedestrians. For intersections where nearly all of the pedestrians are age 65 and older, a walking speed of 2.9 ft/s is recommended.
TRB 2006 Annual Meeting CD-ROM Paper revised from original submittal.

Tim J. Gates, David A. Noyce, Andrea R. Bill, Nathanael Van Ee
15
Table 5 also shows that the pedestrian walking speeds observed in this analysis and the subsequent recommendations are similar to those found in the literature except for the recommendations made by the Highway Capacity Manual for cases where the population of pedestrians over the age of 65 exceeds 20 percent of the total pedestrians. The Highway Capacity Manual states that if more than 20 percent of pedestrians using a crosswalk on a regular basis are over age 65, a walking speed of 3.3 ft/s is recommended and should be further reduced by 0.3 ft/s for each additional 10 percent of older pedestrians (i.e., 3.0 ft/s for 30% older, etc.) (2). The authors feel that the Highway Capacity Manual recommendations for cases where older pedestrians exceed 20 percent of the overall population are overly conservative compared to the pedestrian data analyzed here.
Walking Speed Based on Group Size The analysis found that walking speed decreased as group size increased. Pedestrians crossing individually had mean and 15th percentile walking speeds of 4.54 and 3.76 ft/s respectively. The mean and 15th percentile walking speeds dropped to 4.22 and 3.57 ft/s for groups of 2 to 4 persons and 4.04 and 3.45 ft/s for groups of 5 or more. In order to generate recommendations based on group size, the authors again generated subsets of the overall pedestrian sample based on a desired percentage of groups. Walking speed recommendations based on group size were also included in Table 5.
Without regard to age or disability demographics, the authors recommend a walking speed of 3.8 ft/s for pedestrian clearance at locations where group crossings of two or more persons make up 0 to 20 percent of the total. When group crossings are greater than 20 percent of the total pedestrian crossings, a walking speed of 3.7 ft/s is recommended. When group crossings account for 50 percent or more of the total, a walking speed of 3.6 ft/s is recommended.
A walking speed of 3.6 ft/s is also recommended for locations where groups of 5 or more regularly make up greater than 10 percent of the total crossings. Where groups of 5 or more make up 20 percent or more of the total crossings, a walking speed of 3.5 ft/s is recommended. For intersections near special event areas, including stadiums and concert halls where mega-group (i.e., more than 20 pedestrians) crossings are frequent, slower walking speeds may be appropriate during special events since pedestrian congestion will likely occur. At locations where pedestrian age and group size are both factors to consider, the authors recommend using the lower of the recommended walking speeds. As stated previously, the Highway Capacity Manual explicitly accounts for group size in the pedestrian signal timing equations by adding crossing time as the number of pedestrians wishing to cross during a given interval increases (2).
IMPACT OF SLOWER WALKING SPEEDS ON INTERSECTION EFFICIENCY Although timing pedestrian clearance intervals based on slower walking speeds may improve pedestrian safety, doing so may also have a negative effect on vehicular traffic flow because slower pedestrian walking speeds translates to longer pedestrian clearance times. At intersection approaches where vehicular demand governs the amount of green time for the through movements, a decrease in walking speeds will likely not affect the amount of green time necessary to provide pedestrian clearance. However, at approaches where vehicular demand is low, but pedestrian demand is high, a longer pedestrian clearance time will likely increase the green interval and overall phase time for that approach. The longer phase will either require a reduction in other phase times (to maintain the previous cycle length) resulting in longer delays
TRB 2006 Annual Meeting CD-ROM Paper revised from original submittal.

Tim J. Gates, David A. Noyce, Andrea R. Bill, Nathanael Van Ee
16
or an increase in the cycle length, having a potentially negative impact on corridor progression. Table 6 shows the amount of pedestrian clearance time and total crossing time (clearance plus 7.0 second WALK interval) necessary for various street widths based on walking speed.
TABLE 6 Pedestrian Clearance and Total Crossing Time Based on Street Width and Walking Speed
Pedestrian Clearance Time (sec) Street Width
(ft) 4.0 ft/sec 3.8 ft/sec 3.7 ft/sec 3.6 ft/sec 3.5 ft/sec 3.4 ft/sec 3.3 ft/sec 2.9 ft/sec 40 10.0 10.5 10.8 11.1 11.4 11.8 12.1 13.8 60 15.0 15.8 16.2 16.7 17.1 17.6 18.2 20.7 80 20.0 21.1 21.6 22.2 22.9 23.5 24.2 27.6
100 25.0 26.3 27.0 27.8 28.6 29.4 30.3 34.5 120 30.0 31.6 32.4 33.3 34.3 35.3 36.4 41.4
Total Pedestrian Crossing Time (including 7.0 second WALK time) (sec) Street Width
(ft) 4.0 ft/sec 3.8 ft/sec 3.7 ft/sec 3.6 ft/sec 3.5 ft/sec 3.4 ft/sec 3.3 ft/sec 2.9 ft/sec 40 17.0 17.5 17.8 18.1 18.4 18.8 19.1 20.8 60 22.0 22.8 23.2 23.7 24.1 24.6 25.2 27.7 80 27.0 28.1 28.6 29.2 29.9 30.5 31.2 34.6
100 32.0 33.3 34.0 34.8 35.6 36.4 37.3 41.5 120 37.0 38.6 39.4 40.3 41.3 42.3 43.4 48.4
To quantify the impact of walking speed on traffic flow, intersection efficiency was
computed and shown in Table 7 for various cycle lengths, street widths, and walking speeds using a procedure similar to that used by LaPlante and Kaeser (8). Intersection efficiency was defined as the proportion of green time available for other non-concurrent movements and was calculated by determining the amount of time available for cross traffic and turning movements and dividing it by the total cycle length:
( )G C PT RC C
− −= (1)
where: G = Green time for cross traffic and turning movements (s) PT = Total Pedestrian Crossing Time (as shown in Table 6 [s]) R = Clearance and All-Red Phase (4.0 s) C = Cycle Length (s)
TRB 2006 Annual Meeting CD-ROM Paper revised from original submittal.

Tim J. Gates, David A. Noyce, Andrea R. Bill, Nathanael Van Ee
17
TABLE 7 Intersection Efficiency (G/C)a Based on Cycle Length, Street Width, and Walking Speed
60-Second Cycle Street Width
(ft) 4.0 ft/sec 3.8 ft/sec 3.7 ft/sec 3.6 ft/sec 3.5 ft/sec 3.4 ft/sec 3.3 ft/sec 2.9 ft/sec 40 0.65 0.64 0.64 0.63 0.63 0.62 0.61 0.59 60 0.57 0.55 0.55 0.54 0.53 0.52 0.51 0.47 80 0.48 0.47 0.46 0.45 0.44 0.42 0.41 0.36
100 0.40 0.38 0.37 0.35 0.34 0.33 0.31 0.24 120 0.32 0.29 0.28 0.26 0.25 0.23 0.21 0.13
90-Second Cycle Street Width
(ft) 4.0 ft/sec 3.8 ft/sec 3.7 ft/sec 3.6 ft/sec 3.5 ft/sec 3.4 ft/sec 3.3 ft/sec 2.9 ft/sec 40 0.77 0.76 0.76 0.75 0.75 0.75 0.74 0.72 60 0.71 0.70 0.70 0.69 0.69 0.68 0.68 0.65 80 0.66 0.64 0.64 0.63 0.62 0.62 0.61 0.57
100 0.60 0.59 0.58 0.57 0.56 0.55 0.54 0.49 120 0.54 0.53 0.52 0.51 0.50 0.49 0.47 0.42
100-Second Cycle Street Width
(ft) 4.0 ft/sec 3.8 ft/sec 3.7 ft/sec 3.6 ft/sec 3.5 ft/sec 3.4 ft/sec 3.3 ft/sec 2.9 ft/sec 40 0.79 0.78 0.78 0.78 0.78 0.77 0.77 0.75 60 0.74 0.73 0.73 0.72 0.72 0.71 0.71 0.68 80 0.69 0.68 0.67 0.67 0.66 0.65 0.65 0.61
100 0.64 0.63 0.62 0.61 0.60 0.60 0.59 0.55 120 0.59 0.57 0.57 0.56 0.55 0.54 0.53 0.48
120-Second Cycle Street Width
(ft) 4.0 ft/sec 3.8 ft/sec 3.7 ft/sec 3.6 ft/sec 3.5 ft/sec 3.4 ft/sec 3.3 ft/sec 2.9 ft/sec 40 0.83 0.82 0.82 0.82 0.81 0.81 0.81 0.79 60 0.78 0.78 0.77 0.77 0.77 0.76 0.76 0.74 80 0.74 0.73 0.73 0.72 0.72 0.71 0.71 0.68
100 0.70 0.69 0.68 0.68 0.67 0.66 0.66 0.62 120 0.66 0.65 0.64 0.63 0.62 0.61 0.61 0.56
Note: a G/C = Proportion of green time available for other non-concurrent movements.
Table 7 shows that slower walking speeds will have a greater negative impact on
intersection efficiency at locations with shorter cycle lengths or wider crossing distances. Narrow intersections are less affected by walking speed or cycle length. Wide intersections should never be timed with short cycle lengths if pedestrian clearance must be provided. Regardless of the street width, longer cycle lengths do a better job of “absorbing” the impact of slower walking speeds on intersection efficiency. Although the impact of longer clearance times on corridor progression was not investigated here, it would be beneficial to investigate the impact of longer pedestrian clearance times on traffic flow for a highly traveled urban corridor with coordinated signals.
TRB 2006 Annual Meeting CD-ROM Paper revised from original submittal.

Tim J. Gates, David A. Noyce, Andrea R. Bill, Nathanael Van Ee
18
HCM Analysis
To determine the effect of slower walking speeds on vehicular delays the authors performed a series of analyses using the HCM (2). A single hypothetical urban intersection is presented here. The hypothetical intersection had three lanes in both directions (dedicated left turn, through, and through and right for both directions) on the major street and one lane in both directions on the minor street. A 60-second cycle in two-phase operation was assumed. Minor street vehicular volumes were purposely assumed low so that pedestrian clearance governed the green times. The delay was recorded for various levels of vehicular traffic on the major-street using green splits based on pedestrian clearance for walking speeds of 3.0 ft/s, 3.5 ft/s, and 4.0 ft/s. All other intersection attributes remained fixed throughout the analysis.
The results showed that walking speed has little effect on intersection delay at low major-street vehicular volumes (i.e., less than 1700 vehicles per hour [vph]). However, for major-street vehicular volumes above 2000 vph, the intersection delay doubled when the walking speed was reduced from 4.0 ft/s to 3.0 ft/s. Thus, with all other attributes kept the same, a decrease in pedestrian walking speed results in dramatically increased intersection delay with higher vehicular volumes. Such findings would suggest using longer cycle lengths at high volume intersections where green times are governed by pedestrian clearance, although this is not always practical. The authors recognize that this is just one scenario; there are numerous other scenarios worth investigating. Nevertheless, if not appropriately accommodated, using slower walking speeds for pedestrian clearance timings can significantly increase vehicular delay at intersections.
CONCLUSIONS AND RECOMMENDATIONS The authors analyzed 1,947 pedestrian crossings from eleven intersections in Madison and Milwaukee, Wisconsin to determine the effect of subject age and disability, traffic control condition, group size, and sex on walking speeds. The ANOVA showed that pedestrian walking speeds were dependent upon age and disability, traffic control condition, and group size (see Table 3).
Age had the most significant effect of all factors. Pedestrians over the age of 65 were the slowest among all age groups with a mean and 15th percentile walking speed of 3.81 and 3.02 ft/s, respectively. Children hand-assisted by adults and physically disabled persons (mostly motorized wheelchair users) showed crossing speeds similar to those of older persons. Thus, the commonly used 4.0 ft/s walking speed does not does not provide ample clearance time for the majority of pedestrians over the age of 65, hand-assisted children, and physically disabled persons. Four feet per second does provide ample crossing time for most individual pedestrians under the age of 65 (excluding assisted children and disabled persons).
The traffic control condition also had a statistically significant effect on walking speeds. Pedestrians walked the fastest under the DON’T WALK and FLASHING DON’T WALK signal indications - roughly 0.5 – 0.6 ft/s faster on average than those who began under the WALK indication. Similarly, at unsignalized intersections, pedestrians crossing at uncontrolled crossings crossed roughly 0.6 ft/s faster than those at stop-controlled crossings. Group size was also found to affect walking speed. Groups of pedestrians crossed at speeds that were on average 0.4 to 0.6 ft/s slower than individual crossers depending on group size and were also often not accommodated by pedestrian clearance timings based on 4.0 ft/s. The sex of the pedestrian had a small, yet statistically insignificant, effect on walking speeds. Depending on age group, women
TRB 2006 Annual Meeting CD-ROM Paper revised from original submittal.

Tim J. Gates, David A. Noyce, Andrea R. Bill, Nathanael Van Ee
19
walked approximately 0.1 - 0.2 ft/sec slower on average than men of the same age group. Young men were the fastest of all pedestrians while older women were the slowest.
In light of the recent walking speed discussions within the NCUTCD, the U.S. Access Board, and elsewhere, the authors have provided walking speed recommendations based on the pedestrian data collected in this study. At locations with normal pedestrian population demographics (i.e., downtown areas, shopping areas, most neighborhoods, schools areas) or locations where the age or physical disability status of the pedestrian population is unknown, a 3.8 ft/s walking speed is recommended for timing pedestrian clearance intervals. When the proportion of pedestrians over the age of 65 exceeds 20, 30, 40, and 50 percent of the total pedestrians at a location, walking speeds of 3.6, 3.5, 3.4, 3.3 ft/s, respectively, are recommended. For intersections where nearly all of the pedestrians are over age 65, a walking speed of 2.9 ft/s is recommended. A 4.0 ft/s walking speed is appropriate only for locations with very few older pedestrians, hand-assisted children, or disabled persons (i.e., college campuses). The use of slower walking speeds for timing of pedestrian clearance intervals should not have an overly negative impact on signalized intersection efficiency as long as the cycle length is of sufficient length (i.e. ≥ 90 seconds), the crossing distance is not excessively wide, and the intersection is not at capacity.
One item that was not thoroughly investigated in the research presented here was the
ability for individual crossers to vary their walking speed. Future research should investigate the ability for individual pedestrians of various age groups and disability status to vary their crossing speeds based on the signal indication and/or threat of conflicting vehicles. This research will aid researchers in determining if pedestrians can cross at a more rapid pace if necessary. The impact of pedestrian countdown signals should also be included in any future investigations of pedestrian walking speed. The effect of age should be investigated in greater detail, as well, since pedestrians over the age of 65 observed in this and other studies are not necessarily a homogeneous group in terms of walking speed and mobility levels. Of particular interest is the approximate age at which most persons have begun to walk more slowly due to physical or other limitations. Finally, if changes are made to lower the MUTCD recommended walking speed, detailed analysis of the impact on traffic operations, both using micro simulation and field data, will be necessary.
TRB 2006 Annual Meeting CD-ROM Paper revised from original submittal.

Tim J. Gates, David A. Noyce, Andrea R. Bill, Nathanael Van Ee
20
REFERENCES 1. Dewarr, R.E. Chapter 2: Road Users. In Traffic Engineering Handbook (5th edition, J. Pline,
ed.). Institute of Transportation Engineers, Washington, DC, 1999. 2. Highway Capacity Manual. TRB, National Research Council, Washington, D.C., 2000. 3. Manual on Uniform Traffic Control Devices for Streets and Highways. Federal Highway
Administration, U.S. Department of Transportation, 2003. 4. McShane, W.R., R.P. Roess, and E.S. Prassas. Traffic Engineering (Second Edition).
Prentice Hall, Upper Saddle River, New Jersey, 1998. 5. Knoblauch, Richard L., Pietrucha, and Nitzburg, Marsha. Field Studies of Pedestrian
Walking Speed and Start-Up Time. In Transportation Research Record 1538, TRB, National Research Council, Washington, D.C., 1996, pp. 27-38.
6. Milazzo, J.S., N.M. Rouphail, J.E. Hummer, and D.P Allen. Quality of Service for
Interrupted-Flow Pedestrian Facilities in Highway Capacity Manual 2000. In Transportation Research Record 1678, TRB, National Research Council, Washington, D.C., 1999, pp. 25-31.
7. Coffin, A. and J. Morral. Walking Speeds of Elderly Pedestrians at Crosswalks. In
Transportation Research Record 1487, TRB, National Research Council, Washington, D.C., 1995, pp. 63-67.
8. LaPlante, J.N. and T.P. Kaeser. The Continuing Evolution of Pedestrian Walking Speed
Assumptions. In ITE Journal. Institute of Transportation Engineers, Washington, D.C., September 2004, pp 32-40.
9. Traffic Control Devices Handbook. Institute of Transportation Engineers, Washington, D.C,
2001. 10. Draft Guidelines for Accessible Public Rights-of-Way. United States Access Board,
Washington, D.C. http://www.access-board.gov/rowdraft.htm. Accessed October 26, 2005. 11. Johnson R.A, and D.W. Wichern. Applied Multivariate Statistical Analysis (Fifth Edition).
Pearson Education Publishing, 2002. 12. SPSS Release 11.5. The SPSS Inc., Chicago, Illinois, 2002. 13. 2000 U.S. Census Demographic Profile Highlights. United States Census Bureau,
Washington, D.C. http://factfinder.census.gov/servlet/SAFFFacts?_sse=on. Accessed July 20, 2005.
14. Kaye, H.S., T. Kang, and M.P. LaPlante. Wheelchair Use in the United States. Disability
Statistics Center, University of California at San Francisco,
TRB 2006 Annual Meeting CD-ROM Paper revised from original submittal.

Tim J. Gates, David A. Noyce, Andrea R. Bill, Nathanael Van Ee
21
http://dsc.ucsf.edu/table.php?pub_id=1§ion_id=1&table_id=1 (Table 1), Accessed July 20, 2005.
15. “About the NFB”. National Federation of the Blind, Baltimore, Maryland.
http://www.nfb.org/aboutnfb.htm. Accessed July 20, 2005.
TRB 2006 Annual Meeting CD-ROM Paper revised from original submittal.