recommendations of school quality working group of school quality working ... school committee, the...
TRANSCRIPT

Recommendations of School Quality Working Group The School Quality Working Group (SQWG) was established by the Boston School Committee in May 2013 to continue the efforts of the External Advisory Committee (EAC) to identify the core indicators of school quality. The working group, originally Co‐Chaired by Meg Campbell and Hardin Coleman (Rahn Dorsey replaced Hardin Coleman when he was asked to be part of the Superintendent Search), was made up of 22 volunteer members who consistently met at least twice a month since May of 2013 and took their responsibility to the City, its’ students, and its’ community very seriously. Between committee meetings open to the public and a set of organized community touch points, the workgroup held over 40 meetings throughout sixteen months, continuously updated the BostonSchoolQuality.org website with up‐to‐date materials, and created online surveys to regularly obtain public input. The committee also examined the recommendations of the EAC, the BPS Policy on Eliminating the Achievement Gap, the work of the 2004‐2005 Quality Work Group appointed by the Boston School Committee, the Seven Essentials of Whole School Improvement, the Five Core Elements of Family and Student Engagement in BPS, and research of best practices in other large urban districts to guide their considerations. Acknowledging that work needed to be completed in multiple areas, the group split into three subcommittees (Metrics, Policy and Implementation, and Community Engagement) and charged themselves with the following:
‐ Metrics o Make recommendations on design of the quality measure (priorities, indicators,
metrics, etc.) o Determine how to weight and quantify the various components of the quality
measure ‐ Policy and Implementation
o Recommend policies for an overall reporting system for schools based on the quality measures recommended by the Metrics Subcommittee as well as other school quality preferences as identify by the Community Engagement Subcommittee.
o Make recommendations on other policy issues regarding use and implementation

‐ Community Engagement o Engage in a collaborative process with students, families, teachers, school
leaders, and community stakeholders to: Foster opportunities for input and feedback throughout the development
of school quality measurements and policies for an overall accountability system
Understand the mission of the SQWG and share information and on‐going process
Throughout the entire process, community engagement was critical. The group reached out to the community during several key moments of the Framework’s creation:
1. In the fall of 2013, 200 community members were engaged in a pilot to review potential measures of school quality and asked to give input on what might be missing.
2. At a series of community meetings in early 2014, more than 150 individuals (including students) gave their feedback on the draft set of domains and outcomes the SQWG had developed.
3. After an updated version of the Framework was drafted, the SQWG developed an online survey to collect input on which components of a quality school were most important. This survey was developed in multiple languages and was completed by over 400 people.
4. The Community Engagement subcommittee has continued to meet post SQWG vote to outline an ongoing strategy for stakeholder education. For the framework to be meaningful and useful messages to parents, school leaders, and the community has to be clear, impact on family’s needs to be thoroughly explained, and district initiatives must be aligned.
While no single measurement can ever capture the full range of characteristics that make a school “high quality” to each student or family, the SQWG has worked to develop a comprehensive School Quality Framework that looks at the broad range of measures of school quality. The Framework reflects both the quantitative and qualitative conceptions of quality. The below summary, Policy and Implementation document, and attached appendices are inclusive of the recommendation voted on unanimously by the SQWG on Wednesday, September 3, 2014. School Quality Domains Each school1 will be held accountable for 21 outcomes in the following five domains: Student Performance Teaching and Learning Family, Community and Culture
1 Schools will only receive a quality tier if they have state assessment metrics available.

Leadership and Collaboration Student Access and Opportunities See Appendix A for the full list of outcomes associated with each of the five domains. School Quality Metrics To measure progress towards these outcomes, a combination of performance and perception metrics have been identified for each outcome in the School Quality Framework2. Metrics were selected based on their reliability, relevance, and replicability as well as their distribution across schools, correlation with student achievement, and value across the City. There SQWG also recognized that there were outcomes the group intended to measure, but strong and reliable measures were not currently available. See Appendix B (1) for full list of School Quality metrics and weights. School Quality Attributes Based on analysis, most of the proposed Student Access and Opportunities metrics are not statistically sound. While BPS works to explore alternative ways to measure these outcomes in the future, the SQWG recommend this domain be tabled for the first version of the School Quality Framework. The SQWG also recommends that key opportunities/characteristics of schools are included in a list of attributes through DiscoverBPS. Using this platform, parents will be able to sort schools by characteristic as well as obtain specific information on school attributes through the school’s profile page. The committee also recommends the District continue to perform ongoing analysis on metrics to ensure the achievement and growth of students with disabilities, English language learners and low income students are appropriately represented throughout the Framework. See Appendix B for recommended metrics for exploration in the future (2), and list of current and suggested attribute list (3). Domain Weights The SQWG recommend the following weights be implemented for each domain area: DOMAIN WEIGHT
Student Performance 75%
Teaching and Learning 7.5%
Family, Community and Culture 10%
2 Not all metrics in the Quality Framework can be measured at each school level.

Leadership and Collaboration 7.5%
Student Access and Opportunities *
*As noted above, the SQWG recommends giving no weight to the Student Access and Opportunities domain until more reliable and replicable metrics can be explored. School attributes in which the group believed promoted access and opportunity will be available for parents to view on the DiscoverBPS website. Domain weighting will have to be revisited once quality metrics for the Student Access and Opportunities domain are available.
See Appendix C for description of how domain weights were decided. Growth vs. Proficiency There are a handful of metrics in the Student Performance domain that either measure student growth or student proficiency. Based on research from other large urban districts, community feedback, and SQWG values, the following is the recommended distribution of weights for these types of metrics. STUDENT PERFORMANCE METRICS WEIGHT
Growth 2/3
Proficiency 1/3
See Appendix D for description of how performance weights were decided. Calculating Metric Scores Based on State methodology as well as historical data, the SQWG recommends a school be given 0, 25, 50, 75, or 100 points for each metric applicable to them in the Framework. A document which outlines how these points are awarded for each metric is forthcoming. Tier Cut Offs Currently, to determine school tiers, schools are ranked only on the basis of their MCAS proficiency and growth scores, and then the list is divided into four equal parts. The top 25% of schools are considered Tier 1, the second 25% of schools Tier 2, and so on. The SQWG has developed a method of determining school tiers that looks at a more comprehensive set of measures and divides tiers based on absolute quality rather than quality relative to other schools.

The SQWG recommends that after each metric is given an index score and growth, proficiency, and domain weights are employed a school receives and overall Framework score between 1‐100 with the following tier cut‐offs QUALITY SCORE RANGE TIER
65+ 1
55‐65 2
45‐55 3
0‐45 4*
The cutoffs above provide a 10 point margin of error for schools to become Tier 1. Schools that score below 45 points are determined to be Tier 4: these schools are generally not showing progress towards targets. *The SQWG also recommends that regardless of Quality Score, any school determined by the State to be a level 4 or 5 will automatically be given Tier 4 status in the Quality Framework. Assignment vs. Snapshot Tier The SQWG was very conscious about how changes in Tiers may affect the schools on a choice list. The committee felt strongly that parents need consistency as well as up to date information. Because of this, the group proposes two types of tiers:
‐ Assignment Tier: Used to create school choice lists ‐ Snapshot Tier: Based on most up‐to‐date Quality score for a school.
Implementation The following are the SQWG’s recommendations on implementing the new School Quality Framework. Where can schools, parents, community members, etc. find information on School Quality?
‐ Implementation of the Quality Framework (including attributes and characteristics of schools) should be built into the existing school choice website, DiscoverBPS.
How often should tiers be updated based on the schools most recent data?
‐ Snapshot Tier: Updated annually using most recent school data and meant to give an up‐to‐date overview of quality at a school.
‐ Assignment Tier: Held constant for the first three years to allow adequate time to observe and evaluate the effects of the new assignment tiers.

Should Assignment Tiers be updated after three years? It is difficult for the SQWG to make recommendations on updating assignment tiers without more data on the effects of changes. The SQWG recommends the School Committee convene a stakeholder group to analyze the data from the first three years and determine the best method of updating assignment tiers. The following topics should be examined:
‐ Assignment Tiers o How much stability is there in the snapshot tiers from year to year? o Does the snapshot/assignment tier represent actual quality of the school? o What would the impact on transportation costs be if assignment tiers were
updated? o Should Tier cut‐offs be altered? o What would be the impact on predictability for parents?
‐ Grandfathering
‐ Metrics
o Reliability and relevance of metrics over time o Change of metrics with District change of assessments and/or evaluations o Can/should additional metrics be added to the Framework?
See attached Policy & Implementation document for full text of policy and implementation recommendations DiscoverBPS Recognizing the importance of sharing data transparently and the need to avoid overwhelming parents with too much information, the following is recommended based on the resources available to the District and the capacity to make changes to the DiscoverBPS website before school choice season begins:
‐ As much information as possible should be made publicly available to parents ‐ Terminology used in the data reports should be clearly defined ‐ Each school’s snapshot tier should be easy to find on the website ‐ The DiscoverBPS website should include a page of school‐specific information on quality
attributes and links to other relevant information ‐ Families should be able to sort schools based on a variety of characteristics ‐ The District should explore ways to make quality improvement plans more transparent ‐ BPS will work to ensure all families have access to information
See attached Policy & Implementation document for full text of policy and implementation recommendations
Communication The SQWG recommends continued community engagement with Principals, school leaders, teachers, parents, and the community in order for all stakeholders to interpret the Framework, as well as understand the process, recommendations, changes, and impacts of the new Quality School Framework. The group further recommends a simplified definition of school quality be developed and highlighted in each of these communications. School Committee Responsibilities The School Committee should continue to review school choice data annually to determine how well the Quality Framework is serving the community and whether its implementation should be modified. As necessary, the School Committee will ask external stakeholders to monitor the equity and impact of these changes to certify that the district is kept accountable for implementing the system faithfully and equitably. Next Steps/Key Dates
Week of September 8th: Recommendation to Superintendent and Cabinet for review
Week of September 8th: Quality Framework is explained to Network Superintendent’s and School Leaders
September 17th: SQWG presentation to Boston School Committee
Week of September 22nd: SQWG to hold at least one community meeting to begin explanation of Framework to Boston families
October 1st: Boston School Committee to vote on Quality Framework
November 1st: School choice season begins
Ongoing: o Schools, families, and community are given continued opportunities for
engagement o Boston School Committee ensures monitoring procedures are implemented
Please see Appendix E for full list of Quality Working Group Committee Members

Policy and Implementation Recommendations of the School Quality Working Group September 3, 2014 Introduction Throughout the process of examining and improving school choice in 2012‐2013, the Mayor’s External Advisory Committee on Student Assignment (EAC) heard from families across the city about the importance of school quality. From their comments and testimony, it became clear that school quality encompasses a wide range of measures. As part of its recommendation for a new system of school choice, the EAC proposed a four‐tiered system to rank schools based on students’ performance and growth on MCAS exams. However, recognizing that this was a temporary and insufficient way to measure school quality, the EAC also included several other recommendations related to school quality, including the creation of a separate task force to develop a more expansive way to look at quality. Based on this recommendation, the School Quality Working Group (SQWG) was established by the School Committee in May 2013 to continue the efforts to identify the core indicators of quality. While no single measurement can ever capture the full range of characteristics that make a school “high quality” to each student or family, the SQWG has worked to develop a comprehensive School Quality Framework that looks at a broad range of measures of school quality. The Framework will reflect both quantitative and a qualitative conceptions of quality.
The quantitative component, based on five core domains of school quality that are associated in research with student achievement, aggregates various measurements of school performance. Meanwhile, the qualitative component describes features or attributes of a school that may play a role in school quality for some families and students (such as school hours, after‐school programs, or athletics opportunities).

Purpose and Goals of the Quality Framework The School Quality Framework developed by the SQWG has several purposes. First, the Framework will inform school choice. The framework gives students and families a brief overview of key school characteristics, as well as easy access to more comprehensive information about a wide range of characteristics that they can use as a reference as they investigate their school choices. In addition, the domain scores will be incorporated as a part of the assignment process by helping to determine the potential school choices available to students. The overall measurement that schools receive on the five core domains will be used to place each school into an assignment tier. Students will have access to the closest two schools from the top‐quality assignment tier, the closest four schools from assignment tiers 1 or 2, and the closest six schools from assignment tiers 1, 2, or 3. Because of its role in determining these assignment tiers, the Quality Framework not only provides information to families, it also plays a fundamental role in determining school choices available to students. Second, in addition to informing the school choice process, the Quality Framework also ensures that there is transparency around school quality in order to promote greater public accountability. Using the range of qualitative and quantitative components of the Framework, all stakeholders will have the information they need to evaluate for themselves, based on their own values, the quality of any one school. By making clear where there are assets or gaps in student performance and student opportunities, the Framework will allow the community and Boston Public Schools to engage in more informed and focused conversations about school quality. In this way, the Framework serves as a powerful tool not only for students and families, but also for a variety of other stakeholders: teachers, school leaders, other school and district staff, community‐based organizations, potential funders and supporters, officials of the Commonwealth, and all Boston residents and taxpayers who wish to monitor the performance of their city’s schools. Beyond these two primary purposes, the Framework will also serve to educate stakeholders about the many aspects of school quality. By engaging in a year‐long discussion and incorporating the feedback of students, parents, and community members, the SQWG developed a broad‐based description of quality that goes well beyond test scores. We hope that the Framework will help to broaden stakeholders’ thinking about the many factors that others view as important to school quality. Furthermore, while it has not been part of the core charge of the SQWG to determine follow‐up actions to improve or sustain school quality, we expect that the Quality Framework will be an important tool to inform school and district‐level decision‐making and to identify successes to be shared and areas for targeted support at the school and district levels. Relation to State Accountability System While the Quality Framework will serve a number of important purposes, it is not the sole accountability measure that applies to schools in BPS. Schools will continue to receive a state‐designated “accountability and assistance level,” ranging from level 1 to level 5. The Massachusetts Department of Elementary and Secondary Education determines a school’s level by examining the school’s progress toward narrowing proficiency gaps on the state MCAS exams in English language arts, mathematics, and science. Both proficiency rates and growth on MCAS factor into a school’s level designation, as do dropout and graduation rates for high schools. Although State accountability and assistance levels may offer less information about schools than the Quality Framework, which is based on several years of community conversations about quality and looks

at many more measures than the state’s accountability system, we recognize that state accountability and assistance levels must and will continue to impact district decision‐making, particularly decisions about how to address low performance in schools designated at lower accountability and assistance levels. Therefore we recommend that, regardless of Quality Framework score, any school receiving a State accountability level of 4 or 5 remains a tier 4 school for assignment and snapshot purposes. Developing the Quality Framework In developing the Quality Framework, the School Quality Working Group was guided by previous conversations and existing documents related to school quality. In particular, the SQWG examined the recommendations of the External Advisory Committee on Student Assignment, the BPS Policy on Eliminating the Achievement Gap, the work of the 2004‐2005 Quality Work Group appointed by the Boston School Committee, the Seven Essentials of Whole‐School Improvement, and the Five Core Elements of Family and Student Engagement in BPS. The SQWG also learned about the district’s recent work to develop both a school performance index and student opportunity index and reviewed the efforts of other large urban districts to do the same. In the fall of 2013, the SQWG also engaged nearly 200 community members in a community engagement pilot to review potential measures of school quality and seek input on what might be missing. While using these sources to generate a list of quality measures, the SQWG organized into three subcommittees focused on different tasks. The charge of each subcommittee is outlined below.
Metrics Policy & Implementation Community Engagement
Make recommendations on design of the quality measure (priorities, indicators, metrics, etc.)
Determine how to weigh and quantify the various components of the quality measure
Recommend policies for an overall reporting system for schools based on the quality measures recommended by the Metrics Subcommittee as well as other school quality preferences as identified by the Community Engagement Subcommittee
Make recommendations on other policy issues regarding use and implementation
Engage in a collaborative process with students, families, teachers, school leaders, and community stakeholders to:
o Foster opportunities for input and feedback throughout the development of school quality measurements and policies for an overall accountability system
o Understand the mission of the SQWG and share information and on‐going progress
To develop the quantitative component of the Quality Framework, based on five core domains of school quality, the SQWG developed the following structure and common vocabulary to use in thinking and talking about each component of a quality measure. Most outcomes also have one or more Metrics, which are the specific data points that are available to measure schools’ progress toward outcomes. To develop this list of metrics, Boston Public Schools researched how other districts around the country measure school quality and compiled these into a list of nearly 150 potential metrics. Staff then assigned each metric a score by assessing three factors:
Reliability

Relevance Replicability
Using these scores, BPS staff created a refined list of top‐rated metrics, and members matched these with the appropriate outcomes to generate a draft of the Framework. While the internal analysis of metrics was progressing, in the first few months of 2014, the SQWG went back to the community to gather feedback on the draft set of domains and outcomes they had developed. At a series of community meetings, members of the SQWG talked to more than 150 attendees to explain the process of developing the Framework and gather feedback on what could be changed or adapted. Three of these meetings were with student groups so that their experiences and ideas inform the final Framework. Having assembled an updated version of the Quality Framework, the SQWG launched another round of community engagement meetings. In this round, SQWG members sought to learn which components of a quality school are most important to families in order to help develop recommendations for how to assign weights to the various categories. The SQWG developed an online survey to collect input on this question in multiple languages. In addition, SQWG members, BPS staff, and student volunteers talked to families at Parent University and encouraged attendees to complete the online survey. In all, the survey yielded 418 responses, including many responses in languages besides English. While the Quality Framework was being developed and shared with the community, SQWG members were also working to define the purposes of the Framework and to develop a set of recommendations on how it should be implemented and updated. These recommendations are described below in the section on “Implementing the Quality Framework.” These recommendations, along with the Quality Framework, were presented to the School Committee on June 4th and approved unanimously on June 18th. After the School Committee approval of the Quality Framework, BPS began collecting the final data for each metric and analyzing that data. Several metrics were recommended for exclusion at this point based on the lack of available data. All other metrics were examined to ensure that they met the following criteria for successful metrics:
Exposes meaningful differences between schools Measures the quality of the school rather than the characteristics of the school’s
population Correlates with student success Measures something substantially different from any other metrics Stays relatively stable from year to year
The results of these analyses, along with a recommendation on each metric, were presented to SQWG members at working groups and at a committee meeting in August. At the same time, the Office of Data and Accountability was working to determine appropriate cut‐offs for each metric based on defined targets. Targets come from various sources, including state guidelines and historical data. Using these cut‐offs, each metric score was converted to an index score of 0, 25, 50, 75, or 100, as shown below. By combining the index score for each metric, the quality index will be able to assign a single score to each school that can be used to determine a school tier.

In cases where there are currently no available metrics that are sufficiently reliable, relevant, and replicable to measure outcomes, the SQWG has offered recommendations on seeking and developing additional metrics (see p. 11). In particular, members emphasized the importance of developing reliable and relevant metrics to measure the Student Access and Opportunities domain, which currently lacks quantitative metrics that can factor into the final quality tier.
Although the Student Access and Opportunities domain does not currently include any metrics, and therefore will not be included in the calculation of the school quality tier, many student opportunities are included on the DiscoverBPS site for families to explore as they consider their school choices. Members prioritized their top choices from a list of potential new school attributes, and most of these attributes will appear on DiscoverBPS this fall. For instance, families will now be able to sort schools based on whether they offer before‐ and after‐school programs, guidance counselors, and inclusive programs, among other characteristics. While the analysis of each metric was proceeding, members were also able to compare how school quality scores are weighted in other districts and states in order to recommend a weight for each domain. Using this information and the results of the community survey, members shared their recommendations on how BPS should weigh each domain. In addition, members provided recommendations on how growth and proficiency metrics should be weighted within the Student Performance domain. These weights, along with the final list of metrics and an updated version of the policy statement, will be reviewed and approved by members before they are presented to the Superintendent’s office as the official recommendations of the School Quality Working Group. Implementing the Quality Framework At its inception, the School Quality Working Group was charged with determining a better measure of school quality for implementation starting in the fall of 2014. In keeping with this charge, the Quality Framework will be available to report school data on DiscoverBPS beginning in the 2014‐2015 school year (based on data collected the previous year). The SQWG recommendations for how to update school tiers and display data on school quality are described below. Updating School Tiers and Assignments Currently, to determine school tiers, schools are ranked on the basis of their MCAS scores and growth, and then the list is divided into four equal parts. The top 25% of schools are considered Tier 1, the second 25% of schools Tier 2, and so on. A key part of the charge of the School Quality Working Group is to develop another method of determining school tiers that looks at a more comprehensive set of measures and to divide tiers based on absolute quality (rather than quality relative to other schools). The SQWG is also responsible for recommending how often these tiers should be updated based on more recent school data. This requires balancing two important, but often conflicting, interests: transparency about school quality and predictability of school choices. If school tiers are updated more often, these tiers will better reflect the quality of the school, and school choices are more likely to offer a range of quality options (as intended by the Home Based plan). On the other hand, if school choices change too often, parents will face a constantly shifting list of school choices. This may lead to
0 points
25 points
50 points
75 points
100 points
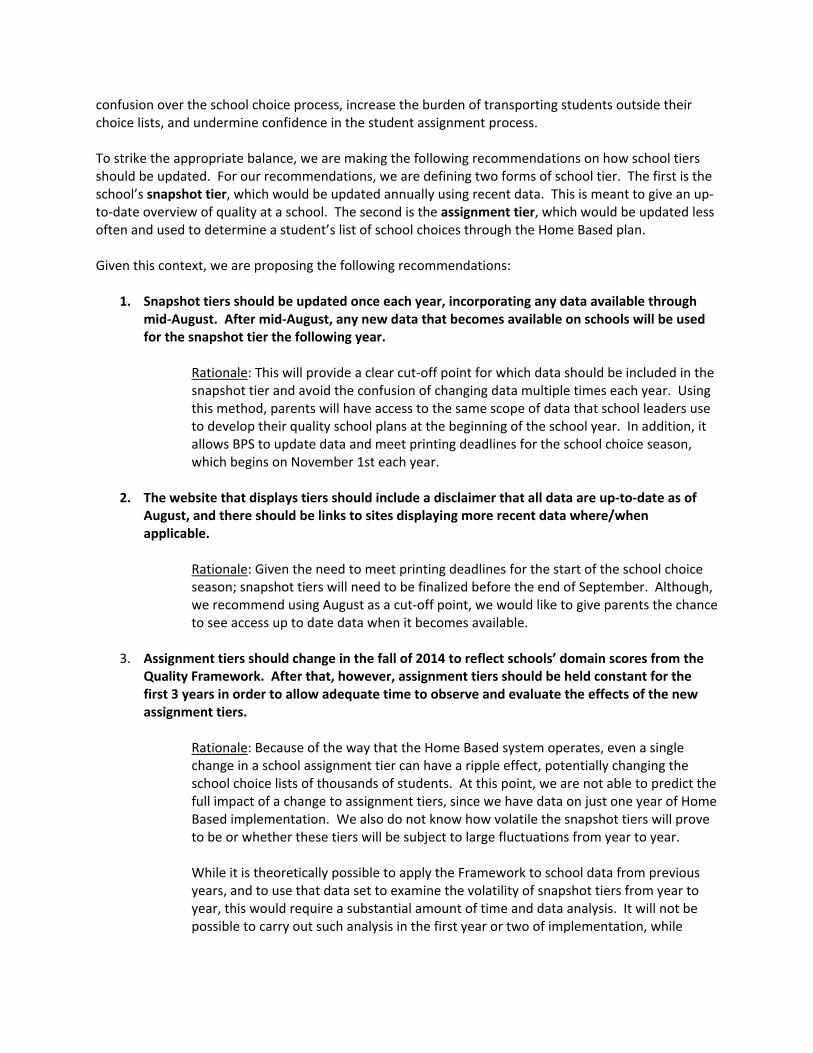
confusion over the school choice process, increase the burden of transporting students outside their choice lists, and undermine confidence in the student assignment process. To strike the appropriate balance, we are making the following recommendations on how school tiers should be updated. For our recommendations, we are defining two forms of school tier. The first is the school’s snapshot tier, which would be updated annually using recent data. This is meant to give an up‐to‐date overview of quality at a school. The second is the assignment tier, which would be updated less often and used to determine a student’s list of school choices through the Home Based plan. Given this context, we are proposing the following recommendations:
1. Snapshot tiers should be updated once each year, incorporating any data available through mid‐August. After mid‐August, any new data that becomes available on schools will be used for the snapshot tier the following year.
Rationale: This will provide a clear cut‐off point for which data should be included in the snapshot tier and avoid the confusion of changing data multiple times each year. Using this method, parents will have access to the same scope of data that school leaders use to develop their quality school plans at the beginning of the school year. In addition, it allows BPS to update data and meet printing deadlines for the school choice season, which begins on November 1st each year.
2. The website that displays tiers should include a disclaimer that all data are up‐to‐date as of August, and there should be links to sites displaying more recent data where/when applicable.
Rationale: Given the need to meet printing deadlines for the start of the school choice season; snapshot tiers will need to be finalized before the end of September. Although, we recommend using August as a cut‐off point, we would like to give parents the chance to see access up to date data when it becomes available.
3. Assignment tiers should change in the fall of 2014 to reflect schools’ domain scores from the Quality Framework. After that, however, assignment tiers should be held constant for the first 3 years in order to allow adequate time to observe and evaluate the effects of the new assignment tiers.
Rationale: Because of the way that the Home Based system operates, even a single change in a school assignment tier can have a ripple effect, potentially changing the school choice lists of thousands of students. At this point, we are not able to predict the full impact of a change to assignment tiers, since we have data on just one year of Home Based implementation. We also do not know how volatile the snapshot tiers will prove to be or whether these tiers will be subject to large fluctuations from year to year. While it is theoretically possible to apply the Framework to school data from previous years, and to use that data set to examine the volatility of snapshot tiers from year to year, this would require a substantial amount of time and data analysis. It will not be possible to carry out such analysis in the first year or two of implementation, while

simultaneously working to finalize the Quality Framework and develop mechanisms for calculating and displaying school tiers. Maintaining the same assignment tiers for the first 3 years will provide a substantial data set that we can use to evaluate the stability of the annual snapshot tiers and predict the likely effects of a change in assignment tiers. It will also offer greater predictability to parents as the new system is implemented.
4. In the fall of 2016, the School Committee should convene a stakeholder group to analyze the data from the past two years and determine the best method of updating assignment tiers. This new committee must be a diverse group of individuals representing different communities and bringing different perspectives on the work, and it must include BPS parents and teachers as well as other community members. Current SQWG members should be invited to participate in this group.
Rationale: As noted above, it is difficult for the SQWG to make recommendations on updating assignment tiers without more data on the effects of changes. However, we do not want a decision on a topic this critical to rest entirely with the school district. We believe there is real value in hearing from diverse voices in making this type of important decision, and therefore we recommend convening a stakeholder group that includes parents, teachers, and community representatives to examine the data and offer a final set of recommendations. It is also important to extend an invitation to current SQWG members, since they will understand the process that was used to develop the Quality Framework and the initial set of recommendations.
5. The stakeholder group that convenes to make a final recommendation on updating assignment tiers should examine at least the following topics:
Assignment Tiers: The key questions facing the group will be how often to update assignment tiers and how snapshot tiers should impact this decision. One proposal that has already been offered suggests looking at the range of tiers over the most recent five years and adjusting the assignment tier only if it falls outside of this range. It would also be possible to modify this proposal, such as by looking at the range over the most recent 3 or 4 years, or by changing assignment tiers earlier if the tier has stabilized two or more levels away from the assignment tier. Another possibility would be to change assignment tiers only if a school’s raw score on the domains has moved several points above the cut‐off for the next assignment tier. For example, if a school in assignment tier 2 scores 80 points, and the cut‐off for tier 1 schools is 75, then the school should be moved up to assignment tier 1; however, the same school should not be moved if it scores 76 points, just above the cut‐off. We recognize that there may be additional options and proposals after several years of implementation, and we would like the stakeholder group to develop the best possible proposal given available data. To help determine the best process for updating assignment tiers, we recommend that the stakeholder group consider at least the following criteria:

o How much volatility or stability is there in snapshot tiers from year to year? o How well does the snapshot tier represent the actual quality of a school, and do
snapshot tiers change in response to changes in quality? o What would be the impact on predictability for families and their ability to see
and evaluate school choices before their children reach school age? o What would be the impact on transportation costs of updating assignment
tiers?
Grandfathering: After assignment tiers change, many students are likely to end up attending a school that is no longer on their list of school choices. In addition, their younger siblings will be eligible (through sibling preference) to attend the same school as the older sibling, and therefore may also be attending a school outside the list of school choices. When it meets in 2016, the stakeholder group should examine whether and how to continue providing transportation for such students and their siblings as assignment lists change. The group must be aware of budget considerations as it considers this question, which is often one of the most difficult considerations in changing student assignment.
Quality Framework: Between now and the convening of the stakeholder group in 2016, the district should annually review the metrics in the Quality Framework to ensure that their continuing reliability and relevance. In particular, metrics should be changed if assessments or evaluations are no longer used, while additional metrics should be included when there are new or better ways to collect data. However, any changes to the domains and outcomes of the Quality Framework should take place only after discussion and recommendation by the stakeholder group, since this group will be able to incorporate community perspectives into the conversation.
Data Display and Implementation Implementation of the Quality Framework should be built into the existing school choice website, DiscoverBPS, which lists students’ school choices based on their addresses and provides more information about each school option. In recommending how data should be displayed on this site, we recognize both the importance of sharing data transparently and the need to avoid overwhelming parents with too much information. In addition, we recognize that implementing these recommendations, particularly in the short term, will depend on the resources available to the district and the capacity to make changes to the DiscoverBPS site before the school choice season begins. We propose the following recommendations on data display and implementation of the Quality Framework:
1. As much information as possible should be made publicly available to families, although most of this information should be available through links or attached reports in order to avoid overwhelming families with data.
2. Terminology used in the data reports should be clearly defined in order to make it more accessible for families. We recommend that any words defined elsewhere on the site be highlighted in some way, that the definitions appear close to the words themselves, or that

definitions appear when readers click on (or hover over) the word. This will avoid the need for parents to flip between pages repeatedly.
3. Each school’s snapshot tier should be easy to find on the website, and assignment tiers should
not be prominently displayed, so they do not distract from the snapshot tiers. Publicizing two alternate methods of categorizing schools would be confusing for families, and it might take focus away from the snapshot tier calculation (which includes the more recent data). There should be an explanation available on the website for parents who want to know more about how their school choice list was determined, but the assignment tier should not be prominently displayed or distract from the more up‐to‐date snapshot tier measurement. Any explanation of assignment tier should also describe when these tiers will be updated (and how they will be updated, once this has been determined).
At the same time, while snapshot tiers should be displayed on the website, it is crucial that parents use more than just the tier level to make their school choices. Parents should be encouraged to visit schools and to review additional information using the Quality Framework.
4. The DiscoverBPS website should include a page of school‐specific information for each school
to share information on school quality attributes as well as details on the metrics that have determined the school’s tier. The site should also include links for parents to access more information, including the following:
A breakdown of a school’s scores on the five domains of the Quality Framework
Quality School Plan
Climate Report
Environmental Report We also recommend that parents be able to access archived information on snapshot tiers and data reports from the past few years.
5. Neither the composite score of all domains nor individual domain scores should be represented as grades or through any grade‐like structure (e.g., color coding). Instead, domain scores should be included together with the overall range of scores for that domain and other helpful statistics (such as mean and median). A bar graph or other graphical representations would be helpful to identify where each school falls relative to other schools on each domain.
6. Families should be able to sort schools based on a variety of characteristics, including the
programs and supports the school offers (before‐ and after‐school programs, specific courses, school nurses, guidance counselors, key community partners). It is also important to be able to sort by school hours and distance from home, as well as by the types of physical facilities available (e.g., gymnasium, auditorium, etc.).
7. The district should explore ways to make quality improvement plans more transparent and to
integrate them into the school choice process. For instance, schools could post information about planned facilities upgrades or outreach to community partners as part of their school profiles. This will allow school leaders to respond to any concerns about particular subjects or domains while also increasing public accountability for reform.

8. The School Committee should continue to review school choice data annually to determine
how well the Quality Framework is serving the community and whether its implementation should be modified. This will ensure that the district is kept accountable for implementing the system faithfully and equitably. The School Committee and Boston Public Schools should also use the data from the Quality Framework on an ongoing basis to inform strategic planning and quality improvement efforts across the district, particularly to increase quality options in parts of the city where there are fewer high‐quality schools.
9. Boston Public Schools will work to ensure that all families have access to information on the
Quality Framework and changes to the student assignment system in their native languages and on an ongoing basis. Throughout this process, it will be crucial to maintain a focus on community engagement, such as by developing a family‐friendly version of the final domains for public display.
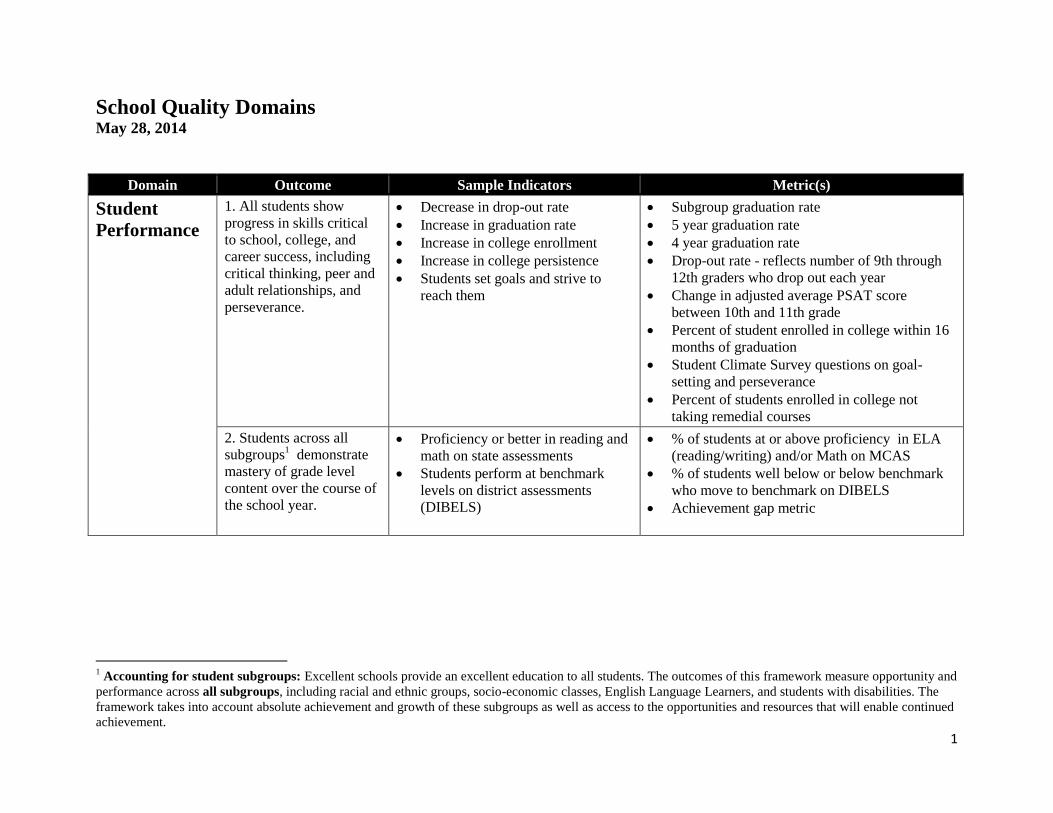
School Quality Domains The quantitative component of the full Quality Framework is attached, broken down into the following five domains:
Student Performance Teaching and Learning Family, Community, and Culture Student Access and Opportunities Leadership and Collaboration
Each of these domains is further divided into outcomes, which are associated with a number of sample indicators and metrics. A few outcomes in the Quality Framework, however, have no associated metrics that are available for all schools and that measure the outcome in a consistent and readily available way. In some cases, there may be metrics available that are not reliable, relevant, and replicable enough to be used; in other case, the methods of measuring the outcome have yet to be developed and brought to scale in a school system.
Therefore, in addition to recommending that BPS collect and analyze data on the metrics listed in the Quality Framework, we also recommend that BPS continue to seek appropriate metrics in the following areas. In particular, we emphasize the need to develop appropriate and reliable metrics in the Student Access and Opportunities domain, which is crucial to positive student development but is not currently included in a school’s overall quality score.
Outcome Recommendation
1. All students show progress in skills critical to school, college, and career success, including critical thinking, peer and adult relationships, and perseverance.
All metrics except climate survey data are High School‐based at the moment; we recommend developing additional metrics related to skill development that apply to all grades
We recommend looking at expanding pilot measures such as the Survey of Academic Youth Outcomes (SAYO) and the Holistic Student

Outcome Recommendation
Assessment (HSA), which are currently collected in just a few schools and grades. We recommend testing these measures to determine the merit of scaling use and data collection.
We recommend developing broader measures on postsecondary education and training that take into account other pathways besides college as well as student success in college (e.g., percent of students enrolled in remedial courses)
Improve methods of matching student PSAT data between 10th and 11th grades in order to measure the change in PSAT scores between these years. This data was not available in time for inclusion in the initial Framework, but may be possible to include in future iterations.
2. Students across all subgroups demonstrate mastery of grade level content over the course of the school year.
Seek additional metrics to measure reading comprehension at the early grades (K‐3)
4. All students are taught by highly effective, caring, and committed teachers.
Develop additional metrics to look more closely at “caring” component (e.g., percentage of students reporting that they have a relationship with a caring adult/teacher in the school)
6. All students are exposed to engaging and rigorous standards‐based curriculum designed to keep them on track for college and prepare them for careers.
Develop additional metrics to examine rigor of curriculum, particularly to capture additional data for students in grades K‐8 (right now, all measures except Algebra I and climate surveys are only for high schools)
7. Teachers focus on the development of skills alongside mastery of academic subject matter.
Develop metrics that can be used to measure skill development
8. The school is safe, well‐organized, and conducive to meeting educational goals.
Include a metric on the condition of BPS facilities after a Facilities Condition Needs Index is developed within the next 12‐18 months; current sources for facilities data use outdated or unreliable data collection mechanisms and are highly technical in nature
12. School demonstrates a culture of high achievement.
Develop additional metrics to evaluate culture of high expectations
13. All students have equal access to high‐quality activities that reinforce classroom learning and promote skill building and positive youth development.
Develop metrics on access to high‐quality activities inside and outside the classroom that reinforce learning and build skills; this may include metrics on opportunities in the arts, physical education, athletics, and other avenues for positive development
14. Students have access to health and social services.
Develop metrics on student supports, guidance, and social services, including (if possible) community

Outcome Recommendation
resources
15. Students have access to high‐quality out‐of‐school‐time programs and partners that provide students with a choice of opportunities that reinforce academics, build skills, and pursue their interests.
Develop methods of evaluating the quality of out‐of‐school programs. This might include the Assessing After‐School Program Practices Tool (APT), which is currently being piloted with several partner programs.
18. School leadership develops clear and effective structures for communication with families and within the school community.
Develop additional metrics on communication within the school community (especially between leadership and teachers)
21. School leadership appropriately manages financial resources.
Develop metrics on financial management
1
School Quality Domains May 28, 2014
Domain Outcome Sample Indicators Metric(s)
Student
Performance
1. All students show
progress in skills critical
to school, college, and
career success, including
critical thinking, peer and
adult relationships, and
perseverance.
Decrease in drop-out rate
Increase in graduation rate
Increase in college enrollment
Increase in college persistence
Students set goals and strive to
reach them
Subgroup graduation rate
5 year graduation rate
4 year graduation rate
Drop-out rate - reflects number of 9th through
12th graders who drop out each year
Change in adjusted average PSAT score
between 10th and 11th grade
Percent of student enrolled in college within 16
months of graduation
Student Climate Survey questions on goal-
setting and perseverance
Percent of students enrolled in college not
taking remedial courses
2. Students across all
subgroups1 demonstrate
mastery of grade level
content over the course of
the school year.
Proficiency or better in reading and
math on state assessments
Students perform at benchmark
levels on district assessments
(DIBELS)
% of students at or above proficiency in ELA
(reading/writing) and/or Math on MCAS
% of students well below or below benchmark
who move to benchmark on DIBELS
Achievement gap metric
1 Accounting for student subgroups: Excellent schools provide an excellent education to all students. The outcomes of this framework measure opportunity and
performance across all subgroups, including racial and ethnic groups, socio-economic classes, English Language Learners, and students with disabilities. The
framework takes into account absolute achievement and growth of these subgroups as well as access to the opportunities and resources that will enable continued
achievement.

2
Domain Outcome Sample Indicators Metric(s)
3. Students across all
subgroups demonstrate
academic growth towards
mastery of grade level
content.
Growth on state assessments
(MCAS) for all students
Growth on state assessments
(ACCESS) for ELL students
School's median SGP
Math and ELA median SGP by subgroup
Percent of students in 75th growth percentile by
subgroup
Median growth percentile for students who are
Proficient on MCAS
Median growth percentile for students who are
Warning/Failing on MCAS
Schoolwide change in CPI (for same cohort of
students)
% of ELL students at ELD Levels 1-3 who
progress on ACCESS test
Achievement gap metric
Teaching and
Learning
4. All students are taught
by highly effective,
caring, and committed
teachers.
Teachers are highly engaged
Teachers provide constructive
feedback to students and parents
Teachers use a variety of
assessments and modes of teaching
Teachers challenge students
Student Climate Survey questions on teacher
effectiveness
Teacher Climate Survey questions on teacher
skills and knowledge
Parent Climate Survey question on teacher
commitment to student learning
Number of National Board Certified Teachers
5. The school is led by
effective instructional
leader(s).
School leader sets clear
expectations for staff
School leader has high standards
for teaching
Teacher Climate Survey questions on school
leaders’ standards and expectations for teaching
6. All students are
exposed to engaging and
rigorous standards-based
curriculum designed to
keep them on track for
college and prepare them
for careers.
Students feel the school has
prepared them for further
education, careers, and personal life
Students are exposed to challenging
courses, including core academic,
elective, and advanced courses, as
well as experiential learning
opportunities
The school uses lessons based on
Common Core State Standards and
the MA curriculum frameworks
Percentage of students that felt the school
prepared them for further education,
employment, and personal life after high school
(from Senior Exit Survey)
% of eligible students enrolled in AP classes
Student Climate Survey question on preparation
for the next grade (or college)
Parent Climate Survey question on preparation
for the next grade (or college)
% of eligible 8th grade students enrolled in
Algebra I

3
Domain Outcome Sample Indicators Metric(s)
7. Teachers focus on the
development of skills
critical to college and
career success alongside
mastery of academic
subject matter.
Teachers adopt skills based lessons
for students
Family,
Community,
and Culture
8. The school is safe,
well-organized, and
conducive to meeting
educational goals.
The school is a healthy and well
maintained environment
The school has low number of
disruptive incidents.
School prevents bullying
Students, staff, and families feel
safe on school grounds and at
school events
Student Climate Survey questions on discipline,
consequences, and bullying prevention
Teacher Climate Survey questions on classroom
management and organization
Parent Climate Survey questions on feelings of
safety at school
Suspension/expulsion rate
Number of arrests of students at school
Environmental Conditions Index (air quality)
Number of trespatory notices issued to parents
Score on MSBA Facilities Condition Index
9. All students are
engaged and enthusiastic
about their classes and see
relevant connections
between academic lessons
and their own lives.
School decreases percent of chronic
absenteeism
School decreases percent of
students with low attendance rates
Students have a sense of pride in
their school
Students work hard to make good
grades and pay attention in class
Change in chronic absenteeism - percent of
students missing 10% of school a year for any
reason
Average daily attendance
Student Climate Survey questions on
engagement and enthusiasm for learning
Teacher Climate Survey questions on student
effort
10. Schools ensure all
families feel welcomed
and are involved in
activities that support their
child’s academic and
social growth.
Families are encouraged to and do
visit and participate at the school
Teachers work with families to help
them support student learning
Families are involved in school
decision-making
School staff develop productive
relationships with families
Teacher Climate Survey questions on parent
engagement in learning
Parent Climate Survey questions on
communication, accessibility, and decision-
making
Family Engagement Index (School Site
Councils, School Parent Councils, engagement
plans, etc.)

4
Domain Outcome Sample Indicators Metric(s)
11. The school promotes
inclusion of all students,
families and community
stakeholders so the school
community learns to
acknowledge, respect, and
build on social and
cultural differences.
Students and families of all
backgrounds feel included,
welcomed, and respected at the
school
The school engages students and
families of all backgrounds
School communicates effectively
with families and students from
diverse backgrounds
School environment and culture
reflect the diversity of students and
families
Parent Climate Survey questions on developing
thriving, inclusive schools, classrooms, and
communities
Staff diversity: % of teachers of color
12. School demonstrates a
culture of high
achievement.
School community has shared
expectations for student success
Teachers believe all students can
learn
Student Climate Survey question on teacher
expectations
Teacher Climate Survey questions on high
standards among school staff
Student
Access and
Opportunities
13. All students have
equal access to high-
quality activities that
reinforce classroom
learning and promote skill
building and positive
youth development.
Students are receiving arts
instruction throughout the year
Students participate in PE at school
School offers a variety of learning
experiences throughout the day
beyond the core academic subjects
% of students receiving arts instruction (weekly
instruction for students in grades K-8 and
meeting Mass Core requirement for students in
high school)
School meets guidelines for PE offerings
14. Students have access
to health and social
services.
School has a nurse on staff
School has approved health plan
School provides support for
students with learning and behavior
challenges
# of health care FTEs per 100 students
# of guidance counselor FTEs per 100 students
School has a Wellness Council and has
completed a wellness action plan
Parent Climate Survey question on support for
learning and behavior problems

5
Domain Outcome Sample Indicators Metric(s)
15. Students have access
to high-quality out-of -
school -time programs and
partners that provide
students with a choice of
opportunities that
reinforce academics, build
skills, and pursue their
interests.
Type of school partners and quality
of partner programs
School incorporates partners into
annual planning processes
(including Quality School Plans
and budgeting process)
Leadership
and
Collaboration
16. School leadership sets
a vision for the school that
actively engages teachers,
staff, students, families,
and the wider community
to be a part of the school’s
success
Students and parents feel supported
by school leader
Teachers take responsibility for
school improvement
Student Climate Survey questions on principal
effectiveness and outreach to students
Teacher Climate Survey questions on staff
engagement around school success
Parent Climate Survey question on principal’s
relationship with students
17. School leadership
creates a culture of
collaboration among all
staff members.
All staff exhibit a collective
responsibility for the success of all
students in the building
Staff members trust their peers and
school leader
Staff have time for collaborative
learning and planning
Teacher Climate Survey questions on staff
collaboration
18. School leadership
develops clear and
effective structures for
communication with
families and within the
school community.
Leadership fosters two-way
communication with families
Parent Climate Survey questions on regular and
effective communication

6
Domain Outcome Sample Indicators Metric(s)
19. School leadership
builds community
partnerships including
with local stakeholders
that expand learning
opportunities, promote
student well-being and
enable the school to
achieve its overarching
mission.
School leadership identifies
community partnerships for school
School leadership makes programs
available for students before and
after school
Student Climate Survey question on
opportunities to participate before and after
school
Parent Climate Survey question on community
partnerships
20. School leadership
retains and leverages
effective teachers.
School retains proficient and
exemplary teachers
School leader sets clear
expectations and high standards for
staff
School leader involves staff in
decision-making
Staff feel supported at school
School has low chronic staff
absenteeism
Teacher retention rate for proficient and
exemplary teachers
Chronic staff absenteeism
Teacher Climate Survey questions on support,
encouragement, and engagement with staff
21. School leadership
appropriately manages
and leverages resources.
School leadership effectively
oversees resources of time, space,
and money
School leadership chooses to invest
in programs and initiatives that
drive student success
Detailed Questions from Climate Surveys
Outcome Climate Survey Questions
1. All students show progress in
skills critical to school, college,
and career success, including
critical thinking, peer and adult
relationships, and perseverance.
(S) I set goals and work hard until I reach them
(S) I don't give up when something seems difficult
(S) I want to succeed in school because it will contribute to my future success

7
4. All students are taught by highly
effective, caring, and committed
teachers.
(S) My teacher(s) works hard to help me learn
(S) My teacher(s) does a good job letting me know how I am doing in class
(S) My teacher(s) is doing a good job
(S) My teacher(s) is fair to me
(S) I understand the lessons my teacher(s) teaches
(S) My teacher(s) requests student feedback/input on how the lesson went
(S) My teacher(s) provides daily opportunities for students to contribute in class
(S) My teacher(s) gives homework assignments
(S) My teacher(s) makes sure I understand what I am learning in class
(T) Teachers in my school are able to get through to the most difficult students
(T) Teachers in my school have the skills and knowledge to teach the subjects they are assigned to teach
(T) Teachers in my school use a variety of assessments to measure student learning
(T) If a child doesn’t learn something the first time, teachers here will try another way
(T) Teachers in my school are skilled in various methods of teaching
(P) My child’s teacher(s) challenges him/her to do their best work and works hard to meet the needs of
my child
5. The school is led by effective
instructional leader(s). (T) Your principal/headmaster makes clear to the staff his/her expectations for meeting instructional
goals
(T) Your principal/headmaster makes clear to the staff his/her expectations for educator performance in
the four standards of the rubric (I. Curriculum, Planning and Assessment; II. Teaching All Students; III.
Family and Community Engagement; IV. Professional Culture).
(T) Your principal/headmaster sets high standards for teaching
(T) Your principal/headmaster carefully tracks students’ academic progress
(T) Your principal/headmaster actively monitors the quality of teaching at your school
(T) Your principal/headmaster uses data to give teachers feedback about instruction
(T) Your principal/headmaster supports teachers in meeting their student learning and professional
practice goals
(T) Teachers in my school are really trying to improve their teaching
6. All students are exposed to
engaging and rigorous, standards-
based curriculum designed to keep
them on track for college and
prepare them for careers.
(S) My school is getting me ready for the next grade or college
(P) My child’s school is doing a good job preparing my child for the next level of school or college
8. The school is safe, well-
organized, and conducive to
meeting educational goals.
(S) The consequences for breaking the rules at my school are clear to me
(S) The consequences for breaking the rules at my school are fair
(S) Do other students treat you with respect

8
(S) Do other students tease you or make fun of you
(S) Do you ever feel bullied or threatened at school
(S) School is a place where I feel like I belong
(S) Students here are helpful to each other
(T) Your principal/headmaster has provided teachers with the appropriate process or training to deal
with student disciplinary problems
(T) Teachers in my school have the classroom management skills to help children learn
(P) My child’s school is doing a good job at preventing bullying and harassment based on race, gender,
sexual orientation, and disabilities
(P) My child feels safe at this school
(P) I feel safe when I go to my child’s school
(P) I understand the rules and requirements for student behavior at my child’s school
(P) My child feels safe on the school bus
9. All students are engaged and
enthusiastic about their classes and
see relevant connections between
academic lessons and their own
lives.
(S) The things I learn in school are valuable to me
(S) I usually look forward to my classes
(S) The classes I am taking will be useful in the future
(S) I work hard to make good grades on my assignments
(S) I pay attention in class
(S) When I am in class, I concentrate on doing my work
(S) When I am in class, I work as hard as I can
(S) It is important to succeed in my classes
(S) I am interested in learning new things
(S) I participate in class activities
(S) I complete homework assignments
(T) Students are willing to put in the work it takes to get good grades
(T) Students try hard to improve on previous work
10. Schools ensure all families are
involved and feel welcomed in
activities that support their child’s
academic and social growth.
(T) The parents of most of your students are active in the school’s parent organization
(T) Most of your students’ parents/guardians talk with you about their child’s grades
(T) Parents advocate for school improvement at this school
(P) My child’s teacher(s) keeps me informed about how my child is doing in school on a regular basis
(P) My child’s teacher(s) gives me very specific information about how well my child is doing in
meeting expectations, and what he/she needs to do to reach grade level proficiency
(P) My child’s school gives me information about what my child should be learning
(P) My child’s school schedules activities and events at times that I can attend
(P) The principal includes parents/families, the School Parent Council, and/or the School Site Council in
important decisions at the school (for example, school curriculum, policies, budget, use of Title I funds)

9
(P) My child’s school communicates with me in a language I can understand
(P) My child’s school makes a special effort to reach out to families who have trouble getting to the
school or who are uncomfortable in the school
11. The school promotes inclusion
of all students, families and
community stakeholders so the
school community learns to
acknowledge, respect, and build on
social and cultural differences.
(P) The principal is welcoming and respectful of all parents/families
(P) My child’s school makes me feel welcome whenever I visit
(P) My child’s school treats all parents/families/students fairly
(P) My child’s school promotes good relationships with parents/families
(P) My child’s school respects and values the diversity of the parents/families in the community
(P) If a parent of a child with a Special Education Individualized Educational Program (IEP): my school
is implementing the IEP and providing necessary support services (new in 2014)
(P) If a parent of an English Language Learner: my school is providing appropriate programs to help my
child learn English and succeed in his/her academic courses (new in 2014)
12. School demonstrates a culture
of high achievement. (S) My teacher(s) expects me to make good grades
(T) Teachers in my school really believe every child can learn
(T) Your principal/headmaster sets high standards for student learning
(T) Teachers in my school feel responsible for making sure that all students learn
16. School leadership sets a vision
for the school that actively
engages teachers, staff, students,
families, and the wider community
to be a part of the school’s success
(S) The principal wants to make things better at my school
(S) The principal cares about students
(S) The principal sets a good example for students
(S) The principal takes the time to talk with students about things besides discipline
(S) The principal asks students for their opinions on school issues
(T) Teachers accomplish their jobs with enthusiasm
(T) Your principal/headmaster communicates a clear vision for your school
(T) Teachers here take responsibility for improving the school
(T) Teachers in my school set high standards for themselves
(P) The principal knows my child and cares about his/her success
17. School leadership creates a
culture of collaboration among all
staff members.
(T) Teachers help and support each other
(T) Teachers respect the professional competence of their colleagues
(T) There is a great deal of cooperative effort among the staff members
(T) Teachers at this school collaborate to plan instruction
(T) Teachers at this school are eager to share information about what does and does not work in their
classrooms

10
18. School leadership develops
clear and effective structures for
communication within school
community.
(P) If there is a problem in school, I am notified quickly
(P) My child’s school provides effective parent-teacher conferences on a regular basis
(P) The principal is available to speak to me when I have questions or concerns
(P) The principal responds promptly to parents’ concerns
(P) My child’s school returns my phone calls and emails promptly
19. School leadership builds
community partnerships including
with local stakeholders that expand
learning opportunities, promote
student well-being and enable the
school to achieve its overarching
mission.
(S) There are opportunities for me to participate at my school before or after school (extracurricular
activities, clubs, sports, etc.)
(P) My child’s school has community partners who provide programs that my child can participate in
20. School leadership retains and
leverages effective teachers. (T) Your principal/headmaster treats all faculty members fairly
(T) The school administration’s behavior toward the staff is supportive and encouraging
(T) Your principal/headmaster involves the staff members before he/she makes important decisions
(T) Staff members are recognized by the school’s administration for a job well done
September 3rd, 2014
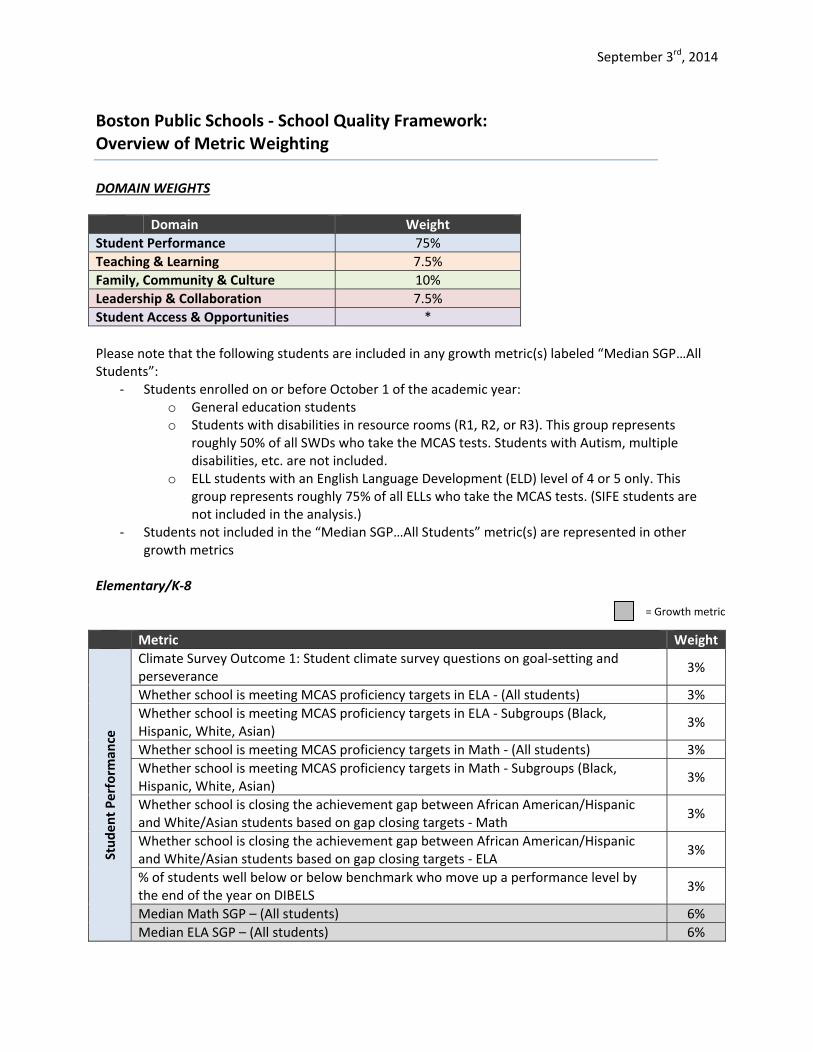
Boston Public Schools ‐ School Quality Framework: Overview of Metric Weighting
DOMAIN WEIGHTS
Domain Weight
Student Performance 75%
Teaching & Learning 7.5%
Family, Community & Culture 10%
Leadership & Collaboration 7.5%
Student Access & Opportunities *
Please note that the following students are included in any growth metric(s) labeled “Median SGP…All Students”:
‐ Students enrolled on or before October 1 of the academic year: o General education students o Students with disabilities in resource rooms (R1, R2, or R3). This group represents
roughly 50% of all SWDs who take the MCAS tests. Students with Autism, multiple disabilities, etc. are not included.
o ELL students with an English Language Development (ELD) level of 4 or 5 only. This group represents roughly 75% of all ELLs who take the MCAS tests. (SIFE students are not included in the analysis.)
‐ Students not included in the “Median SGP…All Students” metric(s) are represented in other growth metrics
Elementary/K‐8
Metric Weight
Student Perform
ance
Climate Survey Outcome 1: Student climate survey questions on goal‐setting and perseverance
3%
Whether school is meeting MCAS proficiency targets in ELA ‐ (All students) 3%
Whether school is meeting MCAS proficiency targets in ELA ‐ Subgroups (Black, Hispanic, White, Asian)
3%
Whether school is meeting MCAS proficiency targets in Math ‐ (All students) 3%
Whether school is meeting MCAS proficiency targets in Math ‐ Subgroups (Black, Hispanic, White, Asian)
3%
Whether school is closing the achievement gap between African American/Hispanic and White/Asian students based on gap closing targets ‐ Math
3%
Whether school is closing the achievement gap between African American/Hispanic and White/Asian students based on gap closing targets ‐ ELA
3%
% of students well below or below benchmark who move up a performance level by the end of the year on DIBELS
3%
Median Math SGP – (All students) 6%
Median ELA SGP – (All students) 6%
= Growth metric

September 3rd, 2014
Metric Weight
Median Math SGP – Subgroups (Black, Hispanic, Asian, White, Non‐resource room SPED)
6%
Median ELA SGP – Subgroups (Black, Hispanic, Asian, White, Non‐resource room SPED) 6%
Median growth percentile for students who are Proficient/Advanced on Math MCAS 6%
Median growth percentile for students who are Proficient/Advanced on ELA MCAS 6%
Median growth percentile for students who are Warning/Failing on Math MCAS 6%
Median growth percentile for students who are Warning/Failing on ELA MCAS 6%
Median growth percentile on ACCESS for English Language Learners who are at ELD levels 1, 2, or 3.
3%
Teaching &
Learning
Climate Survey Outcome 4: Parent, Teacher and Student climate survey results on whether all students are taught by highly effective, caring and committed teachers
2.5%
Climate Survey Outcome 5: Teacher Climate Survey results on whether school is led by effective instructional leader(s).
2.5%
Climate Survey Outcome 6: Parent and Student Climate Survey results on preparation for the next grade
2.5%
Family, C
ommunity & Culture Climate Survey Outcome 8: Student, parent and teacher climate survey on whether
school is safe, well‐organized and conducive to meeting educational goals. ~1.1%
Number of in‐ and out‐of‐school suspension rate1 ~1.1%
Average daily attendance ~1.1%
Climate Survey Outcome 9: Student and teacher climate survey results on whether students are engaged and enthusiastic
~1.1%
Climate Survey Outcome 10: Teacher and Parent climate survey results on whether schools ensure all families feel welcomes and are involved
~1.1%
Family Engagement Index (School Site Councils, School Parent Councils, engagement plans, etc.)
~1.1%
Climate Survey outcome 11: Parent climate survey results on whether school promotes inclusion of all students, families and community stakeholders
~1.1%
Staff diversity: % of teachers of color ~1.1%
Climate survey outcome 12: Student and teacher climate survey results on whether school demonstrates a culture of high achievement.
~1.1%
Leadership & Collaboration
Climate Survey Outcome 16: Student, Teacher and parent climate survey results on whether school leadership sets a vision for the school that actively engages the community
1.25%
Climate survey Outcome 17: Teacher climate survey results on whether school leadership creates a culture of collaboration among all staff members.
1.25%
Climate Survey Outcome 18: Parent climate survey results on whether school leadership develops clear and effective structures for communication with families and within the school community.
1.25%
Climate Survey Outcome 19: Student and parent climate survey results on whether school leadership builds community partnerships
1.25%
Teacher retention rate for proficient and exemplary teachers 1.25%
Climate Survey outcome 20: Whether School leadership retains and leverages effective teachers.
1.25%
1 Suspension rate metric is included for K‐8 schools; it is not included for schools that serve only elementary grades.

September 3rd, 2014
Middle Schools
Metric Weight
Student Perform
ance
Climate Survey Outcome 1: Student climate survey questions on goal‐setting and perseverance
~3.3
Whether school is meeting MCAS proficiency targets in ELA ‐ (All students) ~3.3
Whether school is meeting MCAS proficiency targets in ELA ‐ Subgroups (Black, Hispanic, White, Asian)
~3.3
Whether school is meeting MCAS proficiency targets in Math ‐ (All students) ~3.3
Whether school is meeting MCAS proficiency targets in Math ‐ Subgroups (Black, Hispanic, White, Asian)
~3.3
Whether school is closing the achievement gap between African American/Hispanic and White/Asian students based on gap closing targets ‐ Math
~3.3
Whether school is closing the achievement gap between African American/Hispanic and White/Asian students based on gap closing targets ‐ ELA
~3.3
Median Math SGP – (All students) ~6.5%
Median ELA SGP – (All students) ~6.5%
Median Math SGP – Subgroups (Black, Hispanic, Asian, White, Non‐resource room SPED)
~6.5%
Median ELA SGP – Subgroups (Black, Hispanic, Asian, White, Non‐resource room SPED)
~6.5%
Median growth percentile for students who are Proficient/Advanced on Math MCAS ~6.5%
Median growth percentile for students who are Proficient/Advanced on ELA MCAS ~6.5%
Median growth percentile for students who are Warning/Failing on Math MCAS ~6.5%
Median growth percentile for students who are Warning/Failing on ELA MCAS ~6.5%
Median growth percentile on ACCESS for English Language Learners who are at ELD levels 1, 2, or 3.
~3.3%
Teaching &
Learning
Climate Survey Outcome 4: Parent, Teacher and Student climate survey results on whether all students are taught by highly effective, caring and committed teachers
2.5%
Climate Survey Outcome 5: Teacher Climate Survey results on whether school is led by effective instructional leader(s).
2.5%
Climate Survey Outcome 6: Parent and Student Climate Survey results on preparation for the next grade
2.5%
Family, C
ommunity & Culture
Climate Survey Outcome 8: Student, parent and teacher climate survey on whether school is safe, well‐organized and conducive to meeting educational goals.
~1.1%
Number of in‐ and out‐of‐school suspension rate ~1.1%
Average daily attendance ~1.1%
Climate Survey Outcome 9: Student and teacher climate survey results on whether students are engaged and enthusiastic
~1.1%
Climate Survey Outcome 10: Teacher and Parent climate survey results on whether schools ensure all families feel welcomes and are involved
~1.1%
Family Engagement Index (School Site Councils, School Parent Councils, engagement plans, etc.)
~1.1%
Climate Survey outcome 11: Parent climate survey results on whether school promotes inclusion of all students, families and community stakeholders
~1.1%
Staff diversity: % of teachers of color ~1.1%
= Growth metric
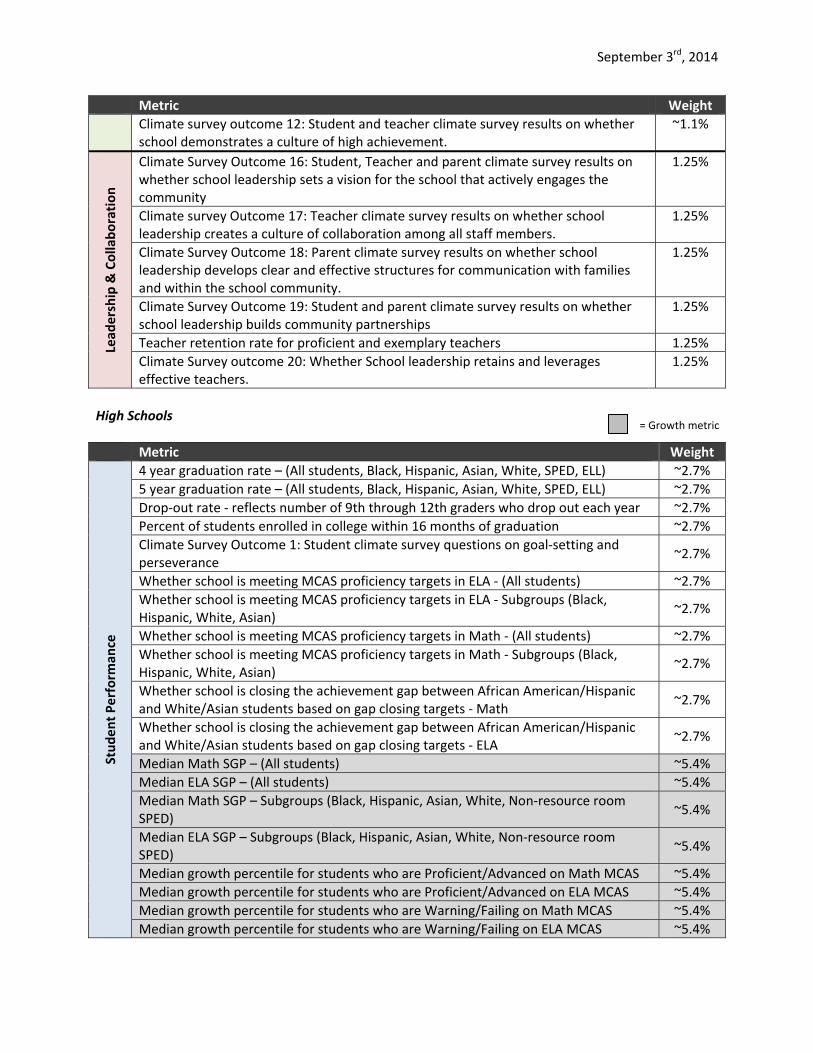
September 3rd, 2014
Metric Weight
Climate survey outcome 12: Student and teacher climate survey results on whether school demonstrates a culture of high achievement.
~1.1% Lead
ership & Collaboration
Climate Survey Outcome 16: Student, Teacher and parent climate survey results on whether school leadership sets a vision for the school that actively engages the community
1.25%
Climate survey Outcome 17: Teacher climate survey results on whether school leadership creates a culture of collaboration among all staff members.
1.25%
Climate Survey Outcome 18: Parent climate survey results on whether school leadership develops clear and effective structures for communication with families and within the school community.
1.25%
Climate Survey Outcome 19: Student and parent climate survey results on whether school leadership builds community partnerships
1.25%
Teacher retention rate for proficient and exemplary teachers 1.25%
Climate Survey outcome 20: Whether School leadership retains and leverages effective teachers.
1.25%
High Schools
Metric Weight
Student Perform
ance
4 year graduation rate – (All students, Black, Hispanic, Asian, White, SPED, ELL) ~2.7%
5 year graduation rate – (All students, Black, Hispanic, Asian, White, SPED, ELL) ~2.7%
Drop‐out rate ‐ reflects number of 9th through 12th graders who drop out each year ~2.7%
Percent of students enrolled in college within 16 months of graduation ~2.7%
Climate Survey Outcome 1: Student climate survey questions on goal‐setting and perseverance
~2.7%
Whether school is meeting MCAS proficiency targets in ELA ‐ (All students) ~2.7%
Whether school is meeting MCAS proficiency targets in ELA ‐ Subgroups (Black, Hispanic, White, Asian)
~2.7%
Whether school is meeting MCAS proficiency targets in Math ‐ (All students) ~2.7%
Whether school is meeting MCAS proficiency targets in Math ‐ Subgroups (Black, Hispanic, White, Asian)
~2.7%
Whether school is closing the achievement gap between African American/Hispanic and White/Asian students based on gap closing targets ‐ Math
~2.7%
Whether school is closing the achievement gap between African American/Hispanic and White/Asian students based on gap closing targets ‐ ELA
~2.7%
Median Math SGP – (All students) ~5.4%
Median ELA SGP – (All students) ~5.4%
Median Math SGP – Subgroups (Black, Hispanic, Asian, White, Non‐resource room SPED)
~5.4%
Median ELA SGP – Subgroups (Black, Hispanic, Asian, White, Non‐resource room SPED)
~5.4%
Median growth percentile for students who are Proficient/Advanced on Math MCAS ~5.4%
Median growth percentile for students who are Proficient/Advanced on ELA MCAS ~5.4%
Median growth percentile for students who are Warning/Failing on Math MCAS ~5.4%
Median growth percentile for students who are Warning/Failing on ELA MCAS ~5.4%
= Growth metric

September 3rd, 2014
Metric Weight
Median growth percentile on ACCESS for English Language Learners who are at ELD levels 1, 2, or 3.
3.75%
Teaching & Learning Climate Survey Outcome 4: Parent, Teacher and Student climate survey results on
whether all students are taught by highly effective, caring and committed teachers ~1.9%
Climate Survey Outcome 5: Teacher Climate Survey results on whether school is led by effective instructional leader(s).
~1.9%
Percentage of students that felt the school prepared them for further education, employment, and personal life after high school
~1.9%
Climate Survey Outcome 6: Parent and Student Climate Survey results on preparation for the next grade
~1.9%
Family, C
ommunity & Culture
Climate Survey Outcome 8: Student, parent and teacher climate survey on whether school is safe, well‐organized and conducive to meeting educational goals.
~1.1%
Number of in‐ and out‐of‐school suspension rate ~1.1%
Average daily attendance ~1.1%
Climate Survey Outcome 9: Student and teacher climate survey results on whether students are engaged and enthusiastic
~1.1%
Climate Survey Outcome 10: Teacher and Parent climate survey results on whether schools ensure all families feel welcomes and are involved
~1.1%
Family Engagement Index (School Site Councils, School Parent Councils, engagement plans, etc.)
~1.1%
Climate Survey outcome 11: Parent climate survey results on whether school promotes inclusion of all students, families and community stakeholders
~1.1%
Staff diversity: % of teachers of color ~1.1%
Climate survey outcome 12: Student and teacher climate survey results on whether school demonstrates a culture of high achievement.
~1.1%
Lead
ership & Collaboration
Climate Survey Outcome 16: Student, Teacher and parent climate survey results on whether school leadership sets a vision for the school that actively engages the community
1.25%
Climate survey Outcome 17: Teacher climate survey results on whether school leadership creates a culture of collaboration among all staff members.
1.25%
Climate Survey Outcome 18: Parent climate survey results on whether school leadership develops clear and effective structures for communication with families and within the school community.
1.25%
Climate Survey Outcome 19: Student and parent climate survey results on whether school leadership builds community partnerships
1.25%
Teacher retention rate for proficient and exemplary teachers 1.25%
Climate Survey outcome 20: Whether School leadership retains and leverages effective teachers.
1.25%

1
In addition to recommending that BPS collect and analyze data on the metrics listed in the
Quality Framework, we also recommend that BPS continue to seek appropriate metrics in the
following areas. In particular, we emphasize the need to develop appropriate and reliable metrics
in the Student Access and Opportunities domain, which is crucial to positive student
development but is not currently included in a school’s overall quality score.
Outcome Recommendation
1. All students show progress in skills critical
to school, college, and career success,
including critical thinking, peer and adult
relationships, and perseverance.
• All metrics except climate survey data are
High School-based at the moment; we
recommend developing additional metrics
related to skill development that apply to all
grades
• We recommend looking at expanding pilot
measures such as the Survey of Academic
Youth Outcomes (SAYO) and the Holistic
Student Assessment (HSA), which are
currently collected in just a few schools and
grades. We recommend testing these
measures to determine the merit of scaling
use and data collection.
• We recommend developing broader measures
on postsecondary education and training that
take into account other pathways besides
college as well as student success in college
(e.g., percent of students enrolled in remedial
courses)
• Improve methods of matching student PSAT
data between 10th and 11th grades in order to
measure the change in PSAT scores between
these years. This data was not available in
time for inclusion in the initial Framework,
but may be possible to include in future
iterations.
2. Students across all subgroups demonstrate
mastery of grade level content over the
course of the school year.
Seek additional metrics to measure reading
comprehension at the early grades (K-3)
4. All students are taught by highly effective,
caring, and committed teachers.
Develop additional metrics to look more closely
at “caring” component (e.g., percentage of
students reporting that they have a relationship
with a caring adult/teacher in the school)
6. All students are exposed to engaging and
rigorous standards-based curriculum
Develop additional metrics to examine rigor of
curriculum, particularly to capture additional

2
Outcome Recommendation
designed to keep them on track for college
and prepare them for careers.
data for students in grades K-8 (right now, all
measures except Algebra I and climate surveys
are only for high schools)
7. Teachers focus on the development of
skills alongside mastery of academic subject
matter.
Develop metrics that can be used to measure skill
development
8. The school is safe, well-organized, and
conducive to meeting educational goals.
Include a metric on the condition of BPS
facilities after a Facilities Condition Needs Index
is developed within the next 12-18 months;
current sources for facilities data use outdated or
unreliable data collection mechanisms and are
highly technical in nature
12. School demonstrates a culture of high
achievement.
Develop additional metrics to evaluate culture of
high expectations
13. All students have equal access to high-
quality activities that reinforce classroom
learning and promote skill building and
positive youth development.
Develop metrics on access to high-quality
activities inside and outside the classroom that
reinforce learning and build skills; this may
include metrics on opportunities in the arts,
physical education, athletics, and other avenues
for positive development
14. Students have access to health and social
services.
Develop metrics on student supports, guidance,
and social services, including (if possible)
community resources
15. Students have access to high-quality out-
of-school-time programs and partners that
provide students with a choice of
opportunities that reinforce academics, build
skills, and pursue their interests.
Develop methods of evaluating the quality of
out-of-school programs. This might include the
Assessing After-School Program Practices Tool
(APT), which is currently being piloted with
several partner programs.
18. School leadership develops clear and
effective structures for communication with
families and within the school community.
Develop additional metrics on communication
within the school community (especially
between leadership and teachers)
21. School leadership appropriately manages Develop metrics on financial management

3
Outcome Recommendation
financial resources.
The committee also recommends the district continue to perform ongoing analysis to ensure the
achievement and growth of students with disabilities, English language learners and low income
students are appropriately represented throughout the framework.

School Attributes: What is currently collected and reported? General Questions/School Distinctions:
What makes us special? (3,000 character max)
What is our school’s focus? (255 character max)
How are we preparing our students for educational success? (2,815 character max)
How do we engage families in our school community? (1,060 characters max)
What are your school’s characteristics? What are your school’s special features? Please list here those features that make your school stand out. These might include: College entry rates, pilot status, home visiting program, renovated gymnasium, grant funded programs, etc. (can enter up to 10 characteristics and 10 special features)
School Capsule Summary: Brief definition of school type and grade configuration. For example, Pilot School, grades K-8 or Innovation School, grades 6-12, etc. (675 characters max)
Major awards, honors and distinctions earned by your school, administrators, teachers and students. For each item, be sure to include: the name of the award, who presented it (usually, the name of an organization), the year it was presented (can enter up to 10)
Student Opportunities:
Key partners from the community, business, higher education, health and human services, and other sectors (can enter up to 10)
Any unique classes you offer, or if you prefer, curriculum guidelines per grade level, i.e. K1 uses the OWL curriculum, all freshmen take Algebra II, etc. (500 characters max)
Academic and enrichment activities that happen before or after school in the school building. State if the activity is free or, if not, what the fee is (by day, week, year). If the activity is restricted, who is eligible to participate? (875 characters max each for before and after school activities)
Selected academic courses and activities offered during regular school hours (High Schools only; 600 characters max)
Sports offered at your school (choice of 25 listed sports, plus space for 5 other sports) Facilities:
Auditorium Library
Playground Athletic Field
Science Lab Computer Lab
Pool Cafeteria
Music Room Art Room
Outdoor Classroom Gymnasium
Up to 3 others Other School Attributes:
Any languages that are spoken at your school. These are the languages you or your staff are able to communicate in with parents. (able to add up to 8 additional languages on top of the 8 standard languages used in district communications)
School uniform policy. What does that policy require? If the school has a uniform, please describe it below.

Top-Ranked Attributes from SQWG
Attribute ES/MS rank HS rank Action
Extended Learning Time 1 1 New category
Social Worker 2 1 New item
Guidance Counselor 5 1 New item
Inclusive Program 3 2 New item
Art (all disciplines) 5 4 New item (HS) and description (all)
Dual Language Program 4 5 New item
Parent Coordinator 3 -- New item
8th Grade Algebra I 5 -- (See below)
Recent Facilities Upgrades 5 -- Added to school description
Health Center/Health Resource Center -- 2 New item
Proximity to an MBTA Stop -- 3 (See below)
Experiential Learning Opportunities -- 4 Added to school description
Internships -- 5 New item
Dual Enrollment Opportunities -- 5 New item
Changes to DiscoverBPS: Adding category on Extended Learning Time
Before school (by grade, K-8)
After school (by grade, K-12) Changing “Health and Wellness” category to “Student Supports”
Full-time nurse
Social worker (grades 6-12)
Guidance counselor (grades 6-12)
Family Coordinator
Onsite Health Center (grades 9-12) Changing “AWC” category to “Programs”
AWC
Inclusion
Dual language
International Baccalaureate (grades 9-12)
Advanced Placement Classes (grades 9-12)
Dual Enrollment Opportunities (grades 9-12)
Internships (grades 9-12)
STEM (grades 6-12)
STEAM (grades 6-12)
Vocational (grades 9-12)
Technology (grades 6-12)
Health Careers (grades 9-12)
Visual Arts (grades 9-12)
Performing Arts (grades 9-12)

Adding category on World Languages (grades 6-12)
Spanish
French
Arabic
Chinese
Japanese
Sign
Other Adding content to Facilities category
Full Handicap Accessible
Adding categories to school descriptions
Describe here any recent facilities upgrades your school has had
Describe any visual or performing arts opportunities available to students
Describe any experiential learning opportunities students have (HS only)
Describe before- and after school programs offered on site, including fee structure. If programs are not available, please include information about what community programs your students often utilize.
**Note on Algebra I: While it would be possible to add Algebra I, our Engagement team believes that this would cause confusion among parents and lead to questions about why other classes are not included. Although Algebra I is a common “college readiness” benchmark, parents are generally not familiar with this status, and we would anticipate many questions about what other mat classes or English classes the school offers. We propose adding a question to the lists we share with parents of good questions to ask when researching schools. This would give us more of an opportunity to inform parents about why Algebra I is important. In addition, schools are already asked to describe any unique classes they offer or curriculum guidelines per grade level. We could include 8th grade Algebra I as an example of a good program to include in that description. **Note on Proximity to MBTA Stop: Since we don’t know which direction students will be coming from, or whether they may have access to a yellow school bus, we felt that it would be unnecessarily complicated to include an item on proximity to an MBTA stop. Instead, we hope to include a link to the MBTA trip planner for parents who are interested in learning more or planning a student’s route to school.

8
Weight of School Quality Domains
BOSTON PUBLIC SCHOOLS
8
BOSTON PUBLIC SCHOOLS
What makes a school high
quality?
Student Performance
75%
Teaching and Learning
7.5%
Family, Community, and Culture
10%
Student Access and
Opportunities*
Leadership and
Collaboration7.5%
*Most of the proposed Student Access & Opportunities metrics are not statistically sound based on our analysis
We will be exploring alternative ways to measure these outcomes in the future
Table this domain for the first version of the School Quality index

1
BOSTON PUBLIC SCHOOLS
10
BOSTON PUBLIC SCHOOLS
Growth to be weighed twice as much as proficiency
The Working Group took two polls to determine how growth and proficiency would be weighed in the new measure…
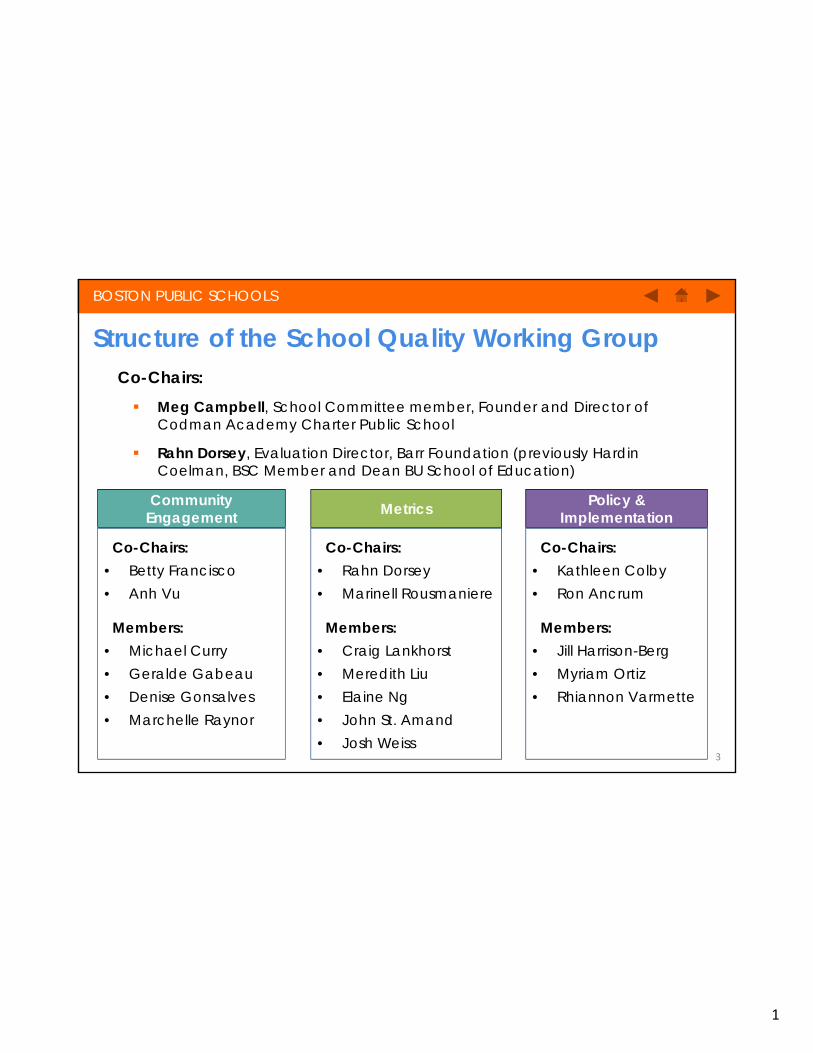
1
Structure of the School Quality Working Group
BOSTON PUBLIC SCHOOLS
3
Metrics
Co-Chairs:• Rahn Dorsey • Marinell Rousmaniere
Members:• Craig Lankhorst• Meredith Liu• Elaine Ng• John St. Amand• Josh Weiss
Policy & Implementation
Co-Chairs:• Kathleen Colby• Ron Ancrum
Members:• Jill Harrison-Berg• Myriam Ortiz• Rhiannon Varmette
Community Engagement
Co-Chairs:• Betty Francisco• Anh Vu
Members:• Michael Curry• Geralde Gabeau• Denise Gonsalves• Marchelle Raynor
Co-Chairs: Meg Campbell, School Committee member, Founder and Director of
Codman Academy Charter Public School
Rahn Dorsey, Evaluation Director, Barr Foundation (previously Hardin Coelman, BSC Member and Dean BU School of Education)