recommendations for federal transportation policy the …
TRANSCRIPT

The Role of DRivingin Reducing gHg emissions and oil consumption
Recommendations for Federal Transportation Policy

© 2011 World Resources Institute
Report by:Allison [email protected]
nAthAn [email protected]
RAdhA [email protected]
This report was made possible with funding from the Surdna Foundation and the Rockefeller Foundation.

iii Foreword
iv Executive Summary
01 Introduction
02 Part I: Assessing the Role of VMT in Achieving Oil Consumption and Greenhouse Gas Emissions Reductions
Methodology and Assumptions
Results and Discussion: Sustainable VMT per Capita
Conclusions
11 Part II: The Federal Surface Transportation Program
Impact of Existing Federal-Aid Transportation Programs on VMT, GHG Emissions, and Oil Consumption
Literature Review of Selected Transportation Strategies
Potential Funding for CLEAN-TEA Strategies Within the Existing Federal Program
Discussion
24 ConclusionsPolicy Recommendations
26 Appendix A: Notes on Methodology for VMT Scenarios
32 Appendix B: Results of Literature Review of Selected SAFETEA-LU Programs
CONTENTS
Copyright 2011 World Resources Institute. This work is licensed under the Creative Commons Attribution-NonCommercial-NoDerivative Works 3.0 License.
To view a copy of the license, visit http://creativecommons.org/licenses/by-nc-nd/3.0/

ii EMBARQ: The Role of Driving in Reducing GHG Emissions and Oil Consumption
The World Resources Institute is a global environmental think tank that goes beyond research to put ideas into action. We work with governments, companies, and civil society to build solutions to urgent environmental challenges. WRI’s transformative ideas protect the earth and promote development because sustainability is essential to meeting human needs and fulfilling human aspirations in the future.
WRI spurs progress by providing practical strategies for change and effective tools to implement them. We measure our success in the form of new policies, products, and practices that shift the ways governments work, companies operate, and people act.
We operate globally because today’s problems know no boundaries. We are avid communicators because people everywhere are inspired by ideas, empowered by knowledge, and moved to change by greater understanding. We provide innovative paths to a sustainable planet through work that is accurate, fair, and independent.
WRI organizes its work around four key goals:
People & Ecosystems: Reverse rapid degradation of ecosystems and assure their capacity to provide humans with needed goods and services.
Governance: Empower people and strengthen institutions to foster environmentally sound and socially equitable decision-making.
Climate Protection: Protect the global climate system from further harm due to emissions of greenhouse gases and help humanity and the natural world adapt to unavoidable climate change.
Markets & Enterprise: Harness markets and enterprise to expand economic opportunity and protect the environment.
In all its policy research and work with institutions, WRI tries to build bridges between ideas and action, meshing the insights of scientific research, economic and institutional analyses, and practical experience with the need for open and participatory decision-making.
The EMBARQ global network catalyzes environmentally and financially sustainable transport solutions to improve quality of life in cities.
Since 2002, the network has grown to include five Centers for Sustainable Transport, located in Mexico, Brazil, India, Turkey and the Andean Region, that work together with local transport authorities to reduce pollution, improve public health, and create safe, accessible and attractive urban public spaces. The network employs more than 100 experts in fields ranging from architecture to air quality management; geography to journalism; and sociology to civil and transport engineering.
EMBARQ is a member of the Bus Rapid Transit: Across Latitudes and Cultures (BRT-ALC) Centre of Excellence (www.brt.cl), funded by the Volvo Research and Educational Foundations.

EMBARQ: The Role of Driving in Reducing GHG Emissions and Oil Consumption iii
fOREwORD
FOREwORD
The transportation sector is a major source of U.S. greenhouse gas (GHG) emissions and their impact on global climate change. Transportation is a critical element of job creation, access to goods, and economic growth, which has led the federal government to play a key role in funding and regulating transportation in the United States. Therefore, federal transportation policy not only provides major opportunities to reduce GHG emissions and oil consumption, but also to catalyze economic growth.
The win-win opportunities presented by federal transportation policy are explored in this report. The Role of Driving in Reducing GHG Emissions and Oil Consumption: Recommendations for Federal Transportation Policy examines the underlying causes of GHG emissions and oil consumption from the transportation sector. The future transportation scenarios explored in the report show that reducing vehicle miles traveled (VMT) over the long term is key to reducing transportation emissions and oil consumption. The report then provides an overview of the existing federal transportation programs’ impacts on emissions and oil consumption. The good news is that the federal program analysis and future transportation scenarios both reveal that there are ample opportunities to reduce oil consumption and GHG emissions from passenger transportation in the United States, through strategies like public transit, biking, walking, rail, parking management, and telecommuting, to name a few.
We hope that this new research by EMBARQ, WRI’s Center for Sustainable Transport, illustrates the opportunity for U.S. policymakers to achieve multiple benefits by reorienting federal transportation funding and design. In order to create a system that promotes oil independence and reduced environmental impacts, Congress should authorize an updated federal transportation program that provides direct funding to
programs and strategies that reduce oil consumption and GHG emissions. This issue should not only be at the forefront of national legislators’ minds when transportation authorization legislation is taken up by Congress, but also as policymakers assess the impacts of oil dependence on the economy. Our report’s findings also have takeaways for transportation agencies and planners around the country, providing guidance on the types of transportation programs and strategies that can help achieve regional and state air quality, GHG emissions and oil independence goals. We hope that the combination of forward-looking scenarios and empirical evidence that we present will encourage cities to better utilize existing tools, programs, and strategies to reduce GHG emissions and oil consumption. Furthermore, we recommend that the U.S. Department of Transportation improve its technical assistance to support reductions in GHG emissions and oil consumption.
The United States should also be mindful of the increased investment in infrastructure — especially transit and rail — our economic competitors across the globe are pursuing; while the U.S. is no longer a leader in federal transportation investment and planning, we can and should strive to remain competitive in infrastructure planning for economic competitiveness. The United States is grappling for cost effective ways to reduce GHG emissions, reduce oil consumption and improve our economic competitiveness. Thankfully, this report shows that there are many reasonable and accessible ways to strategically alter the federal transportation program to support all of these goals. Given the urgency of the climate challenge, the need to reduce our dependence on oil and the efforts to strengthen our weakened economy, we hope that legislators seize this opportunity to makes these important changes.
Jonathan Lash President
iv EMBARQ: The Role of Driving in Reducing GHG Emissions and Oil Consumption
fOREwORDExECuTivE SummaRy
ExECuTivE SummaRy
TransPorTaTion rEPrEsEnTEd 71 PErCEnT of oiL ConsuMPTion1 and 31 percent of carbon dioxide (CO2) emissions2 in the United States in 2008. Therefore, federal transportation policy presents an opportunity to reduce both oil consumption and greenhouse gas (GHG) emissions. This report explores whether technology improvements alone can achieve oil consumption and GHG emissions reduction targets consistent with recent draft legislation and international climate negotiations. The report finds that the United States must achieve significant improvements in vehicle technology and reduce vehicle miles traveled (VMT) per capita (compared to business as usual projections for 2050, which anticipate a 40 percent increase in VMT per capita over 2010 levels) to meet these targets. With improvements to vehicle technology and reductions in per capita VMT, the United States would not need to import any oil by 2030.
The report also reviews evaluations of existing federal transportation programs for their impact on GHG emissions, oil use, or VMT and finds a general lack of evaluation for these metrics. For a wide variety of transportation strategies (e.g., public transit, pricing, parking management), the report finds evidence that they reduce GHG emissions, oil use, and VMT.
To achieve GHG emissions and oil use targets, the United States should modify federal transportation policy to prioritize investments that reduce VMT, GHG emissions, and oil consumption. The U.S. Department of Transportation (DOT) should—
1. Encourage states and regions to boost usage of existing funding flexibility to increase investments in transportation strategies that reduce VMT, GHG emissions, and oil use;
2. Provide technical support for standardized evaluation of programs and projects; and
3. Simplify public access to DOT’s project spending databases to promote evaluation of spending patterns and encourage transparency and accountability.
Congressional reauthorization of surface transportation funding should—
1. Establish national goals for transportation, including reducing GHG emissions and oil use, and track progress toward these goals.
a. Implement performance-based funding (tied to progress toward national goals).
b. Require or incentivize performance-based planning. Reserve or competitively distribute funding for states and regions that plan for GHG emissions reductions and/or oil savings.
2. Increase direct funding for programs and strategies that reduce GHG emissions, VMT, and oil consumption, in two ways:
a. Direct a larger portion of federal transportation funds toward programs that dedicate funding to, or achieve, reductions in GHG emissions, VMT, and oil use (e.g. CMAQ, SRTS, etc.); and
b. Directly fund transportation strategies that reduce VMT, GHG emissions, and oil use through set-asides or new programs.
Although the rate of technological progress, such as fuel efficiency improvements, is uncertain, these improvements are encouraged by federal incentives and standards. Similarly, the United States can ensure reductions in VMT, GHG emissions, and oil consumption by planning for and funding transportation and land use strategies that provide alternatives to driving. Transportation planning at the local, regional, and state level should incorporate strategies to reduce VMT in order to reduce GHG emissions and oil consumption. Planners and policymakers committed to reducing oil use and GHG emissions should encourage Congress to pass a reauthorization bill that incorporates the recommendations above.

EMBARQ: The Role of Driving in Reducing GHG Emissions and Oil Consumption 1
fOREwORD
iNTRODuCTiON
reducing oil consumption and GHG emissions,7 these are two key objectives that the transportation system should address.8 Most transportation experts agree that the U.S. needs to reduce vehicle miles traveled (VMT) per capita in order to reduce GHG emissions and oil consumption.9, 10
This report is divided into two parts: Part I presents the concept of “sustainable VMT,” an indicator of the amount of light-duty vehicle (LDV) travel per capita that can occur without compromising the goals of reducing GHG emissions and oil consumption. 11 Eight transportation scenarios are presented, each one showing the sustainable VMT levels associated with different GHG emissions and oil use reduction targets through 2050, based on varying assumptions about advances in vehicle technology. Part II explores whether federal transportation programs reduce VMT, GHG emissions, or oil consumption and whether existing transportation funding streams can be used to fund transportation strategies that reduce VMT, GHG emissions, and oil use. The report concludes with research questions and policy recommendations for how to improve the sustainability and efficiency of the U.S. transportation system.
TransPorTaTion in ThE uniTEd sTaTEs is aT a CriTiCaL JunCTurE: Roads, bridges, transit, and rail are poorly maintained and underfunded,3 and the surface transportation reauthorization bill, with its expected performance management and financial reforms, has been delayed far beyond the original expiration date of September 2009. There is widespread recognition by citizens, politicians, and transportation advocates that the current transportation system is unsustainable, both from a fiscal perspective (due to declining gas tax revenues) and from an environmental perspective (due to greenhouse gas [GHG] emissions and other pollution).
Transportation can play a pivotal role in the national response to the related challenges of climate change and oil dependence, as the transportation sector contributed 31 percent of U.S. GHG emissions in 20084 and 72 percent of U.S. oil consumption5 in 2009. In addition to concerns about the effects of climate change, the increasing costs of U.S. dependence on foreign oil—which totaled more than $500 billion in 2008, approximately 4 percent of the U.S. gross domestic product in that year6—have refocused the efforts of some policymakers on reducing oil consumption. Given the benefits that will accrue to the U.S. economy from
INTRODuCTiON
2 EMBARQ: The Role of Driving in Reducing GHG Emissions and Oil Consumption
fOREwORD
PART I
aSSESSiNG THE ROLE OF vmT iN aCHiEviNG OiL CONSumPTiON aND GREENHOuSE GaS EmiSSiONS REDuCTiONS
This report evaluates eight different U.S. transportation scenarios in order to show decision makers that there are opportunities—and challenges—in making federal transportation investments consistent with the goals of reducing oil consumption and GHG emissions. These scenarios show the likely need to reduce VMT in the future, prompting the question of whether existing transportation funding streams are set up to do so. This question is explored in Part II of this report.
Transportation-related oil consumption and GHG emissions are a function of several factors: the extent of vehicle use as measured in VMT, vehicle and operating efficiencies, and the oil use intensity or emissions intensity of the energy sources used to power vehicles. Policymakers, engineers, environmentalists, and industry officials have extensively debated the prospects of advances in low-carbon vehicle technology and the potential emissions reductions these advances might achieve.12 At the same time, it is understood that the oil saving and GHG emissions reducing benefits of potential technological advances will be offset if people continue to drive ever farther distances.13
The concept of "sustainable VMT" introduced in this paper establishes a framework in which to visualize the future of a transportation sector refocused on reducing oil consumption and/or GHG emissions. This analysis provides quantitative estimates of the maximum level of VMT possible among light duty vehicles (LDVs)14 from 2010 through 2050 if the United States is to achieve targets to reduce oil consumption and GHG emissions. The analysis covers LDVs—cars, vans, and light trucks,
BTU: British Thermal Unit
CAFE: Corporate Average Fuel Economy
CO2,CO2e:Carbon dioxide, carbon dioxide equivalent
CBD: Central Business District
CLEAN-TEA: Clean Low-Emissions Affordable New Transportation Efficiency Act
DOT: U.S. Department of Transportation
EPA: U.S. Environmental Protection Agency
FHWA: Federal Highways Administration
FTA:Federal Transit Administration
GT: Gigatons
GHG: Greenhouse gas
ITS: Intelligent transportation systems
LDV: Light duty vehicle
MMT: Million metric tons
MPG: Miles per gallon
MPO: Metropolitan Planning Organization
SAFETEA-LU: Safe Accountable Flexible Efficient
TransportationEquityAct:A Legacy for Users
VMT: Vehicle miles traveled
fREQuENTly uSEd ACRONyMS
PaRT 1
EMBARQ: The Role of Driving in Reducing GHG Emissions and Oil Consumption 3
PaRT i
which accounted for 62 percent of the oil consumed by the transportation sector in 2010 —but does not include air transportation, marine transportation, rail, or heavy duty vehicles.15
This analysis models eight transportation scenarios through 2050.16 Each scenario consists of one set of vehicle technology assumptions, one set of assumptions regarding either GHG emissions reductions or oil savings over time, and a corresponding projection of sustainable VMT per capita. There are two distinct sets of vehicle technology assumptions, referred to here as “moderate” and “optimistic.” The technology assumptions establish a projection for the oil use intensity and GHG emissions intensity of travel over time. The oil use intensity refers to the amount of oil consumed per mile traveled; similarly, GHG emissions intensity refers to the amount of greenhouse gases emitted per mile traveled. Thus, oil use intensity relates VMT to oil consumption, and GHG emissions intensity relates VMT to GHG emissions. Any reduction in GHG emissions caused by a change in VMT will also result in a reduction in oil consumption, and vice versa. (These implicit relationships between oil savings and GHG emissions reductions are detailed more explicitly in Appendix A.) The technology advances considered include greatly improved fuel economy of vehicles powered by internal combustion engines, as well as substantial electrification of the LDV fleet over time; this analysis does not assume significant fuel switching other than electrification. The moderate and optimistic vehicle technology assumptions are detailed in the methodology section and summarized in Table 3.
The next section provides an overview of various targets and technology assumptions and outlines the changes in VMT under each scenario. These changes are illustrated as a change in per capita VMT projected through 2050. The projected sustainable VMT represents the maximum amount of driving17 that will still allow the United States to reach the corresponding oil saving or GHG emissions reduction target in light of the assumptions about advances in technology. The scenarios are depicted in Figures 2 through 5 as sustainable VMT per capita to show the individual levels of driving implied by the analysis. Additional information on the goals, targets, and scenarios can be found in Appendix A. A results and discussion section follows the overview. The final section of Part I highlights policy implications of this analysis.
Methodology and Assumptions
OIl CONSuMPTION ANd GREENhOuSE GAS EMISSIONS REduCTION GOAlS ANd RESulTING ldV SECTOR TARGETS
The scenarios contain goals for oil consumption or GHG emissions between 2010 and 2050: two pertaining to oil savings (“Minimal Oil Imports” and “Zero Oil Imports”) and two pertaining to GHG emissions reductions (“Early Bird GHG” and “Slow and Steady GHG”). Table 1 introduces the four goals, which are based on proposed U.S. and international policy goals or recommendations, such as that of the Intergovernmental Panel on Climate Change for Annex I countries to reduce GHG emissions by 25 to 40 percent (relative to 1990 levels) by 2020 in order to stabilize atmospheric concentrations of CO2 at 450 parts per million.18 The rationale for each goal is given in Table 1. For use in the model, each of these broad oil saving or GHG emissions reducing goals was translated to percentage reductions relative to 2010 and applied proportionally as targets for the LDVs sector (Table 2). These reduction goals and targets are further detailed in Tables 1 and 2 and in Appendix A. (Table 1 conserves the originally stated points of reference; Table 2 quantifies the necessary reductions from a base year of 2010, as in the model itself as well as the remainder of this report.) For all targets, the expected change at the initial point of reference, 2010, is zero percent by definition. Between the points specified, the model uses straight-line projections, assuming subsequent incremental changes each year.
It is important to note that the Early Bird GHG reduction target is more ambitious than the Slow and Steady GHG reduction target, especially in the near term (through 2020). Both GHG reduction targets demand substantial reductions by 2050, (81 percent and 89 percent, respectively). In terms of their cumulative GHG emissions between 2010 and 2050, the Early Bird scenario would generate only about three quarters of the emissions of the Slow and Steady scenario. Recent research on climate change indicates that peak temperature is largely a function of cumulative GHG emissions over time.19 As a result of more ambitious targets in early years, the Early Bird GHG scenario would generate fewer cumulative emissions and would therefore be more helpful in the prevention of global warming than the Slow and Steady GHG scenario.

4 EMBARQ: The Role of Driving in Reducing GHG Emissions and Oil Consumption
PaRT i
VEhIClE TEChNOlOGy
This analysis assumes a gradual increase in electric vehicle usage between the years 2015 and 2050, based on a recent U.S. Environmental Protection Agency (EPA) report that provides moderate (21.5 percent) and optimistic (39.5 percent) forecasts of the percentage of
mileage accrued on vehicles sold in 2030 that will be electric-powered.20 It further assumes that this share will increase by 1 percent each subsequent model year in both forecasts.21 Emissions associated with the increased electrical use are included in our analysis, and emissions from the grid are assumed to decrease over time, reaching 80 percent reduction in emissions
SCENArIOTITLE COrrESPONDINGGOAL
MinimalOilImportsin2030
Reduce U.S. oil consumption by approximately 8 million barrels per day (from BAU projections) by 2030. This is a 7.3 million barrel reduction from current daily consumption. Based on the Oil Independence for a Stronger America Act (S. 3601).
ZeroOilImportsin2030 Reduce U.S. oil consumption by nearly 9 million barrels per day by 2030, bringing U.S. oil consumption from about 14 million barrels per day down to current levels of domestic production (5.3 million barrels per day) by 2030. This figure is based solely on the volume of existing domestic oil production and does not presume specific future oil sources.
EarlyBirdGHGreductions
Reduce U.S. GHG emissions by 32.5% by 2020 and 87.5% by 2050, relative to 1990 levels. Based on the Fourth Assessment Report of the Intergovernmental Panel on Climate Change Scenario A goal for Annex I countries to reduce GHG emissions by 25-40% by 2020 and 80–95% by 2050 in order to stabilize atmospheric CO2 at 450 ppm.a
SlowandSteadyGHGreductions
Reduce U.S. GHG emissions by 83% by 2050 relative to 2005 levels. Based on targets identified in H.R. 2454.b
Notesa. Gupta, S., D. a. Tirpak, N. Burger, J. Gupta, N. Höhne, a. i. Boncheva, G. m. Kanoan, C. Kolstad, J. a. Kruger, a. michaelowa,S.
murase, J. Pershing, T. Saijo, a. Sari, 2007: Policies, instruments and Co-operative arrangements. in Climate Change 2007: mitigation. Contribution of working Group iii to the Fourth assessment Report of the intergovernmental Panel on Climate Change.
b. american Clean Energy and Security act of 2009, H.R. 2454, 111th Cong., (2009)
Table 1 Economy-wide Goals for Oil Consumption and GHG Emissions Reductions
TArGETDESCrIPTION 2020(NEArTErM)TArGET 2030(MIDTErM)TArGET 2050(LONGTErM)TArGET
MinimalOilImportsin2030(Oil Reduction)
26% reduction (determined by a straight line projection from current level to 2030)
52% reduction; 1% reduction each year after 2030
72% reduction
ZeroOilImportsin2030(Oil Reduction)
31% reduction (determined by a straight line projection from current level to 2030)
63% reduction; 1% reduction each year after 2030
83% reduction
EarlyBirdGHGreductions(GHG Reduction)
41% reduction 57% reduction (determined by a straight line projection from 2020 to 2050)
89% reduction
SlowandSteadyGHGreductions(GHG Reduction)
12% reduction 36% reduction 81% reduction
Table 2 GHG and Oil Reduction Targets for LDVs (compared to 2010)

EMBARQ: The Role of Driving in Reducing GHG Emissions and Oil Consumption 5
PaRT i
per unit electricity by 2050.22 The WRI scenario analysis also assumes an improvement in the fuel economy of gasoline-powered LDVs. Under the moderate technology assumptions, new cars and light trucks achieve an average on-road performance of 40 miles per gallon (mpg) by 2030 and 50 mpg by 2050. Under optimistic technology assumptions,23 average on-road performance reaches 51mpg by 203024 and 75 mpg by 2050. These assumptions for mpg pertain only to the share of LDV vehicle mileage powered by conventional fuel (predominantly gasoline). Although it is difficult to speculate about vehicle efficiencies in the later years of this analysis, these assumptions are presented to paint a broad range of possibilities.
The assumptions described above apply only to the new vehicles sold each year between 2010 and 2050. In this analysis, the useful life of cars and light trucks from any given model year is assumed to be 13 years.25 The stated assumptions regarding on-road fuel economy of vehicles and the relative share of electric mileage among new vehicles each year provide for a rolling net effect on oil consumption per mile and emissions per mile for the fleet as a whole. The overall reductions in oil use intensity and emissions intensity of travel fleet-wide, relative to 2010, are illustrated in Figure 1.
Figure 1 shows that both the emissions intensity and oil use intensity of vehicle travel (on a per mile basis) decline rapidly during the first 15 years, due in part to the near-term ramp-up of fuel economy to 32 mpg by 2016; whereas in later years, the benefits from continued technological advances are more gradual.
The reductions in GHG emissions and oil use intensities of vehicle travel are similar but not identical. The lines illustrating oil use intensity and GHG emissions intensity diverge beginning in 2015, due to the gradual electrification of the vehicle fleet. This is because the increase in electric LDVs reduces both oil use intensity and GHG emissions intensity but affects GHG emissions less than oil use because each mile driven on electric power results in upstream emissions (from electricity generation) but virtually zero oil use. This divergence is greatest at around 2037; after this, the presumed declining emissions intensity of the electricity grid brings upstream emissions closer to zero, despite the growing share of mileage for electric vehicles.
The emissions intensity of travel is sensitive to assumptions about electric power generation. In this analysis, emissions associated with electricity drawn from the grid are assumed to decline gradually from a current nationwide average of approximately
Table 3 Assumptions for Vehicle Efficiencies and Electrification
FACTOr DEFINITIONNEAr/MIDTErM
FOrECASTLONGTErMFOrECAST
ModerateTechnologyAssumptions
Combustion engine vehicle efficiency (mpg)
On-road fuel economya of new cars powered by gasoline (mpg)
32 mpg by 2016; 40 mpg by 2030
50 mpg by 2050
Share of electric-powered Vehicle Mileage
Share of mileage from new cars that is electric-powered
Share of electric-powered mileage among new cars reaches 21.5% in 2030
Share of electric-powered mileage among new cars reaches 41.5% in 2050
OptimisticTechnologyAssumptions
Combustion engine vehicle efficiency (mpg)
On-road fuel economyb of new cars powered by gasoline (mpg)
32 mpg by 2016; 51 mpg by 2030
75 mpg by 2050
Share of electric-powered vehicle mileage
Share of mileage from new cars that is electric-powered
Share of electric-powered mileage among new cars reaches 39.5% in 2030.
Share of electric-powered mileage among new cars reaches 59.5% in 2050.
Notesa. This refers to the average fuel economy of all the new cars and light trucks sold in the u.S. in any given year between 2010 and 2050).b. This figure is contextualized by potential improvements in fuel economy assessed in a recent miT study: Bandivadekar, a. et al. (2008).
On the Road in 2035: Reducing Transportation’s Petroleum Consumption and GHG Emissions.

6 EMBARQ: The Role of Driving in Reducing GHG Emissions and Oil Consumption
PaRT i
0.21 gCO2e/Btu in 2010 down to 0.04 gCO2e/Btu by 2050. If one assumes that electric-powered LDVs are highly efficient, as this analysis does, and that the GHG emissions from generating electricity gradually decline, electrification of LDVs generally results in a net reduction in GHG emissions even after counting upstream emissions from electricity. However, if the emissions intensity of the electricity used to power electric vehicles does not improve beyond that of today’s grid, gasoline-powered vehicles could eventually be improved to emit less GHG emissions per mile than electric vehicles, and the net impact of electrification could potentially be an increase in GHG emissions.
Assumptions and methods for the model are explained in further detail in Appendix A.
Results and discussion: Sustainable VMT per Capita
The eight scenarios presented were modeled by pairing each of the four oil use and GHG emissions reduction targets with the two sets of vehicle technology assumptions in order to calculate the maximum change in VMT that can occur, relative to 2010, without exceeding the targeted level of oil consumption or GHG emissions.26 This maximum change in total VMT is then translated into sustainable VMT per capita, assuming an annual population growth rate of 0.9 percent.27 For example, if by 2016 there were a 14 percent reduction (compared to 2010) in average on-road fuel consumption per mile due to improved fuel economy
and no increase in the use of electric vehicles, and if the target is reducing oil consumption by 12 percent by 2016, the corresponding total VMT would be 102 percent of VMT levels in 2010. This suggests that, even if people drive slightly more than they do today, the target is still achievable. However, population growth outpaces this increase in total VMT, resulting in a sustainable VMT per capita that is only 97 percent of 2010 levels. This means that in 2016, VMT per capita would need to be 3 percent less than today in order to meet the oil consumption target. In each scenario, changes in sustainable VMT per capita are illustrated relative to 2010, meaning that the 100 percent line represents the level of VMT per capita in 2010.
The sustainable VMT per capita curves for the eight scenarios are presented in Figures 2 through 5. Each figure plots VMT per capita for two scenarios with a common reduction target but different technology assumptions. These figures can be interpreted as the maximum VMT per capita (compared to 2010 levels) that will contribute to achieving selected targets for oil savings or GHG emission reductions. To provide an alternative point of reference, the “business as usual” (BAU) growth in VMT per capita is also illustrated.28
Figures 2 through 5 show the eight potential scenarios for sustainable VMT per capita over time. Summarized in Table 4 is the sustainable VMT per capita for each scenario in 2050, as a percentage change relative to 2010. The lowest level of sustainable VMT per capita is generated by the Early Bird GHG plus moderate
figure 1 On-Road GHG Emissions and Oil Consumption (per mile) as a Percentage Relative to 2010 under Different Vehicle Technology Assumptions, 2010–2050
120%
100%
80%
60%
40%
20%
0%
GHG per Mile, Moderate Tech
Oil per Mile, Moderate Tech
GHG per Mile, Optimistic Tech
Oil per Mile, Optimistic Tech20
10
2012
2014
2016
2018
2020
2022
2024
2026
2028
2030
2032
2034
2036
2038
2040
2042
2044
2046
2048
2050
GHG
Emis
sion
s an
d Oi
l Con
sum
ptio
n, p
er M
ile
(Per
cent
age
Rela
tive
to 2
010)

EMBARQ: The Role of Driving in Reducing GHG Emissions and Oil Consumption 7
PaRT i
figure 2 BAU and Sustainable VMT per Capita under Minimal Oil Imports Scenarios
140%
120%
100%
80%
60%
40%
20%
0%
132%
68%
Moderate Tech Optimistic Tech BAU VMT per Capita
2010
2012
2014
2016
2018
2020
2022
2024
2026
2028
2030
2032
2034
2036
2038
2040
2042
2044
2046
2048
2050
Sust
aina
ble
VMT
per C
apita
(P
erce
ntag
e Re
lativ
e to
201
0)
figure 3 BAU and Sustainable VMT per Capita under Zero Oil Imports Scenarios
140%
120%
100%
80%
60%
40%
20%
0%
81%
42%
Moderate Tech Optimistic Tech BAU VMT per Capita
2010
2012
2014
2016
2018
2020
2022
2024
2026
2028
2030
2032
2034
2036
2038
2040
2042
2044
2046
2048
2050
Sust
aina
ble
VMT
per C
apita
(P
erce
ntag
e Re
lativ
e to
201
0)
figure 4 BAU and Sustainable VMT per Capita under Early Bird GHG Scenarios
140%
120%
100%
80%
60%
40%
20%
0%
38%
23%Moderate Tech Optimistic Tech BAU VMT per Capita
2010
2012
2014
2016
2018
2020
2022
2024
2026
2028
2030
2032
2034
2036
2038
2040
2042
2044
2046
2048
2050
Sust
aina
ble
VMT
per C
apita
(P
erce
ntag
e Re
lativ
e to
201
0)
8 EMBARQ: The Role of Driving in Reducing GHG Emissions and Oil Consumption
PaRT i
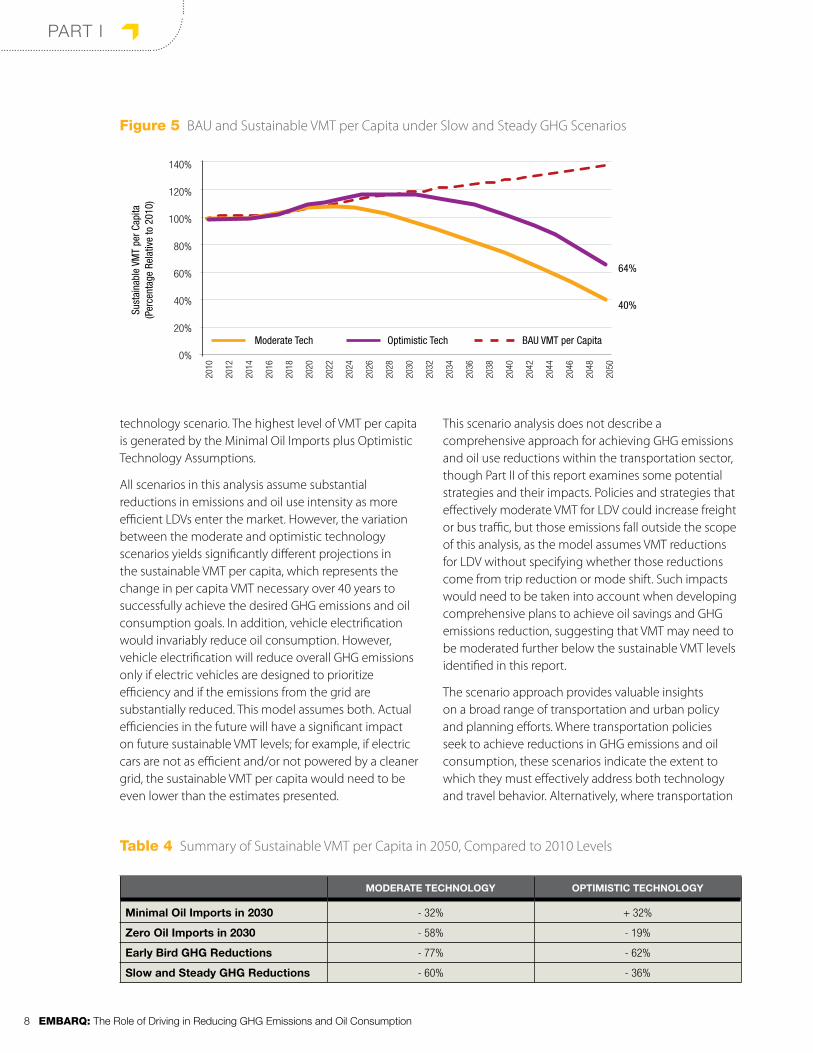
technology scenario. The highest level of VMT per capita is generated by the Minimal Oil Imports plus Optimistic Technology Assumptions.
All scenarios in this analysis assume substantial reductions in emissions and oil use intensity as more efficient LDVs enter the market. However, the variation between the moderate and optimistic technology scenarios yields significantly different projections in the sustainable VMT per capita, which represents the change in per capita VMT necessary over 40 years to successfully achieve the desired GHG emissions and oil consumption goals. In addition, vehicle electrification would invariably reduce oil consumption. However, vehicle electrification will reduce overall GHG emissions only if electric vehicles are designed to prioritize efficiency and if the emissions from the grid are substantially reduced. This model assumes both. Actual efficiencies in the future will have a significant impact on future sustainable VMT levels; for example, if electric cars are not as efficient and/or not powered by a cleaner grid, the sustainable VMT per capita would need to be even lower than the estimates presented.
This scenario analysis does not describe a comprehensive approach for achieving GHG emissions and oil use reductions within the transportation sector, though Part II of this report examines some potential strategies and their impacts. Policies and strategies that effectively moderate VMT for LDV could increase freight or bus traffic, but those emissions fall outside the scope of this analysis, as the model assumes VMT reductions for LDV without specifying whether those reductions come from trip reduction or mode shift. Such impacts would need to be taken into account when developing comprehensive plans to achieve oil savings and GHG emissions reduction, suggesting that VMT may need to be moderated further below the sustainable VMT levels identified in this report.
The scenario approach provides valuable insights on a broad range of transportation and urban policy and planning efforts. Where transportation policies seek to achieve reductions in GHG emissions and oil consumption, these scenarios indicate the extent to which they must effectively address both technology and travel behavior. Alternatively, where transportation
figure 5 BAU and Sustainable VMT per Capita under Slow and Steady GHG Scenarios
140%
120%
100%
80%
60%
40%
20%
0%
64%
40%
Moderate Tech Optimistic Tech BAU VMT per Capita
2010
2012
2014
2016
2018
2020
2022
2024
2026
2028
2030
2032
2034
2036
2038
2040
2042
2044
2046
2048
2050
Sust
aina
ble
VMT
per C
apita
(P
erce
ntag
e Re
lativ
e to
201
0)
MODErATETECHNOLOGy OPTIMISTICTECHNOLOGy
MinimalOilImportsin2030 - 32% + 32%
ZeroOilImportsin2030 - 58% - 19%
EarlyBirdGHGreductions - 77% - 62%
SlowandSteadyGHGreductions - 60% - 36%
Table 4 Summary of Sustainable VMT per Capita in 2050, Compared to 2010 Levels

EMBARQ: The Role of Driving in Reducing GHG Emissions and Oil Consumption 9
PaRT i
plans and policies seek to ensure robust access and mobility in light of an imperative to reduce GHG emissions and/or oil consumption, these scenarios may be helpful in quantifying potential constraints on VMT and informing the selection of transportation improvements and other planning decisions.
The relevance of these scenarios hinges on the plausibility of their assumptions and their applicability in the U.S. context. It is difficult, for example, to imagine a context where the most ambitious Early Bird GHG emissions reduction targets are pursued for transportation without also having optimistic expectations for technology improvements. Another question that arises is what happens in the transportation sector if the need to reduce national GHG emissions is met in large part by other sectors? For example, according to the EPA’s analysis of the American Clean Energy and Security Act of 2009,29 a large share of the proposed GHG emissions reductions was expected to come from the utility sector under an economy-wide cap on GHG emissions, and with a much smaller share from transportation. Furthermore, discussions of climate legislation in the U.S. Senate have recently focused on “energy only” proposals that would only seek to reduce emissions in the utility sector.30 In these cases, the need for substantial reductions in the transportation sector and among LDVs in particular may seem questionable. Under the same conditions (e.g. if all sectors’ combined annual GHG emissions were to be reduced on the order of 80 to 95 percent by 2050); however, there would not be much latitude for any one sector to compensate for underachievement in another. Transportation is even more important with respect to achieving oil consumption targets, as it accounts for 71 percent of U.S. oil consumption.31 Furthermore, as highlighted in Part II, transportation improvements can provide extensive societal and economic benefits that far outweigh the implementation costs, suggesting that looking to transportation for GHG emissions and oil use reductions for a portion of overall reductions is a smart move.
Conclusions
This analysis shows that, in the absence of extraordinary advances in vehicle technology, the United States cannot meet the modeled GHG emissions and oil use reduction targets from the transportation sector without a VMT reduction strategy. Projections for reductions in oil consumption and GHG emissions from
transportation must consist of reasonable expectations for the pace of vehicle technology advancement as well as for the extent of vehicle use (VMT). The current trend in VMT growth will most likely be incompatible with any of the targets for LDV oil savings and GHG emissions reductions discussed in this report. Furthermore, the analysis demonstrates that, especially when addressing the more ambitious targets for oil savings and GHG emissions reductions, actual improvements in vehicle technology will increase or reduce the need to moderate VMT. Across the scenarios, there is a broad range of sustainable VMT per capita by the year 2050, from +32 percent to -77 percent, relative to 2010.
In every scenario, even under optimistic technology assumptions and the less aggressive oil use and GHG emissions reductions, the United States will need to moderate per capita VMT relative to BAU projections. BAU projections predict VMT approximately 40 percent above 2010 levels in 2050.32 This is a plausible projection, because VMT per capita has increased by approximately 76 percent since 1970. Recently, however, the growth rate for VMT has slowed, even declining since 2005 when calculated per capita.33 Thus, BAU predictions may overestimate future VMT levels. Even with the optimistic assumptions about vehicle technology, three out of four scenarios show that VMT per capita must stay at, or decrease below, 2010 levels by 2050. The exception is the Minimal Oil Imports plus Optimistic Technology scenario, under which an increase in VMT per capita (compared to 2010 levels) is possible due to a large share of vehicle electrification, which reduces oil consumption. It is important to note, however, that an increase in electric vehicles does not achieve GHG emissions reductions equivalent to the magnitude of oil use reductions unless there are near-zero emissions from the grid that fuels these vehicles (see Figure 1 and Appendix A).
The shape of the sustainable per capita VMT curve has important implications for transportation investments over time. Infrastructure development is a gradual process, and making near-term modifications to funding priorities is one important way to reduce VMT over the long term. Some scenarios allow for a short period of growth in per capita VMT followed by an eventual need for reductions. It may be relatively easy to keep GHG emissions within the range of the Slow and Steady GHG target for the first two decades, given predictions in technological advances. However, after this time, the need for per capita VMT reductions could
10 EMBARQ: The Role of Driving in Reducing GHG Emissions and Oil Consumption
PaRT i
be significant. Strategic transportation improvements—such as bicycle, pedestrian, and transit infrastructure, car sharing and vanpooling programs, and pricing strategies—can lead to significant reductions in VMT, as discussed in Part II. The eventual downward arc for per capita VMT in most of the scenarios suggests that greater reductions may be necessary in later years. The sustainable VMT figures derived from these scenarios can help inform decisions regarding transportation
planning and urban growth, particularly with respect to whether or not proposed patterns of development are consistent with GHG emissions and oil use reduction goals. This is especially important because many of the strategies to reduce VMT entail deliberate planning and gradual development (and redevelopment) of the built environment34 aimed at providing current and future generations of travelers with multiple alternatives to driving.
EMBARQ: The Role of Driving in Reducing GHG Emissions and Oil Consumption 11
fOREwORD
PART II
THE FEDERaL SuRFaCE TRaNSPORTaTiON PROGRam
programs outlined in SAFETEA-LU)40 reduce VMT, GHG emissions, or oil consumption. Based on a literature review of existing SAFETEA-LU programs, we conclude that few have been evaluated for these metrics; however, where program evaluations do exist, they indicate reductions in VMT, GHG emissions and/or oil consumption..41 Environmental impacts, such as impacts on air quality and endangered species, of individual transportation projects are often evaluated as part of the planning and approval process, but these metrics are not typically evaluated at the program level.
To supplement the discussion of the federal-aid program, a literature review of transportation strategies (i.e., types of transportation projects) was conducted to determine if there was greater evaluation of GHG emissions, VMT, or oil use reductions at the strategy level. The transportation strategies reviewed are included in recent legislative proposals to reduce GHG emissions and/or oil consumption. Although the report explores the flexibility of transportation programs to fund the selected transportation strategies, it is unclear—due to a lack of sufficient data—whether these programs actually do fund the strategies (see the Discussion section for a more in depth examination of this lack of data). This report does not provide an in-depth analysis of all SAFETEA-LU programs for their impacts on VMT, GHG emissions, or oil consumption. Instead, it provides an overview of specific transportation programs and strategies aimed at reducing VMT, GHG emissions, or oil consumption. The report also reviews the programs in SAFETEA-LU for whether each can provide funding for the identified transportation strategies. This section ends with research questions, conclusions, and policy recommendations.
Federal surface transportation law explicitly states that it is in the national interest to minimize “transportation-related fuel consumption and air pollution” through the transportation planning process.35 Recent legislation has proposed adding GHG emissions to that list.36 The analysis in Part I shows that both improvements in vehicle technology and reductions in VMT (from BAU and also likely from current levels) are needed to achieve the GHG emissions or oil use reduction targets in the transportation sector suggested in recent legislative initiatives. However, federal-aid transportation funding from the most recent authorization, Safe Accountable Flexible Efficient Transportation Equity Act: A Legacy for Users (SAFETEA-LU), is not tied to planning criteria or performance standards, and transportation law does not require programs to evaluate their success in meeting the goals of reducing fuel consumption and air pollution. The overarching national interests identified are not translated into performance requirements.37 Rather, most transportation projects are evaluated and selected to accommodate projected increases in automobile travel, which is generally inconsistent with minimizing fuel consumption and air pollution.38 Instead of reducing VMT, this approach can encourage traffic growth, hinders environmental goals and places additional costs on society (e.g., air quality mitigation costs and the time value of increased congestion or increases in traffic-related fatalities).39 Congressional reauthorization of transportation funding presents an opportunity to increase funding for the SAFETEA-LU programs and transportation strategies that are effective at reducing VMT, oil consumption, and GHG emissions.
This section examines whether there is evidence that individual federal transportation programs (specifically,
PaRT ii
12 EMBARQ: The Role of Driving in Reducing GHG Emissions and Oil Consumption
PaRT ii
IMPACT Of EXISTING fEdERAl-AId TRANSPORTATION PROGRAMS ON VMT, GhG EMISSIONS, ANd OIl CONSuMPTION
This section reviews available literature to determine if there is evidence that existing surface transportation programs reduced vehicle miles traveled (VMT), GHG emissions, and oil consumption. Because this report focuses on the role of VMT in helping to achieve GHG emissions and oil use reduction targets, only three sections of SAFETEA-LU were considered: Title I - Federal-Aid Highways, Title III - Public Transportation, and Title IX - Rail Transportation, which are administered by the Federal Highway Administration (FHWA), Federal Transit Administration (FTA), and Federal Rail Administration (FRA), respectively.42 The review sought out evaluations, reports, or models for each program that had VMT, GHG emissions, or oil consumption as an evaluation metric.43 The search found evaluations of VMT, GHG emissions, and/or oil use impacts for only 6 of the 48 SAFETEA-LU programs reviewed. The literature available for these six programs is summarized below. In addition, Appendix B contains a listing the 48 programs reviewed, including a table showing whether literature indicating VMT, GHG emissions, or oil use impacts was found and whether each program supports the selected transportation strategies, as outlined in the next section.
There is a general lack of evaluation of SAFETEA-LU programs for the metrics reviewed. The fact that many of the programs reviewed had not been evaluated on these metrics does not mean that these programs do not reduce (or increase) VMT, GHG emissions, and/or oil consumption. Instead, it points to a lack of program evaluation for these specific metrics—an issue that is discussed in more depth at the end of this report. A handful of programs received evaluations concluding that they reduce VMT, GHG emissions, or oil use; but the
available data are too limited to make conclusions about the programs’ overall effects on the metrics reviewed. As many of the evaluations were limited in scope, it was impossible to provide consistent metrics (e.g. mmt or VMT) for each program; the findings are summarized in their original format.
SAfE ROuTES TO SChOOl
Safe Routes to School (SRTS), a program designed to improve bicycle and pedestrian connections and outreach to students so that they can safely bike and walk to school, was reviewed by the Safe Routes to School Task Force. The Task Force found that, for a typical one-school program, an increase in 100 students walking or biking to school reduced 32,976 pounds of CO2 emissions and saved 1,674 gallons of gasoline per year.44
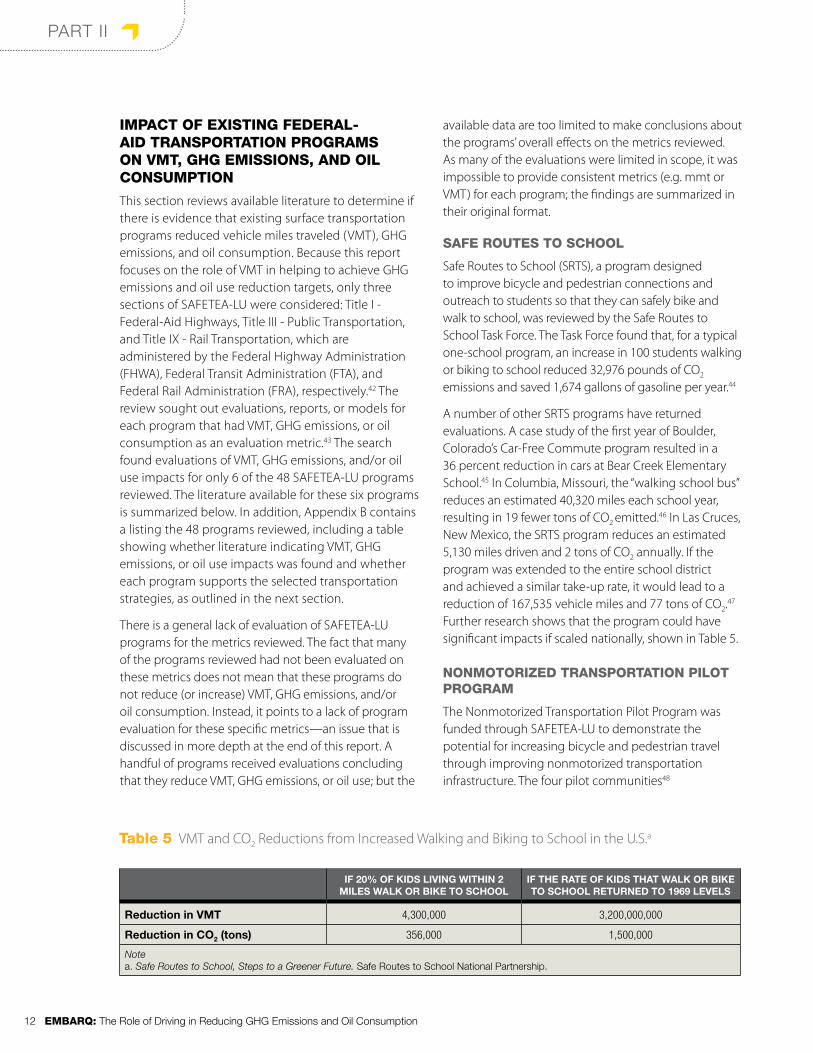
A number of other SRTS programs have returned evaluations. A case study of the first year of Boulder, Colorado’s Car-Free Commute program resulted in a 36 percent reduction in cars at Bear Creek Elementary School.45 In Columbia, Missouri, the “walking school bus” reduces an estimated 40,320 miles each school year, resulting in 19 fewer tons of CO2 emitted.46 In Las Cruces, New Mexico, the SRTS program reduces an estimated 5,130 miles driven and 2 tons of CO2 annually. If the program was extended to the entire school district and achieved a similar take-up rate, it would lead to a reduction of 167,535 vehicle miles and 77 tons of CO2.
47 Further research shows that the program could have significant impacts if scaled nationally, shown in Table 5.
NONMOTORIzEd TRANSPORTATION PIlOT PROGRAM
The Nonmotorized Transportation Pilot Program was funded through SAFETEA-LU to demonstrate the potential for increasing bicycle and pedestrian travel through improving nonmotorized transportation infrastructure. The four pilot communities48
IF20%OFkIDSLIVINGWITHIN2MILESWALkOrBIkETOSCHOOL
IFTHErATEOFkIDSTHATWALkOrBIkETOSCHOOLrETUrNEDTO1969LEVELS
reductioninVMT 4,300,000 3,200,000,000
reductioninCO2(tons) 356,000 1,500,000
Notea. Safe Routes to School, Steps to a Greener Future. Safe Routes to School National Partnership.
Table 5 VMT and CO2 Reductions from Increased Walking and Biking to School in the U.S.a
EMBARQ: The Role of Driving in Reducing GHG Emissions and Oil Consumption 13
PaRT ii
demonstrated 1 to 4 percent reductions in daily VMT, an estimated reduction of 0.5 miles daily per adult.49 The communities’ reductions in VMT due to walking and biking totals 156 million miles annually. Expansion of this program nationally can reduce VMT, GHG emissions, and fuel consumption.
VAluE PRICING PIlOT PROGRAM
The Value Pricing Pilot Program (VPPP) was established to test the effects on driver behavior, traffic volumes, and travel speeds of pricing projects to manage congestion. Evaluations of projects funded by the pilot include toll facility pricing in New Jersey, which found that variable tolling in 2001 resulted in 7.4 percent of auto users modifying their trips, including 20 percent of the “modifying” group shifting to transit.50 An additional project in Portland, Oregon, found that 14 percent of households that were charged rush hour fees had a household member switch to transit to save money. A Seattle, Washington, pilot project on pricing found that 80 percent of households reduced driving or shifted away from car travel.51,52
CONGESTION MITIGATION ANd AIR QuAlITy
The Congestion Mitigation and Air Quality (CMAQ) program funds projects that improve air quality by reducing congestion, travel demand, or emissions via technological solutions. A CMAQ evaluation report from 2008 evaluated 67 projects funded by CMAQ to determine their impacts on air quality and congestion.53 Although most of the evaluations focus on pollutants, such as volatile organic compounds (VOCs), oxides of nitrogen (NOx), carbon monoxide (CO) and particulate matter (PM), some of the projects reported VMT reductions as well. A high-occupancy vehicle (HOV) interchange project in Dallas, Texas, was estimated to reduce 2,929 vehicle trips per day by increasing transit and carpool rates. In Birmingham, Alabama, the regional rideshare program reduced 312 vehicle trips per weekday, or a total of 9,470 vehicle miles per weekday. In Pittsburgh, a travel demand management (TDM) program reduced 2,024 vehicle trips and 22,062 vehicle miles per day. A TDM program in Baltimore, Maryland, and Washington, D.C., reduces 3,000 vehicle trips or 84,000 vehicle miles per day. A representative sample of other projects was reviewed in the evaluation report. Of the bicycle programs reviewed, daily vehicle trips reduced ranged from 83 to 902. Of the transit projects evaluated, daily vehicle trips reduced ranged from 72
to 358. Many other CMAQ programs reduced emissions through technology or traffic flow changes.
JOB ACCESS ANd REVERSE COMMuTE PROGRAM
The Job Access and Reverse Commute (JARC) program is designed to help low-income people obtain and maintain employment by providing transportation options that get them from home to work and back, where traditional transit is not available. A review of 23 JARC programs found that 14.2 percent of JARC riders had switched to transit from personal automobiles. Large metro areas were at the low end of the spectrum, with 10.5 percent switching from autos to JARC, while in rural areas, the number was higher at 20.2 percent. 54,55
PAul S. SARBANES TRANSIT IN PARkS PROGRAM
The Paul S. Sarbanes Transit in Parks program, also known as the Alternative Transportation in Parks and Public Lands program, funds alternative transportation systems in national parks in order to reduce vehicle congestion; improve access; and protect the natural, cultural, and historical resources in parks. The Island Explorer bus in Acadia National Park in Bar Harbor, Maine, is estimated to have eliminated 10,258 tons of GHG emissions between 1999 and 2009 and prevented more than 1 million vehicle trips in the park.56 A shuttle bus program in Glacier National Park, Montana, reduced the volume of vehicles on the main road by 20 percent; while the system at Devils Postpile National Monument in Mammoth Lakes, California, reduced CO2e by an estimated 519,000 pounds.57 The report also documents CO2 reductions for a number of additional programs.
lITERATuRE REVIEW Of SElECTEd TRANSPORTATION STRATEGIES
Because the lack of programmatic evaluation makes it difficult to assess whether existing SAFETEA-LU programs reduce VMT, GHG emissions, or oil use, this section reviews transportation projects and strategies supported by those programs to assess their impact. Specifically, this report explored a set of strategies contained in recent legislative proposals, which originated in the Clean Low-Emissions Affordable New Transportation Efficiency Act (CLEAN-TEA) legislation introduced by Rep. Blumenauer as HR 1329 in 2009.58,59 These strategies are presumed to reduce GHG emissions and oil use, which is why they are included in climate
14 EMBARQ: The Role of Driving in Reducing GHG Emissions and Oil Consumption
PaRT ii
change proposals, including the Kerry-Lieberman draft American Power Act legislation,60 the Kerry-Boxer climate bill,61 and the Waxman-Markey climate bill.62 The following literature review was conducted to determine whether these strategies, which are already in use across the United States, can reduce GHG emissions, VMT, or oil consumption. The review finds that there is a growing body of evidence to support this presumption. Findings are summarized in their original format.
The following 11 specific transportation strategies to reduce transportation emissions are laid out in CLEAN-TEA:
1. Efforts to increase public transportation ridership;
2. Efforts to increase walking, biking, and other nonmotorized transportation;
3. Implementation of zoning and other land use regulations to support infill, transit-oriented development (TOD), and mixed use;
4. Travel demand management programs (including carpool, vanpool, or car-share projects); transportation pricing measures; parking policies; and programs to promote telecommuting, flexible work schedules, and satellite work centers;
5. Highway and transit operational improvements, including intelligent transportation systems or other operational improvements to reduce long-term oil consumption and greenhouse gas emissions through reduced congestion and improved system management;
6. Intercity passenger rail improvements;
7. High-speed rail improvements;
8. Intercity bus improvements;
9. Freight rail improvements;
10. Use of materials or equipment associated with the construction or maintenance of transportation projects that reduce oil consumption and greenhouse gas emissions; and
11. Public facilities for supplying electricity to electric or plug-in hybrid-electric vehicles.
Consistent with this report’s overall framework of evaluating reductions in VMT as a means to reducing GHG emissions and oil consumption, the literature review is focused on the first eight strategies, as they have the potential to reduce VMT.63
under the CLEaN-TEa proposal (and the legislative drafts that reference it), regions that develop transportation plans to achieve GHG emissions reductions would be eligible for new funding. The new funding is designed as an incentive and awarded largely on a competitive basis. Regions could also use the flexibility under existing federal aid programs to implement parts of the sustainable transportation plan that are not covered by the new competitive funding, leveraging federal funding for GHG emissions. additional, competitively awarded funding could be a powerful incentive for regions to adopt and implement long-range regional transportation
plans and short-term Transportation improvement Programs (TiPs) that would achieve goals of national importance,1 such as air pollution and oil use reductions (in addition to related goals like GHG emissions and vmT reduction). Through the regional planning criteria, CLEaN-TEa could help align transportation investments with the goals of oil savings and GHG emissions reductions. Existing federal-aid programs can fund projects that reduce or increase GHG emissions and oil consumption, but these programs generally lack objectives, guidance, and measurement.2 Programs structured like CLEaN-TEa can encourage regions to have a comprehensive,
sustainable regional transportation plan to reduce GHG emissions, vmT, and oil consumption and promote additional use of existing flexibility to fund transportation strategies that reduce vmT, GHG emissions, and oil consumption.
Notes1. H.R. 2724, 111th Cong. 2009. National
Transportation Objectives Act of 2009. Online at http://thomas.loc.gov/cgi-bin/query/z?c111:H.R.2724.IH:
2. Bipartisan Policy Center. 2009. Performance Driven: A New Vision for U.S. Transportation Policy. Online at http://www.bipartisanpolicy.org/sites/default/files/NTPP%20Report.pdf
hOW WOuld ClEAN-TEA MOdIfy ThE EXISTING fEdERAl-AId SuRfACE TRANSPORTATION PROGRAM?
EMBARQ: The Role of Driving in Reducing GHG Emissions and Oil Consumption 15
PaRT ii
EffORTS TO INCREASE PuBlIC TRANSPORTATION RIdERShIP
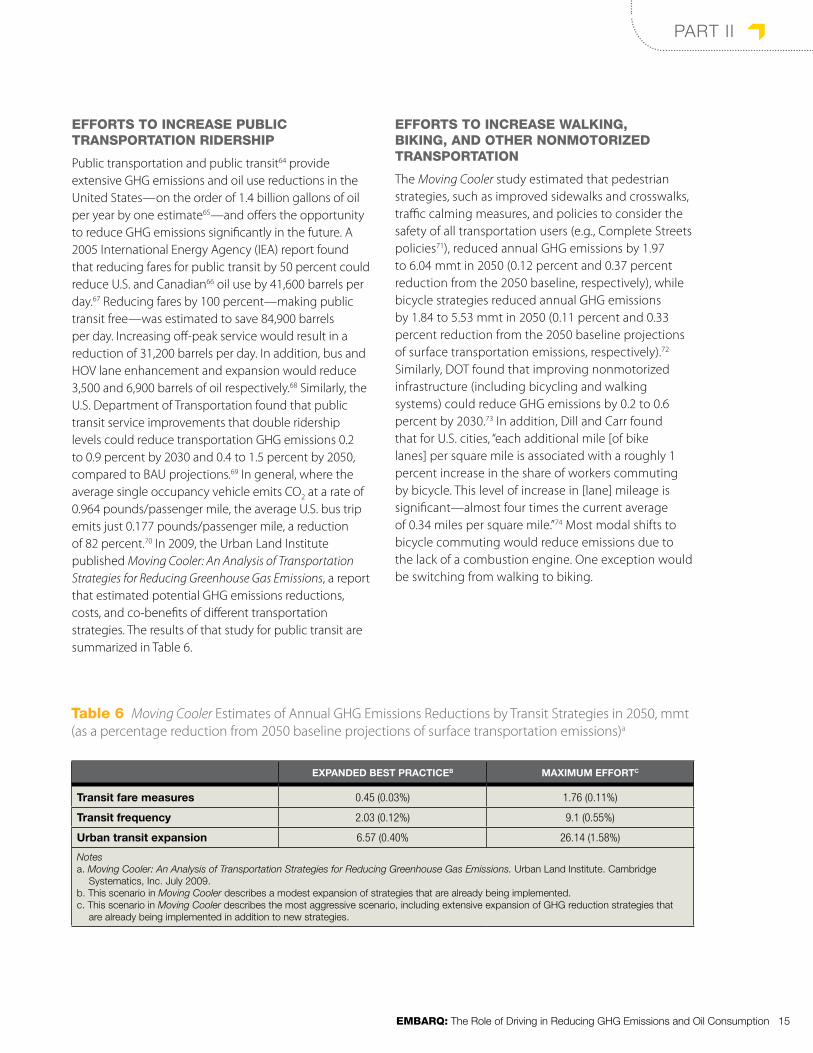
Public transportation and public transit64 provide extensive GHG emissions and oil use reductions in the United States—on the order of 1.4 billion gallons of oil per year by one estimate65—and offers the opportunity to reduce GHG emissions significantly in the future. A 2005 International Energy Agency (IEA) report found that reducing fares for public transit by 50 percent could reduce U.S. and Canadian66 oil use by 41,600 barrels per day.67 Reducing fares by 100 percent—making public transit free—was estimated to save 84,900 barrels per day. Increasing off-peak service would result in a reduction of 31,200 barrels per day. In addition, bus and HOV lane enhancement and expansion would reduce 3,500 and 6,900 barrels of oil respectively.68 Similarly, the U.S. Department of Transportation found that public transit service improvements that double ridership levels could reduce transportation GHG emissions 0.2 to 0.9 percent by 2030 and 0.4 to 1.5 percent by 2050, compared to BAU projections.69 In general, where the average single occupancy vehicle emits CO2 at a rate of 0.964 pounds/passenger mile, the average U.S. bus trip emits just 0.177 pounds/passenger mile, a reduction of 82 percent.70 In 2009, the Urban Land Institute published Moving Cooler: An Analysis of Transportation Strategies for Reducing Greenhouse Gas Emissions, a report that estimated potential GHG emissions reductions, costs, and co-benefits of different transportation strategies. The results of that study for public transit are summarized in Table 6.
EffORTS TO INCREASE WAlkING, BIkING, ANd OThER NONMOTORIzEd TRANSPORTATION
The Moving Cooler study estimated that pedestrian strategies, such as improved sidewalks and crosswalks, traffic calming measures, and policies to consider the safety of all transportation users (e.g., Complete Streets policies71), reduced annual GHG emissions by 1.97 to 6.04 mmt in 2050 (0.12 percent and 0.37 percent reduction from the 2050 baseline, respectively), while bicycle strategies reduced annual GHG emissions by 1.84 to 5.53 mmt in 2050 (0.11 percent and 0.33 percent reduction from the 2050 baseline projections of surface transportation emissions, respectively).72 Similarly, DOT found that improving nonmotorized infrastructure (including bicycling and walking systems) could reduce GHG emissions by 0.2 to 0.6 percent by 2030.73 In addition, Dill and Carr found that for U.S. cities, “each additional mile [of bike lanes] per square mile is associated with a roughly 1 percent increase in the share of workers commuting by bicycle. This level of increase in [lane] mileage is significant—almost four times the current average of 0.34 miles per square mile.”74 Most modal shifts to bicycle commuting would reduce emissions due to the lack of a combustion engine. One exception would be switching from walking to biking.
ExPANDEDBESTPrACTICEB MAxIMUMEFFOrTC
Transitfaremeasures 0.45 (0.03%) 1.76 (0.11%)
Transitfrequency 2.03 (0.12%) 9.1 (0.55%)
Urbantransitexpansion 6.57 (0.40% 26.14 (1.58%)
Notesa. Moving Cooler: An Analysis of Transportation Strategies for Reducing Greenhouse Gas Emissions. urban Land institute. Cambridge
Systematics, inc. July 2009.b. This scenario in Moving Cooler describes a modest expansion of strategies that are already being implemented. c. This scenario in Moving Cooler describes the most aggressive scenario, including extensive expansion of GHG reduction strategies that
are already being implemented in addition to new strategies.
Table 6 Moving Cooler Estimates of Annual GHG Emissions Reductions by Transit Strategies in 2050, mmt (as a percentage reduction from 2050 baseline projections of surface transportation emissions)a
16 EMBARQ: The Role of Driving in Reducing GHG Emissions and Oil Consumption
PaRT ii
IMPlEMENTATION Of zONING ANd OThER lANd uSE REGulATIONS TO SuPPORT INfIll, TOd, ANd MIXEd uSE
Changes to land use zoning and other relevant regulations, coupled with shifting demographics and consumer demand,75 can encourage infill development (development or redevelopment in existing communities), transit oriented development (TOD), and mixed use development (which integrates housing, retail, offices, and other land uses around transportation hubs). Residents of Atlantic Station, a mixed use infill project on a rehabilitated brownfield site in Atlanta, Georgia, have a daily VMT level 59 percent lower than their fellow Atlantans.76 At the regional level, Sacramento, California, studied alternative land-use scenarios for the future and estimated that per capita VMT will decline 6 to 10 percent by 2035 if the alternative scenario—which includes infill and increased transportation options—is realized.77 EPA’s Smart Growth office estimated that shifting 10 percent of new jobs and housing to mixed use regional centers in Denver could reduce GHG emissions by 3.5 percent during a 30 year timeframe.78 The Center for Transit Oriented Development found that growth in VMT-related GHG emissions in the Chicago area could be reduced by 28 to 36 percent from BAU by 2030 if all new housing and jobs were located near fixed rail transit stations.79
The Natural Resources Defense Council estimates that, if all new housing were relatively location efficient and compact, emissions reductions would total 595 mmt of CO2 over 10 years.80 For this to occur, it would require more location efficient development that was located half in infill areas and half in suburban areas. The U.S. Department of Transportation estimates that if 60 to 90 percent of new urban growth occurs in compact, walkable neighborhoods (defined as five or more units per acre), U.S. transportation GHG emissions would decline 1 to 4 percent in 2030 and 3 to 8 percent in 2050.81 Moving Cooler estimated that a broad set of land use strategies could reduce annual GHG emissions by 9.87 to 73.44 mmt in 2050 (0.6 percent and 4.44 percent, respectively).82
TRAVEl dEMANd MANAGEMENT, PRICING, PARkING MEASuRES, TElECOMMuTING, ANd flEXIBlE WORk SChEdulES
Travel demand management (TDM) is a catchall term used to describe programs or strategies that are meant to reduce travel, most often aimed at reducing single occupancy travel or peak hour travel. The categories below, outlined in CLEAN-TEA, are a sample of strategies that can manage travel demand.
CARPOOl ANd VANPOOl
In Saving Oil in a Hurry, the International Energy Agency estimates that adding a person to “every urban area car trip” (in this case theoretically triggered by high or disrupted fuel prices) could reduce U.S./Canadian VMT by 15.2 percent.83,84 A less ambitious scenario from the report, adding a person to “every commute trip,” would achieve a 14 percent reduction in VMT. These two scenarios would reduce oil consumption by 3.3 and 1.6 million barrels per day, respectively.85 IEA also estimated that creating carpool lanes from existing road lanes would reduce VMT by 0.2 to 1.4 percent.86
EPA estimates that extensive rideshare outreach and support for ridematching, carpool, and vanpool can reduce transportation GHG emissions by 0.2 percent in 2030 (compared to baseline projections).87 Given that FTA found that vanpool trips in the U.S. averaged 0.22 pounds of CO2 per passenger mile while single passenger trips averaged 0.96 pounds CO2 per passenger mile, this number could be on the lower end of the potential reductions available from vanpooling.88 The Washington, D.C., region’s ridematching program reduces 82,000 tons of CO2 annually.89 The Moving Cooler study found that expansion of HOV lanes would result in an annual reduction of 1.31 to 3.5 mmt of surface transportation GHG emissions in 2050 (0.07 percent and 0.21 percent, respectively).90
CARShARE
The Mineta Transportation Institute studied the aggregate impacts of the carshare industry in the United States and found that it reduces net GHG emissions.91 The Moving Cooler study estimated that car sharing will result in an annual reduction of 0.99 to 3.95 mmt by 2050 (0.06 percent and 0.24 percent, respectively).92

EMBARQ: The Role of Driving in Reducing GHG Emissions and Oil Consumption 17
PaRT ii
TRANSPORTATION PRICING MEASuRES
Pay as you drive insurance (PAYD) is a type of car insurance where the cost is based on the policyholder’s annual VMT. A study by the Brookings Institute found that adopting PAYD across the United States would result in an annual reduction of 222 billion miles (an 8 percent reduction in VMT), 11.2 billion gallons of oil, and 99 million tons of CO2 representing 2 percent of total CO2 emissions and 8.5 percent of car and truck emissions.93 A pilot project conducted by Progressive Insurance in Texas showed a 5 percent VMT reduction for project participants within one year.94 DOT estimates that requiring states to allow or require PAYD would reduce transportation GHG emissions 1.1 percent and 3.6 percent, respectively, in 2050 (compared to baseline projections).95 The Moving Cooler study estimated that PAYD insurance would result in an annual reduction of 18.61 to 59.16 mmt in 2050 (a 1.13 percent and 3.58 percent reduction from the 2050 surface transportation baseline, respectively).96 In addition, DOT estimated that VMT-based registration fees could reduce VMT by 3.6 percent,97 while the Moving Cooler study found that a VMT fee would result in an annual reduction of 7.46 to 89.58 mmt in 2050 (a 0.45 percent and 5.42 percent reduction from the 2050 baseline, respectively).98 DOT also estimated that using a VMT fee to maintain a minimum level of service (LOS) D99 on all roads (average fee of 65 cents/mile applied to 29 percent of urban and 7 percent of rural VMT) would result in a decrease of 0.4 to 1.6 percent of transportation GHG emissions in 2030.100
A pilot congestion fee in Stockholm, Sweden, reduced the number of vehicles in the area by 22 percent, increased public transit use 6 to 9 percent and reduced the central city’s carbon emissions by 14 percent.101 The Traffic Congestion Mitigation Commission estimated that the proposed congestion fee in New York City, which failed to be adopted, would have reduced VMT
by 6.8 percent.102 London’s congestion pricing scheme reduced CO2 by 6.5 percent by 2007.103 DOT estimates that applying a cordon charge (a fee to enter a specific area of the city or region) on all U.S. metropolitan area central business districts (CBDs) would decrease transportation GHG emissions by 0.1 percent.104 The Moving Cooler study found that cordon pricing would result in an annual reduction of 2.9 mmt GHG emissions (0.18 percent) from the 2050 baseline surface transportation projections, while congestion pricing would result in an annual reduction of 17.69 to 39.13 mmt in 2050 (a 1.07 percent and 2.37 percent reduction from the 2050 baseline, respectively).105
PARkING POlICIES
A DOT study found that solo driving declined 16 to 81 percent when employers raised parking fees to market rates.106 A similar study by UCLA professor Donald Shoup found that businesses offering "parking cash out" (paying employees who do not use parking facilities) saw a 12 percent reduction in commute VMT.107 The EPA GHG emissions study found that if all downtown workers in the United States were to pay for parking (paying an average of $5 per day for those not already paying), GHG emissions from transportation would be reduced by 0.2 percent.108 Moving Cooler estimates of parking strategies are summarized in Table 7.
TElECOMMuTING/flEXIBlE WORk SChEdulES
The Saving Oil in a Hurry study found that telecommuting would reduce fuel use by 1.3 million barrels per day in the U.S. and Canada if 100 percent of employees who can feasibly telecommute do so.109 The estimate even discounts 25 percent of expected VMT reductions due to potential extra trips on work from home days. A 25 percent uptake of telecommuting two
ExPANDEDBESTPrACTICE MAxIMUMEFFOrT
CentralBusinessDistrict/ActivityCenteron-streetparking 1.04 (0.06%) 1.04 (0.6%)
Neworhighertaxonfreeprivateparking n/a 0.84 (0.05%)
residentialparkingpermits n/a 1.39 (0.08%)
Notea. Moving Cooler. Cambridge Systematics, inc. July 2009.
Table 7 Moving Cooler Estimates of Annual GHG Emissions Reductions by Parking Strategies in 2050, mmt (as a percentage reduction from 2050 baseline projections of surface transportation emissions)a

18 EMBARQ: The Role of Driving in Reducing GHG Emissions and Oil Consumption
PaRT ii
days per week (among only eligible employees) would result in a reduction of 131,000 barrels of oil per day. A similar study by the American Consumer Institute found that an overall increase of 10 percent in telecommuting could reduce GHG emissions by 42 mmt CO2 per year.110 A pilot project in Utah found that requiring some employees to work four days instead of five saved $5 million in fuel and 12,000 metric tons GHG emissions.111 DOT found that commuter trip reduction programs overall can reduce the transportation sector’s GHG emissions by 0.2 to 0.6 percent by 2030.112
hIGhWAy ANd TRANSIT OPERATIONAl IMPROVEMENTS TO REduCE CONGESTION
Operational improvements, such as intelligent transportation systems (ITS) that use technology to manage traffic, can reduce GHG emissions in the short term through traffic flow improvements and congestion reduction. However, in the long run, they may induce additional travel demand by creating less congested conditions and attracting new drivers. Because of this, the DOT GHG emissions study did not quantify ITS as a GHG emissions reduction strategy.113 However, a study by McKinsey and Company estimated that “smart navigation” and “smart routing” could result in an annual reduction of 3 and 12 megatons of CO2e by 2030, respectively, (compared to BAU projections).114 The difference between these approaches could relate to the length of time modeled, as GHG emissions reductions that occur from ITS in 2030 could induce traffic demand by 2050, for example. A UC-Riverside, study found that reducing congestion could reduce CO2 emissions by 7 to 12 percent per strategy (including congestion mitigation, speed management, and traffic smoothing).115 Consistent with the ranges estimated
by the McKinsey study, Moving Cooler also provides estimates of ITS strategies, shown.
It is interesting to note that the Moving Cooler study found that the specific strategies of bottleneck relief and capacity expansion reduced GHG emissions in 2030 but increased emissions in 2050, consistent with the observation that increasing capacity improves traffic flow for a small window of time before new trips on the same facility (attracted by the improvements) will overwhelm the facility once more.
INTERCITy PASSENGER RAIl IMPROVEMENTS
In general, while the average single occupancy vehicle emits CO2 at a rate of 0.964 lbs/mile, the average heavy rail trip emits just 0.224 lbs/mile.116 Moving Cooler found that increasing intercity passenger rail would result in an annual reduction of 0.9 to 1.97 mmt GHG emissions in 2030 (a 0.05 percent and 0.12 percent reduction from the 2050 baseline surface transportation projections, respectively).
hIGh-SPEEd RAIl IMPROVEMENTS
In Moving Cooler, high-speed passenger rail was estimated to reduce GHG emissions by 3.53 to 5.98 mmt in 2050 (a 0.21 percent and 0.36 percent reduction from the 2050 baseline surface transportation projections, respectively). However, a study by researchers at UC-Berkeley found that high-speed rail (HSR) could instead increase GHG emissions and energy consumption, unless it consistently enjoyed high occupancy rates or was powered by a low emission energy source.117 Substantial energy is required to move an entire train quickly, and the efficiency in terms of energy use
ExPANDEDBESTPrACTICE MAxIMUMEFFOrT
Activetrafficmanagement n/a 6.93 (0.42%)
Integratedcorridormanagement 0.2 (n/a) 0.6 (0.42%)
Incidentmanagement 5.25 (0.32%) 7.4 (0.45%)
Signalcontrolmanagement 0.26 (0.2%) 2.52 (0.15%)
Travelerinformation 0.38 (0.2%) 2.42 (0.15%)
Notea. Moving Cooler, Cambridge Systematics, inc. July 2009.
Table 8 Moving Cooler Estimates of Annual GHG Emissions Reductions by ITS Strategies in 2050, mmt (as a percentage reduction from 2050 baseline projections of surface transportation emissions)a

EMBARQ: The Role of Driving in Reducing GHG Emissions and Oil Consumption 19
PaRT ii
per passenger mile depends greatly on how many passengers are on board. A full bus, van, or car could be more efficient than a sparsely populated train. Meanwhile, the Berkeley analysis assumes that high-speed trains will run on electricity, and the emissions intensity of the grid is a significant point of variability and uncertainty. This uncertainty points to the need for both additional review and careful planning in HSR corridors to ensure high occupancy levels as well as clean power sources.
INTERCITy BuS IMPROVEMENTS
DOT found that annual emissions reductions from intercity Greyhound bus travel is 0.55 mmt CO2, when compared to the emissions produced if those trips were taken by the existing proportions of car, air, and rail travel. The expected 3 percent per year growth in the intercity bus sector ridership will result in a total savings of 1.2 mmt in CO2 emissions in 2030, compared to baseline projections.118 A DePaul University study found that ridership growth in intercity bus travel reduced CO2 emissions by 36,000 tons of CO2 emissions over a one year period, when compared to less fuel efficient modes of travel.119
SuMMARy Of lITERATuRE REVIEWS
The literature reviews show that, although there is limited evidence about the impact of federal transportation programs on VMT, GHG emissions, and oil consumption, there is substantial evidence showing that the types of transportation strategies embraced in recent legislation can reduce VMT, thereby helping to reduce both oil dependence and climate change impacts. The lack of evaluation for programs shows a need for routine measurement of programs. Similarly, the lack of consistent evaluation metrics across transportation strategies suggests a need for consistent, standardized metrics and evaluation. For the small portion of programs that have been evaluated, it is important to note that reducing trips or air pollution is the express intent of five of the six programs that were evaluated (the exception being JARC, which doesn’t expressly aim to reduce trips or air pollution). These five programs dedicate funding to projects that aim to reduce congestion, trips, or air pollution; and there is evidence that the programs do, in fact, achieve these goals. Thus, one way of successfully structuring federal programs to achieve specific goals is to clearly state the program goals and provide direct funding for those programs. It is important to note that the CLEAN-TEA
although the cost of implementing CLEaN-TEa type strategies was outside the scope of this study, there are a few resources for readers interested in this element of the discussion.1 For bicycle and pedestrian infrastructure spending, current funding of $541 million amounts to about 27 percent of the average annual “maximum deployment” implementation costs estimated for the pedestrian and bicycle improvements in Moving Cooler. The report estimates these costs as $42.1 billion for pedestrian strategies and $37.7 billion for bicycle strategies, cumulative through 2050 and above baseline projections. This represents an increase over baseline investments of $1.95 billion for pedestrian and bicycle
infrastructure together—almost four times the total annual funding in 2008 ($541 million) and 21 times the currently dedicated bicycle and pedestrian funds ($91.2 million).
The overall implementation costs of several comprehensive GHG emissions reducing scenarios were also examined in Moving Cooler. One such scenario, characterized as the “Land use/Transit/Nonmotorized Transportation Bundle,” includes CLEaN-TEa strategies and other complementary strategies. implemented at an “aggressive” level it would cost $1.4 trillion over 40 years and achieve 3.8 Gt of GHG emissions reductions over that time, resulting in substantially reduced vmT and vehicle
operating savings of $3.3 trillion. a recent report by the Center for Clean air Policy also found that transportation projects that reduce GHG emissions could be completed at a significant net savings to society if broader benefits like economic development, increased property taxes, and improved public health were included.2
Notes1. McKinsey & Company. March 2009. Roads
toward a Low-carbon Future.
2. S. Winkelman, A. Bishins and C. Kooshian. 2009. Cost-Effective GHG Reductions through Smart Growth & Improved Transportation Choices: An Economic Case for Investment of Cap-and-Trade Revenues. Center for Clean Air Policy.
WhAT IS ThE COST Of REduCING VMT, GhG EMISSIONS, ANd OIl uSE fROM TRANSPORTATION?
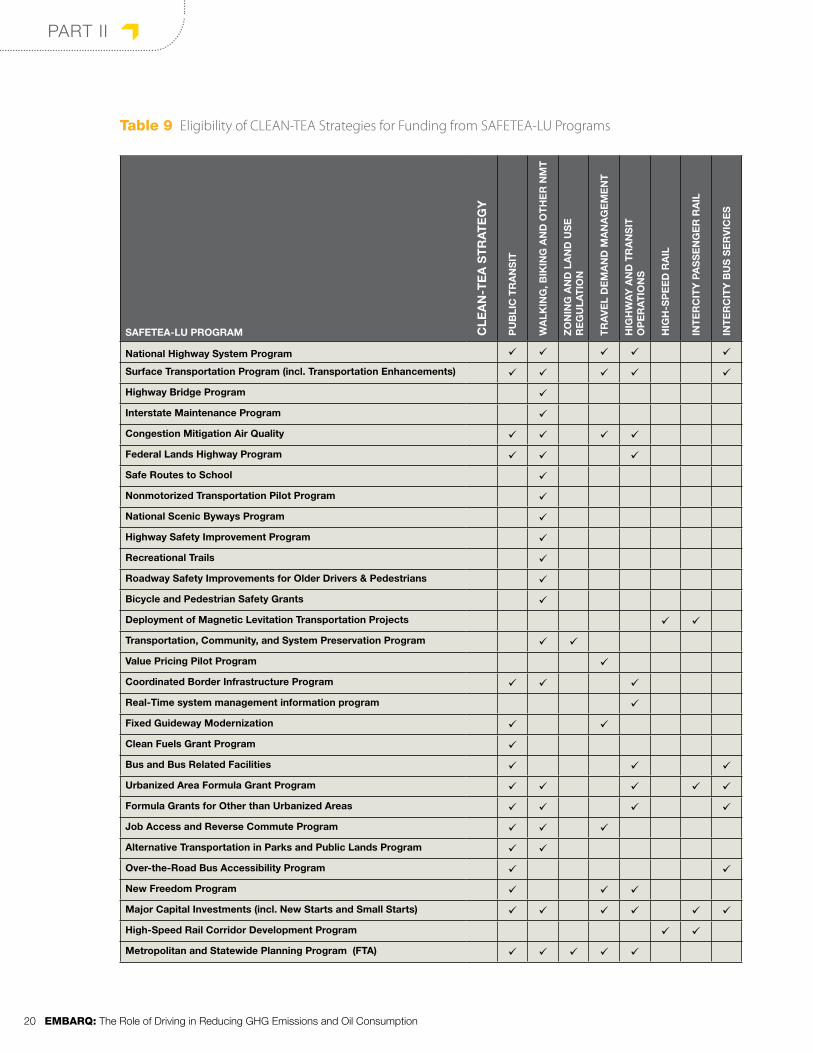
20 EMBARQ: The Role of Driving in Reducing GHG Emissions and Oil Consumption
PaRT ii
SAFETEA-LUPrOGrAM CLE
AN
-TE
AS
Tr
AT
EG
y
PU
BLI
CT
rA
NS
IT
WA
LkIN
G,B
IkIN
GA
ND
OT
HE
rN
MT
ZO
NIN
GA
ND
LA
ND
US
E
rE
GU
LAT
ION
Tr
AV
EL
DE
MA
ND
MA
NA
GE
ME
NT
HIG
HW
Ay
AN
DT
rA
NS
IT
OP
Er
AT
ION
S
HIG
H-S
PE
ED
rA
IL
INT
Er
CIT
yP
AS
SE
NG
Er
rA
IL
INT
Er
CIT
yB
US
SE
rV
ICE
S
NationalHighwaySystemProgram
SurfaceTransportationProgram(incl.TransportationEnhancements)
HighwayBridgeProgram
InterstateMaintenanceProgram
CongestionMitigationAirQuality
FederalLandsHighwayProgram
SaferoutestoSchool
NonmotorizedTransportationPilotProgram
NationalScenicBywaysProgram
HighwaySafetyImprovementProgram
recreationalTrails
roadwaySafetyImprovementsforOlderDrivers&Pedestrians
BicycleandPedestrianSafetyGrants
DeploymentofMagneticLevitationTransportationProjects
Transportation,Community,andSystemPreservationProgram
ValuePricingPilotProgram
CoordinatedBorderInfrastructureProgram
real-Timesystemmanagementinformationprogram
FixedGuidewayModernization
CleanFuelsGrantProgram
BusandBusrelatedFacilities
UrbanizedAreaFormulaGrantProgram
FormulaGrantsforOtherthanUrbanizedAreas
JobAccessandreverseCommuteProgram
AlternativeTransportationinParksandPublicLandsProgram
Over-the-roadBusAccessibilityProgram
NewFreedomProgram
MajorCapitalInvestments(incl.NewStartsandSmallStarts)
High-SpeedrailCorridorDevelopmentProgram
MetropolitanandStatewidePlanningProgram(FTA)
Table 9 Eligibility of CLEAN-TEA Strategies for Funding from SAFETEA-LU Programs

EMBARQ: The Role of Driving in Reducing GHG Emissions and Oil Consumption 21
PaRT ii
type strategies reviewed in this report are not meant to be a comprehensive list of all types of transportation projects that could reduce VMT, GHG emissions, and oil use. Nevertheless, it is an extensive list of strategies that are documented to reduce VMT, GHG emissions, and oil use. Furthermore, as the next section shows, each of the strategies reviewed can already be funded by the existing federal transportation program.
POTENTIAl fuNdING fOR ClEAN-TEA STRATEGIES WIThIN ThE EXISTING fEdERAl PROGRAM
There is general consensus among transportation advocates and planners that “increased flexibility” in the federal transportation program is desirable in crafting federal policies and programs that can meet the needs of different regions and travel patterns.120 However, this review found that a high level of flexibility already exists within the current system: Of the 48 SAFETEA-LU programs reviewed, 30 can be used to fund at least one of the transportation strategies identified above. These provisions range from the ability to add a bike lane along a highway (National Scenic Byways Program), to fund transit oriented development (Transportation, Community and System Preservation Program), or to build major capital investments in public transit (New Starts and Small Starts programs). Whether each program could fund each strategy was determined by reviewing the legislative language of SAFETEA-LU and the U.S. Code where applicable. These programs and the strategies they can fund are organized into the matrix in Table 9.
Maximum federal funding for CLEAN-TEA type strategies was $175 billion from 2005 through 2009. This number
represents the total authorized funding from the 30 programs found to potentially fund CLEAN-TEA type strategies, out of 48 programs reviewed. This represents 79 percent of the $222 billion authorized for these 48 programs under SAFETEA-LU. Total authorized funding for the 30 programs that can fund each strategy is shown in Column 2 of Table 10. For example, the table shows that a maximum of $118 billion can be used for public transit. Note that using the maximum allowable funding for public transit would reduce funding availability for other strategies. Column 3 shows the maximum percentage of the total that can fund each strategy. As the table shows, within the 30 eligible programs, there is a high level of flexibility for walking, biking, and other nonmotorized transportation (up to 73 percent) and public transit (up to 53 percent) but very little flexibility for zoning and land use regulation (up to 0.3 percent).
Thanks to a FHWA report, there is more information available on spending levels for walking and biking projects than there is for other strategies. This report found that walking, biking, and other nonmotorized transportation projects could be funded under 21 of the 48 programs reviewed. However, only two of the transportation programs—the Safe Routes to School Program and the Nonmotorized Transportation Program—exist primarily to serve bicycle, pedestrian, and nonmotorized transportation. These two programs together provided $91.2 million of federal aid in 2008.121 Other programs allow but are not required to fund walking and biking projects. In addition to the $91.2 million from the Safe Routes to School Program and the Nonmotorized Transportation Program, other federal-aid highway programs obligated (planned to spend) $449.8 million for walking and biking projects
TrANSPOrTATIONSTrATEGyMAxIMUMFLExIBLEFUNDING
AVAILABLEBySTrATEGy
FLExIBLEFUNDINGAVAILABLEASAPErCENTAGEOFTOTALFUNDING
AVAILABLE
PublicTransit $118,218,443,171 53%
Walking/Biking/OtherNMT $161,659,202,171 73%
Zoning/Landuseregulation $757,000,000 0.3%
Traveldemandmanagement $89,278,553,171 40%
Highway/Transitoperations $110,795,943,171 50%
High-speedrail $1,590,000,000 0.7%
IntercityPassengerrail $31,649,364,000 14%
IntercityBusServices $99,640,843,215 45%
Table 10 Flexible Funds from SAFETEA-LU that Can be Used for CLEAN-TEA Type Strategies

22 EMBARQ: The Role of Driving in Reducing GHG Emissions and Oil Consumption
PaRT ii
in 2008, including $250 million from the Transportation Enhancements set-aside of the Surface Transportation Program.122 This $449.8 million represents 0.27 percent of the $161 billion total funding authorized for federal-aid highway programs that can but are not required to fund walking and biking projects.123 Given the documented GHG emissions and oil use reduction benefits of walking and biking (and the other CLEAN-TEA type strategies), the United States should consider performance standards or dedicated funding streams to ensure that an appropriate level of funding is allocated to this suite of strategies.
dISCuSSION
This report has shown that federal programs have not been consistently evaluated for their impacts on VMT, GHG emissions, and oil use and that there is ample evidence that CLEAN-TEA type transportation strategies do reduce VMT, GHG emissions, and/or oil use (although these also are not evaluated in a consistent way). In addition, there is significant flexibility in the federal funding program to invest in strategies that reduce VMT, GHG emissions, and oil use. However, there is not enough information available to evaluate current
levels of spending or the GHG emissions, VMT, or oil use impacts of the overall federal transportation program. These results raise a number of research questions.
First, program evaluation and literature on the impacts of federal transportation programs on VMT, GHG emissions, or oil use are limited. A quantitative review of how federal surface transportation programs reduce (or increase) VMT, GHG emissions, or oil use could significantly improve the quality of debate on the topic.
Second, it is clear in the case of biking and walking that, while numerous SAFETEA-LU programs can fund these strategies, funding is only guaranteed where it is dedicated to specific modes or goals. This presents an interesting series of research questions: To what extent are CLEAN-TEA type strategies actually funded by these flexible programs? When flexible programs are not used to fund transportation improvements that reduce GHG emissions, what factors determine project selection? What are the oil and climate impacts of projects that are selected and funded under SAFETEA-LU? The limited amount of existing data that could answer some of these questions is not available publicly—it requires extensive coordination with multiple U.S. DOT
Other areas of flexibility in the federal transportation program are used more widely. States have the option to move, or “flex,” funding from certain highway programs to other uses. Since the enactment of the intermodal Surface Transportation Efficiency act (iSTEa) of 1991, there have been two major programs administered by the Federal Highway administration (FHwa) funds which can be used for both highway and public transit projects: the Congestion mitigation and air Quality (CmaQ) program and the Surface Transportation Program (STP). These programs provide funding to states each year according to statutory formulas, and both are designed to give states flexibility in how this funding is spent. Other provisions of iSTEa
and subsequent authorizations can also provide for some flexibility and transferability of funds between FHwa and FTa. in practice, the CmaQ and STP programs account for the vast majority of funds transferred from FwHa to FTa for public transit and transit-related projects, and only a small portion of funds has been transferred from FTa to FHwa (i.e., from public transit to highway projects).1 Nationwide, funding transferred each year has grown from around $300 million in 1992 to about $1.3 billion in 2006, with a peak of about $1.8 billion transferred in 2000.2 The majority of the funds transferred from FHwa to FTa have come from CmaQ. Over that period, four states—California, New york, Oregon, and Pennsylvania—used
25 percent or more of their flexible funds CmaQ and STP for public transit projects. Ten states—arizona, Georgia, illinois, massachusetts, minnesota, New Jersey, Ohio, vermont, virginia, and washington—used between 10 and 25 percent of these flexible funds on public transit projects, and the remainder (36 states) used less than 10 percent of flexible highway funding on public transit projects.3
Notes1. U.S. General Accountability Office. July
2007. Highway and Transit Investments, Flexible Funding Supports State and Local Transportation Priorities and Multi-Modal Planning. # GAO-07-772.
2. Dollar figures reported in 2007 dollars.
3. U.S. General Accountability Office. 2007. Highway and Transit Investments.
A dIffERENT kINd Of flEXIBlE fuNdING: hIGhWAyS TO PuBlIC TRANSIT

EMBARQ: The Role of Driving in Reducing GHG Emissions and Oil Consumption 23
PaRT ii
offices and, if the Department so chooses, a Freedom of Information Act request—and is available publicly only when organizations go through this process to obtain, synthesize, and publish portions of the database. In addition, a survey of local and state transportation officials could identify barriers to investing in GHG emissions and oil use reduction strategies and provide insight into how much funding is spent by states on CLEAN-TEA type strategies.
Third, the “flex funding” that is directed to FTA comes primarily from two programs, STP and CMAQ, creating a possible conflict because STP and CMAQ are also set up to play a role in reducing GHG emissions, VMT, and oil use. Further analysis is needed on whether “flex funding” sent to FTA results in GHG emissions, VMT, or oil use reductions above what would have resulted from that funding being used for STP or CMAQ.
Fourth, because states and MPOs identify which projects will request federal funds, and because flexibility exists within federal funding streams, it follows that any flexibility not exercised would be done so due to nonfederal parties (e.g., states and regions). Because the federal share of project spending accounts for 22 percent of highway projects124 and 41 percent of public
transit capital projects (and only 7.5 percent of public transit operations), it is clear that states, regions, and local governments will need to be involved in shifting transportation investments toward GHG emissions reducing projects.125 In addition to surveys or other research to determine barriers or reasons for states or regions not maximizing flexibility (see discussion section, above), the federal government can provide technical assistance and outreach to both encourage and rationalize additional funding for CLEAN-TEA type strategies.
Fifth, if data were available, it would be useful to compare total spending for the strategies reviewed here (or those of Moving Cooler or DOT’s climate report) with the GHG emissions reductions expected from those strategies and estimate the funding needed to achieve GHG emissions and oil use reduction targets in the LDV transportation sector by reducing VMT to the sustainable VMT levels identified in Part I.
Progress toward answering these research questions would provide greater insight into the federal surface transportation program and assist in modifying the program to promote outcomes such as GHG emissions, VMT, or oil use reductions or other national objectives.
24 EMBARQ: The Role of Driving in Reducing GHG Emissions and Oil Consumption
fOREwORD
CONCLuSiONS
There is a pressing need to reduce both GHG emissions and oil use in the United States, and the transportation sector is uniquely positioned to contribute to these goals. The scenarios in Part I demonstrate the likely need to moderate per capita VMT in order for the LDV transportation sector to achieve oil consumption and climate targets, based on recent targets and reasonable technological assumptions (such as those outlined in Part I). Although the majority of federal programs reviewed in this report can be used to invest in VMT reduction strategies, adequate funding for CLEAN-TEA type strategies can only be guaranteed through dedicated funding in the way that funding is dedicated for Safe Routes to School or public transit expansion programs. While combining a scenario analysis with a literature review is not conclusive, it does provide a context in which to encourage additional research and recommend changes to the federal program to promote GHG emissions, VMT, and oil use reductions.
Federal transportation legislation provides multiple opportunities to invest in planning, infrastructure, and technology that can reduce dependence on automobiles while improving mobility. The analysis found that a number of federal transportation aid programs exist as potential funding sources for strategies that reduce transportation GHG emissions. Up to 79 percent funding from the 48 programs reviewed can be used to fund these strategies. However, much of the flexibility in funding has been in place since 1991, and overall transportation emissions have increased by approximately 28 percent (from 1,486 mmt CO2 to 1,895 mmt CO2) between 1990 and 2005.126 This indicates that the existing system could promote GHG emissions reductions but is not necessarily doing so, although transport emissions have decreased modestly since 2005, in part due to high fuel prices.127 A full analysis of projects that were actually funded would shed further light on the potential for SAFETEA-LU to support GHG emissions and oil use reductions.
Given that the data on whether this flexibility leads to investment in CLEAN-TEA type strategies are not publicly available, and there is a dearth of literature on the VMT, GHG emissions, and oil use impacts of federal programs, one cannot conclude whether flexibility in federal funding actually leads to a significant investment in CLEAN-TEA type strategies. However, five of six programs with existing evaluations provide dedicated funding to CLEAN-TEA type strategies and are shown to reduce GHG emissions, VMT, or oil use. Thus, dedicated, rather than flexible, program funding tied to specific goals seems to be critical to ensuring investment in GHG emissions and oil consumption reducing strategies.
POlICy RECOMMENdATIONS
There are a number of changes that can be instituted now, without legislative action, that will help to reduce VMT, GHG emissions, and oil use. Although these actions can be implemented independently, they should be implemented in concert to accelerate improvements. The U.S. Department of Transportation and other coordinating agencies should—
1. Encourage, through outreach and technical assistance, states, regions, and municipalities to use flexible federal-aid funds to invest in VMT, GHG emissions, and oil consumption reducing transportation strategies;
2. Provide technical support for conducting standardized evaluations of programs and projects; and
3. Simplify public access to its FMIS (project spending) databases (e.g. by publishing them online). Greater access to information is key for evaluating programs that provide flexible funding for their success in funding strategies that support national goals. Furthermore, access to data will encourage research and comparison on actual spending levels and encourage transparency and accountability.
DOT is working on the first recommendation through its Sustainable Communities partnership with HUD and EPA.128 The partnership has provided, for example, a list of programs that can fund “livability” initiatives, which
CONCLuSiONS

EMBARQ: The Role of Driving in Reducing GHG Emissions and Oil Consumption 25
CONCLuSiONS
often dovetail with clean transportation investments due to the focus on creating healthier, more walkable and mixed-use communities. DOT can expand on this effort by providing more tools for local, regional, and state governments to calculate the benefits of reducing VMT, GHG emissions, and oil use and providing technical assistance for sustainable planning and evaluation.
For longer-term changes to the federal-aid transportation program, Congressional reauthorization of the transportation program by Congress will provide extensive opportunities for advancing GHG emissions and oil use reduction goals. Congress should—
1. Establish national goals for the U.S. transportation system and require progress reports or other accounting to track achievement. These goals should include reducing GHG emissions and reducing oil consumption (in addition to economic competitiveness and safety), and there should be specific targets for each goal.129
a. Implement performance-based funding—funding that is tied to the progress toward established goals at the programmatic or project level. For example, if one goal is oil use reduction and a project would increase oil use, then it would be ineligible for funding. This would require analysis of programs and projects and provide a new source of evaluation information.
b. Require or incentivize performance based planning at the state and regional level. Reserve funding, by formula or competitively, for states and regions that adopt long-range regional transportation plans and short-term Transportation Improvement Programs (TIPs) that plan to achieve GHG emissions reductions and oil savings.
2. Provide additional direct funding for transportation programs and strategies that reduce GHG emissions, VMT, and oil use in order to ensure that funds are spent on more efficient, sustainable projects. Funding should be dedicated in two ways:
a. A larger portion of federal funds should be directed toward programs that dedicate funding to, or achieve, GHG emissions, VMT, and oil use reductions (e.g. CMAQ, SRTS, etc.);
b. Create new set-asides within existing programs or create new programs that require funding to be spent on transportation strategies that effectively reduce VMT, GHG emissions, and oil consumption. This could be accomplished either through individual strategies (e.g. nonmotorized transportation) or by providing flexibility within the suite of successful strategies.
This report shows that transportation planning at the local, regional, and state level can and should immediately incorporate strategies to reduce VMT in order to plan for both short-term and long-term investments in GHG emissions and oil use reductions. Planners and policymakers committed to reducing oil consumption and GHG emissions should encourage Congress to pass a reauthorization bill that incorporates the recommendations above.
26 EMBARQ: The Role of Driving in Reducing GHG Emissions and Oil Consumption
fOREwORD
APPENDIX A
NOTES ON mETHODOLOGy FOR vmT SCENaRiOS
Modeling the Optimistic and Moderate Technology Assumptions
A spreadsheet model was developed to account for the gradual turnover of the stock of vehicles on the road, assuming incremental technological advances among the new vehicles entering the fleet each year. The technological advances assumed are (a) electrification of vehicles, expressed as the percentage of electric-powered miles among the LDVs from each model year between 2010 and 2050, and (b) improved average on-road fuel economy (miles per gallon) applied to the remaining mileage among LDVs of each model year. Assumptions for fuel economy pertain to the actual on-road average performance of vehicles regardless of operating conditions or policy instruments (such as CAFE standards) that may be aimed at improving vehicles’ fuel efficiency. Therefore the approach disregards any discrepancies between test values and on-road performance, and does not explicitly distinguish efficiencies that may result from improvements to auxiliary systems such as air conditioning or efficiencies from operating conditions and traffic conditions. The optimistic and moderate assumptions for technology advances among new vehicles are summarized in Table 3.
Regarding on-road fuel economy among new LDVs, the model assumes 20.4 mpg for all model years prior to 2007. For 2007 through 2010, estimates from the Annual Energy Outlook 2010130 are used, ending at 22.7 mpg in 2010. Subsequent model years use straight-line projections between 2010 and 2016, between 2016 and 2030, and between 2030 and 2050. In terms of vehicle electrification, the share of electric-powered vehicle mileage is assumed to be all but negligible (≤0.1 percent) for all model years prior to 2015, and a straight-
line projection is used to populate inputs for each model year from 2015 through 2030.
Total annual VMT is assumed to be distributed uniformly among all vehicles sold over a 13 year period,131 with vehicles from each model year contributing 1/13th of the total annual VMT. Direct fuel consumption per mile (in gallons) and electricity consumption per mile (in Btu) is calculated according to the share of mileage powered by electricity given for vehicles from each model year, with the remaining mileage assumed to be powered by conventional fuel (predominantly gasoline) consumed according to the fuel economy (miles per gallon, or gallons per mile) given for each model year. Fuel consumption is converted to GHG emissions (gCO2e) and to oil consumption (barrels).132 The upstream GHG emissions from vehicles’ annual electricity use are combined with the GHG emissions from fuel consumed, all on a per-mile basis. Each electric-powered mile is assumed to demand 1,080 Btu of electricity from the grid (constant over the duration of the model).133 The emissions factors used to calculate these upstream GHG emissions begin at 0.210 gCO2e/Btu134 in 2010 and decline steadily to as little as 0.042 gCO2e/Btu (an assumed 80 percent reduction) by 2050. The upstream oil consumption from vehicles’ annual electricity use is negligible, given that only a tiny fraction of our electricity is generated by liquid fuels nationwide; it is nevertheless factored into the estimated average (per-mile) oil consumption associated with vehicle travel each year. As a numerical example, the following diagram illustrates the calculations and conversion factors used to calculate average on-road GHG emissions and oil use intensities under moderate technology assumptions in the year 2030.
APPENDix a
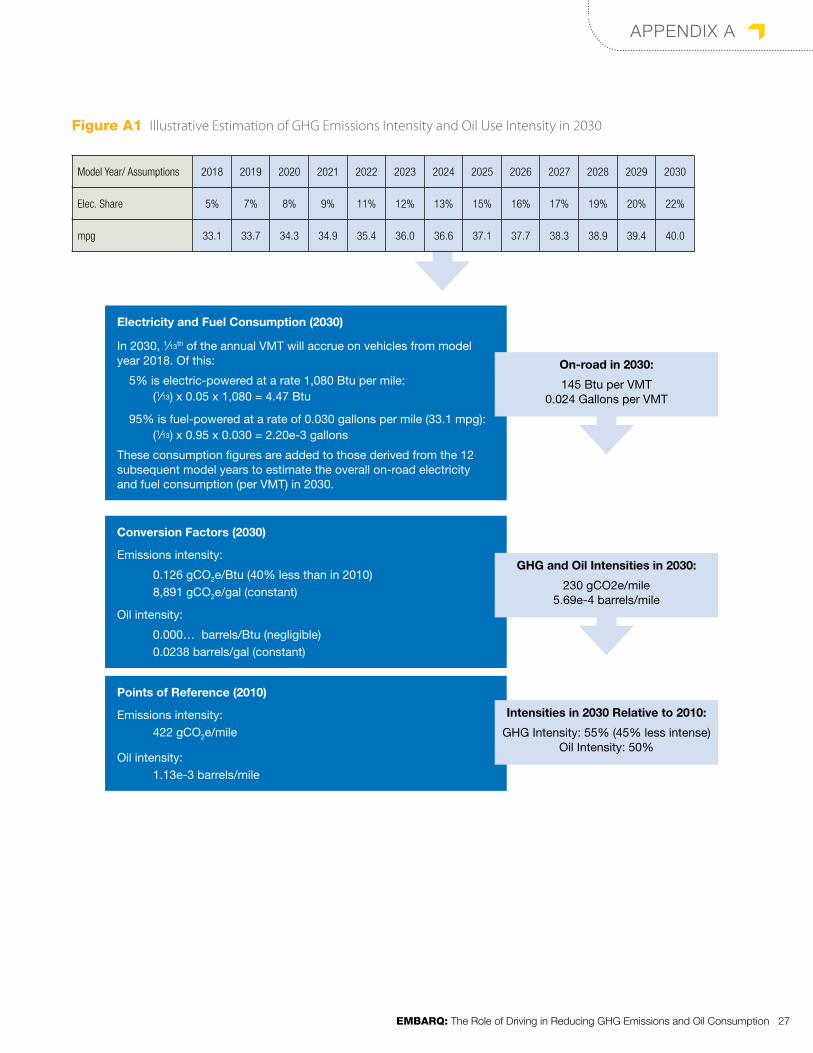
EMBARQ: The Role of Driving in Reducing GHG Emissions and Oil Consumption 27
aPPENDix a
Model Year/ Assumptions 2018 2019 2020 2021 2022 2023 2024 2025 2026 2027 2028 2029 2030
Elec. Share 5% 7% 8% 9% 11% 12% 13% 15% 16% 17% 19% 20% 22%
mpg 33.1 33.7 34.3 34.9 35.4 36.0 36.6 37.1 37.7 38.3 38.9 39.4 40.0
figure A1 Illustrative Estimation of GHG Emissions Intensity and Oil Use Intensity in 2030
ElectricityandFuelConsumption(2030)
In 2030, 1/13th of the annual VMT will accrue on vehicles from model year 2018. Of this:
5% is electric-powered at a rate 1,080 Btu per mile:(1/13) x 0.05 x 1,080 = 4.47 Btu
95% is fuel-powered at a rate of 0.030 gallons per mile (33.1 mpg):(1/13) x 0.95 x 0.030 = 2.20e-3 gallons
These consumption figures are added to those derived from the 12 subsequent model years to estimate the overall on-road electricity and fuel consumption (per VMT) in 2030.
ConversionFactors(2030)
Emissions intensity:
0.126 gCO2e/Btu (40% less than in 2010)8,891 gCO2e/gal (constant)
Oil intensity:
0.000… barrels/Btu (negligible)0.0238 barrels/gal (constant)
Pointsofreference(2010)
Emissions intensity:422 gCO2e/mile
Oil intensity:1.13e-3 barrels/mile
On-roadin2030:
145 Btu per VMT 0.024 Gallons per VMT
GHGandOilIntensitiesin2030:
230 gCO2e/mile 5.69e-4 barrels/mile
Intensitiesin2030relativeto2010:
GHG Intensity: 55% (45% less intense) Oil Intensity: 50%

28 EMBARQ: The Role of Driving in Reducing GHG Emissions and Oil Consumption
aPPENDix a
dISCuSSION Of ThE MOdERATE ANd OPTIMISTIC TEChNOlOGy ASSuMPTIONS
Under the moderate and optimistic technology assumptions, LDV electrification through 2030 is based on Scenario A and Scenario B (respectively) of a recent EPA report135 on the technical potential to reduce GHG emissions in transportation. Underlying each scenario is a substantial market penetration of electric vehicles (EVs) and plug-in hybrid electric vehicles (PHEVs). Among the cars and light trucks sold in 2030, the EPA’s scenario A assumes approximately 13 percent market penetration of EVs and 30 percent market penetration of PHEVs. EPA’s Scenario B assumes approximately 30 percent and 19 percent market penetration for EVs and PHEVs respectively in that year. For the model inputs in this analysis it is assumed that mileage on EVs is 100 percent grid-powered and that mileage on PHEVs is 50 percent grid-powered and 50 percent gasoline-powered. With this, it is expected that 21.5 percent and 39.5 percent of the mileage on vehicles sold in 2030 would be electric-powered under the moderate and optimistic technology assumptions, respectively. The ramp-up to 2030 market penetration follows a straight-line projection, which may differ from EPA’s scenarios. Importantly, the technology assumptions used in this analysis appear to be more optimistic than their EPA counterparts in terms of the share of mileage among the LDV population that is electric-powered in 2030. Under the EPA’s scenarios, “vehicles capable of running off grid electricity some or all of the time reach 14 percent of the LDV population for scenario A and 21 percent for scenario B in 2030.”136 In this analysis, 13 percent and 25 percent of all mileage (on the road, not just of vehicles sold in that year) is electric-powered in 2030 under the moderate and optimistic technology assumptions, respectively. While the EPA analysis does not go beyond 2030, both the moderate and optimistic sets of technology assumptions assume that the share of vehicle mileage that is electric-powered increases by 1 percent for vehicles of each consecutive model year between 2030 and 2050.
A recent study conducted at the Massachusetts Institute of Technology (MIT)137 concluded that a 30–50 percent reduction in fuel consumption is feasible over the next 30 years from a combination of vehicle efficiencies, some market penetration of advanced diesel and turbocharged gasoline engines, and some market penetration of electric and hybrid electric vehicles. The MIT study assumes a vehicle turnover rate of 8 percent
per year in its scenarios, which is roughly similar in effect to the 13 year useful life of vehicles assumed in this analysis. The study explains:
In the short term, [improvements] will come as a result of improved gasoline and diesel engines and transmissions, gasoline hybrids, and reductions in vehicle weight and drag. If these improvements are achieved, we estimate a $1,500–$4,500 increase in vehicle costs. Over the longer term, plug-in hybrids and later still, hydrogen fuel cells may enter the fleet in numbers sufficient to have significant impact on fuel use and emissions.
Disregarding electric-powered vehicles and focusing on fuel economy more than fuel switching, the prospects for vehicle efficiencies and advances in diesel and gasoline-powered engines as assessed in the MIT study could likely reduce per-mile fuel consumption of light-duty cars and trucks by about 29 percent by 2035, assuming that all the gains in efficiency would be applied toward fuel savings rather than increased power. By comparison, the optimistic and moderate technology assumptions in this analysis suggest per-mile fuel savings on the order of 57 percent and 46 percent, respectively, by the year 2035. To put these prospects in perspective, some very lightweight vehicles are already approaching 100 mpg in focused competitions: The Baldos II is one extremely small and lightweight one-person car engineered at Luleå University of Technology in Sweden that can travel 152.2 km on a liter of fuel—over 350 miles per gallon.138 Much of the vehicle efficiencies anticipated in the MIT study rely on a discontinuation of the trend toward larger heavier vehicles, assuming, instead, a modest drop in weight class. A modest drop in vehicle weight is consistent with conventional concepts about how cars are to be used, whereas extreme lightweight vehicles with superior fuel efficiency might not be driven and used the same way, or to the same extent, that people tend to use the automobiles they have today.
All told, the projections for both electrification and fuel economy encompass quite a range and would necessarily demand substantial reductions in average vehicle weight in the midterm. This scenario analysis is intended to inform planning over a broad range of possibilities. Uncertainty in vehicle improvements over time further underscores the need to moderate VMT. The vehicle technology improvements used as assumptions in the model are arguably within reach

EMBARQ: The Role of Driving in Reducing GHG Emissions and Oil Consumption 29
aPPENDix a
by 2050, although it is unlikely that the improvements could be achieved with a fleet of large SUVs or high-powered sports cars.
Rationale for Oil Consumption and GhG Emissions Reduction Targets used in the Model
The sources of the targets identified in Table 3 are explained as follows. The goals that inspired these targets are not specific to LDVs; rather the broad goals were assumed to apply proportionally to LDVs in terms of percentage reduction from 2010 levels.
MINIMAl OIl IMPORTS (IN 2030)
This target is based on S. 3601 introduced by Senator Merkley. The bill’s stated goal of saving roughly 8 million barrels of oil per day compared to projected139 consumption in 2030 corresponds to an approximate 52 percent reduction in oil consumption from 2010 levels. Senator Merkley’s plan140 details substantial potential for oil savings from light duty as well as heavy duty vehicles. The Minimal Import target simply assumes a proportional reduction target of 52 percent oil savings from LDVs between 2010 and 2030. Beyond 2030, an additional 1 percent reduction in oil consumption from LDVs per year is assumed, with total LDV oil consumption being reduced to just 28 percent of the current levels by 2050.
zERO OIl IMPORTS (IN 2030)
Current U.S. crude oil production is approximately 5.3 million barrels per day, while total consumption is around 14.2 million barrels.141 Reducing consumption to current levels of production would require a 63 percent reduction. The Zero Oil Imports target assumes that this scale of savings is accomplished for LDVs by 2030, with an additional 1 percent annual reduction in LDVs’ oil consumption between 2030 and 2050.
EARly BIRd GhG REduCTIONS
The Intergovernmental Panel on Climate Change finds that Annex I countries would need to achieve a 25 to 40 percent reduction in GHG emissions by 2020, and an 80 to 95 percent reduction by 2050 (relative to their overall 1990 emissions) in order to stabilize the atmospheric concentration of CO2 at 450 ppm. Achieving the midpoints of these suggested ranges of reductions relative to total U.S. GHG emissions in 1990142 demands that the United States reduce GHG emissions
by approximately 41 percent by 2020 and 89 percent by 2050 relative to current (2010) emissions. For the Early Bird GHG emissions reduction target, this magnitude of reductions is applied proportionally to LDVs. Alternatively, choosing the high or low points within the ranges of GHG emissions reductions suggested by the IPCC might have led to significantly different calculations for VMT per capita.
SlOW ANd STEAdy GhG REduCTIONS
The proposed comprehensive climate legislation that passed in the U.S. House of Representatives in 2009 included the target to reduce U.S. GHG emissions by approximately 83 percent economy-wide by 2050, relative to 2005 levels. The Slow and Steady GHG scenario assumes that proportional GHG emissions reductions are pursued for LDVs and achieved gradually over the course of 40 years.
model inputs used in this analysis are intended to describe on-road emissions, which do not correspond directly to CaFE standards. Historically, actual on-road performance of vehicles has been considerably less than the CaFE standards themselves. in brief, the following optimistic technology characteristics are included for vehicles in model year 2025:
• New gasoline-powered vehicles would operate at 201 grams per mile, while new electric vehicles would operate at 159 grams per mile; about 27 percent of the mileage among vehicles hitting the road in 2025 would be electric-powered.
• The weighted average of these new vehicles would be 190 grams per mile (equivalent to 46.9 miles per gallon) with grid emissions included. if grid emissions are not included, the weighted average would be only 116 grams per mile (equivalent to 76.7 miles per gallon).
The Obama administration recently announced its intent to set 2025 CaFE standards between 47 and 62 mpg of gasoline equivalent. while not directly comparable to CaFE standards, the optimistic technology assumptions in this analysis could be consistent with this range.
VEhIClE TEChNOlOGy ASSuMPTIONS COMPAREd TO CuRRENT ANd PENdING CAfE STANdARdS
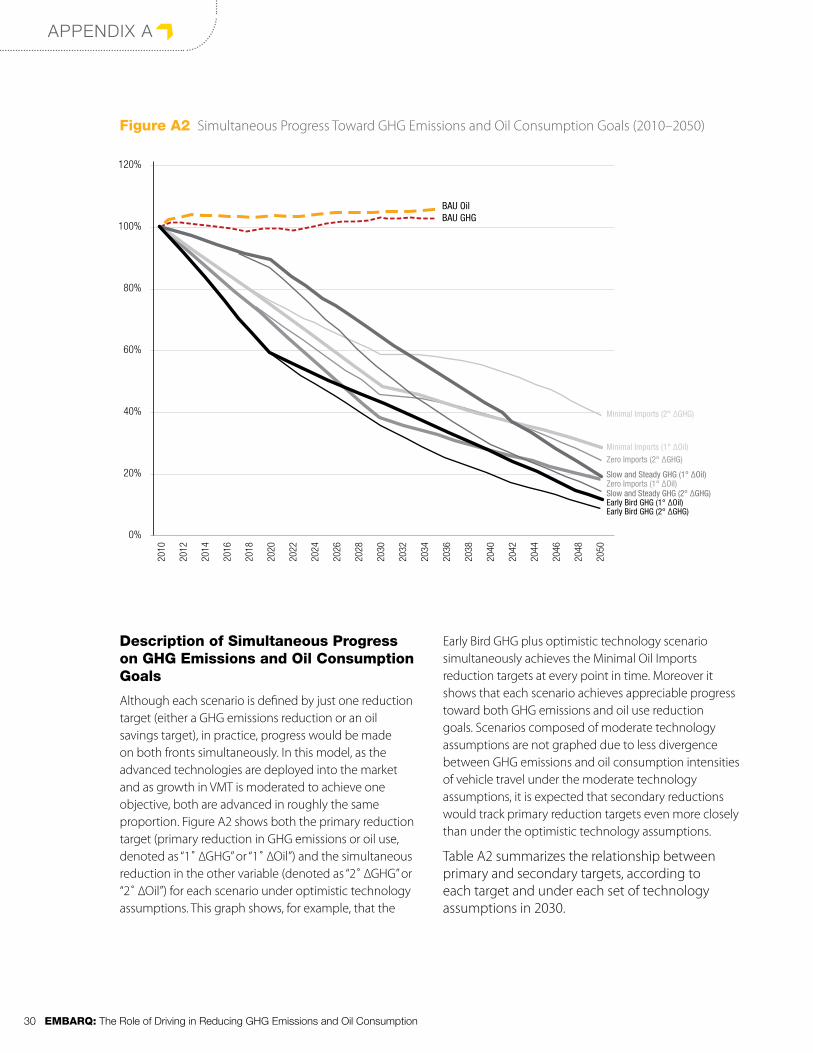
30 EMBARQ: The Role of Driving in Reducing GHG Emissions and Oil Consumption
aPPENDix a
description of Simultaneous Progress on GhG Emissions and Oil Consumption Goals
Although each scenario is defined by just one reduction target (either a GHG emissions reduction or an oil savings target), in practice, progress would be made on both fronts simultaneously. In this model, as the advanced technologies are deployed into the market and as growth in VMT is moderated to achieve one objective, both are advanced in roughly the same proportion. Figure A2 shows both the primary reduction target (primary reduction in GHG emissions or oil use, denoted as “1˚ ∆GHG” or “1˚ ∆Oil”) and the simultaneous reduction in the other variable (denoted as “2˚ ∆GHG” or “2˚ ∆Oil”) for each scenario under optimistic technology assumptions. This graph shows, for example, that the
Early Bird GHG plus optimistic technology scenario simultaneously achieves the Minimal Oil Imports reduction targets at every point in time. Moreover it shows that each scenario achieves appreciable progress toward both GHG emissions and oil use reduction goals. Scenarios composed of moderate technology assumptions are not graphed due to less divergence between GHG emissions and oil consumption intensities of vehicle travel under the moderate technology assumptions, it is expected that secondary reductions would track primary reduction targets even more closely than under the optimistic technology assumptions.
Table A2 summarizes the relationship between primary and secondary targets, according to each target and under each set of technology assumptions in 2030.
figure A2 Simultaneous Progress Toward GHG Emissions and Oil Consumption Goals (2010–2050)
120%
100%
80%
60%
40%
20%
0%
2010
2012
2014
2016
2018
2020
2022
2024
2026
2028
2030
2032
2034
2036
2038
2040
2042
2044
2046
2048
2050
BAU OilBAU GHG
Minimal Imports (1° ∆Oil)
Minimal Imports (2° ∆GHG)
Zero Imports (2° ∆GHG)
Slow and Steady GHG (1° ∆Oil)Zero Imports (1° ∆Oil)Slow and Steady GHG (2° ∆GHG)Early Bird GHG (1° ∆Oil)Early Bird GHG (2° ∆GHG)

EMBARQ: The Role of Driving in Reducing GHG Emissions and Oil Consumption 31
aPPENDix a
PrIMAryTArGET(%∆VS.2010)
VMTPErCAPITA(%∆VS.2010)
SIMULTANEOUSPrOGrESSTOWArDSECONDAry
TArGET(%∆VS.2010)
MinimalOilImportsin2030
52% reduction in oil consumption-20% 48% reduction in GHG emissions*
+6% 42% reduction in GHG emissions**
ZeroOilImportsin2030 63% reduction in oil consumption-38% 59% reduction in GHG emissions*
-18% 55% reduction in GHG emissions**
EarlyBirdGHGreductions
57% reduction in GHG emissionsb-35% 61% reduction in oil consumption*
-23% 65% reduction in oil consumption**
SlowandSteadyGHGreductions
36% reduction in GHG emissions-2% 41% reduction in oil consumption*
+16% 47% reduction in oil consumption**
Notesa. The year 2030 is especially definitive for oil reduction targets since they estimate oil reductions in 2030 consistent with minimal or zero oil
imports – based on present-day domestic production.b. The 2030 point on the straight-line projection between 2020 and 2050.* Based on the moderate technology assumptions** Based on the optimistic technology assumptions
Table A2 Summary of Simultaneous Progress Toward GHG Emissions and Oil Use Objectives in 2030a

32 EMBARQ: The Role of Driving in Reducing GHG Emissions and Oil Consumption
fOREwORD
U.S.CODErEFErENCESAFETEA-LUrEFErENCE PrOGrAMNAME E
VALU
AT
ION
SS
HO
W
EV
IDE
NC
EO
Fr
ED
UC
TIO
NS
CA
NF
UN
DC
LEA
N-T
EA
T
yP
ES
Tr
AT
EG
IES
TITLEI-FEDErAL-AIDHIGHWAyS
23 USC 119 & 104(b)(4) 1101(a)(1) Interstate Maintenance Program
23 USC 103 & 104(b)(1) 1101(a)(2) National Highway System
23 USC 144 1101(a)(3) Highway Bridge Program
23 USC 133 & 104(b)(3) 1101(a)(4), 1113 Surface Transportation Program (STP)
23 USC 149 & 104(b)(2) 1101(a)(5),1808 Congestion Mitigation and Air Quality Improvement Program
23 USC 148 & 104(b)(5) 1101(a)(6), 1401 Highway Safety Improvement Program
23 USC 206 1101(a)(8) Recreational Trails Program
23 USC 120(k) 1119 Federal Lands Highways Program
1101(a)(10), 1302 National Corridor Infrastructure Improvement Program
1101(a)(11), 1303 Coordinated Border Infrastructure Program
23 USC 162 1101(a)(12), 1802 National Scenic Byways Program
23 USC 147 1101(a)(13), 1801 Ferry Boat Discretionary Program
1101(a)(15), 1301 Projects of National and Regional Significance
23 USC 322 1101(a)(18), 1307 Deployment of Magnetic Levitation Transportation Projects
23 USC 114 1101(a)(20), 1502 Highways for LIFE
23 USC 143 & 1115 1101(a)(21), 1115 Highway Use Tax Evasion Projects
1101(a)(17), 1404 Safe Routes to School Program
23 USC 105 1104 Equity Bonus Program
23 USC 104(f), 134, 135, 505
1107 Metropolitan & Statewide Planning
1112 Emergency Relief When Allocations Exceed $100M
1117 Transportation, Community, and System Preservation Program
23 USC 104(b), 303 1201 Real-Time System Management Information Program
1310 Interstate Oasis Program
1405 Roadway Safety Improvements for Older Drivers and Pedestrians
APPENDIX B
RESuLTS OF LiTERaTuRE REviEw OF SELECTED SaFETEa-Lu PROGRamSa
APPENDix B

EMBARQ: The Role of Driving in Reducing GHG Emissions and Oil Consumption 33
aPPENDix B
23 USC 157 1406 Safety Incentive Grants for Use of Seat Belts
23 USC 163 1407 Safety Incentives to Prevent Operation of Motor Vehicles by Intoxicated Persons
1409 Work Zone Safety Grants
1411(a) Road Safety (Data and Public Awareness)
1411(b) Bicycle and Pedestrian Safety Grants
1604(a) Value Pricing Pilot Program
1804 National Historic Covered Bridge Preservation
1807 Nonmotorized Transportation Pilot Program
1906 Grant Program to Prohibit Racial Profiling
TITLEIII-PUBLICTrANSPOrTATION
49 USC 5303, 5304 & 5305 3005, 3006, 3007 Metropolitan and Statewide Planning
49 USC 5307 3009 Urbanized Area Formula Program
49 USC 5308 3010 Clean Fuels Grant Program
49 USC 5309 3011 Major Capital Investments (New Starts & Small Starts)
49 USC 5309 3011 Fixed Guideway Modernization
49 USC 5309 & 5318 3011 Bus and Bus Facilities
49 USC 5310 3012 Transportation for Elderly Persons and Persons with Disabilities
49 USC 5311 3013 Formula Grants for Other than Urbanized Areas
49 USC 5310 3039 Over-the-Road Bus Accessibility Program
49 USC 5316 3018 Job Access and Reverse Commute Program
49 USC 5317 3019 New Freedom Program
49 USC 5320 3021 Alternative Transportation in Parks and Public Lands Program
TITLEIx-rAILTrANSPOrTATION
49 USC 26101 9001 High-speed rail corridor development
49 USC 20154 9002 Capital grants for rail line relocation projects
49 USC 20142 9005 Welded rail and tank car safety improvements
Notea. Databases queried include academic Search Complete, Environmental Complete and Google Scholar. Search terms included evaluation,
report, analysis, impact, GHG, emissions, vmT, oil and fuel; and the names of the programs under review. The Catalogue of u.S. Government Publications was also queried for several programs.
U.S.CODErEFErENCESAFETEA-LUrEFErENCE PrOGrAMNAME E
VALU
AT
ION
SS
HO
W
EV
IDE
NC
EO
Fr
ED
UC
TIO
NS
CA
NF
UN
DC
LEA
N-T
EA
T
yP
ES
Tr
AT
EG
IES
34 EMBARQ: The Role of Driving in Reducing GHG Emissions and Oil Consumption
NOTES
NOTES
1. U.S. Energy Information Administration. 2010. Oil: Crude and Petroleum Products Explained. Online at http://www.eia.doe.gov/energyexplained/index.cfm?page=oil_home#tab2
2. U.S. Energy Information Administration. December 2009. Emissions of Greenhouse Gases Report. Online at http://www.eia.doe.gov/oiaf/1605/ggrpt/
3. American Society of Civil Engineers. 2009. 2009 Report Card for America’s Infrastructure. Online at http://www.infrastructurereportcard.org/
4. U.S. Energy Information Administration. December 2009. Emissions of Greenhouse Gases Report. Online at http://www.eia.doe.gov/oiaf/1605/ggrpt/
5. U.S. Energy Information Administration. 2010. Oil: Crude and Petroleum Products Explained. Online at http://www.eia.doe.gov/energyexplained/index.cfm?page=oil_home#tab2
6. Direct costs of oil independence include transfer of wealth, dislocation losses, and reductions in potential GDP and exclude the peacetime (and wartime) costs of military readiness, which could significantly add to the total “cost” of oil dependence in the United States. D. L. Greene. April 2010. “Measuring Energy Security: Can the United States Achieve Oil Independence?” Energy Policy, 38-4. Online at doi:10.1016/j.enpol.2009.01.041
7. S. Winkelman, A. Bishins, and C. Kooshian. 2009. Cost-Effective GHG Reductions through Smart Growth & Improved Transportation Choices: An Economic Case for Investment of Cap-and-Trade Revenues. Center for Clean Air Policy. Online at http://www.ccap.org/docs/resources/677/CCAP%20Smart%20Growth%20-$%20per%20ton%20CO2%20%28June%202009%29%20FINAL%202.pdf
8. H.R.2724, 111th Cong. 2009. National Transportation Objectives Act of 2009. Online at http://thomas.loc.gov/cgi-bin/query/z?c111:H.R.2724.IH:
9. VMT refers to “vehicle miles traveled.” In this analysis focused on light-duty vehicle travel, VMT simply means the number of miles traveled by cars and light trucks. This measure of travel is distinguished from PMT (person miles traveled). Average vehicle occupancy (persons per vehicle) is typically calculated as PMT/VMT. Carpooling increases personal travel (PMT) relative to vehicle travel (VMT). Decreasing VMT does not necessarily mean that people would spend less time in vehicles or travel less; it does mean that people would tend to spend less time behind the wheel of an automobile. In this analysis, VMT does not include travel on buses, public transit, motorcycles, or bicycles.
10. “Statement of the Honorable Ray LaHood, Secretary of Transportation, before the Committee on Environment and Public Works,” July 14, 2009. Online at www.epw.senate.gov/public/index.cfm?FuseAction=Files.View&FileStore_id=2127b852-f4ce-437c-83a1-1eda266059ab
11. This report discusses sustainability in the context of reductions in oil use and GHG emissions, but the term can alternatively be used to reference economics, health, safety, natural resources conservation, etc.
12. See, for example: A. Bandivadekar, K. Bodek, L. Cheah, C. Evans, T. Groode, J. Heywood, E. Kasseris, M. Kromer, and M.Weiss. July 2008. On the Road in 2035: Reducing Transportation’s Petroleum Consumption and GHG Emissions. Online at http://web.mit.edu/sloan-auto-lab/research/beforeh2/otr2035/On%20the%20Road%20in%202035_MIT_July%202008.pdf
13. S. Winkelman, A. Bishins, and C. Kooshian. 2009. Cost-Effective GHG Reductions through Smart Growth & Improved Transportation Choices: An Economic Case for Investment of Cap-and-Trade Revenues. Center for Clean Air Policy. Online at http://www.ccap.org/docs/resources/677/CCAP%20Smart%20Growth%20-$%20per%20ton%20CO2%20%28June%202009%29%20FINAL%202.pdf. U.S. Energy Information Administration. 2010. Annual Energy Outlook 2010 (reference case). U.S. Environmental Protection Agency. 2009. EPA Analysis of the American Clean Energy and Security Act of 2009. Online at http://www.epa.gov/climatechange/economics/pdfs/HR2454_Analysis.pdf
14. Light duty vehicles include cars and light trucks such as pickups and SUVs.
15. U.S. Energy Information Administration. 2010. Annual Energy Outlook 2010.
16. The initial “sustainable VMT” concept and corresponding model were developed by Chris Ganson.
17. Alternative (non-LDV) modes of transportation are outside the scope of this analysis. This analysis does not take into account any particular strategies to reduce VMT or any increased emissions associated with implementing such strategies; it essentially assumes total reductions in VMT rather than changes in mode. Deeper reductions in LDV VMT may be needed to compensate for increased emissions associated with increased vehicle activity of alternative modes if reductions come from shifts to non-LDV modes.
18. S. Gupta, D.A. Tirpak, N. Burger, J. Gupta, N. Höhne, A.I. Boncheva, G.M. Kanoan, C. Kolstad, J.A. Kruger, A. Michaelowa, S. Murase, J. Pershing, T. Saijo, and A. Sari, “Policies, Instruments and Co-operative Arrangements,” in Climate Change 2007: Mitigation. Contribution of Working Group III to the Fourth Assessment Report of the Intergovernmental Panel on Climate Change. B. Metz, O. R. Davidson, P.R. Bosch, R. Dave, and L. A. Meyer, eds. (United Kingdom and New York: Cambridge University Press, 2007), Box 13.7, p. 776.
19. M.R. Allen et al. April 2009. “Warming Caused By Cumulative Carbon Emissions Towards the Trillionth Tonne,” Nature 458, i30: 1163.
20. U.S. Environmental Protection Agency. Feb. 2010 (last updated, Mar. 2010). EPA Analysis of the Transportation Sector: Greenhouse Gas and Oil Reduction Scenarios. Online at http://www.epa.gov/oms/climate/GHGtransportation-analysis03-18-2010.pdf
21. The EPA scenarios do not extend beyond 2030.
22. While various renewable and clean energy technologies exist for electric power generation, how the emissions intensity of the grid might decrease by 80 percent is outside the scope of this analysis. A sensitivity analysis of this assumption reveals that if the GHG emissions intensity of the grid were to remain constant, the emissions intensity of LDV travel in would decrease only 56.6 percent by 2050, rather than 79.6 percent as illustrated under the current optimistic technology assumptions. In contrast, the estimated oil intensity of travel is not sensitive to the assumption of decreasing grid emissions intensity.

EMBARQ: The Role of Driving in Reducing GHG Emissions and Oil Consumption 35
NOTES
23. Regarding LDV characteristics, the optimistic technology scenario is similar to the “Go-Getter” scenario analyzed in a recent WRI report: N. Biancho, and F. Litz. 2010. Reducing Greenhouse Gas Emissions in the United States Using Existing Federal Authorities and State Action. (Washington, DC.: World Resources Institute, 2010). Online at http://www.wri.org/publication/reducing-ghg-emissions-using-existing-federal-authorities-and-state-action
24. This figure is contextualized by potential improvements in fuel economy assessed in a recent MIT study: A. Bandivadekar et al. 2008. On the Road in 2035: Reducing Transportation’s Petroleum Consumption and GHG Emissions.
25. Based on EMBARQ calculations from reported data on vehicle survivability and mileage, the average probable lifespan of cars and light trucks is approximately 13 years. U.S. Department of Transportation. 2006. Vehicle Survivability and Travel Mileage Schedules (Report No. DOT HS 809 952). Washington, DC: National Highway Traffic Safety Administration, National Center for Statistics and Analysis. Online at http://www-nrd.nhtsa.dot.gov/Pubs/809952.PDF
26. The analysis calculates VMT reductions, but does not make assumptions about how those reductions are achieved (e.g., fewer trips or shift to alternative modes of travel). Therefore, when using this type of modeling to inform policy, assumptions about mode shift, shortened trip length, and the “trips not taken” should be integrated into the model to reflect the suite of policies needed to achieve such reductions.
27. 0.9 percent is an average of the annual population growth rate estimates from 2010 to 2050. “Table 1: Projections of the Population and Components of Change for the United States: 2010 to 2050.” Online at http://www.census.gov/population/www/projections/summarytables.html
28. In this analysis, BAU growth in VMT per capita is calculated according to VMT projections estimated by the U.S. Energy Information Administration through 2035 and extrapolated for this analysis through 2050 according to the 10 year average of the annual growth rates between 2025 and 2035. See Annual Energy Outlook 2010, DOE/EIA-0383(2010).
29. U.S. Environmental Protection Agency, EPA Analysis of the American Clean Energy and Security Act of 2009 (Washington, DC: U.S. Environmental Protection Agency, June 2009)
30. Center for American Progress. July 2010. The “Energy-Only Bill” Mirage: Why an Energy Bill Could Fail Without Pollution Reduction Measures or Revenue. by D. Weiss. Online at http://www.americanprogress.org/issues/2010/06/energy_mirage.html
31. U.S. Energy Information Administration, Oil: Crude and Petroleum Products Explained (Washington, DC: U.S. Energy Information Administration, 2010)
32. U.S. Energy Information Agency, Annual Energy Outlook 2010 (Washington, DC: U.S. Energy Information Agency, 2010)
33. Calculations based on Historical Monthly VMT Report (date of run: March 22, 2010), Federal Highway Administration. Online at http://www.fhwa.dot.gov/policyinformation/travel/tvt/history/
34. Broadly speaking, the “built environment” may include land use and development patterns based on convenience, co-location of destinations, and attractions; balance of jobs and housing in close proximity; and an integrated transportation system focused on travel efficiency. See, for example: R. Ewing, K. Bartholomew, S. Winkelman, J. Walters, and D. Chen, Growing Cooler: The Evidence on Urban Development and Climate Change (Washington, DC: Urban Land Institute, 2008). Online at http://www.smartgrowth.umd.edu/pdf/GrowingCooler-Ch1Overview.pdf
35. Title 23 § 134 and Title 49 § 5303 of the U.S. Code.
36. S. 575, 111th Cong. 2009. Clean Low-Emission Affordable New Transportation Efficiency Act (CLEAN-TEA). H.R.2724, 111th Cong. 2009. National Transportation Objectives Act of 2009. H.R. 2454, 111th Cong. 2009. American Clean Energy and Security Act of 2009.
37. National Surface Transportation Policy and Revenue Study Commission. Transportation for Tomorrow (Washington, DC, 2007)
38. In large part because traditional transportation planning uses transportation models that inherently omit nonmotorized transportation improvements as well as pricing and other issues. Transportation Research Board. 2007. Metropolitan Travel Forecasting: Current Practice and Future Direction. Special Report 288, p. 67. Online at http://onlinepubs.trb.org/onlinepubs/sr/sr288.pdf
39. National Surface Transportation Policy and Revenue Study Commission. December 2007. Transportation for Tomorrow, p. 4. Online at http://transportationfortomorrow.com/final_report/index.htm
40. Public Law 109-59, SAFETEA-LU. 2005. Safe, Accountable, Flexible, Efficient Transportation Equity Act: A Legacy for Users.
41. This report assesses whether each program affects VMT, GHG emissions, or oil use based on existing evidence. The report does not attempt to estimate or verify oil savings or GHG reductions from the programs. The report does not attempt to make an overall determination of effectiveness the federal-aid program.
42. As this section of the report explores programs that can provide funding for projects that reduce vehicle miles traveled, greenhouse gas emissions, and/or fuel consumption, Titles II & IV (Safety), V (Research), VI (Transportation Planning and Project Delivery), VII (Hazardous Materials), VIII & XI (Discretionary Spending and Excise Tax), and X (Miscellaneous) were excluded. Within the titles reviewed (Titles I, III, and IX), the following types of programs were excluded: (a) programs that address freight, ports, and waterways; (b) sections addressing financing; (c) sections funding research, studies, commissions, or centers; and (d) earmarks and state- or city-specific projects.
43. Databases queried include Academic Search Complete, Environmental Complete, and Google Scholar. Search terms included evaluation, report, analysis, impact, GHG, emissions, VMT, oil, fuel, and the names of the programs under review. The Catalogue of U.S. Government Publications was also queried for several programs.
44. National Safe Routes to School Task Force. July 2008. Safe Routes to School: A Transportation Legacy. Online at http://www.saferoutesinfo.org/task_force.
45. National Center for Safe Routes to School Center. April 2010. SRTS Case Study: Boulder, Colorado. Online at http://www.saferoutesinfo.org/case_studies/pdfs/CO.bearcreek.pdf.
46. Safe Routes to School National Partnership. 2008. Safe Routes to School, Steps to a Greener Future. Online at http://www.saferoutespartnership.org/media/file/SRTS_GHG_lo_res.pdf
47. Safe Routes to School National Partnership. 2008. Safe Routes to School, Steps to a Greener Future. Online at http://www.saferoutespartnership.org/media/file/SRTS_GHG_lo_res.pdf
48. Columbia, Missouri; Marin County, California; Minneapolis area, Minnesota; and Sheboygan County, Wisconsin.
49. U.S. Department of Transportation, Federal Highway Administration. November 2007. Interim Report to the U.S. Congress on the Nonmotorized Transportation Pilot Program SAFETEA-LU Sec 1807. Online at http://www.fhwa.dot.gov/environment/bikeped/ntpp/toc.htm

36 EMBARQ: The Role of Driving in Reducing GHG Emissions and Oil Consumption
NOTES
50. U.S. Department of Transportation, Federal Highway Administration. September 2009. Report to Congress on the Value Pricing Pilot Program Through May 2009, September 2009. Online at http://www.ops.fhwa.dot.gov/tolling_pricing/value_pricing/pubs_reports/rpttocongress/pdf/vppp09rpt.pdf
51 U.S. Department of Transportation, Federal Highway Administration. September 2009. Report to Congress on the Value Pricing Pilot Program Through May 2009, September 2009. Online at http://www.ops.fhwa.dot.gov/tolling_pricing/value_pricing/pubs_reports/rpttocongress/pdf/vppp09rpt.pdf
52. While there was no explicit evaluation of VMT, GHG emissions, or oil use reductions for this program, mode shift to transit has been shown to reduce all of these metrics (see the second part of this section for citations).
53. U.S. Department of Transportation, Federal Highway Administration. October 2008. SAFETEA-LU 1808: Congestion Mitigation and Air Quality Improvement Program Evaluation and Assessment - Phase 1 Final Report. Online at http://www.fhwa.dot.gov/environment/cmaqpgs/safetealu1808/index.htm
54. P. Thakuriah, P. S. Siraj, S. Sööt, and J. Persky, Economic Benefits of Employment Transportation Services (Chicago: University of Illinois at Chicago, 2008). Online at http://www.fta.dot.gov/funding/grants/grants_financing_9292.html
55. While there was no explicit evaluation of VMT, GHG, or oil use reductions for this program, the mode shift to transit has been shown to reduce all of these metrics (see the second part of this section for citations).
56. http://www.friendsofacadia.org/projects.shtml
57. Texas Transportation Institute,. Innovative Transportation Planning Partnerships to Enhance National Parks and Gateway Communities (2009)
58. S. 1329, 111th Cong. 2009. Clean Low-Emission Affordable New Transportation Efficiency Act (CLEAN-TEA).
59. For an alternative list of “carbon-reducing transportation strategies” that could be examined, see the U.S. Department of Transportation’s recent report on GHG emissions reductions from transportation. Transportation’s Role in Reducing U.S. Greenhouse Gas Emissions (Washington, DC: U.S. Department of Transportation, 2010)
60. American Power Act Discussion draft, online at http://lieberman.senate.gov/assets/pdf/APA_full.pdf
61. S. 1733, 111th Cong. 2009. Clean Energy Jobs and American Power Act.
62. H.R. 2454, 111th Cong. 2009. American Clean Energy and Security Act of 2009.
63. Strategies such as electric vehicle infrastructure improvements could play a supportive role in reducing emissions and would be essential for the actual implementation of the vehicle technology scenarios described in Part I. The prospect of GHG emissions reductions from vehicle electrification depends on the availability of a clean power supply (which exists as an assumption in Part I). Electric vehicle infrastructure improvements are generally left outside the scope of the review for this reason.
64. Referring here to the modes of bus, rail, and other mass transit infrastructure: http://www.publictransportation.org/facts/
65. ICF International. January 2007. “Petroleum Savings in the U.S.: Reducing Dependence on Oil,” by L. Bailey. Online at http://www.apta.com/resources/reportsandpublications/Documents/apta_public_transportation_fuel_savings_final_010807.pdf
66. The report looks at the United States and Canada as a “region” and does not provide disaggregated estimates of oil savings.
67. International Energy Agency. 2005. Saving Oil in a Hurry (Paris, France: OECD, 2005).
68. International Energy Agency. 2005. Saving Oil in a Hurry (Paris, France: OECD, 2005).
69. U.S. Department of Transportation. April 2010.Transportation’s Role in Reducing U.S. Greenhouse Gas Emissions Report to Congress.
70. U.S. Department of Transportation, Federal Transit Administration. January 2010. Public Transportation’s Role in Responding to Climate Change. Online at http://www.fta.dot.gov/documents/PublicTransportationsRoleInRespondingTo ClimateChange2010.pdf
71. See, for example, http://www.completestreets.org
72. Urban Land Institute, Cambridge Systematics, Inc. July 2009. Moving Cooler.
73. U.S. Department of Transportation. April 2010. Transportation’s Role in Reducing U.S. Greenhouse Gas Emissions Report to Congress.
74. J. Dill and T. Carr. 2003. “Bicycle Commuting and Facilities in Major U.S. Cities: If You Build Them, Commuters Will Use Them.” Transportation Research Record: Journal of the Transportation Research Board 1828: 116–123.
75. U.S. Environmental Protection Agency. 2009. “Residential Construction Trends in America’s Metropolitan Regions,” by J. Thomas.
76. “Atlantic Station: 2008 Project XL Report”. 2008. Online at http://www.atlanticstation.com/concept_green_projectXL08.php
77. Sacramento Area Council of Governments. 2007. Metropolitan Transportation Plan for 2035. Online at http://www.sacog.org/mtp/2035/
78. U.S. Environmental Protection Agency. November 2007. Measuring the Air Quality and Transportation Impacts of Infill Development. EPA-231-R-07-001. Online at http://www.epa.gov/dced/pdf/transp_impacts_infill.pdf
79. P. Haas, G. Miknaitis, H. Cooper, L. Young, and A. Benedict. March 2010. Transit Oriented Development and the Potential for VMT-related Greenhouse Gas Emissions Growth Reduction Center for Neighborhood Technology. Online at http://www.cnt.org/repository/TOD-Potential-GHG-Emissions-Growth.FINAL.pdf.
80. M. Bürer, D. Goldstein, and J. Holtzclaw. August 2004. Location Efficiency as the Missing Piece of the Energy Puzzle: How Smart Growth can Unlock Trillion Dollar Consumer Cost Savings. Presented at the 2004 ACEEE Summer Study on Energy Efficiency in Buildings, Asilomar, California, August 2004.
81. U.S. Department of Transportation. 2010. Transportation’s Role in Reducing U.S. Greenhouse Gas Emissions.
82. Urban Land Institute, Cambridge Systematics, Inc. July 2009. Moving Cooler.
83. This study reported results in VKT (vehicle kilometers traveled); however, since the results were reported in percentages and therefore consistent with VMT, VMT was used for consistency.
84. International Energy Agency, Saving Oil in a Hurry (International Energy Agency, 2005)
85. International Energy Agency, Saving Oil in a Hurry (International Energy Agency, 2005)
86. International Energy Agency, Saving Oil in a Hurry (International Energy Agency, 2005)
87. U.S. Department of Transportation. 2010. Transportation’s Role in Reducing U.S. Greenhouse Gas Emissions.
EMBARQ: The Role of Driving in Reducing GHG Emissions and Oil Consumption 37
NOTES
88. Federal Transit Administration. 2010. Public Transportation’s Role in Responding to Climate Change. Online at http://www.fta.dot.gov/planning/planning._nvironment_9051.html
89. National Capital Region Commuter Connections Program. 2009. Transportation Emission Reduction Measure Analysis Report, FY2006-2008. Online at http://www.mwcog.org/store/item.asp?PUBLICATION_ID=341
90. Urban Land Institute, Cambridge Systematics, Inc. July 2009. Moving Cooler.
91. Mineta Transportation Institute. June 2010. Greenhouse Gas Emission Impacts of Carsharing in North America, by E. Martin and S. Shaheen, Report 09-11. Online at http://76.12.4.249/artman2/uploads/1/Greenhouse_Gas_Emission_Impacts_of_Carsharing_in_North_America.pdf
92. Urban Land Institute, Cambridge Systematics, Inc. July 2009. Moving Cooler.
93. Brookings Institution, Pay-As-You-Drive Auto Insurance: A Simple Way to Reduce Driving-Related Harms and Increase Equity, by J. Bordoff and P. Noel, (Washington, DC: Brookings Institution, 2008)
94. North Central Texas Council of Governments. November 2008. Pay-as-you-Drive Insurance Pilot Program, Phase II: Final Report. Online at http://www.nctcog.org/trans/air/programs/payd/
95. U.S. Department of Transportation. 2010. Transportation’s Role in Reducing U.S. Greenhouse Gas Emissions.
96. Urban Land Institute, Cambridge Systematics, Inc. July 2009. Moving Cooler.
97. U.S. Department of Transportation, Federal Highway Administration. 1998. Strategies to Reduce Greenhouse Gas Emissions from Transportation Sources. Online at www.fhwa.dot.gov/environment/glob_c5.pdf
98. Urban Land Institute, Cambridge Systematics, Inc. July 2009. Moving Cooler.
99. Level of service (LOS) is a system of describing road performance. LOS A is the best grade, down to E, the worst grade. Maintaining an LOS of D or higher would be an improvement for the portion of roads that FHWA estimates will be operating at LOS E. U.S. Department of Transportation. 2010. Transportation’s Role in Reducing U.S. Greenhouse Gas Emissions, pp. 5–26.
100. U.S. Department of Transportation. 2010. Transportation’s Role in Reducing U.S. Greenhouse Gas Emissions.
101. L. Abboud and J. Clevstrom. August 2006. “Stockholm’s Syndrome” Wall Street Journal, August 29, 2006.
102. Recommendation of the Traffic Congestion Mitigation Commission. 2008. Online at https://www.nysdot.gov/programs/congestion_mitigation_commission/interim-report
103. Transport for London, Central London Congestion Charging: Impacts Monitoring, Sixth Annual Report(London: Transport for London, 2008)
104. U.S. Department of Transportation. 2010. Transportation’s Role in Reducing U.S. Greenhouse Gas Emissions.
105. Urban Land Institute, Cambridge Systematics, Inc. July 2009. Moving Cooler.
106. U.S. Department of Transportation, Strategies to Reduce Greenhouse Gas Emissions from Transportation Sources (Washington, DC: U.S. Department of Transportation, 1998)
107. D. Shoup. 1997. “The High Cost of Free Parking.” Journal of Planning Education and Research 17(1).
108. U.S. Department of Transportation. 2010. Transportation’s Role in Reducing U.S. Greenhouse Gas Emissions.
109. International Energy Agency, Saving Oil in a Hurry (International Energy Agency, 2005)
110. The American Consumer Institute. October 2007. “Broadband Services: Economic and Environmental Benefits,” by J. Fuhr and S. Pociask. Online at http://www.theamericanconsumer.org/2007/10/31/broadband-services-economic-and-environmental-benefits/
111. B. Vergakis. 2009. “Utah’s 4-day Workweek Cuts Energy Use 13 Percent.” Associated Press, August 5, 2009.
112. U.S. Department of Transportation. 2010. Transportation’s Role in Reducing U.S. Greenhouse Gas Emissions.
113. U.S. Department of Transportation. 2010. Transportation’s Role in Reducing U.S. Greenhouse Gas Emissions.
114. McKinsey & Company. March 2009. Roads Toward a Low-Carbon Future: Reducing CO2 Emissions from Passenger Vehicles in the Global Road Transportation System? Online at http://www.mckinsey.com/clientservice/sustainability/pdf/roads_toward_low_carbon_future_new.pdf
115. M. Barth and K. Boriboonsomsin. 2008. “Traffic Congestion and Greenhouse Gases.” Access 35, Fall 2008, University of California Riverside. Online at http://www.uctc.net/access/35/access35.pdf
116. U.S. Federal Transit Administration. 2010. Public Transportation’s Role in Responding to Climate Change.
117. “Tracking High-Speed Rail’s Energy Use and Emissions.” Berkeley Transportation Letter, available at http://its.berkeley.edu/btl/2010/spring/HRS-life-cycle
118. U.S. Department of Transportation. 2010. Transportation’s Role in Reducing U.S. Greenhouse Gas Emissions.
119. J. Schwieterman, L. Fischer, and S. Smith. November 2008. 2008 Update on Intercity Bus Service: Summary of Annual Change, Chaddick Institute Policy Study. Online at http://las.depaul.edu/chaddick/docs/Docs/2008_Update_on_Intercity_Bus_Service.pdf
120. See, for example, Building America’s Future. (undated). Guiding Principles for Federal Transportation Legislation. Online at http://www.investininfrastructure.org/Websites/investininfrastructure/Images/BAF%20Principles%20Final.pdf or American Public Works Association. (undated). Position on the Reauthorization of Federal Surface Transportation Programs. Online at http://www.apwa.net/documents/safetea-lu/action/Position%20Statement.pdf
121. U.S. Federal Highway Administration. September 2010. Federal-Aid Highway Program Funding for Pedestrian and Bicycle Facilities and Programs: FY 1992 to 2009. Online at http://www.fhwa.dot.gov/environment/bikeped/bipedfund.htm
122. U.S. Federal Highway Administration. September 2010. Federal-Aid Highway Program Funding for Pedestrian and Bicycle Facilities and Programs: FY 1992 to 2009. Online at http://www.fhwa.dot.gov/environment/bikeped/bipedfund.htm
123. U.S. Federal Highway Administration. September 2010. Highway Authorizations: Safe, Accountable, Flexible, Efficient Transportation Equity Act: A Legacy for Users (P.L. 109-59). Online at http://www.fhwa.dot.gov/safetealu/fundtables.htm
124. U.S. Federal Highways Administration. 2010. Our Nation’s Highways: 2010. Online at http://www.fhwa.dot.gov/policyinformation/pubs/pl10023/fig6_3.cfm
125. American Public Transportation Association. 2009. APTA Primer on Transportation Funding: The Safe, Accountable, Flexible, Efficient Transportation Equity Act: A Legacy for Users, and Other Related Laws, FY 2004 Through FY2009. Online at http://www.apta.com/gap/policyresearch/Documents/Primer_SAFETEA_LU_August_2009_Update.pdf
126. U.S. Environmental Protection Agency. April 2010. Inventory of U.S. Greenhouse Gas Emissions and Sinks: 1990-2008. Online at http://epa.gov/climatechange/emissions/usinventoryreport.html

38 EMBARQ: The Role of Driving in Reducing GHG Emissions and Oil Consumption
NOTES
127. U.S.Energy Information Administration. 2009. 2008 Emissions of Greenhouse Gases Report. Online at http://www.eia.doe.gov/oiaf/1605/ggrpt/
128. http://www.epa.gov/smartgrowth/partnership/
129. Bipartisan Policy Center. 2009. Performance Driven: A New Vision for U.S. Transportation Policy. Online at http://www.bipartisanpolicy.org/sites/default/files/NTPP%20Report.pdf
130. U.S. Energy Information Agency. May 2010. Annual Energy Outlook 2010, DOE/EIA-0383(2010).
131. Based on EMBARQ calculations from reported data on vehicle survivability and mileage, the average probable lifespan of cars and light trucks is approximately 13 years. U.S. Department of Transportation, Vehicle Survivability and Travel Mileage Schedules (Washington, DC: U.S. Department of Transportation, 2006), Report No. DOT HS 809 952.
132. Corresponding conversion factors were: 42 gallons per barrel (oil), and 8,891 gCO2e per gallon (GHG emissions). This represents the direct emissions from gasoline combustion; total fuel cycle emissions from the extraction, shipment, refining, and distribution of gasoline were not taken into account.
133. A recent EPA analysis assumes 250 W-hr/mile (or 853 Btu/mile) for electric-powered vehicles through 2030 as well as a 79 percent efficiency (21 percent loss) in distribution and battery storage. By comparison, the Toyota Prius is estimated to consume approximately 2,500 Btu per mile when running on electricity. This analysis assumes a net electricity demand from the grid of 1,080 Btu/mile. U.S. Environmental Protection Agency, EPA Analysis of the Transportation Sector: Greenhouse Gas and Oil Reduction Scenarios(Washington, DC: U.S. Environmental Protection Agency, 2010)
134. While this approach does capture the direct emissions from vehicles’ electricity use, the total lifecycle emissions from the extraction, processing, shipment, or distribution of primary energy (such as coal) used for electricity generation are not taken into account.
135. U.S. Environmental Protection Agency, EPA Analysis of the Transportation Sector: Greenhouse Gas and Oil Reduction Scenarios (Washington, DC: U.S. Environmental Protection Agency, 2010)
136. U.S. Environmental Protection Agency, EPA Analysis of the Transportation Sector: Greenhouse Gas and Oil Reduction Scenarios (Washington, DC: U.S. Environmental Protection Agency, 2010)
137. A. Bandivadekar et al. 2008. On the Road in 2035: Reducing Transportation’s Petroleum Consumption and GHG Emissions. Online at http://web.mit.edu/sloan-auto-lab/research/beforeh2/otr2035/On%20the%20Road%20in%202035_MIT_July%202008.pdf
138. See http://10.baldos.se/
139. U.S. Energy Information Agency. May 2010. Annual Energy Outlook 2010, DOE/EIA-0383 (2010).
140. S. 3601. 111th Congress. 2010. A Bill to Promote the Oil Independence of the United States.
141. International Energy Agency, Annual Energy Outlook 2010.
142. U.S. Environmental Protection Agency, Inventory of U.S. Greenhouse Gas Emissions and Sinks: 1990–2008 (Washington, DC: U.S. Environmental Protection Agency, 2010)

10 G Street NE Suite 800 Washington, DC 20002 202-729-7600
MeXiCoCalle Belisario Dominguez #8, Planta Alta
Colonia Villa Coyoacán, C.P. 04000Delegacion Coyoacán, México D.F.
+52 (55) 3096-5742 www.ctsmexico.org
BRAZil
471 Rua Luciana de Abreu #801, Porto Alegre/RS
BRASIL, 90570-060+55 (51) 33126324www.ctsbrasil.org
TURKeY
Tufekci Salih Sok. No: 56 Amaysa Apt., Beyoglu
34433 Istanbul, Turkey+90 (212) 244 74 10www.sumturkiye.org
inDiA
Godrej and Boyce PremisesGaswork Land, Lalbaug
Parel, Mumbai 400012+91 22 24713565www.cstindia.org
AnDeAn RegionPalacio Viejo 216, Oficina 306
Arequipa, PerúTel:+51 54959695206www.ctssandino.org
www.embarq.org
www.wri.org
ISB
N 9
78-1
-569
73-7
70-5