recollection bias and its underpinnings: lessons from ... recollection bias is the phenomenon in...
TRANSCRIPT
Recollection Bias and Its Underpinnings:
Lessons from Terrorism-Risk Assessments*
by
W. Kip Viscusi† and Richard J. Zeckhauser
‡
July 7, 2016
* Jacob Byl and Clayton Masterman provided excellent research assistance, and the U.S.C. CREATE Project
provided partial financial support for the survey expenses. The Risk Analysis area editor, Warner North, and two
anonymous reviewers provided valuable suggestions. † University Distinguished Professor of Law, Economics, and Management, Vanderbilt Law School, 131 21st Ave.
South, Nashville, TN 37203. [email protected]. ‡ Frank P. Ramsey Professor of Political Economy, Kennedy School of Government, Harvard University,
Cambridge, MA 02138. [email protected].
Forthcoming in Risk Analysis
Abstract
Recollection bias is the phenomenon in which people who observe a highly unexpected event
hold current risk beliefs about a similar event that are no higher than their recollection of their
prior beliefs. This article explores recollection bias in relation to individuals’ perceptions of the
risks of terrorism attacks. Over 60% of respondents in a national U.S. sample of over 900 adults
believe that the current risk of a future terrorist attack by either an airplane or in a public setting
is no higher than they recall having believed respectively before the 9/11 attack and before the
Boston Marathon bombing. By contrast, a rational Bayesian model would update to a higher
currently assessed risk of these previously uncontemplated events. Recollection bias is a
persistent trait: individuals who exhibited this bias for the 9/11 attack tended to exhibit it for the
Boston Marathon bombing. Only one-fifth of respondents are free of any type of recollection
bias. Recollection bias is negatively correlated with absolute levels of risk belief. Recollection
bias in relation to highly unexpected terrorist events—the belief that perceived risks did not
increase after the surprise occurrence—dampens support for a variety of anti-terrorism measures,
controlling for the level of risk beliefs and demographic factors. Persistent recollection bias for
both 9/11 and the Boston Marathon bombing is especially influential in diminishing support for
protective policy measures, such as surveillance cameras in public places. Given that public
attitudes influence policy, educating the public about risk is critical.
Keywords: Recollection bias, hindsight bias, terrorism, risk perception, catastrophe
1
1. INTRODUCTION
Catastrophic events that result from deliberate action pose well-established challenges for
individuals’ risk beliefs. Fortunately, such major catastrophes, which impose sudden harm on
large numbers of victims, are rare events in our society. This infrequency implies that most
Americans have little experience to draw on when forming risk beliefs regarding the potentially
huge losses attendant on purposeful catastrophic events. This factor alone implies that there is
the considerable likelihood that risk judgments will be seriously flawed. Public support for
policies arrayed against terrorism will be affected.
Small probabilities often promote dramatic departures from rational decision; witness the
vertical leap of the probability weighting function of prospect theory (Kahneman and Tversky(1)
)
at the bottom of the probability scale. Understandably, most decision experiments in the
laboratory involve mechanical devices, such as pulling balls from urns. Though such devices
can produce very small probabilities, those probabilities are much more easily grasped than
equivalent-sized probabilities associated with natural disasters. And even with natural disasters,
such as hurricanes, we have a reference class.
Terrorist events present several grave challenges for decision making. They involve very
small probabilities. They tend to be sui generis, defeating efforts to identify a reference class.
They are purposeful events, which makes them much harder to assess than even natural disasters.
Significant behavioral biases should be anticipated when humans assess and respond to terrorist
events.
In assessing a significant past event, it is valuable to reconstruct one’s expectations
before the event. This is particularly true when formulating future policies, when one has to
estimate the probability that a similar event will occur. Was the past event a bolt from the blue,

2
i.e., something impossible to anticipate, or was it an event a prudent person could have
anticipated? The answer will guide estimated probabilities of similar future events, and/or
enable us to prepare as best possible for events that are not on our radar screen.
Our prime question is: How well can individuals assess how they viewed a past
significant event before it happened? We focus on events with negative high consequences that
public information reveals were either completely unanticipated, ignored, or assigned a very low
probability before they occurred. Prime examples would be 9/11, the unanticipated rise of ISIS,
and the 2008 financial meltdown. If people have a biased recall of how they viewed the
likelihood of such events, that will impair our ability to anticipate major events in the future.
This article addresses two catastrophic attacks against the United States: the September
11, 2001, attack on four planes, the World Trade Center, and the Pentagon that killed 2,977
victims and shook the nation, and the April 15, 2013, bombing at the Boston Marathon that
caused 3 deaths and 264 injuries. There were airplane hijackings prior to 9/11. By September
10, 2001, however, airport screening mechanisms were in place, and hijackings or attempted
hijackings of planes from the U.S. had become extremely rare. Moreover, hijacked planes had
never been used as weapons to target populated areas. In the three years before the 9/11 attack,
the total annual number of deaths of U.S. citizens from anti-U.S. attacks by terrorists had ranged
from 6 to 23, while the two years after 9/11 respectively claimed 27 and 35 American lives
(National Safety Council(2)
). These statistics include attacks outside the U.S. as well, so they
overstate the domestic risks assessed in our survey.
The Boston Marathon bombing was a less distinctive phenomenon than 9/11, particularly
since 9/11 had already occurred. Nevertheless, terrorist attacks in U.S. public places had been
rare. The Oklahoma City bombing in 1995 had killed 168 people, but this was a domestic act
3
unrelated to international conflicts. Thus, one would expect either of these unanticipated,
shocking catastrophes to lead Americans to significantly update their risk beliefs regarding future
catastrophes inspired by international terrorism, with 9/11 producing a more massive update.
We examine whether actual updates reflect this expectation.
The particular phenomenon that we focus on in this article is what Viscusi and
Zeckhauser(3)
termed recollection bias. This term means that after the experience of a highly
surprising adverse event, people recollect their risk beliefs prior to the event to have been no
lower than what they currently believe about future risk levels. The initial article used
convenience samples of student respondents and found evidence of recollection bias after the
9/11 attack. We take a similar survey approach to explore whether there is recollection bias with
respect to both the 9/11 attack as well as the Boston Marathon bombing, to examine the
persistence of recollection bias, and to examine the implications of this bias for risk assessments
and policy preferences. Because this article uses a national adult sample rather than student
samples, it is also possible to analyze the role of demographic characteristics in influencing
recollection bias, risk beliefs, and policy preferences.
2. RECOLLECTION BIAS AND ITS UNDERPINNINGS
We test four principal hypotheses to explore the existence and ramifications of
recollection bias:
Hypothesis 1: There will be recollection bias with respect to both 9/11 and the Boston
Marathon bombing.
Hypothesis 2: Individuals who display recollection bias for one of these terrorist attacks
will be significantly more likely to reflect it for the other event.
4
Hypothesis 3: Recollection bias will be associated with a failure to update beliefs, both
recalled and future looking.
Hypothesis 4: Individuals displaying recollection bias will be less supportive of anti-
terrorist measures.
To foreshadow our results, all four of our hypotheses are confirmed.
2.1 Relationship of Recollection Bias to Hindsight Bias
Recollection bias is quite different from but closely related to hindsight bias. Hindsight
bias (Fischhoff(4)
) promotes Monday morning quarterbacking on business and life decisions:
“She shouldn’t have made that investment; he shouldn’t have married that woman.” Hindsight
bias has been studied in detail in relation to juror behavior in liability cases (Rachlinski(5)
; Hastie,
Schkade, and Payne(6)
; Viscusi(7)
; and Sunstein et al.(8)
). Kelman, Fallas, and Folger(9)
examine
different experimental reference points for hindsight bias and refer to after-the-fact judgments by
external observers, such as jurors, as “third-party hindsight bias.”
Both hindsight bias and recollection bias compare two assessments of the likelihood of a
significant event from the past. They both ask current individuals to report what they believed
about the likelihood of a salient event before it occurred. Call this the retrospective assessment.
However, the two concepts differ completely in the comparator they employ for the retrospective
assessment. Hindsight bias compares it to prospective assessments that were made before the
event. Recollection bias compares an individual’s retrospective assessment to that individual’s
prospective assessment of a similar event looking forward.
Hindsight bias usually compares prospective assessments by one group of subjects before
an event with retrospective assessments by either the same or a different group of similar
subjects after the event. Recollection bias, by contrast, makes all assessments after an event, and
5
asks each individual to make two assessments, what she believed before the event and what she
believes now. It is intrinsically a within-subject phenomenon. If anything, the restriction to a
within-subjects format creates a pressure against finding recollection bias. An individual in
theory could compare her own two assessments, and recognize that the information provided by
the past event should increase her probability estimate for a future event.
Given hindsight bias, people will overestimate the extent to which a low-probability
event had been predictable. In its extreme form, hindsight bias is reflected in the statement: “I
knew it all along.” In a more moderate version, it would be: “I always knew it was a real
possibility.” Thus, with hindsight bias, neither 9/11 nor the Boston Marathon bombing would be
thought afterwards to have been a substantial surprise. Not infrequently, hindsight bias is
exhibited by a third party who blames a decision maker for not taking adequate precautions.
“Monday morning quarterbacking,” where a sports fan explains why a player or manager made a
different decision, exemplifies hindsight bias combined with blaming.
2.2 Fundamentals of Bayesian Learning about Terrorism Risks
To examine how a rational learning process works, consider the following stylized
example involving drawing balls from a Bernoulli urn consisting of red and white balls. Let the
matter of concern be the probability of drawing a red ball. The prior assessed probability is
given by a beta distribution with parameters b and c, whereby the prior belief is equivalent to
having drawn b red balls and c white balls. The initial perceived probability of drawing a red
ball is b/(b+c). If the person draws a ball from the urn and sees that it is red, the probability is
updated to (b+1)/(b+c+1); drawing a white ball reduces the assessed probability to b/(b+c+1).
New draws change risk beliefs less as (b+c) increases. In short, the less information initially, the
more the draw of a single ball from the urn should change risk beliefs.
6
To illustrate, to deal with a highly unlikely situation where a single occurrence would
lead the posterior probability to be massively greater than the prior probability, we might have
b=0.01 and c=10, hence a prior probability of 1/1,001=0.001. A single trial would consist of a
year with or without an event. If the event did occur, the probability would jump to
1.01/11.01=0.092, or by a multiple of more than 90.
If the probability and magnitude of an adverse event are positively correlated, a more
extreme event will convey more information. Here are three examples where a positive
correlation would seem plausible: (1) There is an extreme outbreak in a region of a mosquito-
carried disease. Knowing nothing more, this would lead you to believe that infected mosquitoes
are more prevalent in that region, hence the probability of any size outbreak is greater. (2) You
do not know how stable or unstable is a securities market. You learn that it dropped 5% in a day
last week, suggesting that it is more unstable than you thought. A 2% drop next week has
become more likely. (3) In November 2015, ISIS launched a terrorist attack in Paris that killed
130 people. This suggested that ISIS had greater capability to launch attacks in Europe than
would have an ISIS-directed attack that killed 4 people. The likelihood of a successful future
ISIS-directed attack in Europe was greater than would have been the case after a hypothetical
four-death attack.
2.3 Risk, Uncertainty, Ambiguity, and Ignorance
When a low probability event occurs, its likelihood of reoccurrence should be multiplied.
In a rational Bayesian framework, greater variability in the prior estimate of the probability—its
uncertainty or ambiguity1—will multiply the likelihood further. Thus, in the beta distribution
1 Knight
(10) distinguished between risk, where probabilities are known, and uncertainty, where they are unknown.
Decision theorists, including the authors, usually treat uncertainty by positing a prior probability distribution, often
subjectively determined, on the underlying probability. Ellsberg(11)
employed the term ambiguity to apply to
uncertainty situations.
7
example above, low values of b and c imply that prior beliefs are loosely held. Thus, the effect
of a terrorist attack event on risk beliefs should be substantial.
The metaphor of drawing balls from an urn, when those balls are known to be red or
white, dramatically underestimates the monumental surprise associated with some terrorist
attacks, such as 9/11. A more appropriate analogy might be drawing a ball from an urn when the
composition of their colors is completely unknown. The ball turns out to be checked with colors
of chartreuse and magenta. Posit that one had been asked in advance about the likelihood of
getting such a marble on a single draw when asked along with a vast number of other
possibilities. The response might have been 1 in 100,000.2 However, having drawn one such
ball, a rational Bayesian assessor might assign the likelihood as 1 in 20 that the next ball would
also be checked chartreuse and magenta. Note the synergy between the low likelihood and the
massive ambiguity that enters once marbles need not be a solid single color.3
Very low probabilities allow for great ambiguity, hence massive updates in probabilities.
With our checked chartreuse magenta example, a single ball draw made the outcome 5,000 times
more likely.4 By contrast, if one’s prior probability estimate for an event is 2%, for example, its
posterior likelihood can multiply by no more than 50.
Neither the general public nor many risk experts foresaw a homeland attack of the level
and character of the 9/11 event. It differed in damage by many orders of magnitude and in
fatalities by an order of magnitude from any prior terrorist incident on American soil. It also had
many more perpetrators than any prior incident, it used a weapon hardly contemplated by
2 Of course, asking about a specific pattern and color combination would lead the subject to raise that probability.
That is why it is important to ask about a “vast number of other possibilities.” 3 This example adds layers of ambiguity above the one described by Ellsberg
(11), since the possible colors are not
known, there is the possibility of mixed colors, and the colors can be in varying patterns, or indeed non-patterns. 4 This would be consistent with a beta prior with b representing a checked chartreuse magenta marble, and c all other
color marbles. Here, b would be 0.0002 and c would be 20. Technically, the posterior would really be
1.0002/21.0002, or slightly above 1/21.
8
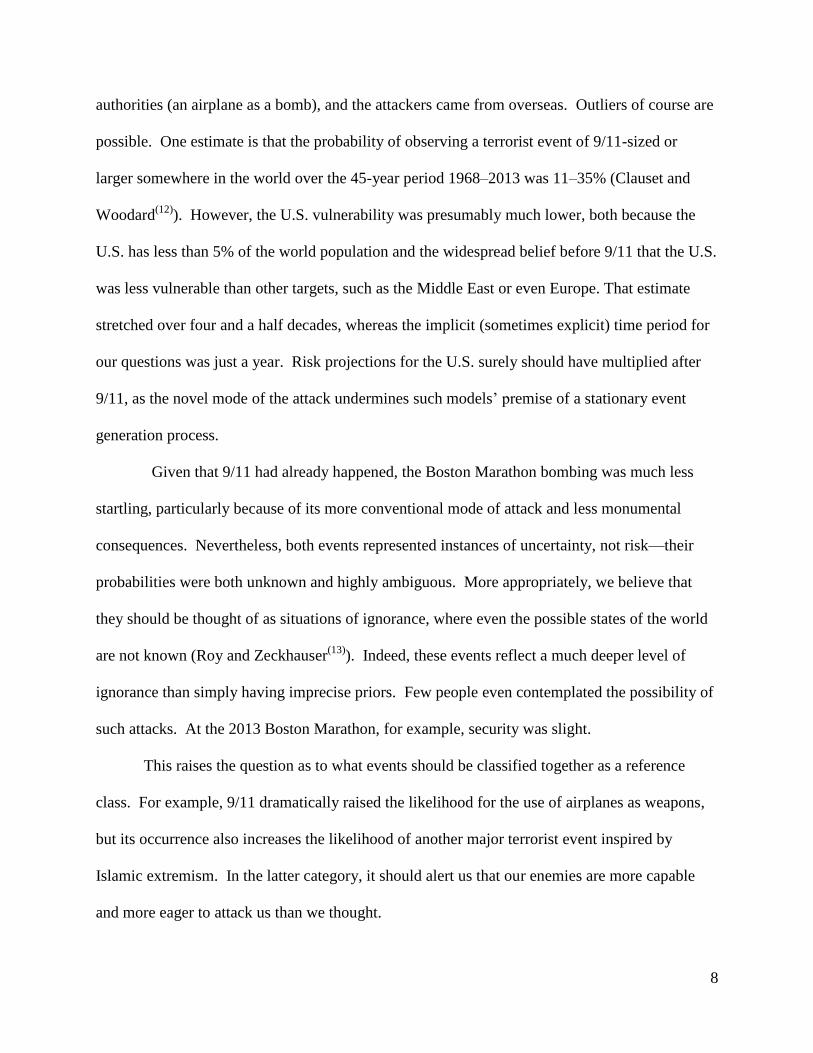
authorities (an airplane as a bomb), and the attackers came from overseas. Outliers of course are
possible. One estimate is that the probability of observing a terrorist event of 9/11-sized or
larger somewhere in the world over the 45-year period 1968–2013 was 11–35% (Clauset and
Woodard(12)
). However, the U.S. vulnerability was presumably much lower, both because the
U.S. has less than 5% of the world population and the widespread belief before 9/11 that the U.S.
was less vulnerable than other targets, such as the Middle East or even Europe. That estimate
stretched over four and a half decades, whereas the implicit (sometimes explicit) time period for
our questions was just a year. Risk projections for the U.S. surely should have multiplied after
9/11, as the novel mode of the attack undermines such models’ premise of a stationary event
generation process.
Given that 9/11 had already happened, the Boston Marathon bombing was much less
startling, particularly because of its more conventional mode of attack and less monumental
consequences. Nevertheless, both events represented instances of uncertainty, not risk—their
probabilities were both unknown and highly ambiguous. More appropriately, we believe that
they should be thought of as situations of ignorance, where even the possible states of the world
are not known (Roy and Zeckhauser(13)
). Indeed, these events reflect a much deeper level of
ignorance than simply having imprecise priors. Few people even contemplated the possibility of
such attacks. At the 2013 Boston Marathon, for example, security was slight.
This raises the question as to what events should be classified together as a reference
class. For example, 9/11 dramatically raised the likelihood for the use of airplanes as weapons,
but its occurrence also increases the likelihood of another major terrorist event inspired by
Islamic extremism. In the latter category, it should alert us that our enemies are more capable
and more eager to attack us than we thought.

9
The marathon bombing, and the 2015 San Bernadino massacre, are better characterized
as lone-wolf attacks. Leaving aside any copycat effects, it is tempting to conclude that since we
have seen a number of such events, one more should not be a surprise. However, even if we
think of such events as coming from a Poisson distribution, given that the numbers are small, one
more attack should notably increase our assessment of the mean of that distribution.
Furthermore, if we believe that the mean has a trend, e.g., terrorist events may be becoming more
common, the occurrence of an event would also require updating the estimate of the slope of the
trend.
Terrorist attacks can differ greatly in their motivation, locale, mode of attack, and the
organization involved, suggesting that they are much more differentiated than natural disasters,
such as floods or hurricanes. They fit less well into a single reference class. Thus, there should
be more updating when two young men educated in an American high school get radicalized and
use a crude bomb to kill three and injure 250+ others than when there is a major flood or
category 5 hurricane. Major lone-wolf, jihadi terrorist attacks have been revealed to be much
more of a threat.
2.4 The Better Protection Rationale
Before proceeding, we should mention one conceivable justification for why individuals’
assessments after a severe adverse event might dampen the updated probability, indeed possibly
make it lower than the prior probability: Protective measures could be taken. Thus, burglar
alarms are installed after one’s home is robbed. After 9/11, al Qaeda leaders and adherents are
killed, and airline security is considerably tightened.
No 9/11-type incident has occurred over many intervening years. Does that imply that
protection is now better? Unfortunately, a very low probability updates massively and quickly

10
when it occurs, but slowly when it does not (Pratt and Zeckhauser(14)
). Suppose that after the
9/11 attack, the person’s beliefs for subsequent annual attack risk were characterized by a beta
distribution where b=10 and c=90. Thus, the person believes that the annual risk of attack is
b/(b+c)=0.10. After 15 years with no incident, the value of the denominator rises to 115 while
the numerator remains the same, and the assessed probability falls to 10/(115)=0.087. That
represents substantial updating, but hardly to the extent of what should have happened in the
opposite direction from pre-9/11 to immediate post-9/11.
We do not believe that increased protective measures, plus the deterrence to perpetrators
they promoted, or other recent developments have been nearly sufficient to swamp the sizeable
updating in probability that should have accompanied the 9/11 or Boston Marathon attacks.
2.5 Weak Updating
Posit that individuals’ recall their assessed probability of a salient low-probability event
before it happened as being too large relative to their current assessment of the risk, as judged
from the standpoint of rational decision theory. Such a bias could arise from weak updating,
meaning that they updated too little from their prior to their posterior probability. This might
happen, for example, because: they anchored (Tversky and Kahneman(15)
) too heavily on their
initial probability, the likelihood ratio they employed for updating was too low, or because they
did not employ the tools of decision theory, even informally, to update their probability.
2.6 Retrospective Adjustment of Prior Probabilities
The retrospective adjustment of prior probabilities (RAPP) phenomenon arises because
present beliefs affect what we recall ourselves believing in the past, a form of backward
anchoring. At a deep level, we believe that the RAPP phenomenon is related to cognitive
dissonance: “It is hard for me to believe now that such a consequential phenomenon that I now
11
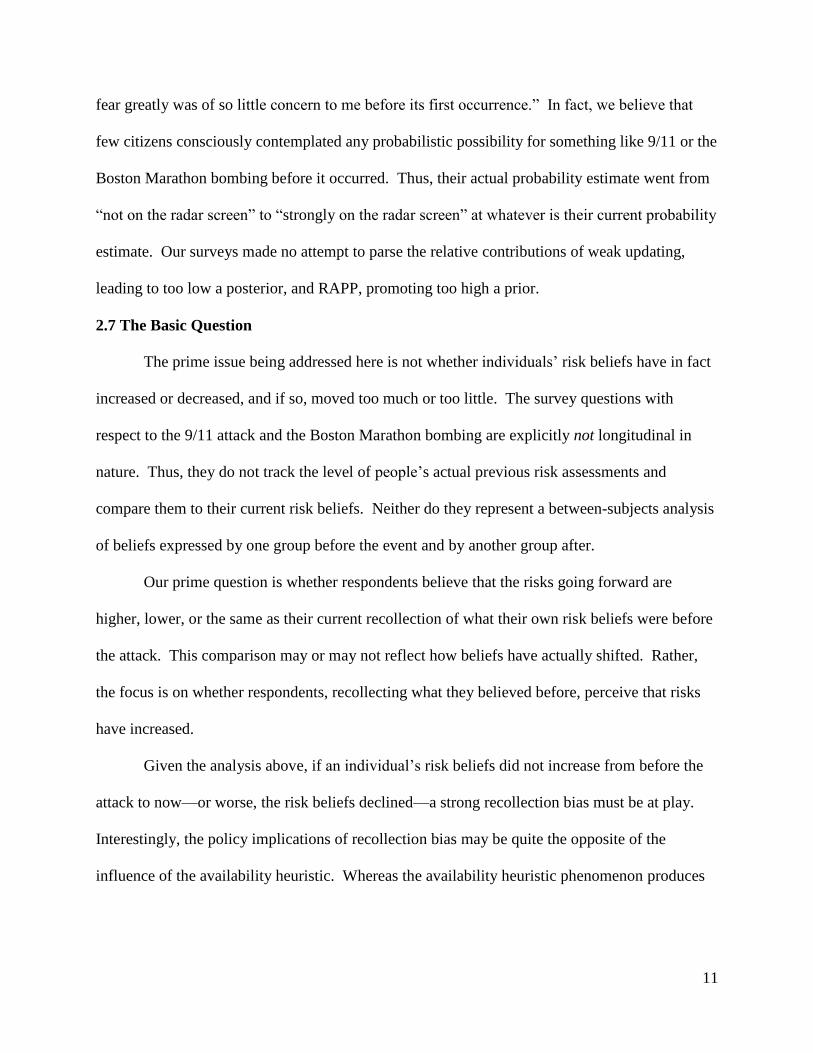
fear greatly was of so little concern to me before its first occurrence.” In fact, we believe that
few citizens consciously contemplated any probabilistic possibility for something like 9/11 or the
Boston Marathon bombing before it occurred. Thus, their actual probability estimate went from
“not on the radar screen” to “strongly on the radar screen” at whatever is their current probability
estimate. Our surveys made no attempt to parse the relative contributions of weak updating,
leading to too low a posterior, and RAPP, promoting too high a prior.
2.7 The Basic Question
The prime issue being addressed here is not whether individuals’ risk beliefs have in fact
increased or decreased, and if so, moved too much or too little. The survey questions with
respect to the 9/11 attack and the Boston Marathon bombing are explicitly not longitudinal in
nature. Thus, they do not track the level of people’s actual previous risk assessments and
compare them to their current risk beliefs. Neither do they represent a between-subjects analysis
of beliefs expressed by one group before the event and by another group after.
Our prime question is whether respondents believe that the risks going forward are
higher, lower, or the same as their current recollection of what their own risk beliefs were before
the attack. This comparison may or may not reflect how beliefs have actually shifted. Rather,
the focus is on whether respondents, recollecting what they believed before, perceive that risks
have increased.
Given the analysis above, if an individual’s risk beliefs did not increase from before the
attack to now—or worse, the risk beliefs declined—a strong recollection bias must be at play.
Interestingly, the policy implications of recollection bias may be quite the opposite of the
influence of the availability heuristic. Whereas the availability heuristic phenomenon produces

12
exaggerated responses to risk (Sunstein(16)
), recollection bias may dampen people’s response to a
significant increase in risk.
A world of biases is a world of the second best. Once you suffer one bias, say availability
bias, you might be better not worse off from suffering another, i.e. recollection bias, if the two to
some extent counterbalance.
2.8 Updating by Experts Versus Updating by the Public5
Experts may update much more effectively than the public for two reasons: First, experts
have much more data to employ in formulating judgments. They are better equipped to know the
frequency or infrequency of similar or relevant events in the past and to determine whether
underlying forces have changed the likelihood of events. Trends in terrorist events could emerge
from the rise and fall of overseas groups; trends in weather-related catastrophes could result from
climate change. Second, experts are familiar with Bayesian methods. Thus, they intuitively
understand concepts such as likelihood ratios and the updating of priors to posteriors based on
the information seen. A major finding of the behavioral decision movement is that even when
dealing with mechanical processes, such as drawing marbles from an urn, members of the
general public have little intuitive grasp of Bayesian methods. Most relevant to this analysis, as
pointed out above, they anchor on their original probability estimates too strongly: they update
too little on the basis of new information.
When bolts-from-the-blue arrive, how should updating ideally be done? To answer that
question is beyond the scope of this analysis, but we will make four observations to aid future
investigations. First, even experts may not be skilled in such processes. Therefore, any
investigation should have a strong empirical component to see what likelihood ratios were
5 We are indebted to area editor, Warner North, and a referee for encouraging us to include much more information
on how updating should be conducted.
13
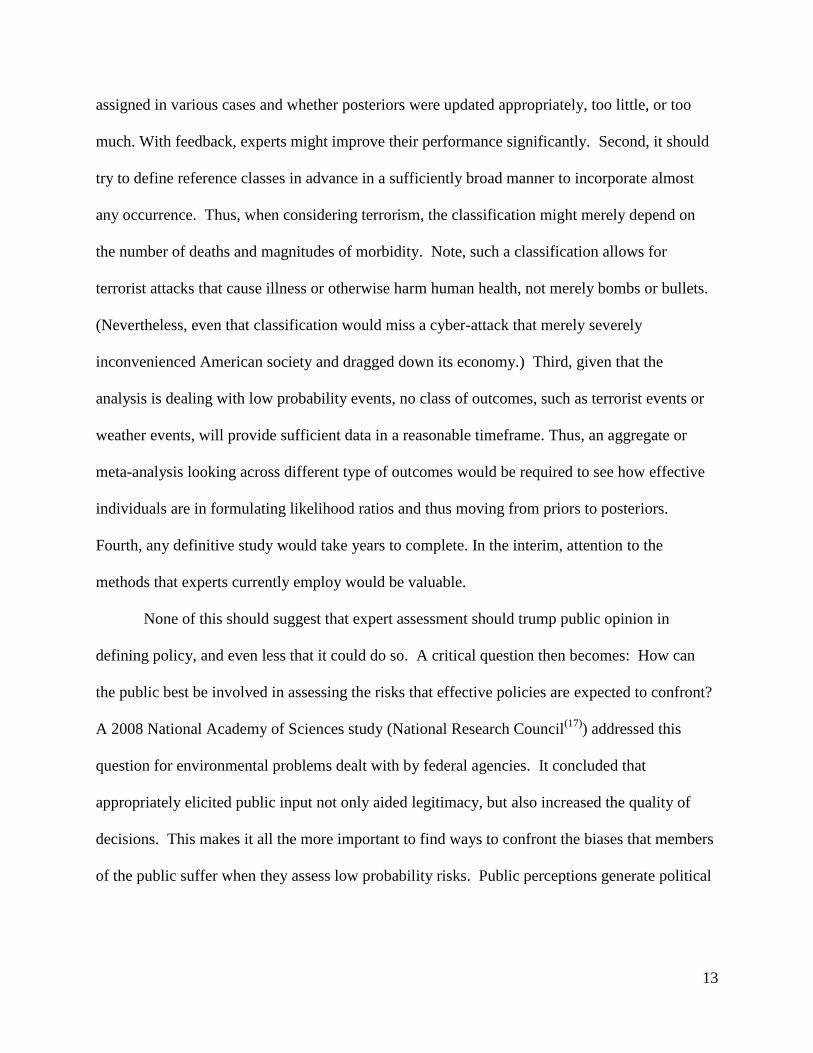
assigned in various cases and whether posteriors were updated appropriately, too little, or too
much. With feedback, experts might improve their performance significantly. Second, it should
try to define reference classes in advance in a sufficiently broad manner to incorporate almost
any occurrence. Thus, when considering terrorism, the classification might merely depend on
the number of deaths and magnitudes of morbidity. Note, such a classification allows for
terrorist attacks that cause illness or otherwise harm human health, not merely bombs or bullets.
(Nevertheless, even that classification would miss a cyber-attack that merely severely
inconvenienced American society and dragged down its economy.) Third, given that the
analysis is dealing with low probability events, no class of outcomes, such as terrorist events or
weather events, will provide sufficient data in a reasonable timeframe. Thus, an aggregate or
meta-analysis looking across different type of outcomes would be required to see how effective
individuals are in formulating likelihood ratios and thus moving from priors to posteriors.
Fourth, any definitive study would take years to complete. In the interim, attention to the
methods that experts currently employ would be valuable.
None of this should suggest that expert assessment should trump public opinion in
defining policy, and even less that it could do so. A critical question then becomes: How can
the public best be involved in assessing the risks that effective policies are expected to confront?
A 2008 National Academy of Sciences study (National Research Council(17)
) addressed this
question for environmental problems dealt with by federal agencies. It concluded that
appropriately elicited public input not only aided legitimacy, but also increased the quality of
decisions. This makes it all the more important to find ways to confront the biases that members
of the public suffer when they assess low probability risks. Public perceptions generate political
14
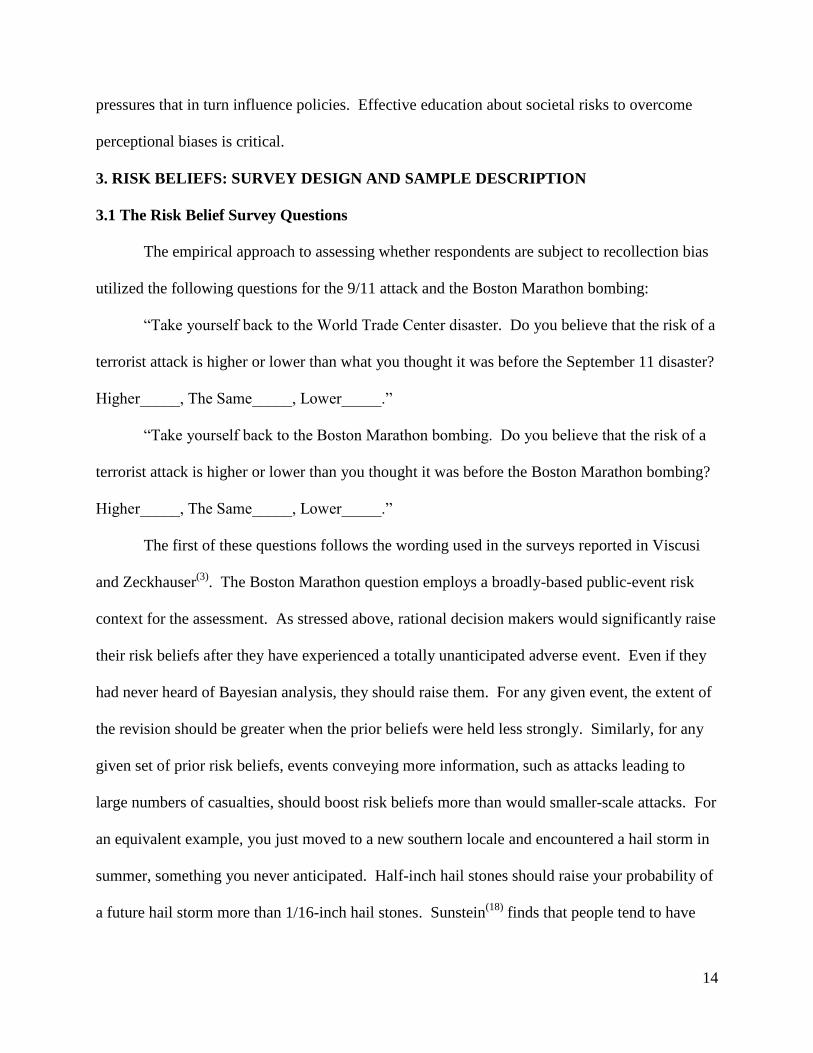
pressures that in turn influence policies. Effective education about societal risks to overcome
perceptional biases is critical.
3. RISK BELIEFS: SURVEY DESIGN AND SAMPLE DESCRIPTION
3.1 The Risk Belief Survey Questions
The empirical approach to assessing whether respondents are subject to recollection bias
utilized the following questions for the 9/11 attack and the Boston Marathon bombing:
“Take yourself back to the World Trade Center disaster. Do you believe that the risk of a
terrorist attack is higher or lower than what you thought it was before the September 11 disaster?
Higher_____, The Same_____, Lower_____.”
“Take yourself back to the Boston Marathon bombing. Do you believe that the risk of a
terrorist attack is higher or lower than you thought it was before the Boston Marathon bombing?
Higher_____, The Same_____, Lower_____.”
The first of these questions follows the wording used in the surveys reported in Viscusi
and Zeckhauser(3)
. The Boston Marathon question employs a broadly-based public-event risk
context for the assessment. As stressed above, rational decision makers would significantly raise
their risk beliefs after they have experienced a totally unanticipated adverse event. Even if they
had never heard of Bayesian analysis, they should raise them. For any given event, the extent of
the revision should be greater when the prior beliefs were held less strongly. Similarly, for any
given set of prior risk beliefs, events conveying more information, such as attacks leading to
large numbers of casualties, should boost risk beliefs more than would smaller-scale attacks. For
an equivalent example, you just moved to a new southern locale and encountered a hail storm in
summer, something you never anticipated. Half-inch hail stones should raise your probability of
a future hail storm more than 1/16-inch hail stones. Sunstein(18)
finds that people tend to have

15
“excessive reactions” to terrorist events because they respond more to the “badness of events”
than to their probabilities. We are only seeking “appropriate responses” to the badness of events.
Our hypotheses, however, posit inappropriate responses. To reiterate, Hypothesis 1 is
that people will tend to exhibit recollection bias for each of these two events. Hypothesis 2 is
that this tendency will persist across these two classes of terrorism risks.
Beyond examining the presence of recollection bias, it is also instructive to ascertain the
level of respondents’ risk beliefs. Hypothesis 3 posits that these risk beliefs will be lower in the
presence of recollection bias.
To explore the range of uncertainty reflected in respondents’ beliefs, we conducted a
survey to elicit the overall level and the distribution of the respondents’ current risk beliefs. In
particular, the survey asked people for the 5th
percentile, the 95th
percentile, and their best
estimate of the number of American terrorism deaths due to attacks on airplanes over the next 12
months. The survey question read as follows:
“Based on some estimates, the September 11, 2001, disaster led to 266 deaths in the
planes and 2,717 deaths at the World Trade Center. The total number of deaths was
consequently 2,983, or about 3,000. Below is a series of questions about the number of people
who you believe will be killed in the next 12 months because of attacks by foreign terrorists on
airplanes:
(a) Think of the best-case outcome in which the number of terrorism deaths could be low.
Suppose there is only one chance in 20 that the number of terrorism deaths could be
at this low level or below. What is your estimate of this low-end death toll? _____
16
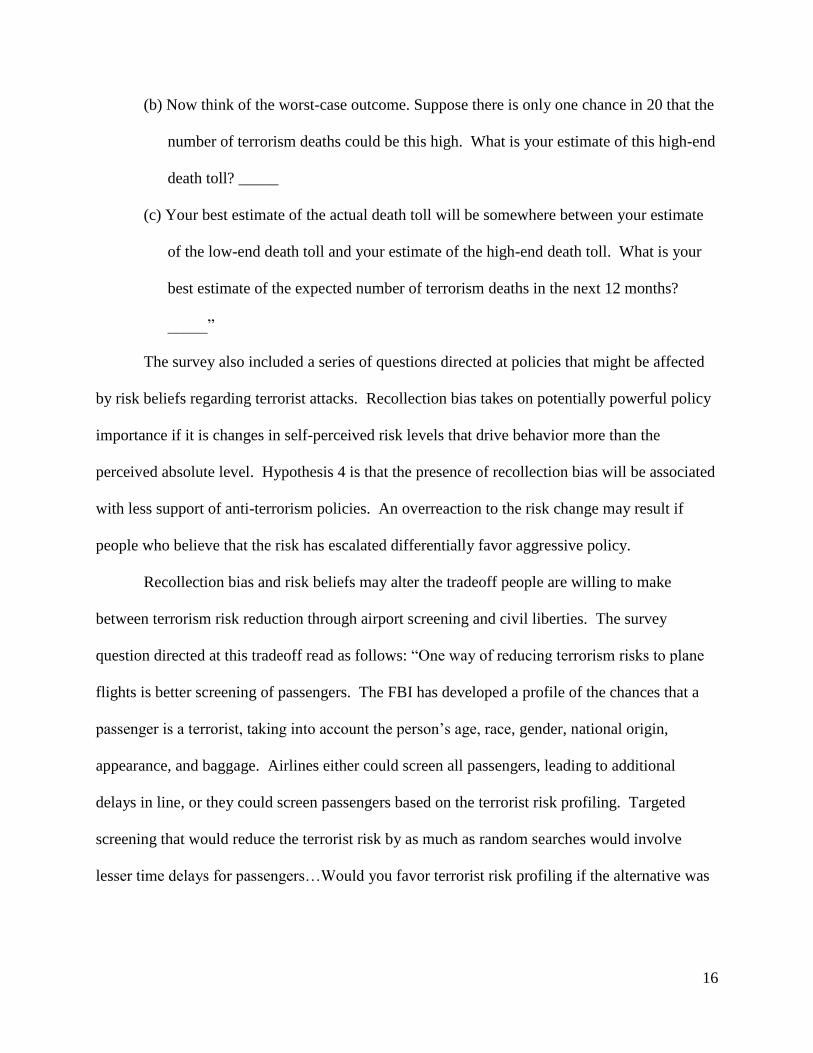
(b) Now think of the worst-case outcome. Suppose there is only one chance in 20 that the
number of terrorism deaths could be this high. What is your estimate of this high-end
death toll? _____
(c) Your best estimate of the actual death toll will be somewhere between your estimate
of the low-end death toll and your estimate of the high-end death toll. What is your
best estimate of the expected number of terrorism deaths in the next 12 months?
_____”
The survey also included a series of questions directed at policies that might be affected
by risk beliefs regarding terrorist attacks. Recollection bias takes on potentially powerful policy
importance if it is changes in self-perceived risk levels that drive behavior more than the
perceived absolute level. Hypothesis 4 is that the presence of recollection bias will be associated
with less support of anti-terrorism policies. An overreaction to the risk change may result if
people who believe that the risk has escalated differentially favor aggressive policy.
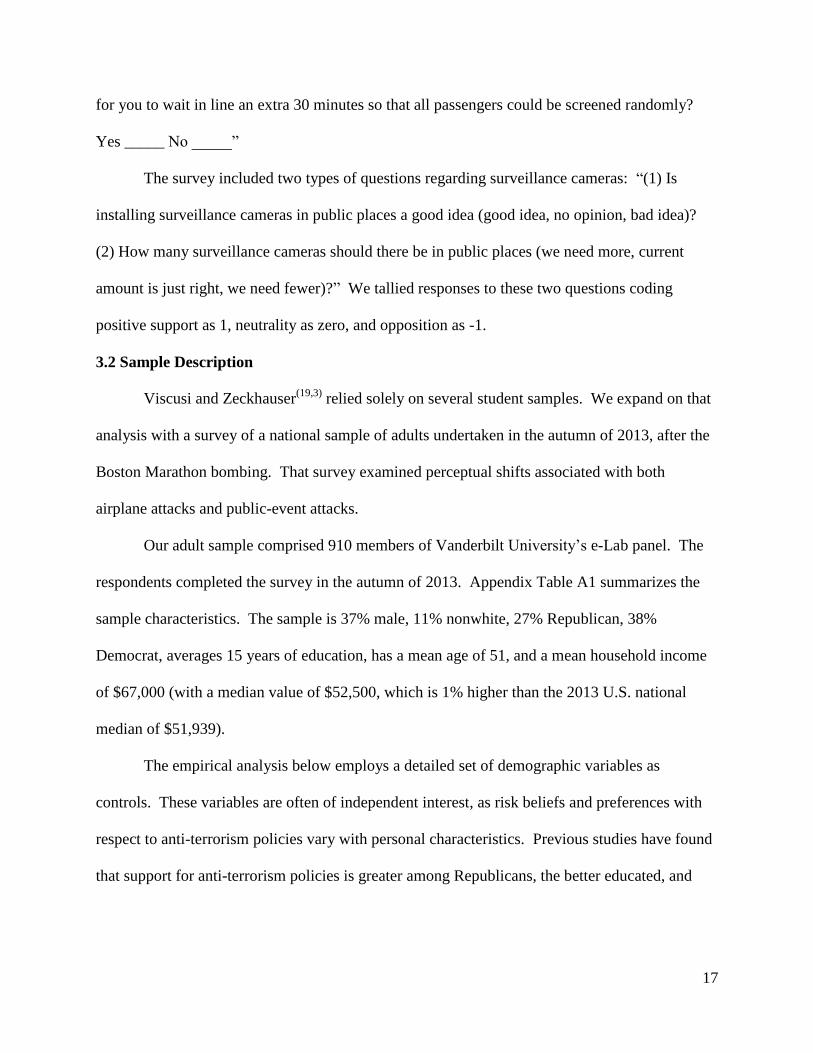
Recollection bias and risk beliefs may alter the tradeoff people are willing to make
between terrorism risk reduction through airport screening and civil liberties. The survey
question directed at this tradeoff read as follows: “One way of reducing terrorism risks to plane
flights is better screening of passengers. The FBI has developed a profile of the chances that a
passenger is a terrorist, taking into account the person’s age, race, gender, national origin,
appearance, and baggage. Airlines either could screen all passengers, leading to additional
delays in line, or they could screen passengers based on the terrorist risk profiling. Targeted
screening that would reduce the terrorist risk by as much as random searches would involve
lesser time delays for passengers…Would you favor terrorist risk profiling if the alternative was
17
for you to wait in line an extra 30 minutes so that all passengers could be screened randomly?
Yes _____ No _____”
The survey included two types of questions regarding surveillance cameras: “(1) Is
installing surveillance cameras in public places a good idea (good idea, no opinion, bad idea)?
(2) How many surveillance cameras should there be in public places (we need more, current
amount is just right, we need fewer)?” We tallied responses to these two questions coding
positive support as 1, neutrality as zero, and opposition as -1.
3.2 Sample Description
Viscusi and Zeckhauser(19,3)
relied solely on several student samples. We expand on that
analysis with a survey of a national sample of adults undertaken in the autumn of 2013, after the
Boston Marathon bombing. That survey examined perceptual shifts associated with both
airplane attacks and public-event attacks.
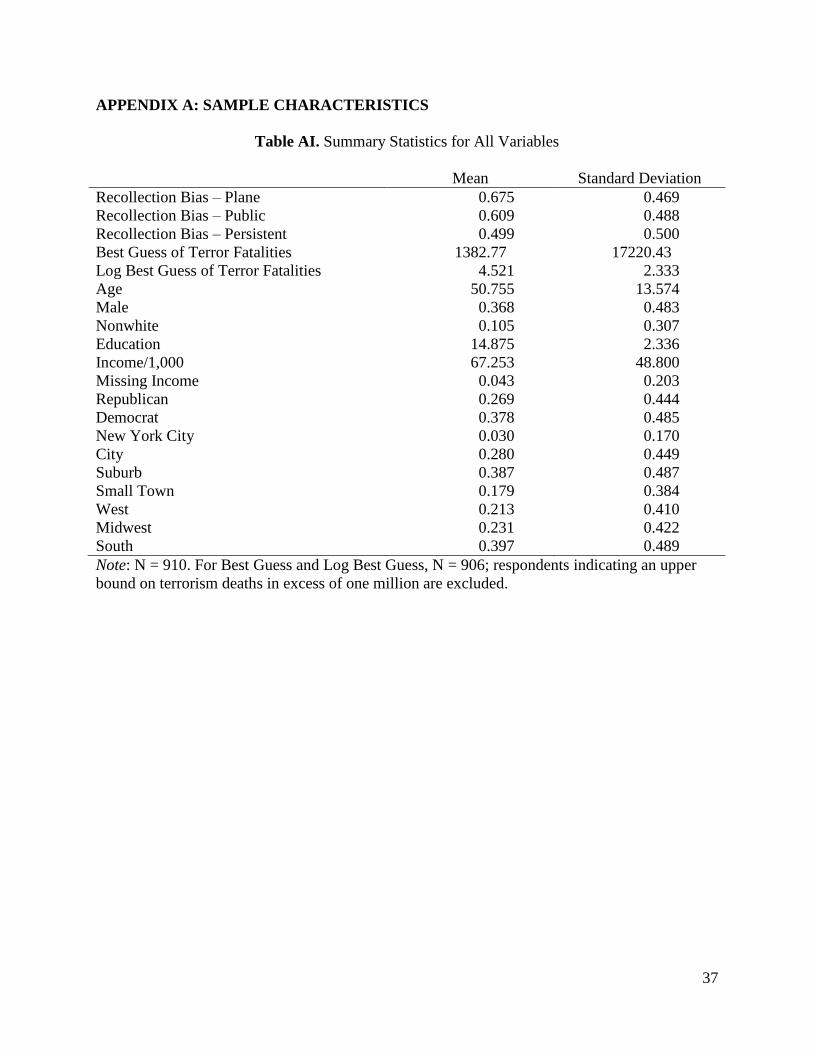
Our adult sample comprised 910 members of Vanderbilt University’s e-Lab panel. The
respondents completed the survey in the autumn of 2013. Appendix Table A1 summarizes the
sample characteristics. The sample is 37% male, 11% nonwhite, 27% Republican, 38%
Democrat, averages 15 years of education, has a mean age of 51, and a mean household income
of $67,000 (with a median value of $52,500, which is 1% higher than the 2013 U.S. national
median of $51,939).
The empirical analysis below employs a detailed set of demographic variables as
controls. These variables are often of independent interest, as risk beliefs and preferences with
respect to anti-terrorism policies vary with personal characteristics. Previous studies have found
that support for anti-terrorism policies is greater among Republicans, the better educated, and
18
those with higher risk beliefs, as found in Viscusi(20)
. Thus this analysis explores the effect of
demographic characteristics on recollection bias, risk beliefs, and policy preferences.
4. DATA ANALYSIS
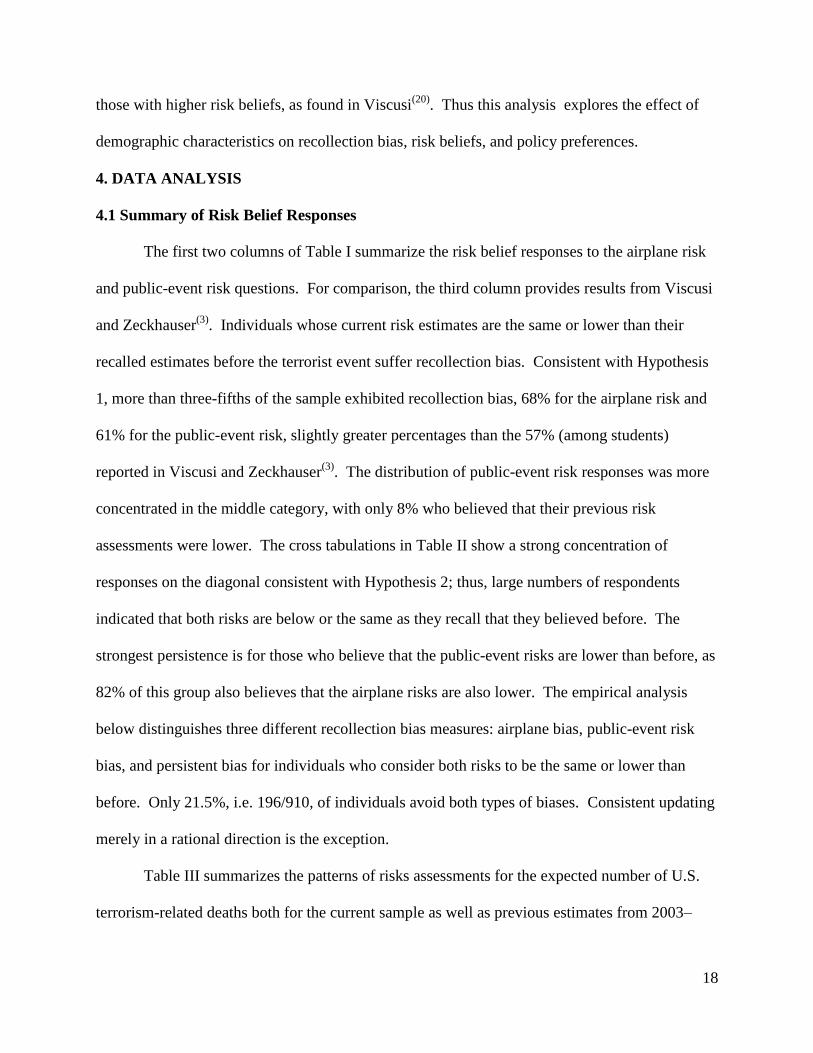
4.1 Summary of Risk Belief Responses
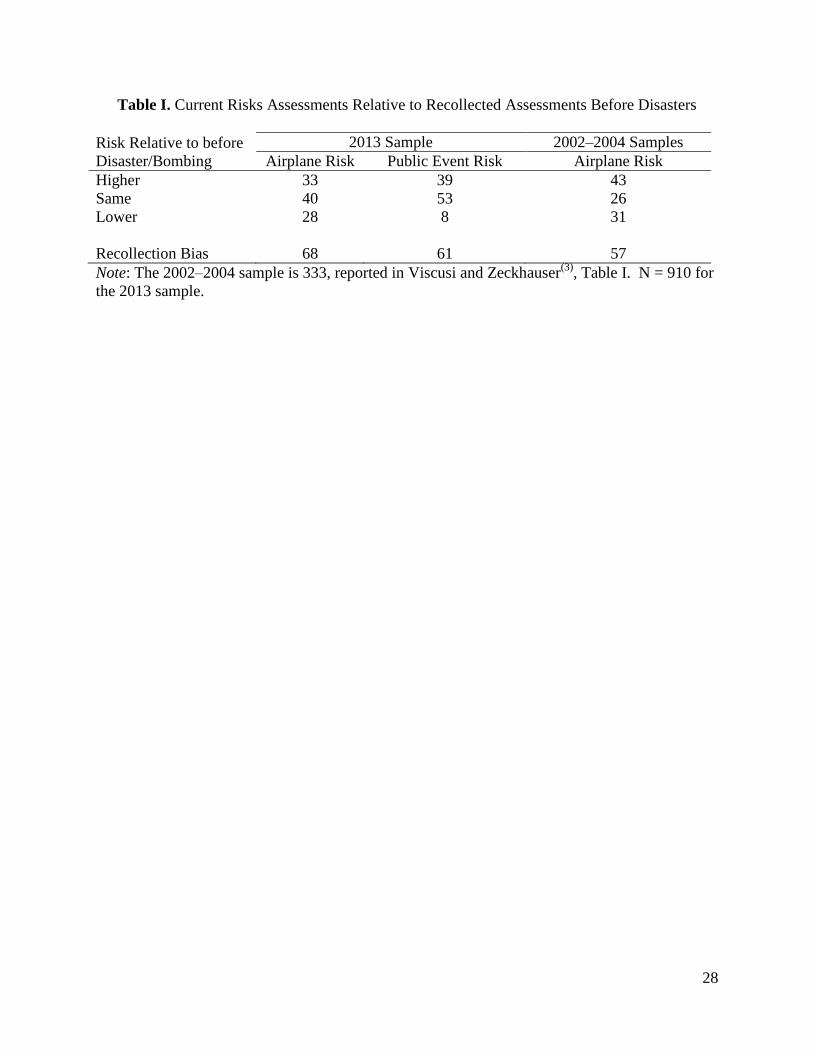
The first two columns of Table I summarize the risk belief responses to the airplane risk
and public-event risk questions. For comparison, the third column provides results from Viscusi
and Zeckhauser(3)
. Individuals whose current risk estimates are the same or lower than their
recalled estimates before the terrorist event suffer recollection bias. Consistent with Hypothesis
1, more than three-fifths of the sample exhibited recollection bias, 68% for the airplane risk and
61% for the public-event risk, slightly greater percentages than the 57% (among students)
reported in Viscusi and Zeckhauser(3)
. The distribution of public-event risk responses was more
concentrated in the middle category, with only 8% who believed that their previous risk
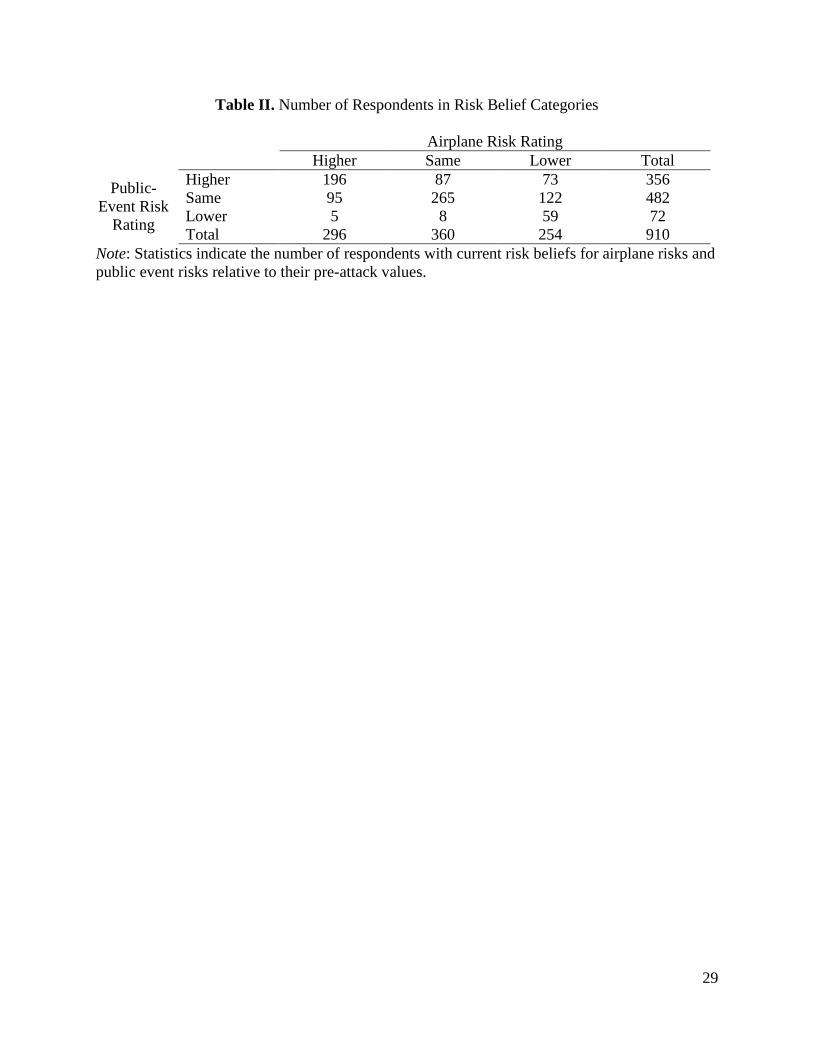
assessments were lower. The cross tabulations in Table II show a strong concentration of
responses on the diagonal consistent with Hypothesis 2; thus, large numbers of respondents
indicated that both risks are below or the same as they recall that they believed before. The
strongest persistence is for those who believe that the public-event risks are lower than before, as
82% of this group also believes that the airplane risks are also lower. The empirical analysis
below distinguishes three different recollection bias measures: airplane bias, public-event risk
bias, and persistent bias for individuals who consider both risks to be the same or lower than
before. Only 21.5%, i.e. 196/910, of individuals avoid both types of biases. Consistent updating
merely in a rational direction is the exception.
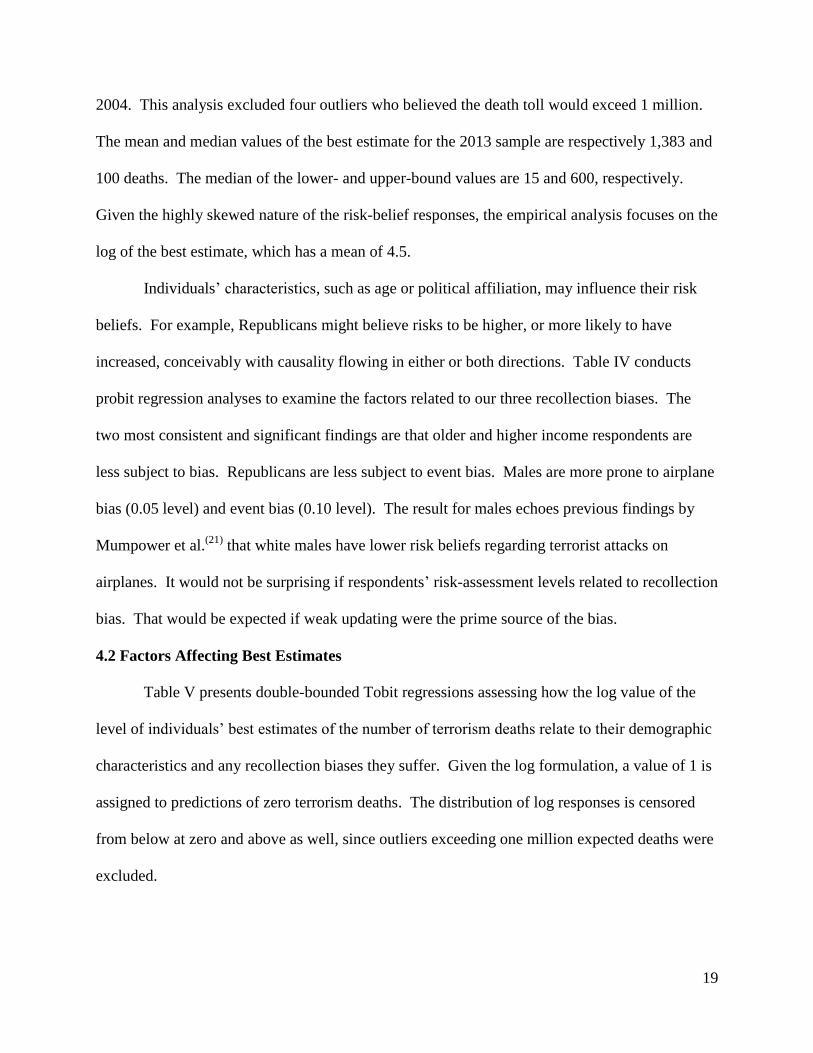
Table III summarizes the patterns of risks assessments for the expected number of U.S.
terrorism-related deaths both for the current sample as well as previous estimates from 2003–
19
2004. This analysis excluded four outliers who believed the death toll would exceed 1 million.
The mean and median values of the best estimate for the 2013 sample are respectively 1,383 and
100 deaths. The median of the lower- and upper-bound values are 15 and 600, respectively.
Given the highly skewed nature of the risk-belief responses, the empirical analysis focuses on the
log of the best estimate, which has a mean of 4.5.
Individuals’ characteristics, such as age or political affiliation, may influence their risk
beliefs. For example, Republicans might believe risks to be higher, or more likely to have
increased, conceivably with causality flowing in either or both directions. Table IV conducts
probit regression analyses to examine the factors related to our three recollection biases. The
two most consistent and significant findings are that older and higher income respondents are
less subject to bias. Republicans are less subject to event bias. Males are more prone to airplane
bias (0.05 level) and event bias (0.10 level). The result for males echoes previous findings by
Mumpower et al.(21)
that white males have lower risk beliefs regarding terrorist attacks on
airplanes. It would not be surprising if respondents’ risk-assessment levels related to recollection
bias. That would be expected if weak updating were the prime source of the bias.
4.2 Factors Affecting Best Estimates
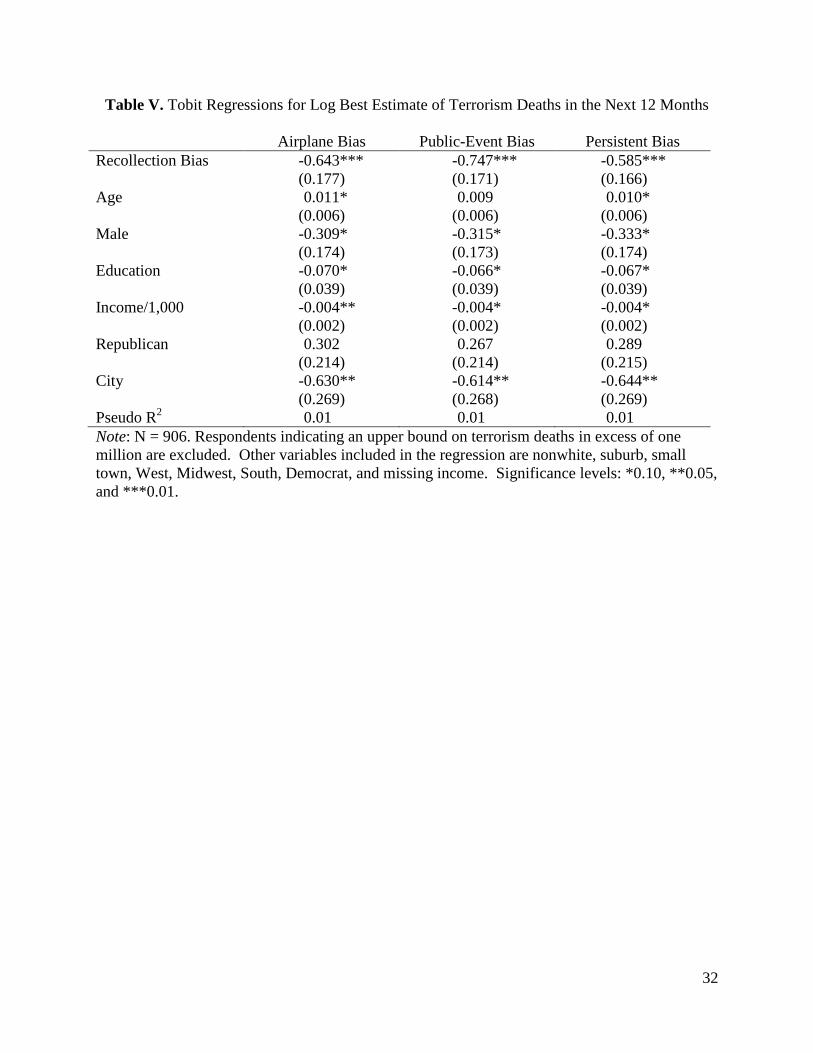
Table V presents double-bounded Tobit regressions assessing how the log value of the
level of individuals’ best estimates of the number of terrorism deaths relate to their demographic
characteristics and any recollection biases they suffer. Given the log formulation, a value of 1 is
assigned to predictions of zero terrorism deaths. The distribution of log responses is censored
from below at zero and above as well, since outliers exceeding one million expected deaths were
excluded.
20
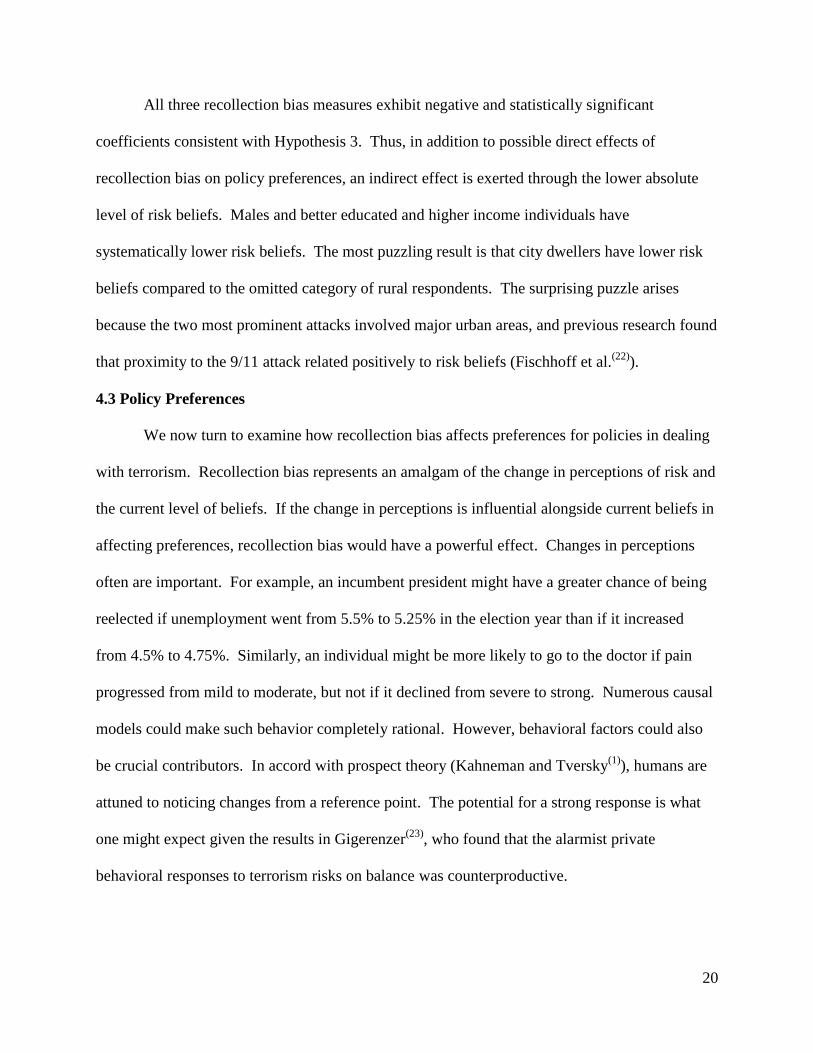
All three recollection bias measures exhibit negative and statistically significant
coefficients consistent with Hypothesis 3. Thus, in addition to possible direct effects of
recollection bias on policy preferences, an indirect effect is exerted through the lower absolute
level of risk beliefs. Males and better educated and higher income individuals have
systematically lower risk beliefs. The most puzzling result is that city dwellers have lower risk
beliefs compared to the omitted category of rural respondents. The surprising puzzle arises
because the two most prominent attacks involved major urban areas, and previous research found
that proximity to the 9/11 attack related positively to risk beliefs (Fischhoff et al.(22)
).
4.3 Policy Preferences
We now turn to examine how recollection bias affects preferences for policies in dealing
with terrorism. Recollection bias represents an amalgam of the change in perceptions of risk and
the current level of beliefs. If the change in perceptions is influential alongside current beliefs in
affecting preferences, recollection bias would have a powerful effect. Changes in perceptions
often are important. For example, an incumbent president might have a greater chance of being
reelected if unemployment went from 5.5% to 5.25% in the election year than if it increased
from 4.5% to 4.75%. Similarly, an individual might be more likely to go to the doctor if pain
progressed from mild to moderate, but not if it declined from severe to strong. Numerous causal
models could make such behavior completely rational. However, behavioral factors could also
be crucial contributors. In accord with prospect theory (Kahneman and Tversky(1)
), humans are
attuned to noticing changes from a reference point. The potential for a strong response is what
one might expect given the results in Gigerenzer(23)
, who found that the alarmist private
behavioral responses to terrorism risks on balance was counterproductive.
21
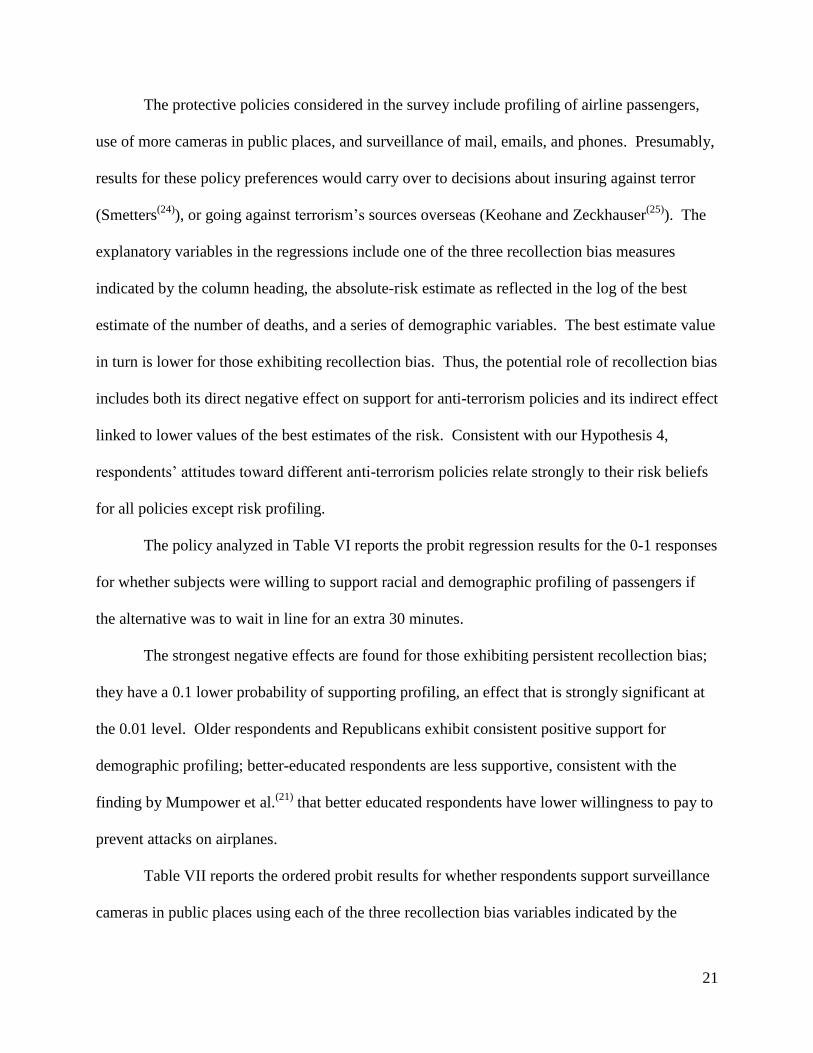
The protective policies considered in the survey include profiling of airline passengers,
use of more cameras in public places, and surveillance of mail, emails, and phones. Presumably,
results for these policy preferences would carry over to decisions about insuring against terror
(Smetters(24)
), or going against terrorism’s sources overseas (Keohane and Zeckhauser(25)
). The
explanatory variables in the regressions include one of the three recollection bias measures
indicated by the column heading, the absolute-risk estimate as reflected in the log of the best
estimate of the number of deaths, and a series of demographic variables. The best estimate value
in turn is lower for those exhibiting recollection bias. Thus, the potential role of recollection bias
includes both its direct negative effect on support for anti-terrorism policies and its indirect effect
linked to lower values of the best estimates of the risk. Consistent with our Hypothesis 4,
respondents’ attitudes toward different anti-terrorism policies relate strongly to their risk beliefs
for all policies except risk profiling.
The policy analyzed in Table VI reports the probit regression results for the 0-1 responses
for whether subjects were willing to support racial and demographic profiling of passengers if
the alternative was to wait in line for an extra 30 minutes.
The strongest negative effects are found for those exhibiting persistent recollection bias;
they have a 0.1 lower probability of supporting profiling, an effect that is strongly significant at
the 0.01 level. Older respondents and Republicans exhibit consistent positive support for
demographic profiling; better-educated respondents are less supportive, consistent with the
finding by Mumpower et al.(21)
that better educated respondents have lower willingness to pay to
prevent attacks on airplanes.
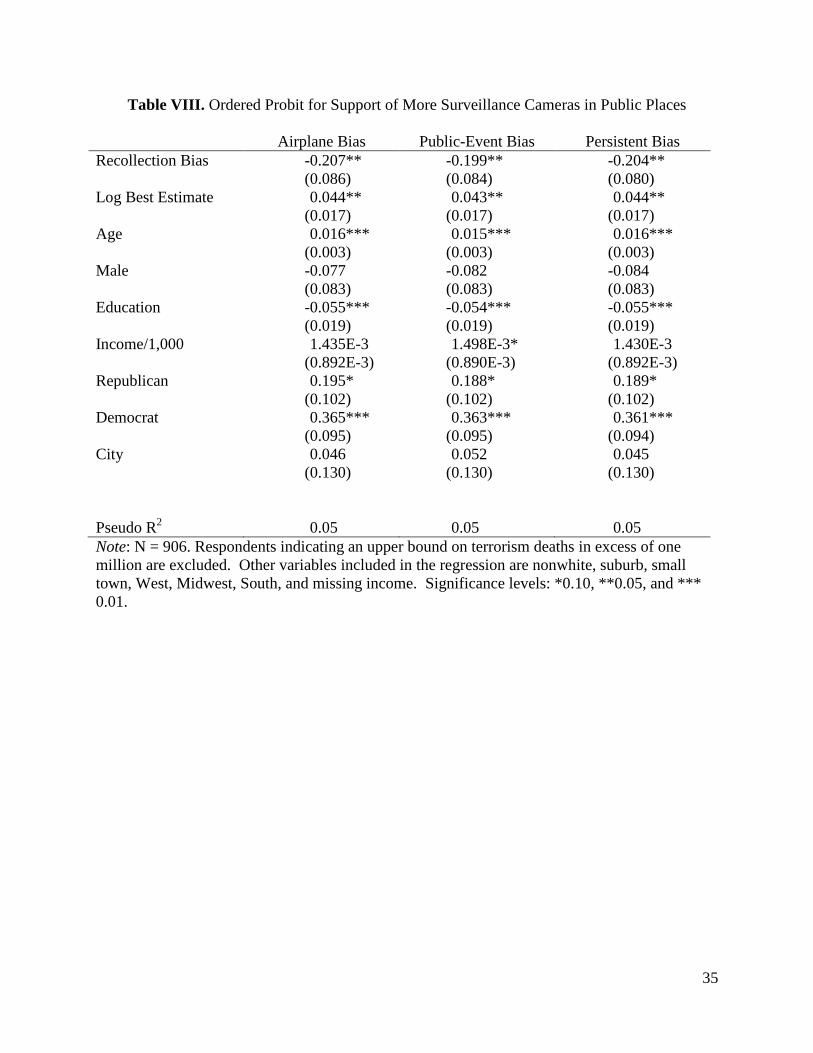
Table VII reports the ordered probit results for whether respondents support surveillance
cameras in public places using each of the three recollection bias variables indicated by the
22
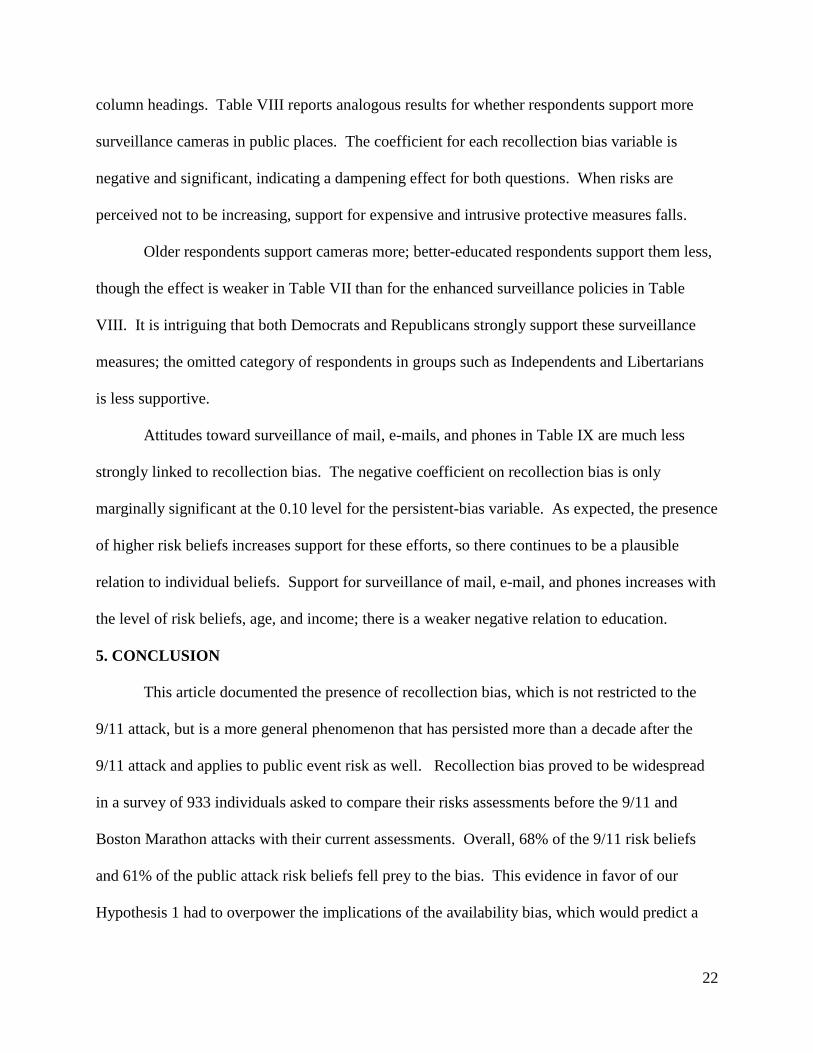
column headings. Table VIII reports analogous results for whether respondents support more
surveillance cameras in public places. The coefficient for each recollection bias variable is
negative and significant, indicating a dampening effect for both questions. When risks are
perceived not to be increasing, support for expensive and intrusive protective measures falls.
Older respondents support cameras more; better-educated respondents support them less,
though the effect is weaker in Table VII than for the enhanced surveillance policies in Table
VIII. It is intriguing that both Democrats and Republicans strongly support these surveillance
measures; the omitted category of respondents in groups such as Independents and Libertarians
is less supportive.
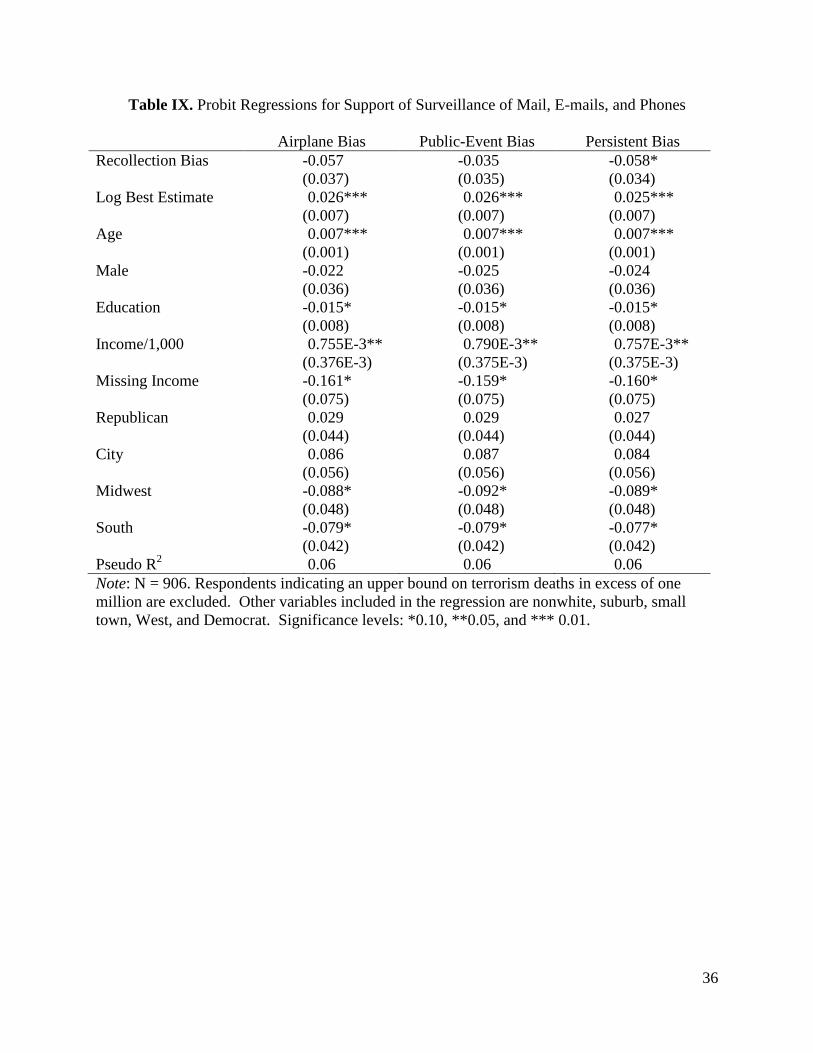
Attitudes toward surveillance of mail, e-mails, and phones in Table IX are much less
strongly linked to recollection bias. The negative coefficient on recollection bias is only
marginally significant at the 0.10 level for the persistent-bias variable. As expected, the presence
of higher risk beliefs increases support for these efforts, so there continues to be a plausible
relation to individual beliefs. Support for surveillance of mail, e-mail, and phones increases with
the level of risk beliefs, age, and income; there is a weaker negative relation to education.
5. CONCLUSION
This article documented the presence of recollection bias, which is not restricted to the
9/11 attack, but is a more general phenomenon that has persisted more than a decade after the
9/11 attack and applies to public event risk as well. Recollection bias proved to be widespread
in a survey of 933 individuals asked to compare their risks assessments before the 9/11 and
Boston Marathon attacks with their current assessments. Overall, 68% of the 9/11 risk beliefs
and 61% of the public attack risk beliefs fell prey to the bias. This evidence in favor of our
Hypothesis 1 had to overpower the implications of the availability bias, which would predict a
23
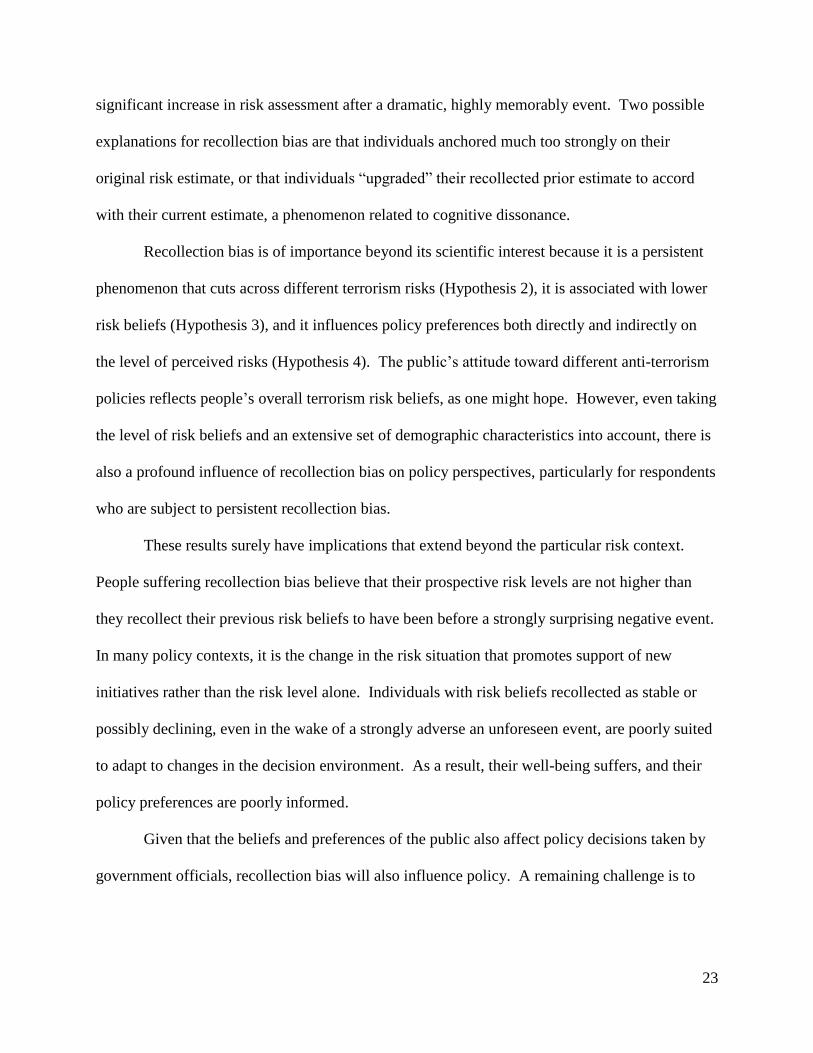
significant increase in risk assessment after a dramatic, highly memorably event. Two possible
explanations for recollection bias are that individuals anchored much too strongly on their
original risk estimate, or that individuals “upgraded” their recollected prior estimate to accord
with their current estimate, a phenomenon related to cognitive dissonance.
Recollection bias is of importance beyond its scientific interest because it is a persistent
phenomenon that cuts across different terrorism risks (Hypothesis 2), it is associated with lower
risk beliefs (Hypothesis 3), and it influences policy preferences both directly and indirectly on
the level of perceived risks (Hypothesis 4). The public’s attitude toward different anti-terrorism
policies reflects people’s overall terrorism risk beliefs, as one might hope. However, even taking
the level of risk beliefs and an extensive set of demographic characteristics into account, there is
also a profound influence of recollection bias on policy perspectives, particularly for respondents
who are subject to persistent recollection bias.
These results surely have implications that extend beyond the particular risk context.
People suffering recollection bias believe that their prospective risk levels are not higher than
they recollect their previous risk beliefs to have been before a strongly surprising negative event.
In many policy contexts, it is the change in the risk situation that promotes support of new
initiatives rather than the risk level alone. Individuals with risk beliefs recollected as stable or
possibly declining, even in the wake of a strongly adverse an unforeseen event, are poorly suited
to adapt to changes in the decision environment. As a result, their well-being suffers, and their
policy preferences are poorly informed.
Given that the beliefs and preferences of the public also affect policy decisions taken by
government officials, recollection bias will also influence policy. A remaining challenge is to

24
develop interventions that will succeed in overcoming these biases. Effective education of the
public about the assessment of risk could thus improve both its welfare and public policies.
25
REFERENCES
1. Kahneman D, Tversky A. Prospect theory: an analysis of decision under risk. Econometrica,
1979; 47(2):263–291.
2. National Safety Council (US). Injury facts. 2004 edition. Itasca: National Safety Council,
2004; 29.
3. Viscusi WK, Zeckhauser RJ. Recollection bias and the combat of terrorism. Journal of Legal
Studies, 2005; 34(1):27–55.
4. Fischhoff B. Recollection ≠ foresight: the effect of outcome knowledge on judgment under
uncertainty. Journal of Experimental Psychology: Human Perceptions and Performance, 1975;
1(3):288–299.
5. Rachlinski J. A positive psychological theory of judging in hindsight. University of Chicago
Law Review 1998; 65(2):571–625.
6. Hastie R, Schkade DA, Payne JW. Juror judgments in civil cases: hindsight effects on
judgments of liability for punitive damages. Law and Human Behavior, 1999; 23(5):597–614.
7. Viscusi WK. How do judges think about risk? American Law and Economics Review, 1999;
1(1):26–62.
8. Sunstein CR, Hastie R, Payne JW, Schkade DA, Viscusi WK. Punitive damages: how juries
decide. Chicago: University of Chicago Press; 2002.
9. Kelman M, Fallas DE, Folger H. Decomposing hindsight bias. Journal of Risk and
Uncertainty, 1998; 16(3):251–269.
10. Knight F. Risk, Uncertainty and Profit. Boston: Houghton-Mifflin; 1921.
11. Ellsberg D. Risk, ambiguity, and the savage axioms. Quarterly Journal of Economics, 1961;
75(4):643–669.
26
12. Clauset, A, Woodard R. Estimating the historical and future probabilities of large terrorist
events. The Annals of Applied Statistics, 2013; 7(4):1838–1865.
13. Roy D, Zeckhauser RJ. Grappling with ignorance: frameworks from decision theory, lessons
from literature. Journal of Benefit-Cost Analysis, 2015; 6(1)33–65.
14. Pratt JW, Zeckhauser RJ. Inferences from alarming events. Journal of Policy Analysis and
Management, 1982; 1(3)371–385.
15. Tversky A, Kahneman D. Judgment under uncertainty: heuristics and biases. Science, 1974;
185(4157):1124–1131.
16. Sunstein CR. Valuing life: humanizing the regulatory state. Chicago: University of Chicago
Press; 2014.
17. National Research Council. Public participation in environmental assessment and decision
making. Thomas Dietz and Paul C. Stern, eds. Committee on the Human Dimensions of
Global Change. Division of Behavioral and Social Sciences and Education. Washington, DC:
The National Academies Press; 2008.
18. Sunstein CR. Terrorism and probability neglect. Journal of Risk and Uncertainty, 2003;
26(2):121–136.
19. Viscusi WK, Zeckhauser RJ. Sacrificing civil liberties to reduce terrorism risks. Journal of
Risk and Uncertainty, 2003; 26(2):99–120.
20. Viscusi, WK. Valuing risks of death from terrorism and natural disasters. Journal of Risk and
Uncertainty, 2009; 38(3):191–213.
21. Mumpower JL, Shi L, Stoutenborough JW, Vedlitz A. Psychometric and demographic
predictors of the perceived risk of terrorist threats and the willingness to pay for terrorism risk
management programs. Risk Analysis, 2013; 33(10):1802–1811.
27
22. Fischhoff B, Gonzalez RM, Small DA, Lerner JS. Judged terror risk and proximity to the
World Trade Center. Journal of Risk and Uncertainty, 2003; 26(2/3):137–151.
23. Gigerenzer G. Out of the frying pan into the fire: behavioral reactions to terrorist attacks.
Risk Analysis, 2006; 26(2):347–351.
24. Smetters K. Insuring against terrorism: the policy challenge. Brookings-Wharton Papers on
Financial Services. 2004.
25. Keohane ND, Zeckhauser RJ. The ecology of terror defense. Journal of Risk and
Uncertainty, 2003; 26(2/3):201–229.
28
Table I. Current Risks Assessments Relative to Recollected Assessments Before Disasters
Risk Relative to before
Disaster/Bombing
2013 Sample 2002–2004 Samples
Airplane Risk Public Event Risk Airplane Risk
Higher 33 39 43
Same 40 53 26
Lower 28 8 31
Recollection Bias 68 61 57
Note: The 2002–2004 sample is 333, reported in Viscusi and Zeckhauser(3)
, Table I. N = 910 for
the 2013 sample.
29
Table II. Number of Respondents in Risk Belief Categories
Public-
Event Risk
Rating
Airplane Risk Rating
Higher Same Lower Total
Higher 196 87 73 356
Same 95 265 122 482
Lower 5 8 59 72
Total 296 360 254 910
Note: Statistics indicate the number of respondents with current risk beliefs for airplane risks and
public event risks relative to their pre-attack values.

30
Table III. Terrorism Risk Estimates of Fatalities for the Next 12 Months
2013 Sample Median Mean
Std. Error of
Mean
Lower Bound (5th
percentile) 15 203.15 56.79
Best Estimate (50th
percentile) 100 1382.77 572.11
Upper Bound (95th
percentile) 600 8977.04 2,252.80
2003–2004 Sample
Lower Bound (5th
percentile) 1.5 95.95 33.71
Best Estimate (50th
percentile) 100 451.59 99.98
Upper Bound (95th
percentile) 2000 23,768.35 12,658.61
Note: The 2003–2004 sample estimates are from Viscusi and Zeckhauser(3)
, Table II. Reported
statistics for both surveys omit estimates of over one million deaths, leading to 8 observations
being dropped for the 2003–2004 sample and 4 observations being dropped for the 2013 sample.

31
Table IV. Probit Regressions for Different Forms of Recollection Bias
Variable Airplane Bias Public-Event Bias Persistent Bias
Age -0.003**
(0.001)
-0.005***
(0.001)
-0.004***
(0.001)
Male 0.084**
(0.032)
0.064*
(0.034)
0.047
(0.036)
Education -0.005
(0.007)
1.8E-4
(78.9E-4)
-0.002
(0.008)
Income/1,000 -0.795E-3**
(0.345E-3)
-0.642E-3*
(0.366E-3)
-0.911E-3**
(0.381E-3)
Republican -0.063
(0.042)
-0.104**
(0.044)
-0.093**
(0.044)
City -0.034
(0.052)
-0.011
(0.054)
-0.052
(0.056)
Pseudo R2 0.02 0.04 0.03
Note: N = 910. Other variables included in the regressions are nonwhite, suburb, small town,
West, Midwest, South, New York City, Democrat, and missing income. All coefficients have
been transformed to correspond to marginal effects. Significance levels: *0.10, **0.05, and
***0.01.
32
Table V. Tobit Regressions for Log Best Estimate of Terrorism Deaths in the Next 12 Months
Airplane Bias Public-Event Bias Persistent Bias
Recollection Bias -0.643***
(0.177)
-0.747***
(0.171)
-0.585***
(0.166)
Age 0.011*
(0.006)
0.009
(0.006)
0.010*
(0.006)
Male -0.309*
(0.174)
-0.315*
(0.173)
-0.333*
(0.174)
Education -0.070*
(0.039)
-0.066*
(0.039)
-0.067*
(0.039)
Income/1,000 -0.004**
(0.002)
-0.004*
(0.002)
-0.004*
(0.002)
Republican 0.302
(0.214)
0.267
(0.214)
0.289
(0.215)
City -0.630**
(0.269)
-0.614**
(0.268)
-0.644**
(0.269)
Pseudo R2 0.01 0.01 0.01
Note: N = 906. Respondents indicating an upper bound on terrorism deaths in excess of one
million are excluded. Other variables included in the regression are nonwhite, suburb, small
town, West, Midwest, South, Democrat, and missing income. Significance levels: *0.10, **0.05,
and ***0.01.

33
Table VI. Probit Regressions for Support of Profiling if a 30-Minute Waiting Time
Airplane Bias Public-Event Bias Persistent Bias
Recollection Bias -0.046
(0.036)
-0.060*
(0.035)
-0.096***
(0.034)
Log Best Estimate 0.012*
(0.007)
0.012
(0.007)
0.011
(0.007)
Age 0.006***
(0.001)
0.006***
(0.001)
0.006***
(0.001)
Male 0.004
(0.036)
0.003
(0.036)
0.004
(0.036)
Education -0.019**
(0.008)
-0.019**
(0.008)
-0.019**
(0.008)
Income/1,000 0.227E-3
(0.378E-3)
0.231E-3
(0.377E-3)
0.184E-3
(0.378E-3)
Republican 0.123***
(0.042)
0.119***
(0.042)
0.117***
(0.043)
City -0.012
(0.056)
-0.011
(0.056)
-0.016
(0.056)
Pseudo R2
0.06 0.06 0.06
Note: N = 906. Respondents indicating an upper bound on terrorism deaths in excess of one
million are excluded. Other variables included in the regression are nonwhite, suburb, small
town, West, Midwest, South, Democrat, and missing income. Significance levels: *0.10, **0.05,
and *** 0.01.

34
Table VII. Ordered Probit Regressions for Support of Surveillance Cameras in Public Places
Airplane Bias Public-Event Bias Persistent Bias
Recollection Bias -0.343***
(0.109)
-0.197*
(0.102)
-0.315***
(0.096)
Log Best Estimate 0.045**
(0.020)
0.045**
(0.020)
0.044**
(0.020)
Age 0.019***
(0.004)
0.019***
(0.004)
0.019***
(0.004)
Male -0.192**
(0.098)
-0.205**
(0.098)
-0.208**
(0.098)
Education -0.042*
(0.022)
-0.040*
(0.022)
-0.041*
(0.022)
Income/1,000 1.118E-3
(1.093E-3)
1.252E-3
(1.088E-3)
1.109E-3
(1.094E-3)
Republican 0.450***
(0.125)
0.452***
(0.125)
0.445***
(0.125)
Democrat 0.450***
(0.111)
0.446***
(0.110)
0.448***
(0.111)
City 0.191
(0.155)
0.198
(0.155)
0.193
(0.155)
Pseudo R2
0.08 0.07 0.08
Note: N = 906. Respondents indicating an upper bound on terrorism deaths in excess of one
million are excluded. Other variables included in the regression are nonwhite, suburb, small
town, West, Midwest, South, and missing income. Significance levels: *0.10, **0.05, and ***
0.01.
35
Table VIII. Ordered Probit for Support of More Surveillance Cameras in Public Places
Airplane Bias Public-Event Bias Persistent Bias
Recollection Bias -0.207**
(0.086)
-0.199**
(0.084)
-0.204**
(0.080)
Log Best Estimate 0.044**
(0.017)
0.043**
(0.017)
0.044**
(0.017)
Age 0.016***
(0.003)
0.015***
(0.003)
0.016***
(0.003)
Male -0.077
(0.083)
-0.082
(0.083)
-0.084
(0.083)
Education -0.055***
(0.019)
-0.054***
(0.019)
-0.055***
(0.019)
Income/1,000 1.435E-3
(0.892E-3)
1.498E-3*
(0.890E-3)
1.430E-3
(0.892E-3)
Republican 0.195*
(0.102)
0.188*
(0.102)
0.189*
(0.102)
Democrat 0.365***
(0.095)
0.363***
(0.095)
0.361***
(0.094)
City 0.046
(0.130)
0.052
(0.130)
0.045
(0.130)
Pseudo R2 0.05 0.05 0.05
Note: N = 906. Respondents indicating an upper bound on terrorism deaths in excess of one
million are excluded. Other variables included in the regression are nonwhite, suburb, small
town, West, Midwest, South, and missing income. Significance levels: *0.10, **0.05, and ***
0.01.
36
Table IX. Probit Regressions for Support of Surveillance of Mail, E-mails, and Phones
Airplane Bias Public-Event Bias Persistent Bias
Recollection Bias -0.057
(0.037)
-0.035
(0.035)
-0.058*
(0.034)
Log Best Estimate 0.026***
(0.007)
0.026***
(0.007)
0.025***
(0.007)
Age 0.007***
(0.001)
0.007***
(0.001)
0.007***
(0.001)
Male -0.022
(0.036)
-0.025
(0.036)
-0.024
(0.036)
Education -0.015*
(0.008)
-0.015*
(0.008)
-0.015*
(0.008)
Income/1,000 0.755E-3**
(0.376E-3)
0.790E-3**
(0.375E-3)
0.757E-3**
(0.375E-3)
Missing Income -0.161*
(0.075)
-0.159*
(0.075)
-0.160*
(0.075)
Republican 0.029
(0.044)
0.029
(0.044)
0.027
(0.044)
City 0.086
(0.056)
0.087
(0.056)
0.084
(0.056)
Midwest -0.088*
(0.048)
-0.092*
(0.048)
-0.089*
(0.048)
South -0.079*
(0.042)
-0.079*
(0.042)
-0.077*
(0.042)
Pseudo R2
0.06 0.06 0.06
Note: N = 906. Respondents indicating an upper bound on terrorism deaths in excess of one
million are excluded. Other variables included in the regression are nonwhite, suburb, small
town, West, and Democrat. Significance levels: *0.10, **0.05, and *** 0.01.
37
APPENDIX A: SAMPLE CHARACTERISTICS
Table AI. Summary Statistics for All Variables
Mean Standard Deviation
Recollection Bias – Plane 0.675 0.469
Recollection Bias – Public 0.609 0.488
Recollection Bias – Persistent 0.499 0.500
Best Guess of Terror Fatalities 1382.77 17220.43
Log Best Guess of Terror Fatalities 4.521 2.333
Age 50.755 13.574
Male 0.368 0.483
Nonwhite 0.105 0.307
Education 14.875 2.336
Income/1,000 67.253 48.800
Missing Income 0.043 0.203
Republican 0.269 0.444
Democrat 0.378 0.485
New York City 0.030 0.170
City 0.280 0.449
Suburb 0.387 0.487
Small Town 0.179 0.384
West 0.213 0.410
Midwest 0.231 0.422
South 0.397 0.489
Note: N = 910. For Best Guess and Log Best Guess, N = 906; respondents indicating an upper
bound on terrorism deaths in excess of one million are excluded.