recoc manual - programa de cooperación...
TRANSCRIPT

Task Force: GT4 Design, development and implementation of Renewable Energy Consumption Optimization Center
(RECOC) Deliverable: D19a Technical Guides Authors David Chinarro, Ana Marcén
RECOC MANUAL
- 2 -
INDEX
Pages
A. HOSTS ................................................................................... 3
HOST PLATON ............................................................................................3
HOST OSCAR ..............................................................................................4
HOST ANA ..................................................................................................5
OTHER HOSTS ............................................................................................6
HOST CALIPSO................................................................................................................... 6
HOST ODISEO.................................................................................................................... 6
B. DATABASE ............................................................................. 7
C. GUI ...................................................................................... 11
1. GUI (Main GUI) .................................................................................................. 11
2. ClusterPreprocessor .......................................................................................... 14
3. PruebaGraficos .................................................................................................. 15
4. Android GUI ....................................................................................................... 16
5. SCADA ................................................................................. 17
6. SCRPITS ............................................................................... 18
7. FUNDACIÓN DE HIDRÓGENO ............................................... 23
8. WEB OPTIMA GRID .............................................................. 24
9. GOOGLE ACCESS .................................................................. 27
10. MODDLE OPTIMA GRID ....................................................... 28

- 3 -
A. HOSTS
HOST PLATON
Operative system: Linux – Ubuntu 11.04
User accounts:
Username: oscar Administrator Password:
Username: David Personalised – Limited Password:
Username: Enrique Administrator Password:
Username: optimagridftp Password:
CONTAINS:
DATABASE: is the database where we store the data about the consumptions, productions, aero generators… in our system.
GUI AGENTS: is the graphic interface that does possible to interact with the consumptions and productions of the database.
SCADA: In the desktop of the account of user ‘oscar’, there is an icon of the application “Optimagridv4”, 4th version of SCADA to monitor the production and consumer of the energy of the Technology Park.
SCRIPTS: are the scripts that update the database.

- 4 -
HOST OSCAR Operative system: Linux - Ubuntu
User accounts:
Username: oscar Administrator Password:
Operative system: Windows 7 (License is expired)
User accounts:
Username: oscar Administrator Password:
CONTAINS:
GUI AGENTS: is the graphic interface that does possible to interact with the consumptions and productions of the database. This host have different projects that shows different GUI with different uses.
- 5 -
HOST ANA
Host for development. Operative system: Windows 2007 Professional (64-bit Operating System)
User accounts:
Username: AnaMarcen Administrator Password:
Username: dchinarro Administrator Password:
Username: jmbergues Administrator Password:
Username: RECOC Administrator Password:
It has installed Netbeans 6.9.1 and MySQL Server 6.0.
- 6 -
OTHER HOSTS HOST CALIPSO
Operative system: Linux – Ubuntu 11.10
User accounts:
Username: david Administrator Password:
Username: oscar Administrator Password:
Username: session de invitado Without password.
HOST ODISEO
Operative system: Linux – Ubuntu 10.04
User accounts:
Username: Redes1 Administrator
Password:
Hard disk (82 GB) with 3 partitions :
1. System of files (62GB) kind of partition: Linux(0x83)
2. System of files(17 GB) kind of partition: Linux(0x83)
3. Interchange area (3 GB) kind of partition: Interchange(swap) of Linux(0x82)
Netbeans 6.9.1 is installed but there are not projects.
[Note: this host has problems with connections in the long run, after several minutes it shuts down; we keep it to carry out proofs.]

- 7 -
B. DATABASE
Access Data of Mysql:
HostName: localhost
Host: 213.98.14.77
IP address: 10.10.10.100
Subnet mask: 255.255.255.0
Port: 1500
Gateway: 10.10.10.4
Users: at this moment, there are nine user accounts with different types of
permissions.
[1][Administrator] User:
root Pass:usj_optima_recoc
Permissions: all permissions
[2][@localhost]
User: debian-sys-maint
[3]
User: optimaUser
Pass: o_p_t_u_s_3_r
Permissions: he can realise ‘selects’, ‘inserts’, ‘updates’ and ‘deletes’ in the BBDD ‘consumos’, ‘generacion’ and meteorology’.
[4]
User: user_scripts
Pass: jGqgftg43k
Permissions: he can realise ‘selects’, ‘inserts’, ‘updates’ and ‘deletes’ in the BBDD ‘consumos’, ‘generacion’ and meteorology’.
[5]
User: pruebas
Pass:
Permissions: he cannot access to any table of the BBDD.
[6]
User: optimagrid
Pass:
Permissions: he can only realise ‘selects’ in the BBDD ‘consumos’.

- 8 -
[7]
User: invitado
Pass: invitado_optima
Permissions: he can only realise ‘selects’ in the BBDD ‘consumos’.
[8][User to work in RECOC]
User: uconsumos Pass: optimacons Permissions: he can only realise ‘selects’ and ‘inserts’
in the BBDD ‘consumos’.
[9][User to students of fourth year]
User: lectura
Pass: lectura
Permissions: he can only realise ‘selects’ in all BBDDs.
Chained SSH connection:
mysql -h <mysqlHost> -u <mysqlUser> -P <portNumber> -p
In the Local Network:
mysql –h 10.10.10.100 –u root –P 1500 –p
mysql –h 10.10.10.100 consumos -u uconsumos -P 1500 -p
mysql –h 10.10.10.100 consumos -u invitado -P 1500 –p
. . .
In other network:
mysql -h 213.98.14.77 -u root -P 1500 -p
mysql -h 213.98.14.77 consumos -u invitado -P 1500 -p
. . .
Update of the Databases:
‘consumos’ is updated through several scripts that are in ithe host Platon.
‘generacion’: is updated thanks to Inycom. Inycom push updated data to our Database. (At this moment Enercon table is the unique that is updated)
- 9 -
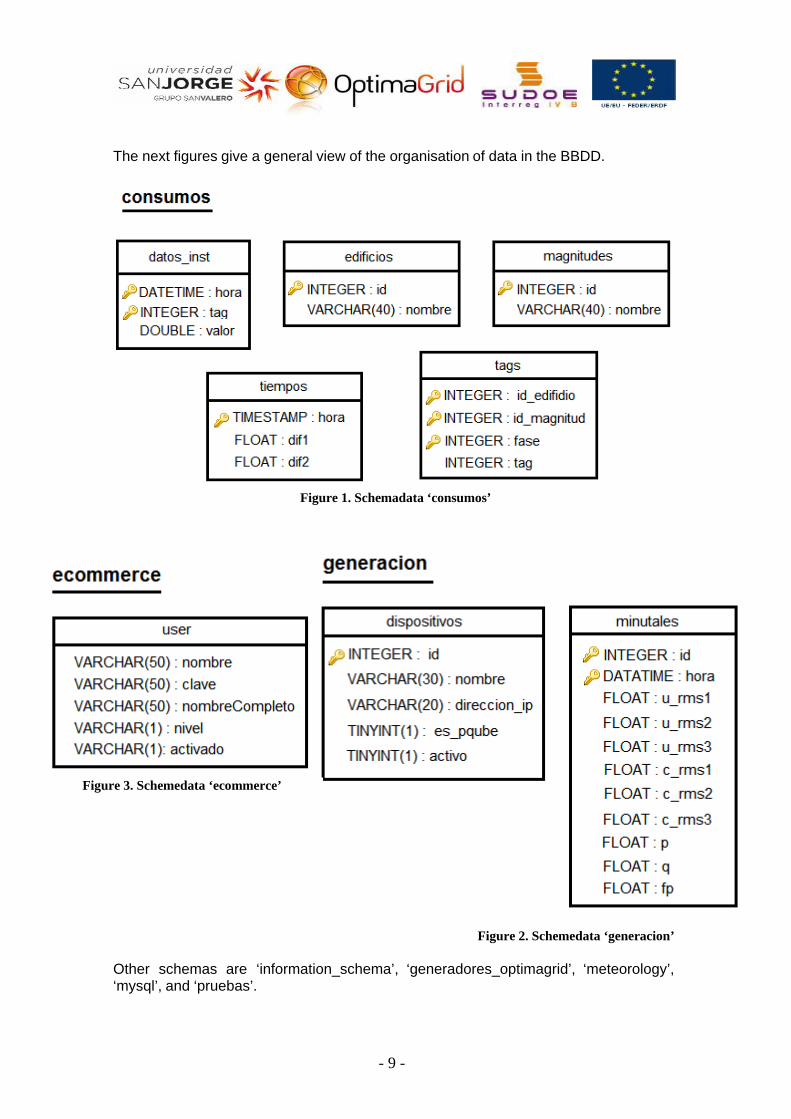
The next figures give a general view of the organisation of data in the BBDD.
Figure 1. Schemadata ‘consumos’
Figure 3. Schemedata ‘ecommerce’
Figure 2. Schemedata ‘generacion’
Other schemas are ‘information_schema’, ‘generadores_optimagrid’, ‘meteorology’, ‘mysql’, and ‘pruebas’.
- 10 -
BBDD of INYCOM:
- Server: MySQL
- Database size: 9700 mega bytes.
- Database private / public address: 192.168.11.100.
- Host: 212.75.172.100
- User: aire
- Pass: aire
- schemas:
‘consumos’: comsuptions.
‘agregados’: production of aero ENERCON (‘minutales’ table with id=3), production of aero SOLAR (‘minutales’ table with id=5), production of aero VESTAS (‘minutales’ table with id=1).
In the documents sent me at start, there were the following information about the BBDD of INYCOM.
“We are using to the production:
- Server MySQL.
- Database size: 9700 mega bytes.
- Database private / public address: 192.168.11.100. No utilizamos acceso externo.
- Schema: vda
- Tables: paquetes.
- User: aire.
- Admin: root.”

- 11 -
C. GUI
1. GUI (Main GUI) There are two projects with the same agents; one is in the host PLATON, and the other is in the host OSCAR. Although they can have differences, and one could be more completed than the other.
In the document attached called System RECOC – Agents are a description about agents that enable to show the graphic interface to the consumptions and the productions of the Database. That is, the agents those show the information about the Database ‘consumos’ and the Database ‘generacion’. The GUI project is called OptimagridSMA_Full.
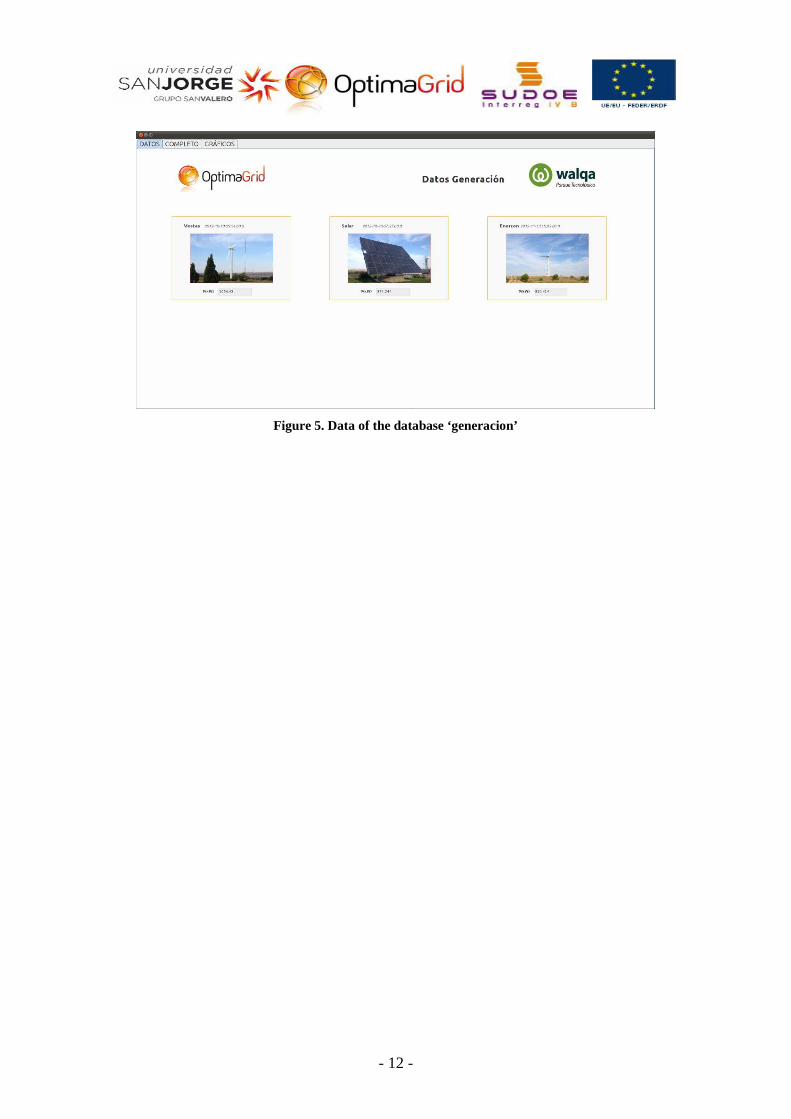
The following figures show the GUIs in a specific moment.
Figure 4. Data of the database ‘consumos’
- 12 -
Figure 5. Data of the database ‘generacion’
- 13 -
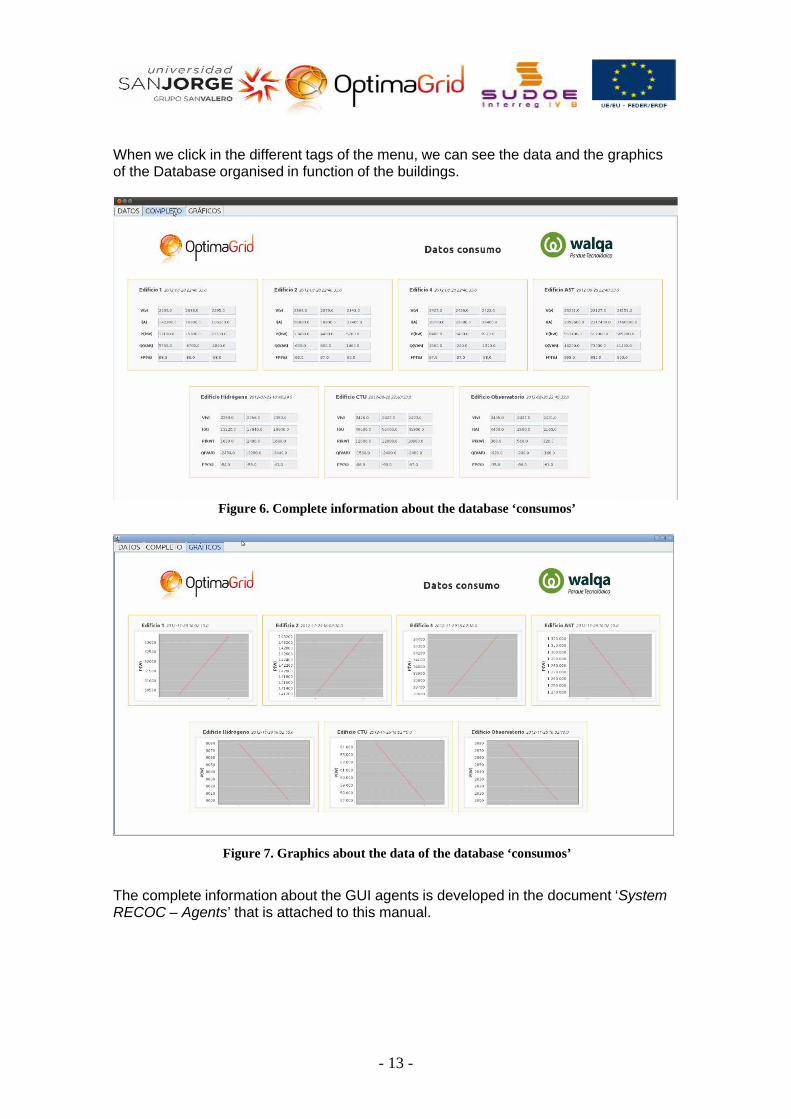
When we click in the different tags of the menu, we can see the data and the graphics of the Database organised in function of the buildings.
Figure 6. Complete information about the database ‘consumos’
Figure 7. Graphics about the data of the database ‘consumos’ The complete information about the GUI agents is developed in the document ‘System RECOC – Agents’ that is attached to this manual.

- 14 -
2. ClusterPreprocessor
The project that shows the GUI to the cluster pre-processor is kept in the host Oscar, in addition, it was implemented in the IDE Eclipse.
Next, there are several captures of the GUI created in this project:
Figure 8. Generation points Figure 9.Load Points
- 15 -
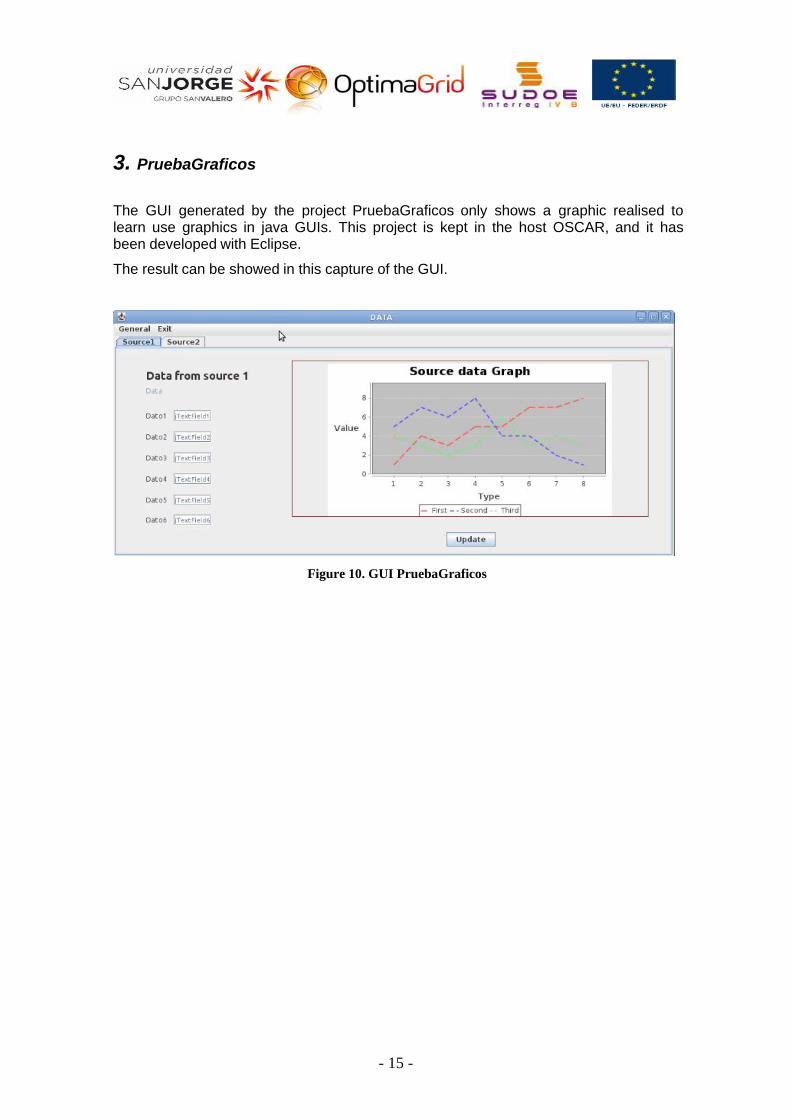
3. PruebaGraficos The GUI generated by the project PruebaGraficos only shows a graphic realised to learn use graphics in java GUIs. This project is kept in the host OSCAR, and it has been developed with Eclipse.
The result can be showed in this capture of the GUI.
Figure 10. GUI PruebaGraficos

- 16 -
4. Android GUI
There are several projects in the host OSCAR and implement in the IDE Eclipse that develop a GUI to represent an android GUI with a multiagent system. The following figure is the capture of this GUI when we start to run these projects.
Figure 11. Android GUI

- 17 -
5. SCADA
Access:
http://213.98.14.77:90
Host: 213.98.14.77
Port: 90
Option: optimagrid-v6
Users:
User: optimagrid
Pass: optimagrid
Attached to this document, there is a user’s manual to SCADA.
- 18 -
6. SCRPITS
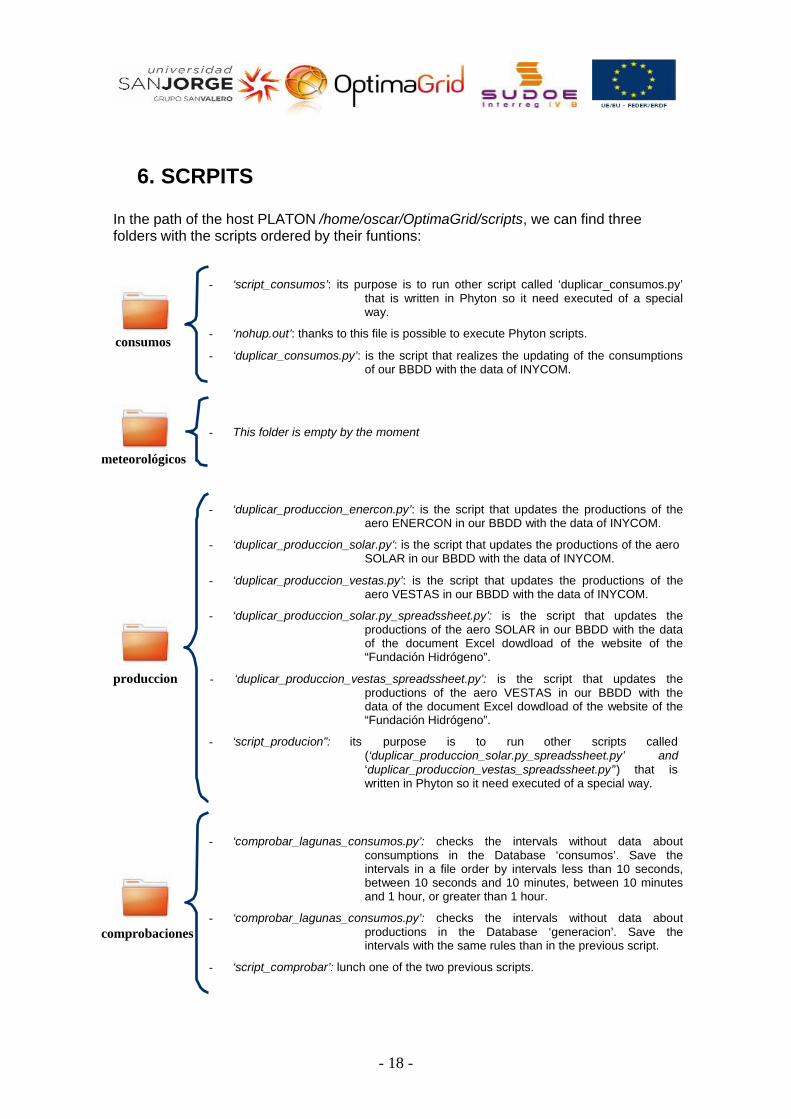
In the path of the host PLATON /home/oscar/OptimaGrid/scripts, we can find three folders with the scripts ordered by their funtions:
consumos
- ‘script_consumos’: its purpose is to run other script called ‘duplicar_consumos.py’ that is written in Phyton so it need executed of a special way.
- ‘nohup.out’: thanks to this file is possible to execute Phyton scripts.
- ‘duplicar_consumos.py’: is the script that realizes the updating of the consumptions of our BBDD with the data of INYCOM.
meteorológicos
- This folder is empty by the moment
- ‘duplicar_produccion_enercon.py’: is the script that updates the productions of the aero ENERCON in our BBDD with the data of INYCOM.
- ‘duplicar_produccion_solar.py’: is the script that updates the productions of the aero SOLAR in our BBDD with the data of INYCOM.
- ‘duplicar_produccion_vestas.py’: is the script that updates the productions of the aero VESTAS in our BBDD with the data of INYCOM.
- ‘duplicar_produccion_solar.py_spreadssheet.py’: is the script that updates the productions of the aero SOLAR in our BBDD with the data of the document Excel dowdload of the website of the “Fundación Hidrógeno”.
produccion - ‘duplicar_produccion_vestas_spreadssheet.py’: is the script that updates the productions of the aero VESTAS in our BBDD with the data of the document Excel dowdload of the website of the “Fundación Hidrógeno”.
- ‘script_producion”: its purpose is to run other scripts called (‘duplicar_produccion_solar.py_spreadssheet.py’ and ‘duplicar_produccion_vestas_spreadssheet.py’’) that is written in Phyton so it need executed of a special way.
comprobaciones
- ‘comprobar_lagunas_consumos.py’: checks the intervals without data about consumptions in the Database ‘consumos’. Save the intervals in a file order by intervals less than 10 seconds, between 10 seconds and 10 minutes, between 10 minutes and 1 hour, or greater than 1 hour.
- ‘comprobar_lagunas_consumos.py’: checks the intervals without data about productions in the Database ‘generacion’. Save the intervals with the same rules than in the previous script.
- ‘script_comprobar’: lunch one of the two previous scripts.
- 19 -
Updating the Database ‘consumos’:
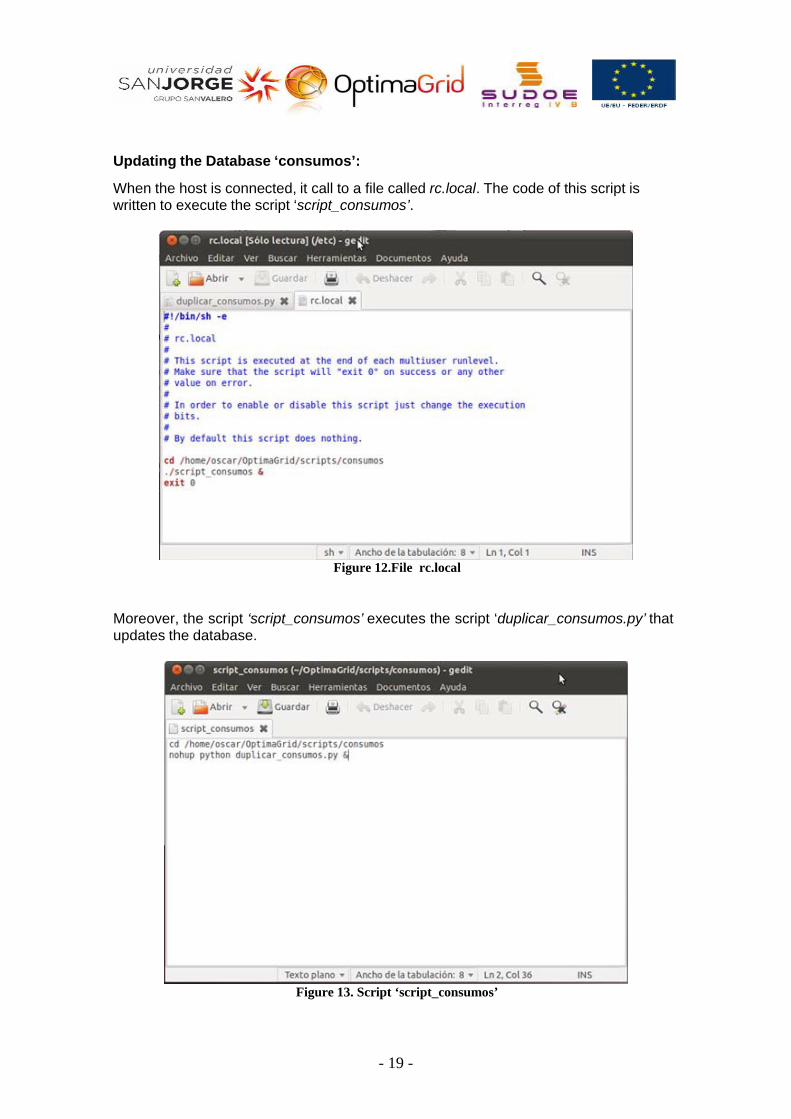
When the host is connected, it call to a file called rc.local. The code of this script is written to execute the script ‘script_consumos’.
Figure 12.File rc.local
Moreover, the script ‘script_consumos’ executes the script ‘duplicar_consumos.py’ that updates the database.
Figure 13. Script ‘script_consumos’
- 20 -
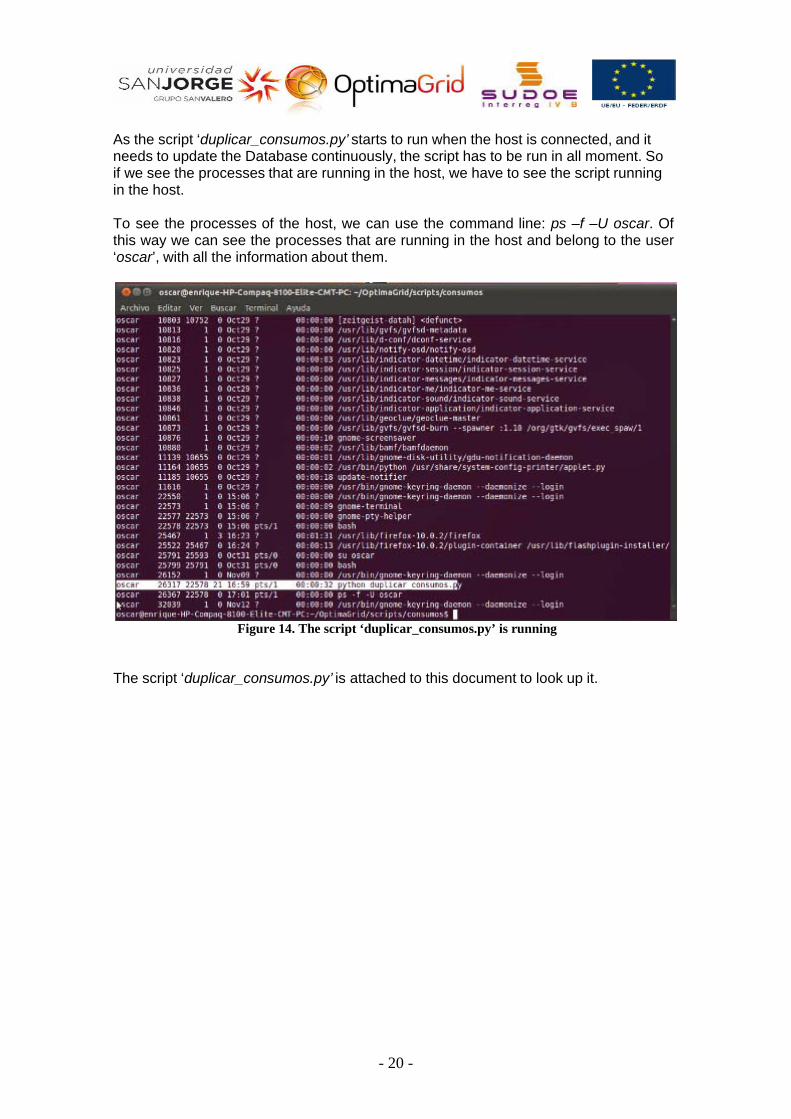
As the script ‘duplicar_consumos.py’ starts to run when the host is connected, and it needs to update the Database continuously, the script has to be run in all moment. So if we see the processes that are running in the host, we have to see the script running in the host. To see the processes of the host, we can use the command line: ps –f –U oscar. Of this way we can see the processes that are running in the host and belong to the user ‘oscar’, with all the information about them.
Figure 14. The script ‘duplicar_consumos.py’ is running
The script ‘duplicar_consumos.py’ is attached to this document to look up it.
- 21 -
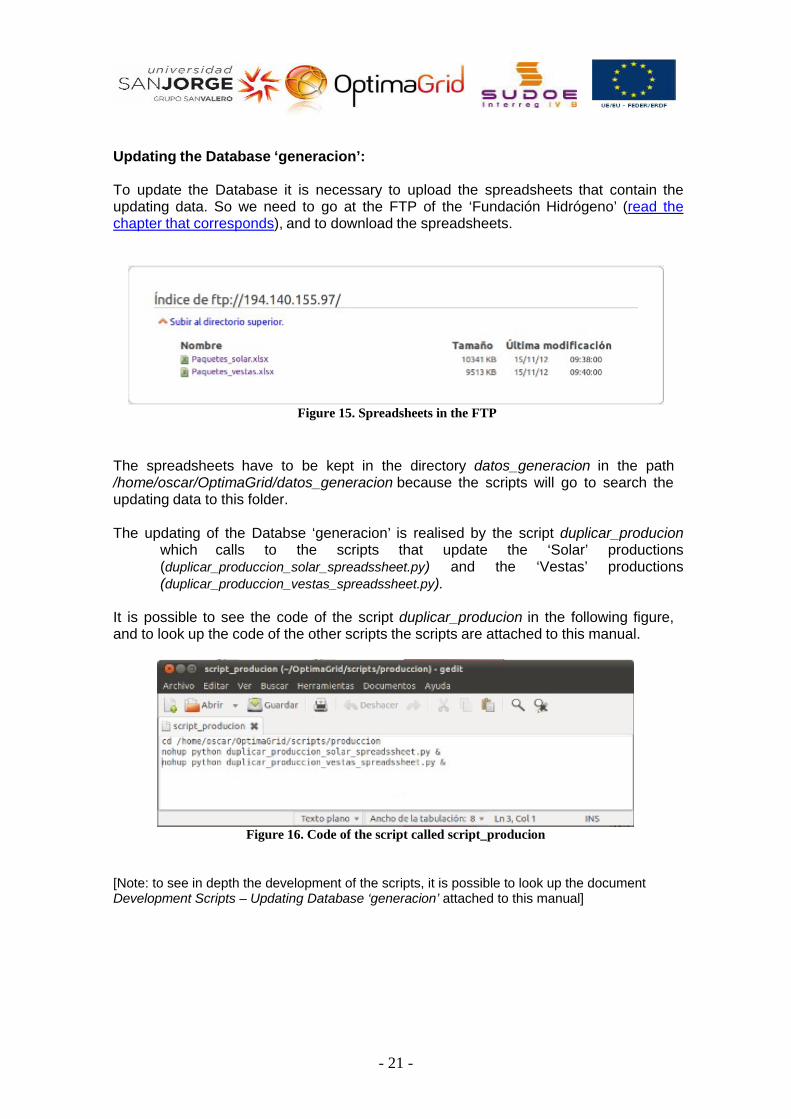
Updating the Database ‘generacion’: To update the Database it is necessary to upload the spreadsheets that contain the updating data. So we need to go at the FTP of the ‘Fundación Hidrógeno’ (read the chapter that corresponds), and to download the spreadsheets.
Figure 15. Spreadsheets in the FTP
The spreadsheets have to be kept in the directory datos_generacion in the path /home/oscar/OptimaGrid/datos_generacion because the scripts will go to search the updating data to this folder. The updating of the Databse ‘generacion’ is realised by the script duplicar_producion
which calls to the scripts that update the ‘Solar’ productions (duplicar_produccion_solar_spreadssheet.py) and the ‘Vestas’ productions (duplicar_produccion_vestas_spreadssheet.py).
It is possible to see the code of the script duplicar_producion in the following figure, and to look up the code of the other scripts the scripts are attached to this manual.
Figure 16. Code of the script called script_producion
[Note: to see in depth the development of the scripts, it is possible to look up the document Development Scripts – Updating Database ‘generacion’ attached to this manual]
- 22 -
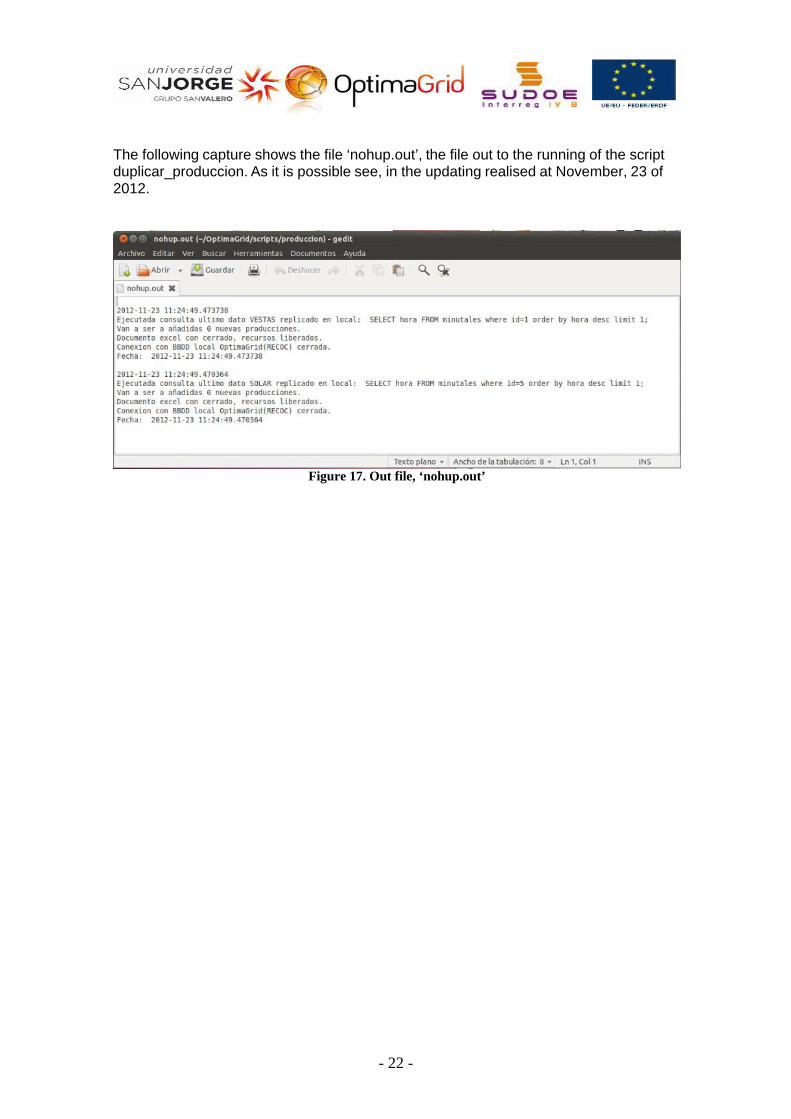
The following capture shows the file ‘nohup.out’, the file out to the running of the script duplicar_produccion. As it is possible see, in the updating realised at November, 23 of 2012.
Figure 17. Out file, ‘nohup.out’

- 23 -
7. FUNDACIÓN DE HIDRÓGENO
It provides the data to update the Database ‘generacion’ through an FTP.
FTP address: ftp://194.140.155.97
or ftp2.hidrogenoaragon.org
Username: usuario_optimagrid
Password: 7?Duk@

- 24 -
8. WEB OPTIMA GRID
===================== EN HOST optiweb ======================= IP interna: 172.16.9.61 IP externa: 193.146.136.159 acceso ssh:
user: dchinarro pass: 85murESa
shel para privilegios admin: sudo
raiz web en /var/www
Mysql user:??????????? pass:???????????
Tomcat en :8080/manager/html,
Usuario: tomgrid Passw: f7WRuh7c
/opt/tomcat -------------- Mysql. User:root Pass:FAch3he3 ------------------ root del Apache: var/www/index.html
Acceso a gestión desde Tomcat: http://optimagrid.eu:81/gestor/hello.jsp
Acceso a la web www.optimagrid.eu/administracion para administrar contenidos Usuario: sanjorge Contraseña: ioH)lm$3

- 25 -
SITEMAP:
LEGAL NOTICE
legal_notice
REGISTER register_form
PROJECT
DESCRIPTION
introduction
INTRODUCTION
introduction
OBJECTIVES
objectives
HOME
PATERNS
paterns
ACCESIBILITY
accesibility NEWS
news
FAQ
faq
OBSERVATORY
news
EVENTS
events
NEWSLETTERS
newsletter
SITEMAP
sitemap
url
PRESS press
CONTACT
contact
BIDDINGS
biddings
TECHNOLOGICAL TRANSFER
publications TECHNOLOGICAL
TRANSFER
publications
COLABORATORS
colaborators
INTERESTING LINKS
interesting_links

SITEMAP WITH PICTURES
LEGAL NOTICE
REGISTER INTRODUCTION
legal notice
ACCESIBILITY
register_form PROJECT
DESCRIPTION
introduction OBJECTIVES
accesibility
HOME introduction objectives
FAQ PATERNS
faq
NEWS
SITEMAP paterns
EVENTS
sitemap news
CONTACT
OBSERVATORY
TECHNOLOGICAL
TRANSFER
events NEWSLETTERS
contact
BIDDINGS
news
newsletter
biddings
publications TECHNOLOGICAL
TRANSFER
PRESS
COLABORATORS INTERESTING
LINKS
publications
colaborators interesting links - 26 -
press

- 27 -
9. GOOGLE ACCESS
Gmail account:
Gmail: [email protected]
Password: optima_recoc Analytics account:
Google Analytics (GA): is one of the services offered by Google. The visits to our website can be supervised, and detailed statistics about these visits are generated through this service.
User: [email protected]
Password: optima_recoc

- 28 -
10. MODDLE OPTIMA GRID This chapter has the objective to give a general idea of the actual situation of the Moodle of OPTIMAGRID, in addition to provide information about its access, organisation, and main features of the Moodle. SERVER
============================= HOST: optimod. ============================= Aplicación Moodle: IP interna 172.16.9.38 IP externa: 193.146.136.158 Usuario :admin Password: weGx_d5N
acceso ssh: user: ?????????? pass: ??????????
MOODLE doc.optimagrid.es
cgonzalo opti2011-GRID
dchinarro opti2011-GRID
SOE2/P2/E322
opti-5GRID
Moreover, according to the Moodle information about the Server, the session time out is of two hours, after this time, if the user is inactive yet, the session will finish. ACCOUNT OF USERS
At 29/10/2012, there are 25 accounts of users that can have different roles in function of their papers in the system.
Kind of roles:
Administrator: normally, administrators can do anything in the Moodle, in any course. GT Manager: can take any action and activity within a course. GT Partner: Assistant: has less privileges than GT Contributor Guest: has the minimum privileges Usuario autenticado: all authenticated users.
The roles can be global or they can depend of a part of Moodle: courses, title page…

- 29 -
COURSES In this moment, there are six courses in the category ‘OPTIMAGRID development’, one in the category ‘EVENTS’, and five in the category ‘Projects for OPTIMAGRID’.
Figure 18. Courses in the category OPTIMAGRID development
Figure 19. Course in the category EVENTS
Figure 20. Courses in the category Projects for OPTIMAGRID
For each course, the users can have a specific role. Depending of the course and the part that is need by the person to his work, the user can has a specific kind of role to that course. Of this way a user that is GT Partner can be Administrator to a specific course. GRADES In this moment the Moodle is configured to shows in the grades book the users with roles of Administrator and Assistant. The navigated method is through a drop-down menu, and the grades are showed as a percentage with two decimals.
IDIOM The default idiom is the English, although the actual idiom in the Moodle is the Spanish.
- 30 -
ACTIVITIES The available activities are chats, consultations, questionnaires, labels, forums, glossaries, resources, and wikis. Now, the visible courses are Administration, Administration of the site, Calendar, Courses, Description Course/Site, Entry, HTML, Marks of the Administrator, Marks, Messages, Main Menu, News, People, Online Users. SECURITY The security is configured to not send notifications when there is a fail access. APPEARANCE The theme that is selected is the standardgreen. Other feature of this section that can be interesting is the maximum number of courses; the established value at this moment is 21 courses as maximum. For other hand, there are two marks named ‘Pervasive computing’ and ‘Mathemathic Model by Wavelets’. TITLE PAGE The actual name of the site is “OPTIMAGRID PROJECT REPOSITORY”, and in the title page shows a list of 20 courses per page. As it was mentioned previously, the users can be local roles to the title page; in this moment there are two persons that have local administrator role. NETWORK Nowadays, the network is disabled. REPORTS The reports of the Moodle show that there are some warnings and a critical error in the default roles (course).
Task Force: GT4 Design, development and implementation of Renewable Energy Consumption Optimization Center
(RECOC) Deliverable: D19b Technical Guides Authors David Chinarro, Ana Marcén
SYSTEM RECOC - AGENTS

INDEX
Pages
OptimagridSMA_Full ................................................................... 3
Services ............................................................................................. 3
Agents ................................................................................................ 3
A. Agent.Cluster ............................................................................................. 5
B. Agent.Cluster.HandlerAgent...................................................................... 5
C. Agent.Cluster.Painter ................................................................................ 6
D. Agent.Huddle ............................................................................................. 6
E. Agent.Huddle.Handler ............................................................................... 7
F. Agent.Huddle.Painter ................................................................................ 7
G. Agent.Load ................................................................................................ 8
H. Agent.Source ............................................................................................. 8
SerialPortDisplayApp .................................................................. 9
interfaz_CEM ................................................................................ 9
ClusterPreprocessor ................................................................... 9
Android_Agents........................................................................... 9
RemoteControllerAndroid........................................................... 9

OptimagridSMA_Full
Services
Figure 1. Services windows
Agents
The services window shows that important resources are registered with the IDE Netbeans in the host Igniton-MAS.
The projects window shows the projects that are implemented in the IDE. In IDE Netbeans of the host Ignition-MAS, there is only one project with several packages. In the following sections these packages are discomposed in order to describe their agents and the behaviours of the agents.
Figure 2. Projects windows

To execute this project is used the following line of arguments:
‐gui ‐local‐host localhost ‐agents
cluster:Agent.Cluster.ClusterPrepAgent;
huddle:Agent.Huddle.HuddlePrepAgent;
sourceVestas:Agent.Source.SourceGenerationBuildingAgent;
sourceEnercon:Agent.Source.SourceGenerationBuildingAgent;
sourceSolar:Agent.Source.SourceGenerationBuildingAgent;
load1:Agent.Load.LoadConsumptionBuildingAgent;
load2:Agent.Load.LoadConsumptionBuildingAgent;
load4:Agent.Load.LoadConsumptionBuildingAgent;
loadAST:Agent.Load.LoadConsumptionBuildingAgent;
loadHid:Agent.Load.LoadConsumptionBuildingAgent;
loadCTU:Agent.Load.LoadConsumptionBuildingAgent;
loadObs:Agent.Load.LoadConsumptionBuildingAgent;
generationPainter:Agent.Cluster.Painter.DataSourcePainterAgent;
consumpsionsPainter:Agent.Huddle.Painter.DataLoadPainterAgent
‐services jade.core.event.NotificationService;jade.core.messaging.TopicManagementService
Thanks to these arguments the project when is launched create all the agents and services required by the arguments, and in time of execution show the GUIs that show the data of the Databases ‘consumos’ and ‘generacion’
For other hand, we can study in depth the agents of this project taking into account the PCF of Óscar.
In the PCF of Óscar, he wrote that the Project has to have the following agents in function of the Hosts/Devices
Hosts/Devices Agents
Generator Server G1. - Source Agent.
- Cluster Preprocessor Agent.
- Auction Agent.
Load Server L1. - Load Agent.
- Huddle Preprocessor Agent.
Manager Server. - Wavelet Neuronal.
Public server. - Client Agents.
- Circuit Agents.
Painter. - Display agents.

Behaviour Description
TickerBehaviour It sends periodically a message about topic “generation_data”
CyclicBehaviour It waits for messages with pow data of the different source agents.
Behaviour Description
OneShotBehaviour It sends the message
Taking this table as a general idea of agents, it is possible to do a comparison between it and the following agents that are implemented in the IDE Netbeans of the host Ignition-MAS:
A. Agent.Cluster
It is a package with the agent ClusterPrepAgent.
Agent Name Cluster Preprocessor Agent
Class Name in the IDE ClusterPrepAgent
Description of the agent If it receives the next parameters:
- AID of agent, so it must reply
- Ontology, so it must use
In order to realise the previous tasks, it has the following behaviours:
B. Agent.Cluster.HandlerAgent
It is a package with the agent MySQLHandlerAgent.
Agent Name
Class Name in the IDE MySQLHandlerAgen
Description of the agent For a specific handler, it sends a message with the generation_data information acquired in the BBDD.

Behaviour Description
TickerBehaviour Request data building and consumptions
CyclicBehaviour Wait for messages
Behaviour Description
TickerBehaviour Sends periodically a message about topic “load_data”
CyclicBehaviour Wait for messages
C. Agent.Cluster.Painter
It is a package with the agent DataSourcePainterAgent
Agent Name DisplayAgents
Class Name in the IDE DataSourcePainterAgent
Description of the agent It shows a GUI that shows the consumptions.
D. Agent.Huddle
It is a package with the agent DataSourcePainterAgent
Agent Name Huddle Preproccesor Agent
Class Name in the IDE DataSourcePainterAgent
Description of the agent If it receives the next parameters:
- AID of agent, so it must reply
- Ontology, so it must use
Behaviour Description
OneShotBehaviour It sends the message
Behaviour Description
TickerBehaviour Request data building and consumptions
CyclicBehaviour Wait for messages
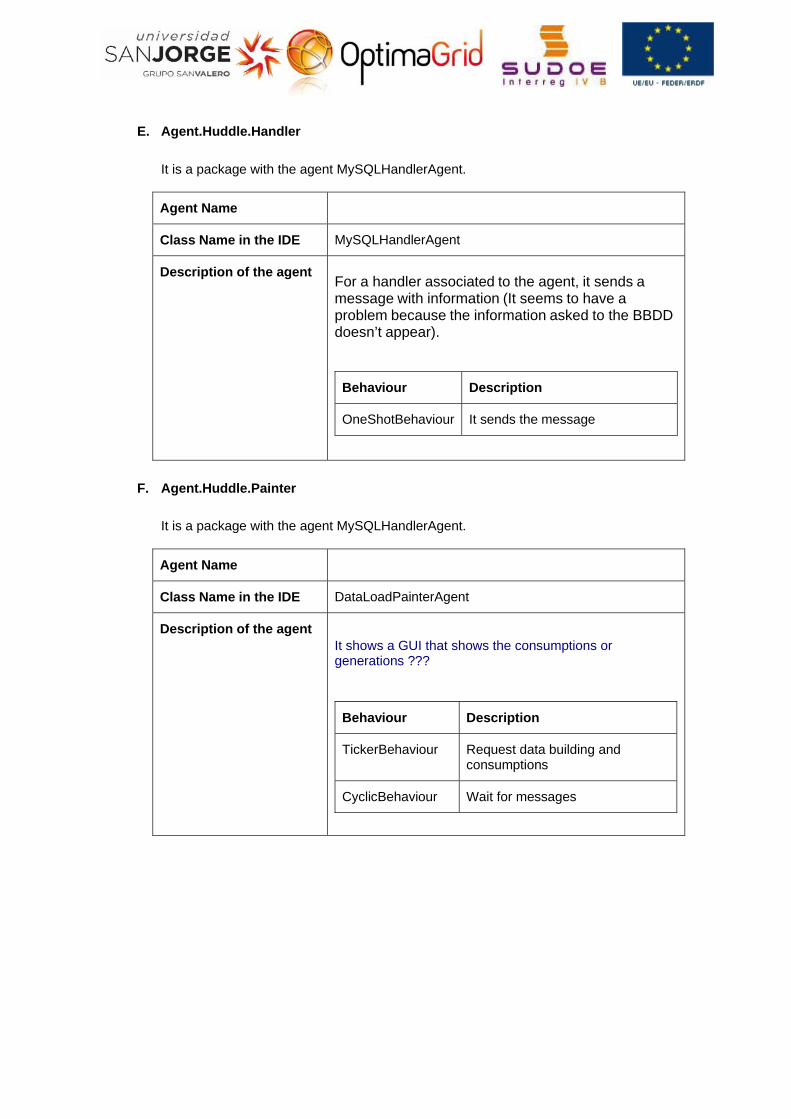
E. Agent.Huddle.Handler
It is a package with the agent MySQLHandlerAgent.
Agent Name
Class Name in the IDE MySQLHandlerAgent
Description of the agent For a handler associated to the agent, it sends a message with information (It seems to have a problem because the information asked to the BBDD doesn’t appear).
F. Agent.Huddle.Painter
It is a package with the agent MySQLHandlerAgent.
Agent Name
Class Name in the IDE DataLoadPainterAgent
Description of the agent It shows a GUI that shows the consumptions or generations ???

Behaviour Description
TickerBehaviour Request the data to the associated building periodically.
CyclicBehaviour Wait for messages
G. Agent.Load
It is a package with the agent LoadConsumtionBuildingAgent.
Agent Name
Class Name in the IDE LoadConsumtionBuildingAgent
Description of the agent It is a load building agent, it creates a specific kind handler depending of the place where the required data is, and it obtains the building data.
H. Agent.Source
It is a package with the agent SourceGenerationBuildingAgent.
Hosts/Devices Agents
Generator Server G1. - Source Agent.
- Cluster Preprocessor Agent.
- Auction Agent.
Load Server L1. - Load Agent.
- Huddle Preprocessor Agent.
Manager Server. - Wavelet Neuronal.
Public server. - Client Agents.
- Circuit Agents.
Painter. - Display agents.
Other projects that could belong to the System RECOC: [It is necessary to know them to know if they belong to the system RECOC]
SerialPortDisplayApp
interfaz_CEM
ClusterPreprocessor
Android_Agents
RemoteControllerAndroid

Task Force: GT4 Design, development and implementation of Renewable Energy Consumption Optimization Center
(RECOC) Deliverable: D19c Technical Guides
SCADA version manual

Deliverable: 18Date: 23 / 02 / 2012Page: 2 / 16
ABSTRACT
In this manual the reader can find the present state of the SCADA that is currently under development in the Optimagrid project. This paper aims to be a useful guide for all those who want to run the SCADA and check its functionalities. The reader will find a route through the different sections composing the program, as well as a number of observations about some of the pictures describing the most relevant screens of the application.
Deliverable: 18Date: 23 / 02 / 2012Page: 3 / 16
CONTENTS
1 Requirements, download and execution of the program ..................................4
2 Main screen ...........................................................................................................6
3 Production screen.................................................................................................7
4 Consumption screen.............................................................................................9
5 Wind and radiation screen .................................................................................11
6 History screen .....................................................................................................12
7 Comparatives screen ..........................................................................................15
8 References ...........................................................................................................16
Deliverable: 18Date: 23 / 02 / 2012Page: 4 / 16
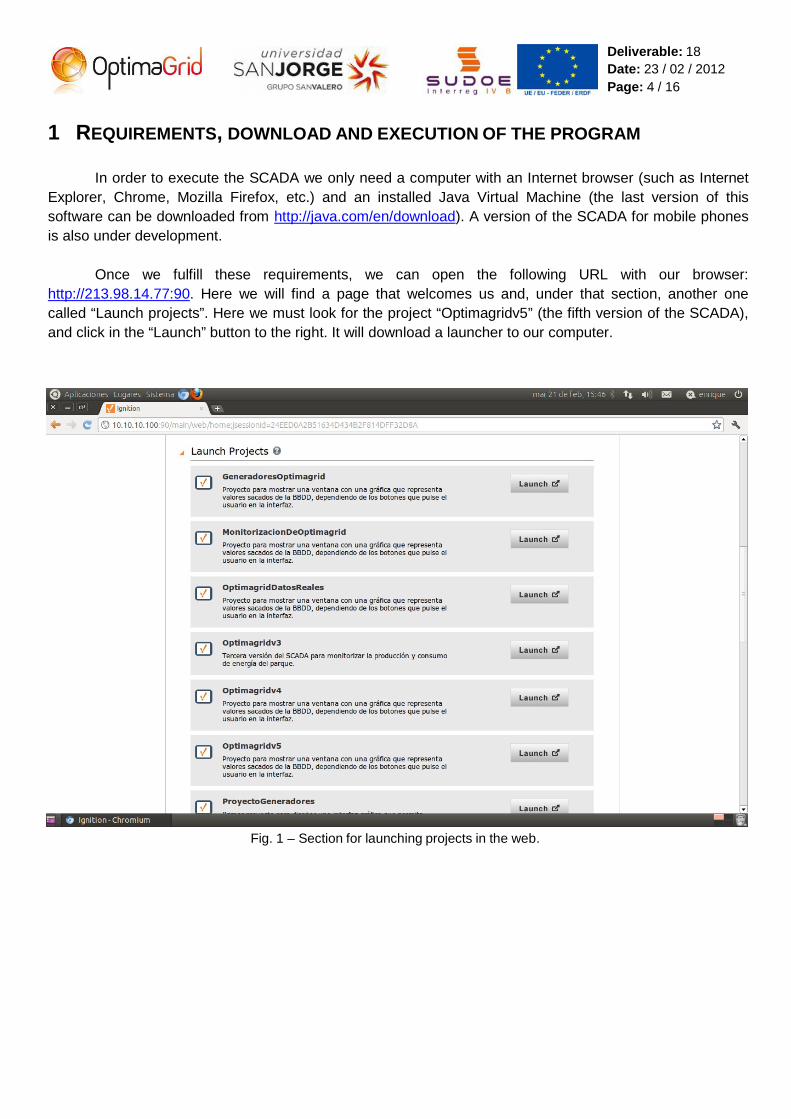
1 REQUIREMENTS, DOWNLOAD AND EXECUTION OF THE PROGRAM
In order to execute the SCADA we only need a computer with an Internet browser (such as Internet Explorer, Chrome, Mozilla Firefox, etc.) and an installed Java Virtual Machine (the last version of this software can be downloaded from http://java.com/en/download). A version of the SCADA for mobile phones is also under development.
Once we fulfill these requirements, we can open the following URL with our browser:
http://213.98.14.77:90. Here we will find a page that welcomes us and, under that section, another one called “Launch projects”. Here we must look for the project “Optimagridv5” (the fifth version of the SCADA), and click in the “Launch” button to the right. It will download a launcher to our computer.
Fig. 1 – Section for launching projects in the web.

Deliverable: 18Date: 23 / 02 / 2012Page: 5 / 16
The next step is to execute that launcher. The Java Virtual Machine should execute it by simply double-clicking on it. If it does not, right-click on it, and choose the option “Open with…” the Java Virtual Machine.
Once the launcher is executed, it will download the project (it will take some seconds) and prompt
the login screen. Here we will find a brief description of the project and will be asked for our username and password. Both of them are “optimagrid”. Clicking on the “Login” button will take us to the main screen of the SCADA.
Fig. 2 – Login screen.

Deliverable: 18Date: 23 / 02 / 2012Page: 6 / 16
2 MAIN SCREEN
The screens are divided in three parts: In the upper left we have three menus with different options
(this is predefined by the Ignition software), below that we have the five tabs (we use them to navigate through the screens of the SCADA) and below these we have the current, selected screen.
The first time we enter the SCADA, none of the tabs are selected and we are presented a big picture with the declaration “The clean, friendly smart energy”, and below that we can see the logo of the project (which is included in every screen to the right of the tabs). Clicking on the picture or any of the logos will open the project’s main page (http://optimagrid.eu) in your Internet browser.
Fig. 3 – The first screen of the SCADA.
The predefined options in the upper left part of the screen are “Command”, “”Windows” and “Help”. In “Command” we can find “Logout” (it will logout our session in the SCADA, taking us back to the login page), “Lock Screen” (it will lock the screen of the SCADA, just like the screensaver in the operating system, with the password we entered in the session) and “Exit” (it will finish the program). In “Windows” we can choose a window of the SCADA in order to close it (here “window” refers to the tabs section and the screen below them). Finally, “Help” can show us a diagnostics console with technical parameters about the application we are executing, or information about the Ignition Vision client we are currently using in the SCADA.

Deliverable: 18Date: 23 / 02 / 2012Page: 7 / 16
3 PRODUCTION SCREEN
If we click on the “Production” tab in the tabs menu we will see the main screen of this section.
There are pictures of the generators monitored by the SCADA (actually four, in the Walqa technological park) and below them the buttons with their names. If we click on any of these buttons the SCADA will open a window with a bar graphic representing the average power production (active or reactive) in the period of time we choose (the last day, week, month or year).
Fig. 4 – The production screen.
Deliverable: 18Date: 23 / 02 / 2012Page: 8 / 16
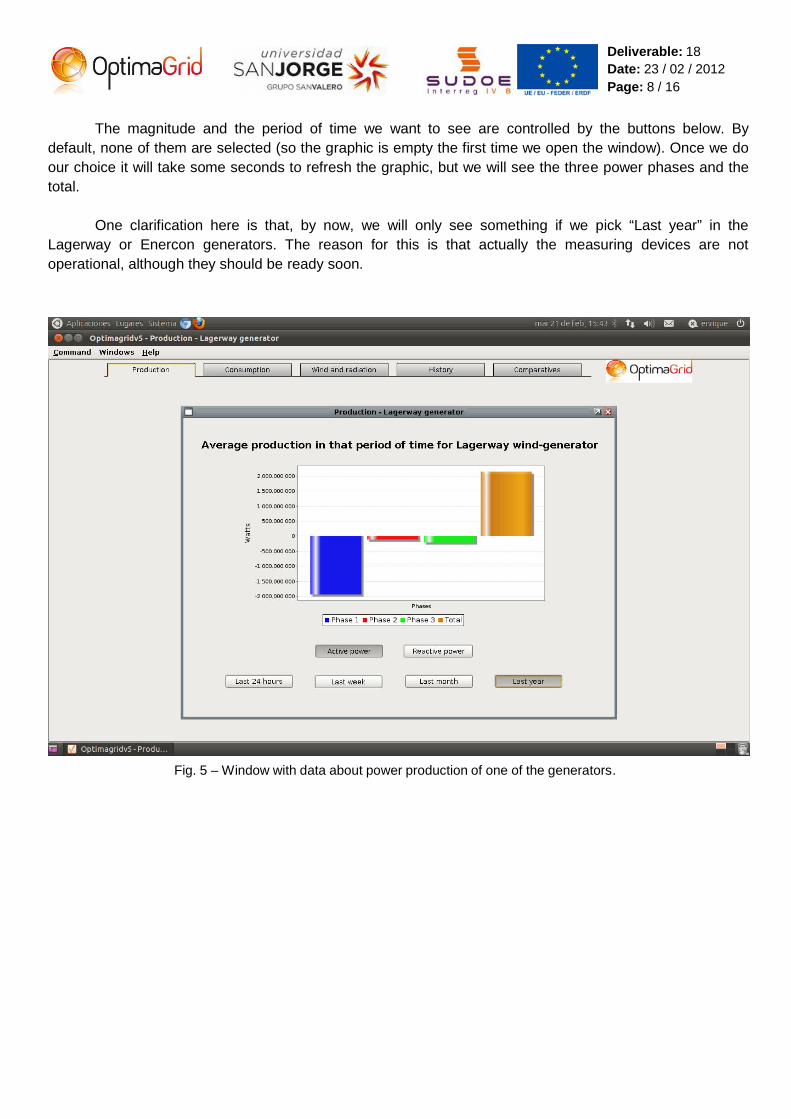
The magnitude and the period of time we want to see are controlled by the buttons below. By default, none of them are selected (so the graphic is empty the first time we open the window). Once we do our choice it will take some seconds to refresh the graphic, but we will see the three power phases and the total.
One clarification here is that, by now, we will only see something if we pick “Last year” in the
Lagerway or Enercon generators. The reason for this is that actually the measuring devices are not operational, although they should be ready soon.
Fig. 5 – Window with data about power production of one of the generators.

Deliverable: 18Date: 23 / 02 / 2012Page: 9 / 16
4 CONSUMPTION SCREEN
Just like “Production” screen, but showing the different buildings monitored by the SCADA. In this
case, they are seven and all of them are in the Walqa technological park. If we click on any of the buttons below their pictures, the SCADA will show another window with a graphic bar representing the average of the selected magnitude in the selected period of time. In this case we can choose between voltage, intensity, active or reactive power and power factor (although probably the most interesting are both active and reactive power).
Fig. 6 – The consumption screen.

Deliverable: 18Date: 23 / 02 / 2012Page: 10 / 16
Here by default it is selected “Voltage” and “Last 24 hours”, although it saves the last selection we do (if we close the window after selecting “Intensity” and “Last week” and open a new one for other building, we will see that magnitude and period of time). In this case we have recent data for almost every building (although there may be some gaps, but in this screen that does not matter). The graphic may take some seconds to reload if we select a long period of time due to the great amount of data.
Fig. 7 – Window with data about power consumption of one of the buildings.
Deliverable: 18Date: 23 / 02 / 2012Page: 11 / 16
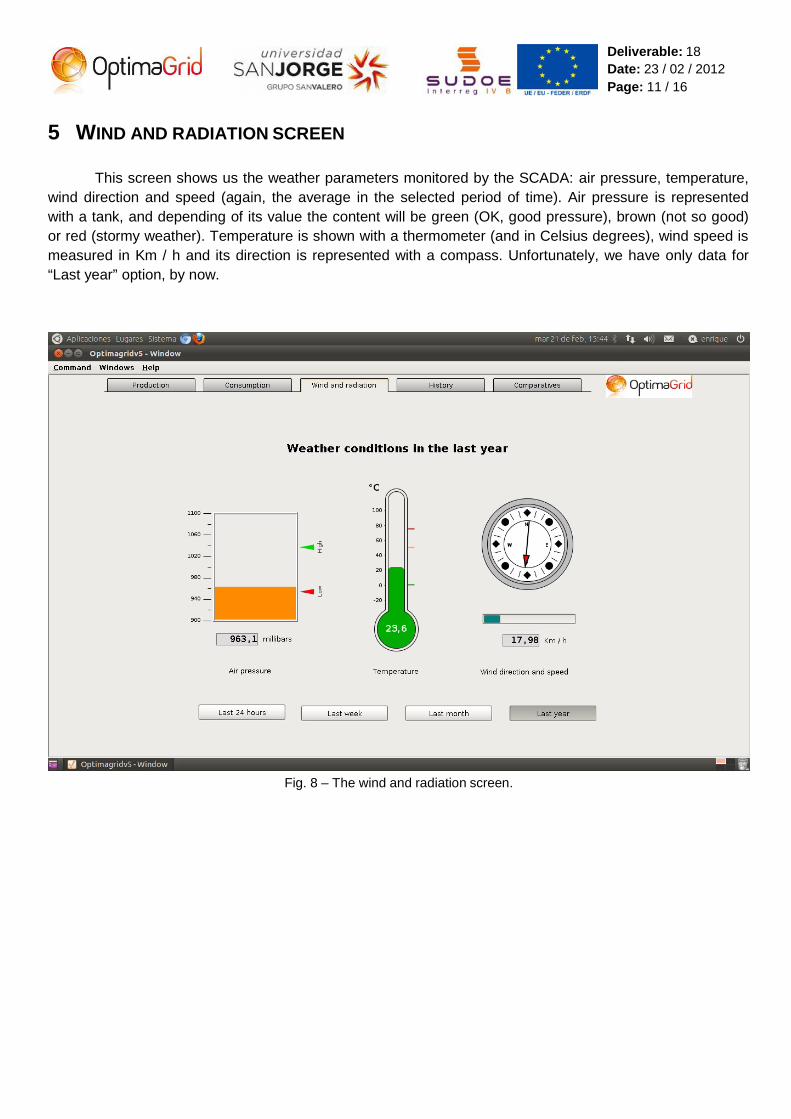
5 WIND AND RADIATION SCREEN
This screen shows us the weather parameters monitored by the SCADA: air pressure, temperature, wind direction and speed (again, the average in the selected period of time). Air pressure is represented with a tank, and depending of its value the content will be green (OK, good pressure), brown (not so good) or red (stormy weather). Temperature is shown with a thermometer (and in Celsius degrees), wind speed is measured in Km / h and its direction is represented with a compass. Unfortunately, we have only data for “Last year” option, by now.
Fig. 8 – The wind and radiation screen.
Deliverable: 18Date: 23 / 02 / 2012Page: 12 / 16
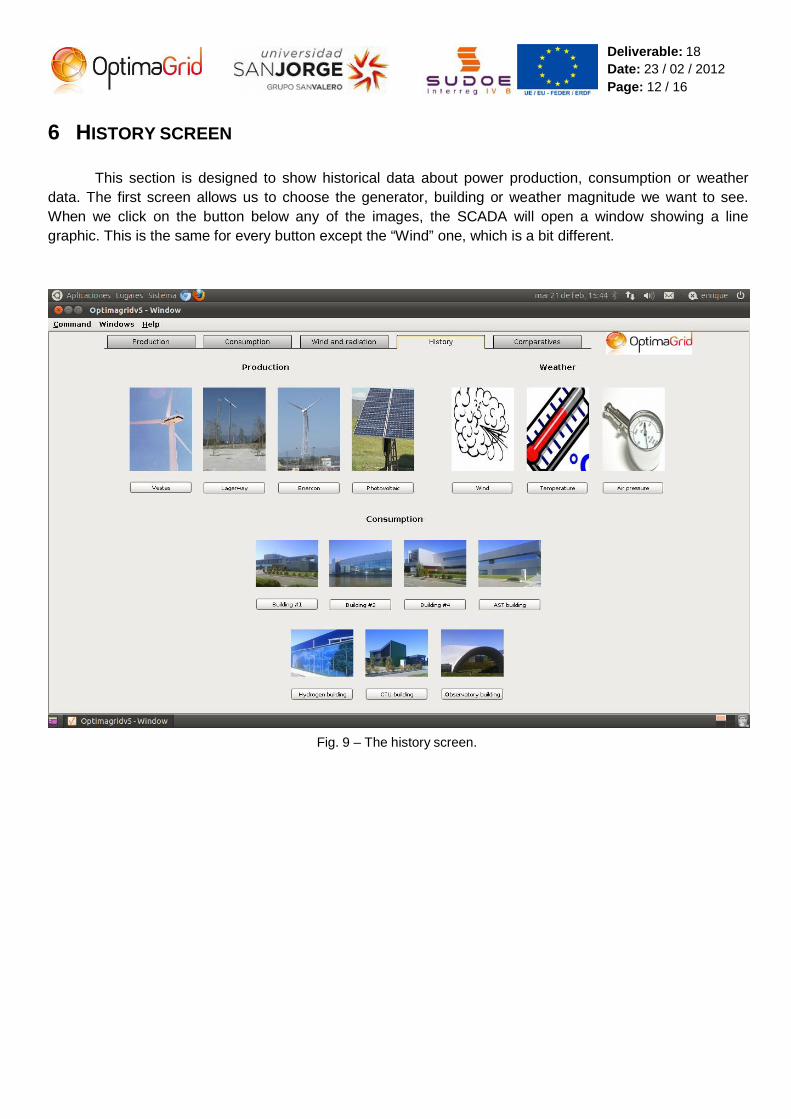
6 HISTORY SCREEN
This section is designed to show historical data about power production, consumption or weather data. The first screen allows us to choose the generator, building or weather magnitude we want to see. When we click on the button below any of the images, the SCADA will open a window showing a line graphic. This is the same for every button except the “Wind” one, which is a bit different.
Fig. 9 – The history screen.

Deliverable: 18Date: 23 / 02 / 2012Page: 13 / 16
The window shows the title (what we are seeing), the graphic with the values and the measure used (generally watts), the represented pens (we can select to show any of them just by clicking in the small square to the left and in the “Apply” button, that will self-enable), some options to the right (increase the size of the graphic, print it or save the represented data to an excel file) and the selected period of time.
We can click on the small magnifiers in the sides of the date to increase or decrease the period of
time we see below. We can also click and drag the square over the red bar to choose the period of time we want to see (in that bar, red means “there are values in this period of time”, while white gaps represent “no data in this date”).
Fig. 10 – Window with history data about power consumption of one of the buildings.

Deliverable: 18Date: 23 / 02 / 2012Page: 14 / 16
All windows are the same except for wind history. Here we will also find a representation of the wind direction using a color scale and a compass. It is usually very hard to draw a graphic for that magnitude (it usually shows a lot of asymptotes), so we have designed this method to do so. It is very easy to see tendencies with this chart. The represented period of time is controlled with a slide below (we have only data corresponding to some months of the last year, so by now it only works the “Months” choice). The time period is independent for the chart and the line graphic.
Fig. 11 – Window with history data about wind speed and direction.

Deliverable: 18Date: 23 / 02 / 2012Page: 15 / 16
7 COMPARATIVES SCREEN
The last screen shows two pie charts where we can see the active / reactive power production or consumption for all the generators and buildings monitored by the SCADA. The magnitude an period of time is selected using the buttons below. The measuring unit is the Kilowatt-hour. The charts may take some time to refresh (specially the right one), and as we said before, by now we have only data from two of the generators in the last year, so that graphic will be blank if we choose a smaller period of time.
Fig. 12 – The comparatives screen.

Deliverable: 18Date: 23 / 02 / 2012Page: 16 / 16
8 REFERENCES
[1] Inductive automation’s webpage at www.inductiveautomation.com.