reclaiming motes from cotton gin waste: practices...
TRANSCRIPT


..
u.s. DEPARTMEIT Of COMMERCE N,tiOnal Technicallnfonnation Senice
PB-287542
Reclaiming Motes from Cotton Gin Waste: Practices, 5upplies,dnd Prices
(U.S.) Economics, Statistics, and Cooperatives Service, Washington,DC
Oct '78

i
!
. .' (\ c' ,', '. ".'.'1.f': " . ." .'- . ~ 'It .'.. c" \"," •. ' ~ t', {\'~" .
"
:
: <
RECLAIMING MQTE~ F~OM ;COrrO~N GIN WASTE:
(i;:., PRACTICES, StiPPlIES, AND· PRICES \' t
~)~J 'l Joseph L. Ghetti
Edward H. Glade, Jr.
; ','
Q '1' j
i o , ~
• t- ~
US. ~rtment ot' Agriculture
II Economics, StatistiCs, and Cooperatives Service ':1
ESCS-38 ,1/'
\\RIPIoouco IY , ~nONAl: TECHNICAL u . INFOIMAtlON saVICE
;.J • U." DEPAIJIIENT OF ~ ......ELD,VA.~
" ' " . "J.0"'·~~·<;I.·3;t~,;J .,,".:~"::~ '.. ,~
IiIf
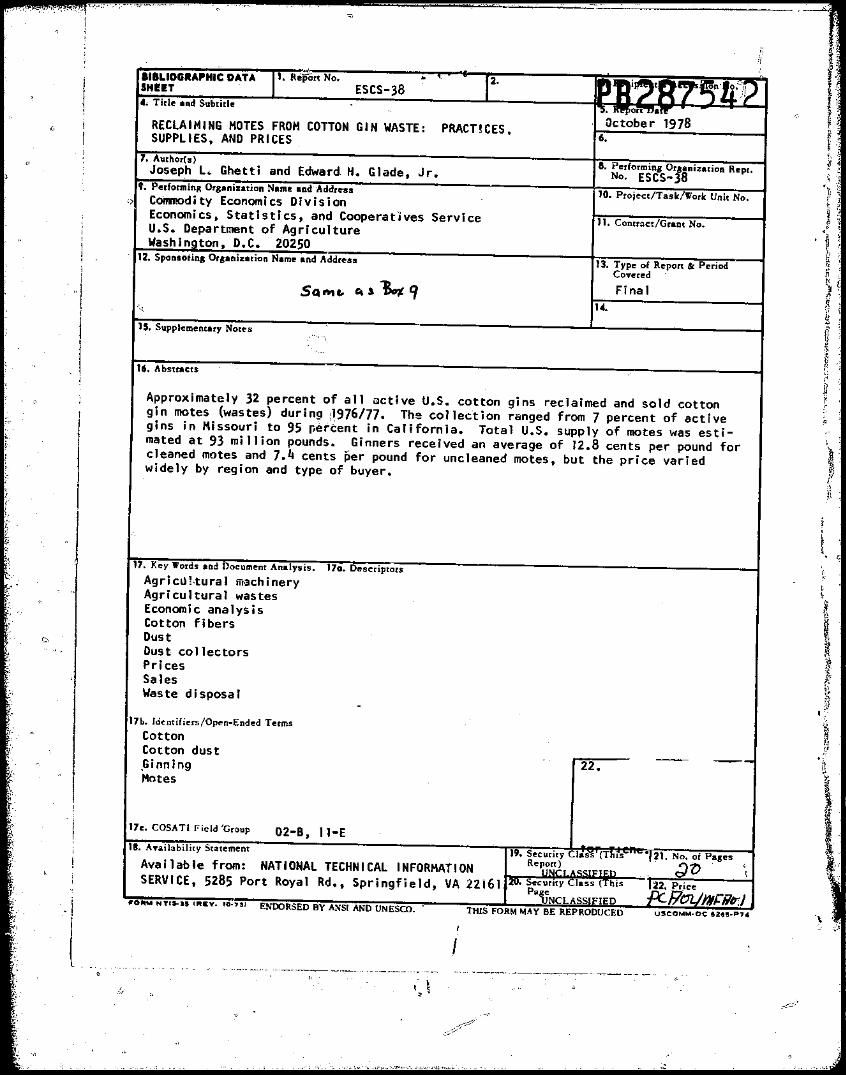
IIBLIOGRAPHIC OATA T' Report No. ..SHEIl'
,.
ESCS-38 [2. IP~i~tR/l)lr}!2 \'
4. Tide and Subtide I~' ~ort"an!""
o RECLAIMING MOTES FROM COTTON GIN WASTE: PRACTlCES. October 1978SUPPLIES, AND PRICES 6.
7. Author(lS)Joseph L. Ghetti and Edward H. Glade, Jr. 8. Performing 01anization Rept.
No. ESCS- 8t. Performinl! Organization Name and Address 10. Project/Task/Work Unit No.\) COmmodity Economics Division
Economics, Statistics, and Cooperatives Service 11. Contract/Grant No.U.S. Department of AgricultureWashington, D.C. 20250
12. Sponsorinl Orlilnization Name and Address 13. Type of Report & PeriodCovered
SQ"..er r.S ~ q Final -:'\' 14.
.,15. Supplementary Notes
16. Abstracts
Approximately 32 percent of all active U.S. cotton gins reclaimed and sold cottongin motes (wastes) durin~ (1976177. The collec:tion ranged from 7 percent of activegins in Missouri to 95 percent in California. Total U.S. supply of motes was esti mated at 93 million pounds. Ginners received an average of 12.8 cents per pound forcleaned motes and 7.4 cents per pound for uncleaned motes, but the price variedwidely by region and type of buyer.
.~
17. Key Words and Document Analysis. 17a. Descriptors i,eAgri cLl~,tu ra I ifi'lichinery
Agricultural wastesEconomic analysisCotton fibersDust
" q,. Dust col lectorsPricesSalesWaste disposal
-17b. Identifiers/Open-Ended Terms
CottonCotton dust . ,. Ginning 22 • -- --Motes
17c. COSATI Field 'Group 02-8, Il-E 18. Availability Statement 19. Security Class (This ·,21. No. of Pages ,Available from: NATIONAL TECHNICAL INFORMATION lte~?~tLASC;IFIEn .,' ~tJ (,SERVICE, 5285 Port Royal Rd., Springfield, VA 22161 [20. Securaty Class (This
Pa/{JNCLASSIFIED .~,P~I ~o_ N T 'Son 1I'lEv. 10·7 31 "
fA 'fJI{'I1~JENOOR::;ED BY ANSI AND UNESCO. THIS FORM.MAY BE REPRODUCED USCOMM·DC U8S'''U
I1 o

, I
nn" .. .... i
.\)
D PREFACE
. This study~as J conducted at the request of the National Cotton
CouncH of Ameri ca. It 'is part of a project to assess the furl economic impact of proposed U.S. cotton dust st.andards on users of raw cotton and cotton processing waste..,and the eval uation of. al ternative //dust control technologies... ,!
\
l\, The authors gratefully a'cknowledge the efforts of personnel in the Cotton Division, AgricultutaJMarketing Service, who aided in planning the survey and in collecting the data. The' assistanceof.8 Jesse Moore, Director of the Cotton Division, Loyd Fr~zier, and Alex Hodgldns (deceased) are especially acknowledged •. We also thank those cotton ginners who participated' in the survey for their cooperation.
CONTENTS
"
SUff.1ARY . • . . • • • . • • ivINTRODUCTION . • • • • • . • . . . . . 1COLLECTION G.R DISPOSAL PRACTICES . • . • • 2
Gins Collecting Motes • · . . . 2Gins Discarding Motes • 2
SUPPLIES OF GIN MOTES . 4Southeast Region . . . . . 4 South Central Region •••..••••. 4Southwest Region • 7Western Region 7
PRICES FOR GIN MOTES · . . . 7 Pric~s Received •. 7price Di fferences " · . . . 9
OUTLOOK •.• 4 9 . it APPENDIX TABLEl> . . '..,'. ./1 11
if , 1\
Washington, D.C. Z0250 October 1978
• ',"t"; ,

II
o {!
If SUMMARY ,\
t-.;;proximate1y ~2 percent of all active cotton gins in the United States collected motes from cotton gin waste during the 1976/77 season. The percent.. age of gins collectfnu\~{,yaried from 7. percent of the activ.e gins in Missourito 95 percept in California.
,:1The total supply of motes during the 1976/77 season was estimated at 93.3 , million pounds. with State totals ranging from 429,000 pounds in Missouri to
31.7 minion pounds in California. I' -, "
Ginners received an average of 12.84· cents per pound for cleaned motes and 7.37 cents per pound for unc1eanedmote~ during the 1976/77 season. Regionalprices for ~leaned'motes ranged from 7.05 cents per pound in the Southwest to 15.43 cents per pound,'1n the South Central Region. Price var"jations were not so great for uncleaned motes, raTlging from 6.17 cents to 8.89 tents in the Southwest and Southeast. respectively.
The 1976/77 average price c!'f·fference between cl eaned and uncl eaned motes was 5.47 cents per pound and varied from 0.88 cent per pound in the Southwest to 8.09 cents per pound in the West. If motes must be clean~d prior to
Jimarketing, and the price is about the same as during the 191~/77 season, the degree of cleaning should not exceed 40 percent of the original weight. Cleaning beyond that level is not economical.
These findings are based on a survey of 1.165 cotton ginners in the CottonBelt, represen~fng about 45 percent of all gins.
/1 I'
i
I I iv
r;
'lI'
. -..-------~---,.,--...,..,----,

,:~".'.t.··.····.!""·.W.·""L"&.:""_____ ---- Z3.__••~.,_(__ ._.~,__U __ ~______~.J_' .. • _____ '~~~b__~____~__ __
/1
RECLAIMING MOTES FROM COTTON GIN WASTE: PRACTICES, SUPPLIES, AND PRICES
JosepH L. Ghetti and Edward H. Glade, Jr. 11
INTRODUCTION
Gin IIIQtes have been reclaimed from cotton'-ginning waste in most parts of tHe Cotton Belt for many yearsh, 2/ Recently, however', tHe importance of gin motes as a raw material for tHe textile waste industry has increased substantially,with a corresponding increase in'the volume of motes coller;ted.
'With moreginn~'rs collecting motes for sale, there is a need to know more about tHe total supply, magn'itude of tHe market, price recei ved, and concentration of supplies. THis study, therefore, provides estimates of:
1. THe number of gins collecting motes, and tHe metHod of collection or tHe means of disposal.
2. Gin mote supplies by district, State, region, and for the Nation. 3. Current prices for gin motes by type of bu~er and fonm in wHicH tHe
motes were purcHased (cleaned or uncleaned).
Traditionally: motes have been used, along with linters and mill waste, in manufacturing cotton batting, padding and upHolstery filling, and some nonwoven fabrics. Because of restrictforls on burning .gin wast~ in many areas, gins are presently incurring waste disposal 'problems and are turning to reclaiming motes as a partial solution. New typ,es of collection systems, requiring li"ttle or no investment or added labor, alm19 witH somewhat better ~rices for motes, Have'encouraged this trend. .
THe demand for gin mote~ has increased recently witH the development of new open-end spi~ning equipmept that can use motes in combination with cotton lint. THerefore, yarn producers'J/are increasingly seeking out motes and the price hasresponded accordingly. .
THe supply of this important raw mat~rial could be restricted, however, 'ifstring~nt standards, proposed by the Occupational Safety and Health Administration, on cotton dust levels are appliej to all processors of co~ton lint and waste. Moreover, a source of revenue for many ginners could lv"J~lIe a liabilitybecause of disposal problems and costs.' \ .. ~)
Data were collected from active .gins in the Cotton Belt by personal inte)~views and mail. Personal interviews with selected gin managers Were Held! in
11 The autHors are an agricultural economist and an economist witH the Fibers and Oils Program Area, Comodity Economics Division, ESCS, stationed at Stonevi lle, mssissippi, and Washington, D.C., respectively.
Y The terms "gin motes" and "motes" refer to any cotton waste from tHe cotton-ginning process. Most motes, however, result from tHe lint-cleaningpr,ocess.
,~,: ""~_~~.'UI!il__'R.....;a_Iii1_.___________ ~,__.." " <-"."'''__'-_.___~_,.''''______..________~ ,
'. H ",
f
I I.) ;~,
i i or~~r to become familiar with the operating methods and collection practice~
us~d. Field representatives of USDA's Cptton Division, Agricultural Marketlng Ser~ice, obtained additional data by person~l, int~rvi~wswith 12 perceot of" all gins. A questionna're ,was then mailed to all other active cotton gins. A total of 1,165 questionnaires werereturnecl~ .those gins represent nearly 45 percent of all active gins in theUnited,States. and had processed 4.5 million
'bales of cotton, or nearly 44 pei:cent of'the 1976/77 crop. U.S. Cens....s Bureau reports of 1976/77 cotton ginningswere used to expand sample data,\to obtain estimates of U.S. totals. ,. '.) .,'
o
COLLECTION OR DISPOSAL PRACTICES
Th, decision to reclaim gin motes for s~Je involve~: many considerati.ons. T~,emosit cri~,ical, however, is the presence of a. stable market outJet that pays pricesl~bove the costs of collection or disposal. An adequate ginning volume is also required in .order to collect sufficient quantities of mot~s.
Gins Collecting Motes
Approximately 32 percent of all active gins in thel.lnited States cop:ected motes during the 1976/V7 season (table l}.The percentage of gins collecting motes varied widely across the Cotton Belt, ranging from 7 percent of the gins in Missouri to 95 percent of the Californi"a gins. The highest proportion of gins collecting motes (74 percent) was in the West, where the quality of motes is good, prices are high, and strict disposal regulations exist. In the Southeast and Southwest, 30 percent of all gins collected motes, and in the South Central region, only 21 percent collected motes. The latter three regions are characterized by a predominance of small gins with low average voll.llles. Comparable data for farm management districts within each State are shown in appendi x tab 1 e 1. ' .
Most gin motes were sold in baled form and only 16 percent were sold loose. ,
But sli,ghtly over one-half of all baled motes sold were first cleaned at the '
g,in either to obtain higher prices or to create a marketable product. SeventyNve percent of sales went to cleaning plants, linters dealers,~ and waste dealers. Y Sc:tles to other types of buyers accounted for the remaining 25 percent.
/)
I Gins Discarding Motes
Si xty-ei ght percent .of all gi nnersdi sca rded thei r motes ,( tab 1 e 2). A 1though burning had been the usual way of disposing of gin waste, only the South Central region reported any appreciable amount of motes being burned. Approximately 16 percent of the ginners disposed of motes by giving them ~way, returning them to the land as a~oil conditioner, and feeding them to livestock. The primary reasons for not collecting motes were lack of market, inconvenience,
'... 0
]V Mote-cleaning plants are firms that vuy loose or baled motes and clean them for resale. i
2
~, . ,","~-~..... ~.. ~~':":".',----.- .....-,~~ ~"~i,"
"
o

cP (,~r
'I
,~$li"'t~;!lIl<~"'" '.' II.. ' ······~~~m~, .' .........:............ . /"f, ~~~~~~----.--., . . .
.,."J
~~~--=--.~. "~...-~~-=..>•••-.~.~'~~~~~="lb;..-:=:=..:,.~..:<'=""..::r~~~~~

:
,;;:.
:} : r.'
'-""""---.........-----.-···-----~--.._....____...A!.lI., 1II\'
j,' 10~ pr1ces, and lack of collecting ari'U\ baling equipment. Comparable data on f disposal practices in fann management (Jistricts in each State are shown in ap
pendix table 2.
SUPPLIES OF GIN MOT~S
The total U.S. supply of motes during the 1976/77 season was estimated at 93.3 million pou~ds. Gin motes were collected from 54 percent of all bales ginned, with an ~verage of about 16 pounds of mates collected from each bale. The volume of RlrI'tes collected from a bale of cottond.~pends upon the nWllber of lint cleaners used in the 'gin and whether motes are cOliected from all c1eane'rs, the type and amount of overhead cleaning machinery used, at;)~ the degree of cleaning that motes receive at the gin.
In estimating total U.S. supplies, the proportion of the bales from,,~Jlich motes were collected was detenmined from sample data from each district. ~ These percentages were then applied to total ginnings in each district as reported by the U.S. Bureau of the Census to obtain the estimated total nwnber of bales in each district from which motes could be collected. Total supp1i~$ were then ,obtained by multiplying the average pounds of motes collected per b~lle (from sample gins) times the total number of bales for the district. District totals ,were then combined into State, regional, and national estimates. District totp1s were 'developed as they are most usefMl to dealers and prOcessors for 10caling specific mot~ supplies. The estimated supplies of gin motes bydistrict are shown in appendix table 3.
I I
Southeast Region
Motes collected in the Southeas t accounted for about 9 percent (about 8 mill ion pounds) of the U.S. supply during 1976/77 (table 3). Motes were collected from near1.f39 percent of all bales processed by sample gins. Alabama was the largest supplier of motes in the region because of its relatively larger cotton production and a higher proportion of gins collecting motes; approximately 60 percent of the total regional supply came from Alabama. The Southeast had the highest average volume of motes collected per balEf":\,-between 9 and 15 pounds higher than the figures for other regions. The difference is explained by the low level of cleaning that motes received in the Southeast. "
South Central Region
Over 16 percent of the total U.S. mote supply came from tht:':S.o~th Central region, about 15 million pounds. Mississippi and Arkansas accounted for 47 and 22 percent, respectively, of totCi~J regional supplies. Motes were c()llec~ed from 27 percent of an bales ginned, and an average bale yield,~d 20 pounds of motes." Compared with other regions, thEtSoLlth Central had the loWest propcH-ti,?n of gins
rj
M The tenns IIsa,!!p1e d~ta," "samp1e gins," alld ':samp1ebales" refer to the 1,T65 gins from WhlCh data were obtained. AppendlX table 5 lists States and major districts contained therein. ~ ,
4
,o---~~-,Jr-,
" '\.
i ~
" ~ F 1
~
J ~ "
f I., iI 1 F:::::::' I
I } u

C"·.Mf"/::;...... ''''''''''-'''7 j ',." "'"~ . II
G ~ ~ o
".r'~~~~'~~~~~~~J!."'_--;' '~~-{,:>,~.".-;.; .~l!C'.l;..". [,r'
-~~.";I.:(.';:;;C~ , • ., '"- A,:.. '--·~""'4..~",;/' ~, ... ~, <i
j)
Table 2--Proportion of gins discarding motes, method of disposal, and reason for discarding, 1976/77 ':::2
State and : Gins Method of disposal Reason for discarding region !! :discard-:B d: Left on:B i d:Oth :Lack of:Customer : Incon- :No lint:Ulne ur e er
in2 :Dremises: :market :relations:venience:cleaner: Other 1/
Percent
Alabama 56 5 22 24 49 19 ~ 68 13Florida 100 100 100
'!. Georgia 79 7 6 10 77 25 3 65 7North ~arolina 77 14 48 38 35 48 4 13South Carolina 77 9 14 46 31 41 38 21Southeast 70 6 15 31 48 30 56 14
Arkansas 87 42 5 10 43 22 5 50 23Loui~!a:na 85 29 24 7 40 24 -,~-- 52 24Mississippi 75 37 9 9 45 14 3 61 2 20Missouri 93 16 9 23 52 26 2 44 28Tennessee 58 32 3 16CJ'1 49 16 5 49 3 27South Central 79 35 9 11 45 20 3 53 1 23
r{F Oklahoma 60 3 6J 91 59 19 9 13 ~ Texas 71 6 4 4 86 52 2 32 2 12Southwest 70 5 3 4 88 52 2 31 3 12
Arizona 41 11 5 5 79 36 11 21 32California 5 33 67 67 33New Mexico 48 100 67 6 27West 26 5 5 4 86 46 4 21 10 19
United States: 68 19 8 12 61 33 2 45 2 18 ~ ~ ~ 1/ For more detailed data by State districts, see appendix table 2.
2/ Includes, in order of rank, ginning volume too low, lack of equipment, jand lack of labor. ~-- = o.
i~ I
" "
~ ~iI'4" #44!W4"_ , • ~.>. _. ,. n
1J "'~"~
."::t:.",.'l·~";!,",f.!,l.~_...~~~';.<4~.z->ll,~.'1iI,.o:.::H.",,,,,,,~·,,'.>r;lL......,..,,~~·~-~\.C»-<:&Wa'r,,]f.ttoi ,,-&.. _ .!li-l)" ,•.." ""It..",.,rl'hl'~"'t <,._ -,. ,., ~.-: VL"'.."t.....:,'- _~ 'r.
I !,
.,?
~ __".--'-_~~,",., _____ l~.~ ,~~~.•~,~-~~~~,~-~>
Table 3--~upply of cotton gin motes, 1976/77 I
J/~ Sam:ele dataEstimatedState and r.egion !/ mote Bales Bales from which motes Motes Total volume
supply ~/ ginned were collected per bale of motes
1 008 <- 1,000pdun s lEl~~~ Percent 1,000 bales Pounds .:e,ounds
Alabama 4,932 167.5 50.8 85.0 29.0 2,465Georgia 953 68.2 24.1 16.5 20.1 345 North Carolina 1,105 .39.1 41.6 16.2 37.3 605 South Carolina 1,108 86.7 25.1 21.8 30.4 663
Southeast 1/ 8,098 361.;5 38.6 139.4 29.2 4,078
Arkansas 3,291 383.4 19.9 76.3 21.3 1,622 !Louisiana 1,913 229.1 33.9 77.6 10.4 809 Mississippi 7,219 469.9 27.4 128.7 23.4 .3,016 I Miasouri 429 74.5 6.4 4.7 41.6 198 !
0\ Tenne~see 2,374 115.2 --Slo8 59.7 20.8 1,239 South Central 15,226 1,272.0 27.3 347.0 19.8 6,885
-.. /\ ,
I, Oklahoma 1,906 118·4> ' 60.5 71.7
~
18.2 1,302 ! Texas 24,786 1,443.0 46.4 668.9 16.1 10,779
Southwest 26,692 !.7.41_~56l:. " 740.6 16.3 12,081
Arizona 10,494 396.6\J' 81.6 324.0 15.0 4,858 California 31,691 863.4 98.4 849.2 13.2 11 ,236 New Mexico 1~122 59.3 63.0 37.3 24.9 930
West 43,307 1,319.3 91.8 1,210.5 14.1 17,024
United States 93,323 4,514.3 54.0 2,436.7 16.4 40,070
!/ For more detailed data by State districts, see appendix table 3. !/ Based on sample gin data from proportion of bales from which motes were collected, and average pounds collected per bale. Data from sample gins were expanded by applying total ginnings reported by the U.S. Bureau of the Census. 1/ No data for Florida as all gins reported disposing of motes •
-~.... .~.:r........~~~~""""'-' -. '---~."",,-,-.,,~, :::::;"'::: :...,~-

collecting motes. Because of that and the fact that the region produces over one-fourth of the U.S. cotton crop, a much larger volume of motes than presently collected could be supplied from this region.
Southwest Region
About 27 million pounds of motes were collected in the Southwest during 1976/77, about 30 percent of the total U.S. figure. Motes from the western district of Texas accounted for about 22.5 million pounds, or 84 percent of the regional total. Southwest gins collected motes from nearly one-half of all bales processed during the season. Because about 52 percent of all motes were cleaned before selling, the average bale yielded only about 16 pounds of motes.
Western Regi on
While about one-third of total cotton production comes from the West, over 46 percent of all gin motes (about 43 million pounds) originated there during 1~76/?7. Over 73 percent of the region's total came from California. Sampledglns 1n the West collected motes from nearly 92 percent of all bales ginned. Because nearly 68 percent of all motes collected were cleaned, only 14.1 poundsof motes were collected per bale, the lowest such figure of all regions.
( , PRICES FOR GIN MOTES L,
The price ,of motes varied by location, type of sales outlet, and the form in which the motes were sold. In some cases, motes are collected for sale only to facilitate disposal problems with revenue received only sUfficient to cover alternative disposal costs. In other situations, however, the sale of motes may represent an important added source of income for the cotton ginner.
Pri ces Recei ved
Cleaned motes brought ginners an average of 12.84 cents per pound in 1976/77(table 4); uncleaned motes averaged 7.37 cents per pound. Regional prices for cleaned motes varied from 7.05 cents per pound in the Southwest to 15.43 cents in the South Central region. The higher prices received for motes in the South Central and Western regions probably reflect the better fiber length and strengthof cotton grown in these areas.
Prices by State for uncleaned motes fluctuated much more widely than did those for cleaned motes. Average pri ces for unc1ea,ned motes ranged from 2.36 cents per pound in Oklahoma to 14.33 cents in Louisiana. The lower prices found in the Southwest for both cleaned and uncleaned motes is largely due to the use of cotton strippers, which leaves larger quantities of trash among the motes il
r'"
f
than do other cotton-harvesting methods. H 1)I'
HTable 4 also shows the variations in prices received by the type of outlet to which the motes were sold. In general, the quality of motes usually purchased by a particular dealer or outlet is the primary reason for the price variations among outlets. For example, linters dealers frequently buy motes to fill
!I,k ~ .special orders and normally buy better quality motes and pay sligntly mgher Iiprices to obtain the lots desired. On the other hand, cleaning plants generally
pay lower prices because the additional expense of further cleaning rnust be ij Ii
7 n H "
!4H I"
;;::-c;:
..".,""....~!--'''''-..---..........I_....."-" ,...'''._<..''''"''''''''., ..,,,_~ ,.................,"",.-'-....-.~.""..""',.........."""."'"-,,.;..""-_.....<iI>.;.... - .....""_"'._,-_"'''''''_.......''" _.,........~...._..,................_~ "'~~'~:,""'.L ... ~."
'_>..a."".....-~......<,..~~ ....u........ "',
CIO
i .1
I
~,..,.:;~
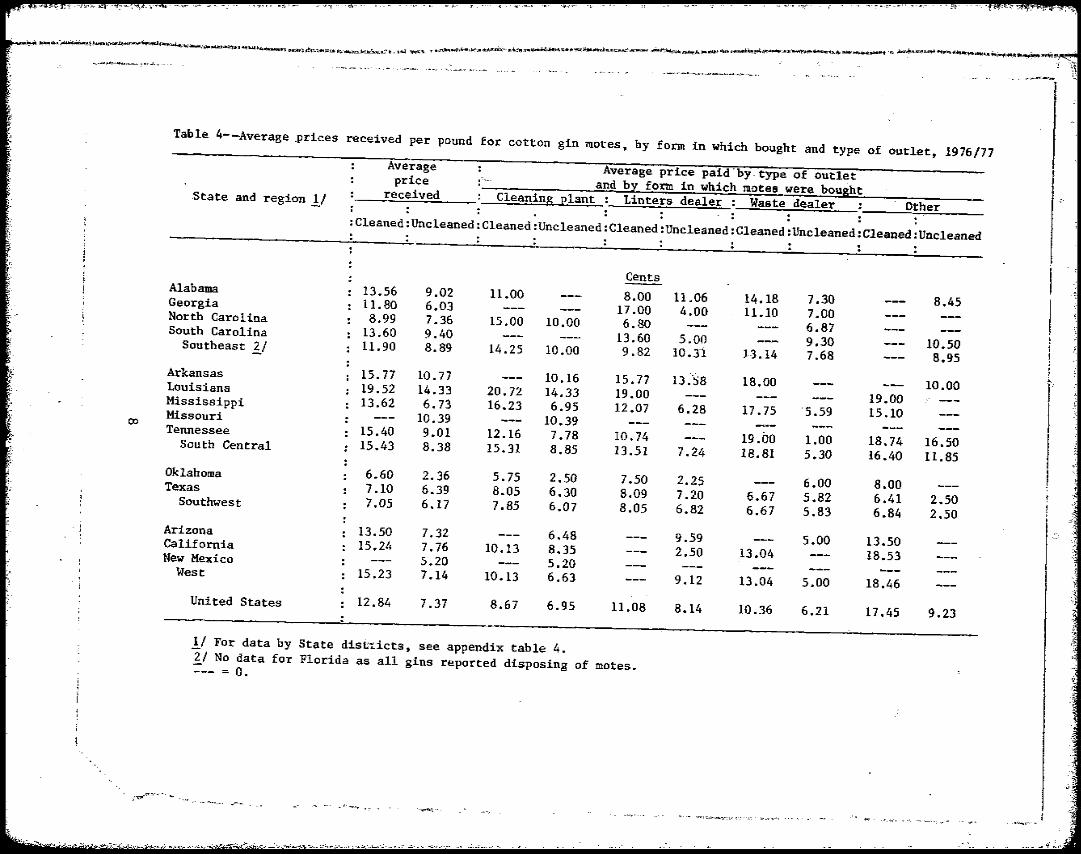
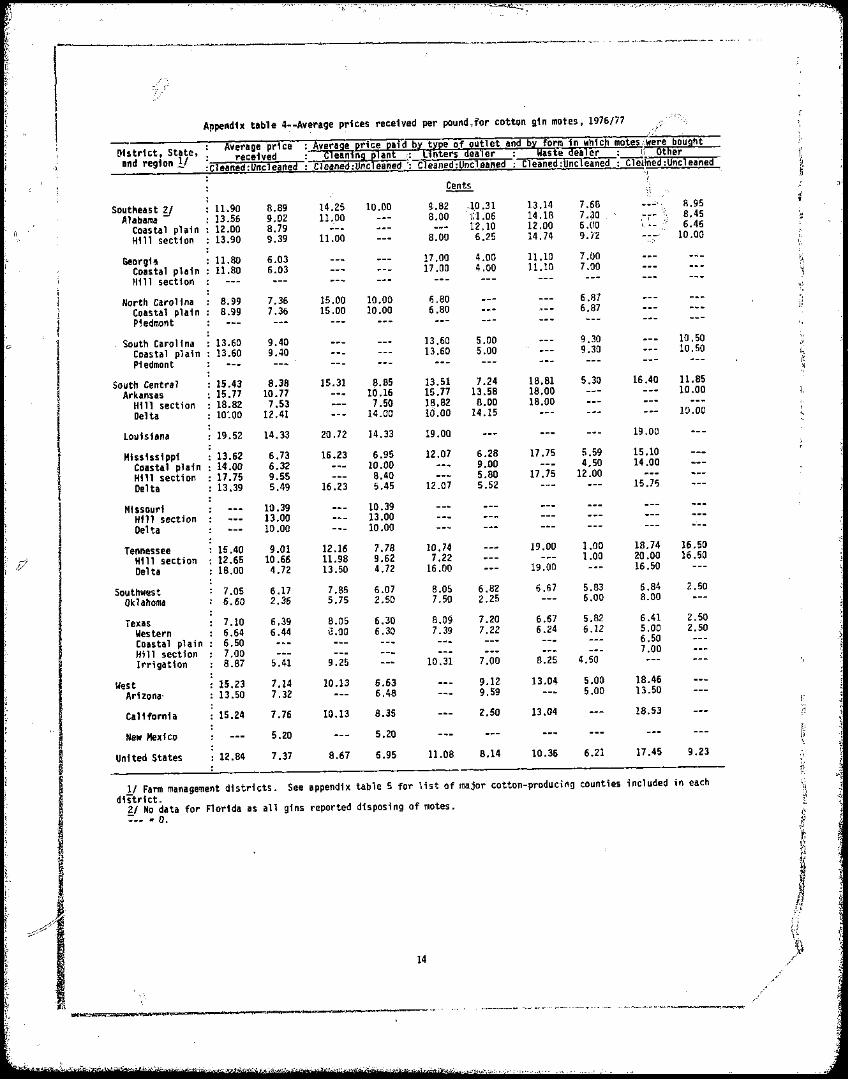
Table 4--Average .prices received per pound for cotton gin motes, by form in which bought and type of outlet, 1976/77
Average Average price pai'd-"'6y- type of outletprice
f-"- and by form in which motes , ..;;;w.;:;e.;;;r-=e-:-b;:;.o;:;.u::lga;ho;.t~_-"..~~____receivedState and region 1/ Cleaning plant Linters dealer: Waste dealer Other
:Cleaned:Uncleaned:Cleaned:Uncleaned:Cleaned:Uncleaned:Cleaned:Uncleaned:Cleaned:Uncleaned
Cents Alabama I13.56 9.02 11.00 8.00 11.06 14.18 7.30Georgia 11.80 6.03 8.45
17.00 4.00 11.10 7.00North Carolina 8.99 7.36 15.00 10.00 6.80 6.87
ISouth Carolina 13.60 9.40 13.60 5.00Southeast '!:../ 11.90 8.89 14.25 9.30 10.5010.00 9.82 10.3'1 J) .14 7.68 8.95 Arkansas 15.77 10.77 10.16 15.77 13 ."S8 18.00Louisiana 19.52 10.0014.33 20.72 14.33 19.00 I'Mississippi 13.62 19.006.73 16.23 6.95 12.07 6.28 17.75 '5.59Missouri 15.1010.39 10.39Tennessee 15.40 9.01 12.16 7.78 10.74 19.00 1.00 18.74 16.50South Central 15.43 8.38 15.31 8.85 13.51 7.24 18.81 5.30 16.40 11.85 Oklahoma 6.60 2.36 5.75 2.50 7.50 2.25 6.00 8.00Texas 7.10 6.39 8.05 6.30 8.09 7.20 6.6.7 5.82 6.41 2.50Southwest 7.05 6.17 7.85 6.07 8.05 6.82 6.67 5.83 6.84 2.50 Arizona 13.50 7.32 6.48 9.59 (j
California 15.24 7.76 10.13 8.35 5.00 13.50
2.50 .13.04New Mexico 18.535.20 5.20West 15.23 7.14 10.13 6.63 9.12 13.04 5.00 18.46
United States 12.84 7.37 8.67 6.95 11.08 8.14 10.36 6.21 17.45 9.23
!/ For data by State disU:O:icts, see appendix table 4. '!:../ No data for Florida as all gins reported disposing of motes. --- = o.
o-,;,1<'~l:"'·~·o",," •• ,>-_~~ .. "''-''''', ,. ~.~ _ ~'" ... ""'tW£,;>,
'.~-::.~.
~'<"""~="'~""::''f/:::''".,<~ '","_"J'.,."" ,"" ,' .. "'"',

covered. Mark~t outlets classi fied as "other" (pr;~mari ly padding, upholstery, and yarn manufacturers) paid the highest ,N~ices <for mote$ during 1976/77, reflecting their purchases of high-quality iOOtes for use :Hl products of higherend-use value. Int:ormation on mote prices received and market outlets for eachState district is given in appendix ta~le 4.
Price Differences
The difference in the average price of cleaned versuscCuncleaned motes was 5.47 cents per pound (12.84 vs. 7.37), and varied from 0.88 cent per pound in the Southwest to 8.09 cents per pound in the West (table 4).
The average cost per pound for cleaning a 480-pound bale of motes in 1976/77 was estimated at approximately 2.25 cents. 5/ Therefore, cleaning motes priorto marketing probably would not be justified in the Southeast and Southwest if uncleaned motes could be marketed. In contr;:~.t, price spreads favor cleaning Western and South Central motes prior to marketing.
However, while the present price differentials do not seem great enough to be profitable in all areas, some ginners must clean their motes to have a marketable product. Table 5 shows differences in income received per bale from alternative weight losses due to cleaning motes. Although the price differences for cleaned and uncleaned motes are significant for the United States as a whole, they were not great enough to offset all weight losses due to cleaning. For example, using the U.S. average price of 12.84 and 7.37 cents per pound for cleaned and uncleaned motes, lower return~ occurred with weight losses exceeding 40 percent due to cleaning (table 5). After cleaning, bale values increase substantially, but only up to 40 percent weight loss. ~eductions beyond this point res'ult in significant decreases in bale value.
OUTLOOK
The outlook for supplies, prices, and utilization of cotton gin motes depends on a number of important factors. Potential supplies will necessarily be tied to the level of cotton production, but actual pounds reclaimed will be related to the demand for motes by processsors at acceptable prices.
Current and future air pollution regulations will increase the extent and cost in gin waste disposal. Growing restrictions on burning gin waste will cause an increasing number of gins to incur hauling and disposal problems. Thus, there will be an added incentive to sell as much gin waste as possible, even if the sales revenues cover only the costs of collection and hauling. Ginners who currently do not collect motes may, therefore, find it profitable to do so in the near future. Collecting gin motes could be restricted, however, if the proposed strict standards on cotton dust levels are applied to procesors and users of cotton waste.
~ Upq~~ed from Shelby H. Holder, Jr. and Zoton M. Looney, Reclaiming and Marketing (;\:ii;ton Gin Motes, U.S. Dept. Agr., Econ. Res. Serv., ERS-168, May 1964.
9
()
I
I
J I [ I I J i !
i ! I
~

(; i-' •• l' 'O\!!Is::IitI; __• __'-________________""~'.;;,,,,"
----~------------------~
Table 5--Estimated price of baled cotton gin motes before and after cleaning, using 1976/77 average price and specified weight losses due to cleaning
Net Price bale weisht !L. Before cleaninsWeight After cleanil!.S.
:loss Before After Per .Per Per Per Differencecleaning ~ cleaning ~ pound ~/ bale pound 3/ bale
Pe~ -- Pounds Cents Dollars Cents -- Doll~rs
10 480 432 7.37 35.38 12.84 55.47 + 20.09
20 480 384 7.37 35.38 12.84 49.31 ,+ 13.93
.... 30 480 336 7.37 35.38 12.84 43.14 +- 7.760
40 480 288 7.37 35.38 12.84 36.98 1.60+
50 480 240 7.37 35.38 12.84 30.82 4.56-60 480 192 7037 35.38 12.84 24.65 10.73-
1/ After deducting bagging and ties. ~/ Average price based on 109 lot~ totaling 12,624,154 pounds.11 Average price based on 138 lots totaling 15,947,704 pounds. ~"
\';.
'-,
,~j(r;P~ "'f;~t>q-,...r!;7"'·""~~·!j.,"t~.rJ.,:::" -_.,,:xc-. .t<."t!;'"r ~~l'~1'l<l ';,;' ..'''' ,~:->=~•..".-; .'~"'I:~ '" ':- '
~ .,,1'~~....."t'
--tid'0===
l'":/1,'/'
# f
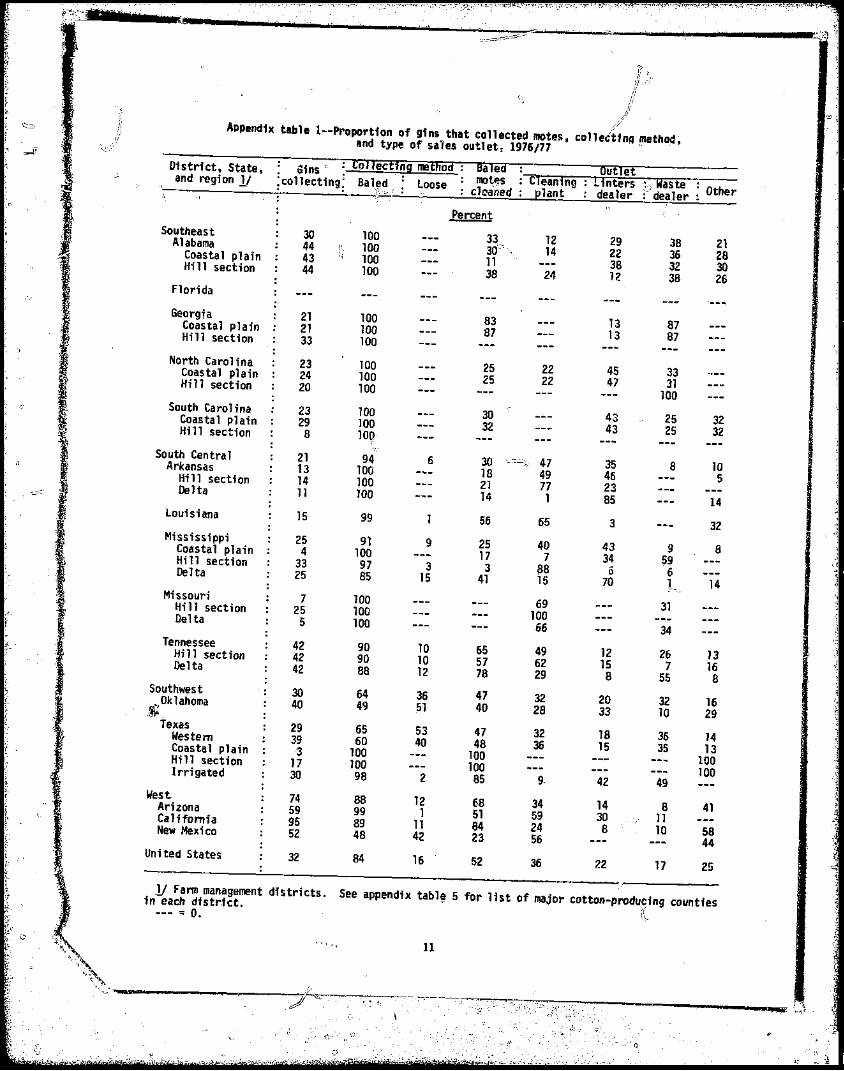
.f:/Appendb table I--Proportfon of gfns that collected motes, co11ectfnA method. lind type of sales outlet. 1976/77 '
~
J.~ ~
District. state. ~fns c : Collecting method: Ba led Outlet and region y • b • , • . • mot@s Cleaning Linters ::" Waste
;collecting; Bal~t, ;~oose ; clea~ed plant dealer:-' dea.1er Other~--------~--~------~----~~----~--~~~~~-L_~~~~~~~~~=~~___ Percent
Southeast 30 100Alabama 12 29 38 2144 p, 100 14 22Coastal plain 43 'i 100 36 28 Hi 11 sect ion 38 32 3044 100 24 12 38 26
Florida
Georgfa 21 100 83Coastal plain 13 8721 100 87Hill section 13 8733 100
North Carolina 23 100 25 22Coastal plain 45 3324 100 25 22 47Hi 11 section 3120 100 100 South Carol ina 23 100 30Coastal plain 29 32
43 25 32100Hill section 43 25 328 ]00
\'
South Central \'_.
21 94 6 30 .'c::=;,> 47Arkansas 35 813 100 1018 49Hill section 46 514 100 21 77 23Delta 11 100 14 1 85 14
louisiana 15 99 56 65 3 32 Mississippi 91 9 25 40Coastal plain
25 4 43 9 8100
Hi 11 section 33 97 17 7 34 .593 3 88 6Delta 625 85 15 41 15 70 14
Missouri 7 ]00 L" 69Hill section 3125 100 100Delta 5 100 66 34
Tennessee 42 90 10 65Hill section 42 49 ]2 26 1390 10 57 62Delta 15 7 1642 88 12 78 29 8 55 8 Southwest 30 64 36 47 32 20• Oklahoma 32 1640 49 ~l 40 28 33l~, 10 29
Texas 29 65 53 47 32 ]8Western 36 1439 60 40Coastal plain 48 36 15 35 133 100 100Hill section 10017 ]00 100Irrigated 10030 98 2 85 9. 42 49 West. 74 88 12 68 34 14Arizona 8 4159 99 1 51 59 30California 1195 89 11 84 24 .8 10New Mexico 5852 48 42 23 56 44 United States 32 84 16 52 36 22 17 25
11 Farm management districts. See appendix tabl~ 5 for list of major cotton~producing countiesin each distr.ict. if --- = o.
• <'.-<"\ 11
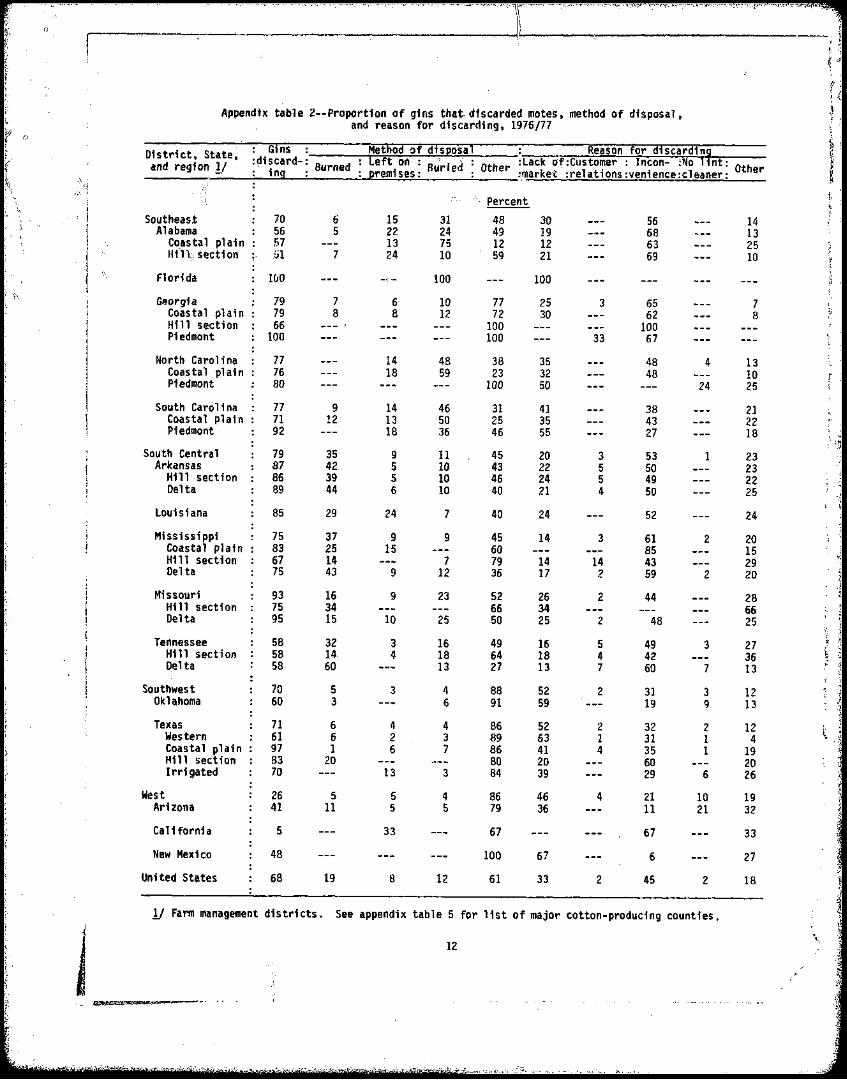
3 Appendix table 2--Proportfon of gins that, discarded motes, method of disposal, and reason for discarding, 1976/77 f'
~ C)
: Gins Method ~f dis~osa1 : Reason for ill scardi ng ~. District, State~ \,)
:~1scard- Left on: 'i d r :Lack df:Customer : Incon- ~No 1int: ~ and region y Burned Other ,\ . ing premises: Bur e Othe ~.market :re1 ati ons :venience :c1 eaner: " ~
(i'''1 f/- J
'.\ Percent 4;, ! Ii
cSoutheas,t 7D 6 15 31 48 30 56 14Alabama 56 5 22 24 49 19 68 13I CC?astal plain 57 13 75 12 12 63 25
I Hill;. secti on ;< !:il 7 24 10 59 21 69 10 ,
t \\..
1
_I},:-Florida IuD 100 100 ;1 \) Georgia 79 7 6 10 77 25 3 65 7 \
Coas ta1 .pl a in 79 8 8 12 72 30 62 8 Y Hill section 66 100 100 Piedmont 100 100 33 67
North Carolina 77 14 48 38 35 48 4 13 Coastal plain 76 18 59 23 32 48 10Piedmont 80 100 50 24 25
South Carolina 77 9 14 46 31 41 38 21Coastal plain 71 12 13 50 25 35 43 22Piedmont 92 18 36 46 55 27 18
South Central 79 35 9 11 45 20 3 53 1 23Arkansas 87 42 5 10 43 22 5 50 23
Hi 11 section 86 39 5 10 46 24 5 49 22Delta 89 44 £; 10 40 21 4 50 25
Louisiana 85 29 24 7 40 24 52 24
Mississippi 75 37 9 9 45 14 3 61 2 20Coastal plain 83 25 15 60 85 15H111 section 67 14 7 79 14 14 43 29Delta 75 43 9 12 36 17 2 59 2 20
Missouri 93 16 9 23 52 26 2 44 28H111 section 75 34 66 34 66Delta 95 15 10 25 50 25 2 48 25
~'o
Tennessee 58 32 3 16 49 16 5 49 3 27 ,.. ~ H111 sect; on 58 14 4 18 64 18 4 42 36 ~
rDelta 58 60 13 27 13 7 60 7 13
Southwest 70 5 3 4 88 52 2 31 3 12Oklahoma 60 3 6 91 59 19 9 13
Texas 71 6 4 4 86 52 2 32 2 12Western 61 6 2 3 89 63 1 31 1 4 \ Coastal plain 97 1 6 7 86 41 4 35 1 19Hill section 83 20 80 20 60 20Irrigated 70 13 3 84 39 29 6 26
West 26 5 5 4 86 46 4 21 10 19 Arizona 41 11 5 5 79 36 11 21 32
California 5 33 67 67 33
New Mexico 48 100 67 6 27
United Stiltes 68 19 8 12 61 33 2 45 2 18
Y Farm management districts. See appendix table 5 for list of major cotton-producing counties. i~
12 'e.
J , "
' ,.'~~'"

'r~
i • l
;r 5
0~'
~., ;'':
,,,.;.
".il; ," - tT
Appendfx table 3--Supply of cotton gin motes, 1976/77 Distrfct, State, JIIO£e sUI!l!'l ";..". Di£. from s~ml!le ginsand regfon y All Sample ~-:~7 Bales : Bales from whfch motes : Motesgfns Y gins CJinned were collected : per bale
n.
- - - - - Pounds - - - - - - - - Humber -, - • Percent ~Sout;'east 3/ 8,098,125 4,078,459 361,524 139,493 38.6 29.2Alabama - 4,931,822 2,465,0150 16~',494 85,012 " ,50.8 29.0Coastal plain " . 1,264,532 752,650 37,128 22,499,('Hf11 sectf on 0 3,667',290 1,712,365 61.0 33.4130,366 62,513 48.0 21.4'. <;-:~~
Georgia 953,013 345,370 68,213 16,459 24.1Coastal plafn 21.0942.933 335,470 62,976 15,701 24.9 21.4H111 secti on 10.080 9,900 'l,MlPiedmont " 758 49.2 13.13.696
North Carolina 1,104.960 605,375 39,074 16,241Coastal plaf,n 1,056,291 580,175' 30,222 15,427 41.6 37.3
Ptedmont 48,663 25,200 42.6 37.6
2,852 814 28.5 31.0South Carolina 1,108,330 662,699 86,743 21,781 25.1 30.4Coastal plain 1,082,003 626,699 78,181 20,013 25.7- 0 31.2,Piedmont 26,327 36 ,000 8,562 1,708 19.9 21.1
South Centri,ll 15,225,654 6,885,285 1,272,088 346,988 27.3Arkansas 3.291,388 1,621,690 383,395' 19.8
H111 section ~_~~ ,262 19.9 21.31,831,610 807,870 157,502 '44,9P 28.5Delta 1,459,778 813,820 225,893 18.0
31,345 13.9 26.0louiSiana 1,913,103 808,820 229,076
<.:J77 ,568 33.9 10.4
Mfssissippi 7,218,654 3,016,450 469,903 128,704 27.4 23.4Coastal plain 1,567,348 545,960 90,348 25,682 ,,28.4Hill section 1,350,074 460,339 54,228 17,904 33.0 21.3
Den ta 4,301,232 2,010,151 25.7325,327 85,118 26.2 23.6Missouri 428,732 198,850 74,467 4,774 6.4 41.6Hill section 27,275 18,000 6,523 635 9.~,:?/ 28.3Delta i401,457 180,850 67,944 4,139 6.r 43.7Tennessee 2,373,777 1,239,475 115,247 59,680 51.8H111 secti on 1,477,519 724,710 75,772 37,101 49.0
20.8Delta 19.5896,258 514,765 39,475 22,573 57.2 22.8
Southwest 26,692,568 12,081,440 IIi
1,561,451 740,632 47 .4 16.3Oklahoma 1,906,191 1,362,215 \1 118,405 71 ,690 60.5 18.2Texas 24,786,377 10,779,225 1,443,046 668,942 46.4Western 22,535,894 9,098,277 1,077,679 556,817 51.7
16.1Coastal plain 460,812 196,nOO 143,432 4,719 3.3
16.3H111 secti on 118,596 39,750 11,228
41.52,16~ 19.3 18.4Irrigation 1,671,075 1,445,198 210,707 105,242 49.9 13.7
West 43,306,473 17,024,903 1.319,273 1,210,513 I} 91.8 14.1Arizona 10,493,744 4,858,220 396,600 324,010 8l.6 15.0
California 31,690,763 11,236,293 863,395 849,185 98.4 13.2New Mexico 1,121,966 930,390 59,278 37,318 63.0 24.9
United States 93,322,820 40,070,087 4,514,336 2,437,626 54.0 16.4
!I Farm management distrfct. See appendix table 5 for list of major cotton-;~oduCing countiesincluded in each district.gf Based on s~mple gin data from proportion of bales from which motes were collected, and averagepounds collected per bale. Data from sample gins were applied to total gfnnings as reported by the U.S.Bureau 6f the Census fn Aprfl 1977.3/ No data fo~ Florida as all gins reported disposing of motes.-=--- • O.
")
'~
d~,::ri; '·1
~ ,
~\1
t)~
G
:i'l
}
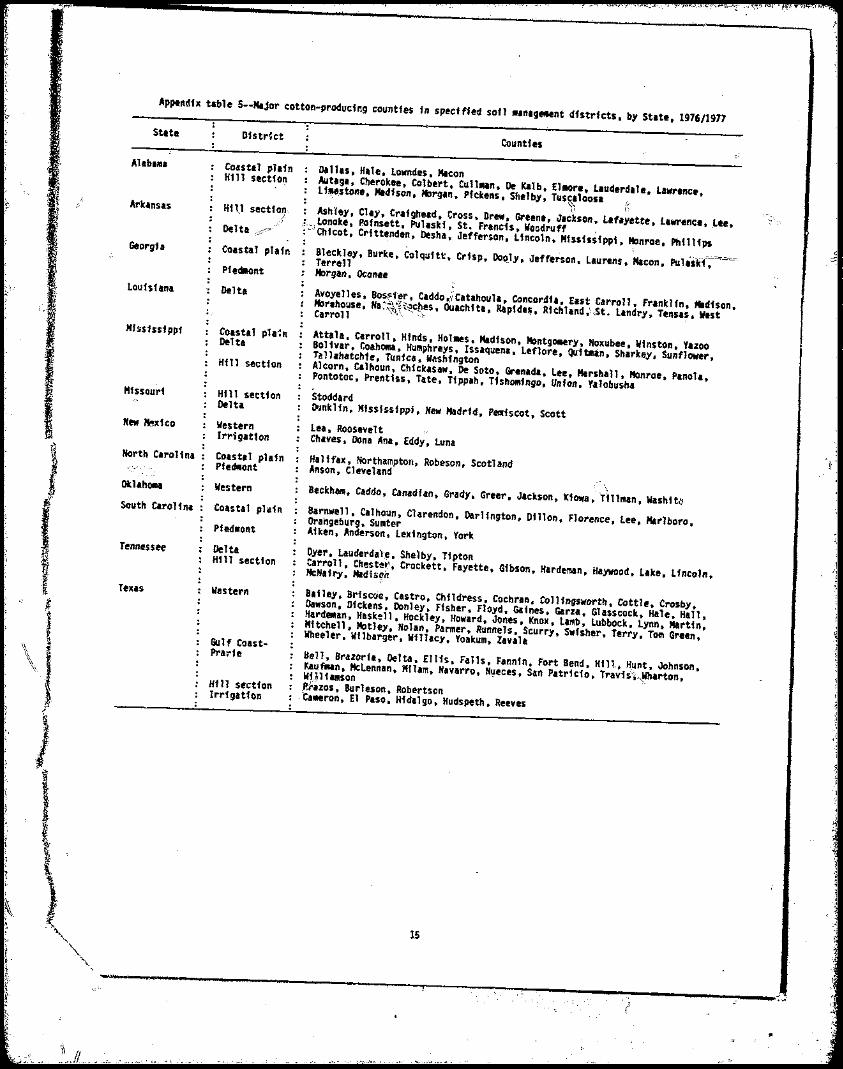
Appendfx table 5--Major cotton-producfng countfes fn specfffed sofl .anageMent dfstrfcts, by State, 1976/1977
State
Alabama
Arkansas
Georgia
- , Loufsiana
Mfss1ssfppf
Mfssourf
New /t:!xfco
North CarOlina
Oklahoma
South Carolina
Tennessee
Texas
Dfstr~ct
Coastal plain Hill Slctfo~
HflJ sectf02';
Delta ,/,':? ;/
Coastal plain
Pfedlllont
De'lta
Coastal pIa1nDelta
Hfll sectfon
Hfll sectfon Delta
Western Irrigation
Coastal plain Pfedwlont
Western
Coastal plafn
PfedMont
Delta Hfll sectfon
Western
Gulf CoastPra;-fe
Hf 11 secUon Irrfgatfon
Countfes
Dallas, Hale, Lowndes, Macon Autaga, Cherokee, Colbert, CullMan, De Kalb, ElMOre, Lauderdale, Lawrence,Lfl!llstone, Madfson, Morgan, Pfckens, Shelby, Tus~~loosa Ii
1 J) t. : Ashley, Clay, Crafghead, Cross, Drew. Greene, .Jackson, Laf.yet,te, Lawrence, .Lee,.;,_.lonoke, ~insett, Pulaskf, St. Francfs, Woodruff , ;--'Chfcot, Crftt~nden, Desha • .Jefferson, Lfncoln, Missfssfppf, Monroe, Phfllfps
Bleckley, Burke, Colquftt, Crfsp, Dol11y, ilefferson, Laurens, Macon, Puliiit'Y,--=Terrell Morgan, Oconee
if
Avoyelles, Bosfi'er, Caddo,l/catahoula, Concordia, ElSt Carron, Franklin, Madison, Morehouse, Na~·~'r~c~es, OUachfta, ltapide,., Rfchland,"-~$t. Landry, Tensas, WestCarro11 \ ~ \ .__, ,
Attala, Carroll, Hfnds, Holmes, Madison, Montgomery, Noxubee, Winston, Yazoo Bolivar, Coahoma, Humphreys, Issaquena, Leflore, Quitman, Sharkey, Sunflower,Tll1.hatchie, Tunfca, Wilshington Alcorn, Calhoun, Chfckasaw, De Soto, Grenada, Lee, Marshall, Monroe, Panola,Pontotoc, Prentiss, Tate, Tfppah, Tfshomingo, Unfon, Yalobusha Stoddard ~Jnklin, Mfssfssippi, New Madrfd, Pemiscot, Scott
Lea, Roosevelt Chaves, Dona Ana, Eddy, Luna
Halifax, Northampton. Robeson. ScotlandAnson, Cleveland
Beckham, Caddo, Canadfan, Grady, Greer, Jackson, Ki~a, Tlllman, Washft.!!
Barnwell, Calhoun, Clarendon, Darlfngton, Dillon, Florence, Lee, Marlboro,Orangeburg, Sumter Afken, Anderson, Lexfngton, York
Dyer, Lauderda)~, Shelby, Tipton Carroll, Chests~, Crockett, Fayette, Gfbson, Hardeman, Haywood, Lake, Lfncoln,HeNafry, Had'is~ir
BI11ey, BrfsC'.ie, Castro, Ch11dress, Cochran, Collfngsworth, Cottle, Crosby,Dawson, Dfckens, Donley, Ffsher, Floyd, Gaines, Garza, Glasscock, Hale, Hall, Hardeman, Hask!ll, Hockley, Howard, .Jones, Knox, Lamb, Lubbock, Lynn, Hartfn, Mftchell, Motley, Nolan, Panner, Runnels, Scurry, Swfsher, Terry, Tom Green,Wheeler, Wflbarger, Wfllacy, Yoakum, Zavala '
lIe11, Brazorfa, Delta, El115, Falls, Fannfn, Fort Bend, H111.. HUnt, .Johnson, Kaufman, McLennan, Mflam, Navarro, N\leces, San Patrfcio, Travf5~i'.,IIharton,Wf)j1famson . .P.tlzos, Burl eson, Robertson
,'Cameron, El Paso, Hfdalgo, Hudspeth, Reeves , i
15
__J'III...._________.....____,.....______-_,.____~." ...~~__-- ...~,,_~------~--..:,.,;;..:,.•,;':'" ___
'/ 1 ,~
I,
l.,··r 'j