recipient behavior - agecon searchageconsearch.umn.edu/bitstream/251834/2/from paper to...
TRANSCRIPT
From Paper to Plastic: Understanding the Impact of EBT on WIC
Recipient Behavior
Andrew S. Hanks, The Ohio State University
Carolyn Gunther, The Ohio State University
Dean Lillard, The Ohio State University
Robert L. Scharff, The Ohio State University
Invited paper presented at the 2017 ASSA Annual Meeting, January 6-8, 2017, Chicago,
Illinois.
Copyright 2016 by Andrew S. Hanks, Carolyn Gunther, Dean Lillard, and Robert L.
Scharff. All rights reserved. Readers may make verbatim copies of this document for non-
commercial purposes by any means, provided that this copyright notice appears on all such
copies.

From Paper to Plastic: Understanding the Impact of EBT on WIC Recipient
Behavior
Andrew S. Hanks, PhD1,3, Carolyn Gunther, PhD1, Dean Lillard, PhD1,4, Robert L.
Scharff, PhD1
Key Words: Transaction costs, assistance programs, social benefits, stigma, redemptions
JEL Codes: D12
Acknowledgments: We would like to thank participants at the 2016 NBER Health
Economics Summer Institute and Lauren Jones for their valuable input. We also thank
Employees of state WIC agencies in Texas, Ohio, Oregon, New Mexico, Nevada,
Massachusetts, Connecticut, Florida, West Virginia, Virginia, Kentucky, Michigan,
Wisconsin, Iowa, Vermont, and Wyoming for helping us gather WIC EBT
implementation data.
Funding: This manuscript was partially funded by the Duke-UNC USDA Center for
Behavioral Economics and Healthy Food Choice Research (BECR), which is funded by
grant 59-5000-4-0062 from the U.S. Department of Agriculture.
Disclaimer: The views expressed in this manuscript research are those of the
investigators and cannot be attributed to the U.S. Department of Agriculture, its
Economic Research Service, or its Food and Nutrition Service.
1. Consumer Sciences, Department of Human Sciences, College of Education and Human
Ecology, The Ohio State University
2. Human Nutrition, Department of Human Sciences, College of Education and Human
Ecology, The Ohio State University
3. Corresponding author: 130A Campbell Hall, 1787 Neil Ave., Columbus, OH, 43210;
[email protected]; Office -- 614-688-1787; Cell – 607-339-6942
4. Deutsches Institut für Wirtschaftsforschung – Berlin (DIW-Berlin), National Bureau of
Economic Research
1
From Paper to Plastic: Understanding the Impact of EBT on WIC Recipient
Behavior
Abstract
Only about 60% of eligible people participate in the Special Supplemental Nutrition
Program for Women, Infants, and Children (WIC) and evidence indicates that these
recipients do not claim all of the benefits available to them. Transaction costs and
negative stigma associated with participating in the program are likely to discourage
eligible people from enrolling, and enrollees from redeeming all of their benefits. As of
November 2016, sixteen states have implemented Electronic Benefits Transfer (EBT) for
WIC, potentially reducing the amount of time required for each transaction and making it
more difficult to identify beneficiaries. In this manuscript we analyze the impact the
transition to WIC EBT has on enrollment, WIC benefits redemption, and non-WIC food
expenditures using enrollment data for five states, and expenditure data for 17,714
households enrolled in WIC. We find no evidence that EBT increases the chance that
eligible people enroll in the WIC program. We do find evidence that WIC recipients
redeem more benefits two to four months after the transition, and there is no evidence
that they increase expenditures on non-WIC foods.
2
The Healthy, Hunger-Free Kids act mandates that by October 2020 all states in the Union
must deliver benefits for the Special Supplemental Nutrition Program for Women,
Infants, and Children (WIC) through Electronic Benefit Transfer systems (EBT). This
system of benefit delivery has the potential to reduce transaction costs for WIC
recipients, cut down on employee time dedicated to conducting these transactions, and
not force other shoppers to wait in line for a longer period of time. In addition, it is
possible that psychological stigma experienced by the WIC recipient decreases since
other shoppers may have a more difficult time identifying a shopper as a WIC recipient.
Given the reduction in transaction time and costs, and potentially the decrease in stigma,
it is not unrealistic to expect that purchasing patterns of WIC recipients might change and
that eligible individuals just on the margin of enrolling will matriculate in the program
(where funds are available). Our objective is to use exogenous variation in WIC EBT
implementation to measure the impact that this transition has on enrollment, WIC
redemptions, and non-WIC food expenditures.
One of the current challenges in measuring the impact of the transition to EBT on
WIC recipient behavior is the lack of available data. Only select WIC enrollment data are
available on the USDA website and transaction level data commonly used in research do
not indicate whether or not foods are redeemed with WIC benefits, or paid for out-of-
pocked. In addition, state information for WIC EBT implementation is not always readily
available or well archived.
For this study we attempted to overcome some of these data challenges by
collecting EBT rollout information for fifteen of the sixteen states currently using WIC
3
EBT. We then match these data to monthly WIC enrollment data for five states. In
addition, we received transaction records from a grocer in Ohio for 17,714 WIC
households who hold also hold a loyalty card for this grocer. These transaction data
include 75 weeks of WIC redemptions and expenditures on non-WIC foods and covers
most of the EBT transition period in Ohio. We match these transaction records to the
implementation schedule for Ohio.
In brief, our results indicate that WIC EBT has no impact on enrollment and
measurable impact on WIC redemptions. We also find significant county and state
variation suggesting that time-variant state and even county effects can significantly
influence responses to this and similar programs. We provide more details regarding our
data and empirical specifications below.
Background
In 2015, $104.1 billion were delivered in food benefits through in-kind food
assistance programs (Oliveira 2016). Despite the debate surrounding efficiencies of in-
kind transfer programs in general, these types of programs may be able to effectively
deliver specific benefits to intended recipients (see Cunha 2014; Ben-Shalom, Moffitt,
and Scholz 2012; Currie and Gahvari 2008), and minimize the potential political
ramifications of recipients utilizing benefits contrary to how tax payers think the benefits
should be spent (Currie and Gahvari 2008).
The most well-known in-kind food assistance programs currently administered by
the Federal government are the Supplemental Nutrition Assistance Program (SNAP),
National School Lunch Program (NSLP), WIC, and the School Breakfast Program (SBP).
4
These programs account for 93% of total benefits delivered for food assistance nationally
(Oliveira, 2016).
WIC provides food assistance for lower income pregnant, breast-feeding, and
post-partum women, infants and children ages 1-4, making it an extremely valuable and
consequential food assistance program. In 2015, WIC accounted for 6% of federal dollars
allocated to in-kind food assistance programs, benefitting 8 million recipients (Oliveira
2016). Yet only 60% of eligible people are enrolled in the program (Johnson et al. 2015)
and in some cases, only 12.6% of recipients redeem all of their benefits (Phillips et al.
2015)
Of the many acclaimed benefits attributed to the WIC program, the most widely
accepted, though still debated benefit (Joyce, Gibson, and Colman 2005; Joyce, Racine,
and Yunzal-Butler 2008), is the improvement in birth weight among infants (Currie and
Rajani 2015; Rossin-Slater 2013; Hoynes, Page, and Stevens 2011; Bitler and Currie
2005). There is some evidence that food insecurity is reduced (Kreider, Pepper, and Roy
2016; Metallinos et al. 2011; Black et al. 2004) leading to an improvement in dietary and
health outcomes for women and children (Lee and Mackey-Bilaver 2007). There is also
limited evidenced of cognitive benefits to children (Jackson, 2015) and even potential
spill-over effects for older siblings of young participants (Robinson 2013).
Redeeming WIC Benefits: Vouchers vs. EBT
One of the factors affecting the 40% of eligible people that do not participate, and
that might result in left-over WIC benefits, is the way in which benefits are delivered
(Johnson et al. 2015). Since WIC began in 1972, recipients have redeemed benefits
5
through paper vouchers. To redeem food items using vouchers, beneficiaries follow a
specific routine at the check-out line. They first separate WIC-eligible and WIC-non-
eligible items and then present their vouchers to the cashier who verifies that the selected
items are WIC-eligible and notes which benefits are redeemed. If the beneficiary does not
redeem all items on the voucher, in some states, she can pick up those items at a later
date. If a beneficiary mistakenly includes a non WIC-eligible item in the WIC-eligible
pile, the cashier informs her and gives her the choice to either pay cash for the item in a
separate transaction or to return it to the shelf. Because this part of the process slows
down the check-out line and potentially embarrasses the WIC beneficiary, a beneficiary
may face higher transaction and stigma costs when she redeems WIC benefits with paper
vouchers.
In contrast to benefit redemption using paper vouchers, under EBT, store clerks
electronically scan the Uniform Product Code label of all items all at once. The WIC
beneficiary then swipes her EBT card, which is like a debit card, enters her PIN, and the
computer program automatically determines which items are WIC-eligible. Next, the
computer deducts the dollar amount of the WIC approved items from the total bill and the
recipient is responsible to pay the remainder out of her own pocket. This streamlined
process most likely reduces the amount of time each transaction takes. Fellow shoppers
do not need to wait behind recipients as long and it is more difficult to identify WIC
recipients, potentially reducing negative stigma (Manchester and Mumford 2010, 2012).
In addition to improving the efficiency of the WIC benefit redemption process,
EBT systems also place more responsibility on WIC beneficiaries. Since the cashier is no

6
longer validating the eligibility of selected items, it is up to the WIC recipient to make
sure she selects the correct foods. If not, she either must pause the transaction right after
swiping her EBT card to identify which foods are not covered, or simply pay for them out
of pocket. The complex and burdensome foods list published by many states can make it
difficult for WIC beneficiaries to easily identify WIC eligible foods, and use of these
documents in the store easily identifies someone as a WIC recipient, potentially resulting
in stigma. In addition, foods are often not well marked in the stores increasing the
difficulty of correctly selecting the appropriate foods.
Descriptive Model of WIC Recipient Behavior
Researchers have modeled a person’s decision to enroll in (or to enroll one’s
eligible child) and redeem WIC benefits as a function of transaction costs and the stigma
associated with participating in government assistance programs (see Manchester and
Mumford, 2010, 2012; Currie 2004 for good discussions on stigma). These transaction
costs are a function of the effort required to enroll in the program (travel to clinic and fill
out forms), the effort and time required to identify which food are part of the WIC
program and properly select these foods, and the effort and time required to redeem
benefits at the check-out line. In addition, these costs include the effort to initially enroll
in the program and the effort required to learn which foods are part of the WIC package.
There are also monthly costs that include the time required to renew benefits every three
months, the time required for mandatory visits (6 months for women, 1 year for children),
and the time required redeem benefits at check-out.

7
In addition to transaction costs, WIC recipients might also pay stigma costs for
participation in the program. We assume these psychological costs are borne by the
recipient when someone else identifies the recipient as participating in the welfare
program. This occurs with greatest accuracy at check-out when the recipient gives the
cashier a paper voucher to redeem benefits. This clearly signals the recipient’s
participation in the program and shoppers behind the recipient may become impatient,
frustrated, or angry. The cashier might even show frustration or appear annoyed when
conducting the transaction.
Both transaction and stigma costs can reduce the chance that a person will enroll
in WIC and/or redeem all of their benefits. At the margin, the value of WIC benefits must
equal or be greater than transaction and stigma costs combined for enrollment and/or
benefit redemption to occur, holding income and other variables constant. An increase in
the size of the benefit can increase the chance that a person enrolls and redeems benefits.
This is most clearly demonstrated by recent statistics indicating that 60.2% of all eligible
people enroll in WIC, where 84.4% of these enrollees are infants and 49.8% children
ages 1-4 (Johnson et al. 2015). Infant formula is costly and the flexibility it provides
women who wish to return to work is also valuable, thus it is no surprise that a high
percentage of eligible infants are enrolled in the program.
When EBT is introduced into the WIC benefits redemption process, the nominal
value of benefits does not change, though transaction costs, and potentially stigma costs,
do change. Specifically, transaction costs fall because the recipient no longer needs to
separate goods into WIC and non-WIC food piles. Also, the cashier no longer verifies

8
foods as WIC eligible using a paper voucher. Instead the computerized system
determines which foods are WIC eligible and applies the appropriate benefits to these
foods. Finally, shoppers behind the WIC recipient may not be able to identify the shopper
as a WIC recipient, potentially reducing stigma costs. Given the change in these costs as
a result of EBT, the following behavioral predictions can be made:
1. Eligible people will be more likely to enroll in the program
2. Benefits redeemed will increase
Under the voucher system, the cashier alerts the recipient if a non-WIC item is
mistakenly submitted for redemption, giving the recipient the choice whether to purchase
the item, replace it with an eligible item, or not make the purchase. When EBT is used,
the recipient scans WIC and non-WIC items together and WIC benefits are automatically
applied. If the enrollee is not fully paying attention, there is the potential for a non-WIC
item to be inadvertently purchased. If enrollees mistakenly choose non-eligible foods and
attempt to redeem them with their WIC benefits, the following prediction can also be
made:
3. Expenditures on non-WIC foods will increase initially, but as WIC recipients
learn about the process, these expenditures will decline over time.
If WIC recipients were already making errors in selecting their foods, there is no
reason this error rate will increase, but the cost of the errors will now be borne by the
recipients, instead of the store. In other words, the recipient will need to pay for the
additional goods out of pocket instead of the store cashier taking time to verify the

9
eligibility of the food. It is possible that recipients may quickly learn which foods are part
of the WIC program and not repeat the mistakes over an extended period of time.
Data
To carry out this study we use four types of data: WIC enrollment data, county
level population data, WIC EBT implementation data, and WIC household grocery
purchase data. We merge the WIC EBT implementation data with the enrollment and
purchase data to estimate the effect of the transition on WIC recipient behavior. We
describe the data in detail below.
State Enrollment and Population Data
The United States Department of Agriculture publishes monthly WIC enrollment
data by state from Oct 2009 through May 2016. These data include total WIC enrollment
numbers as well as the number of enrolled people in specific WIC groups of pregnant
women, post-partum women, infants, and children. While WIC enrollment and benefits
are all handled at the county or WIC agency level, these data are only at the state level so
we cannot take advantage of county or WIC agency level variation.
For our analyses with enrollment data, we also collected county level population
estimates for 2010-2015. These data are annual by county, so we use linear interpolation
methods to calculate monthly population estimates for each county in each state in the
US. We then aggregate these population values by state and merge them to the
enrollment data.
WIC EBT Implementation Data
10
We collected EBT rollout information for 15 of the 16 states that currently use
WIC EBT (Nevada is the only state for which information is missing). In most of the
states that have implemented EBT, the state WIC agencies proceeded with the transition
on a county or WIC agency basis. In addition, most of these states handled the
implementation over a period of several months. Some of the first states to transition to
WIC EBT took more than one year to complete implementation. Even though we have
implementation data for all but one of the states that has transitioned to EBT, we only
have enrollment data and population estimates that span both the pre- and post EBT
periods for 5 states: Kentucky, Ohio, Massachusetts, Virginia, and Wisconsin. Thus we
restrict our analysis of enrollment data to these states.
Since the population data are at the county level and some states implemented
EBT on a WIC agency instead of county basis, we use the geographic area the agency
covers and based on county lines, calculate the share of a county’s population within that
WIC agency area. This allows us greater precision in determining the share of each
county exposed to WIC EBT in any given month. Since the monthly enrollment data are
at the state level, we aggregate these population data up to the state-month level. While
we do not have county or WIC agency level variation, we still have monthly variation in
the share of the state’s population exposed to WIC EBT. We then merge these population
data to the enrollment data. Finally, we characterize a state as having transitioned to EBT
once 95% of the state’s population has been exposed.
Household Grocery Purchase Data

11
Through a cooperative agreement with a supermarket chain in Ohio, we obtained
weekly expenditure data for households participating in the Ohio WIC program. These
households are taken from the grocer’s database of 6 million households tracked through
a loyalty card shopper program. Households enter into this panel if they hold a loyalty
card and if they spend a certain amount each month and year. The grocer sets this
minimum spending limit to make sure the households in the database represent regular
shoppers in the store. Households enter this panel through the loyalty card program. This
panel includes weekly expenditure data, both on WIC redemptions and non-WIC food
expenditures, for 73,331 total households.
Data for this study spans from December 2013 to June 2015, a total of 75 weeks,
and covers 56 of the 88 Ohio counties. This time frame includes all but one of the EBT
transition phases for Ohio, the transition that occurred on July 1, 2015. Thus in this
sample, stores in the counties scheduled to transition to EBT on July 1 redeemed voucher
benefits only. In regards to the 32 missing counties, there is no store from the grocery
chain in these counties, thus they are not present in the data. See table 1 for specific
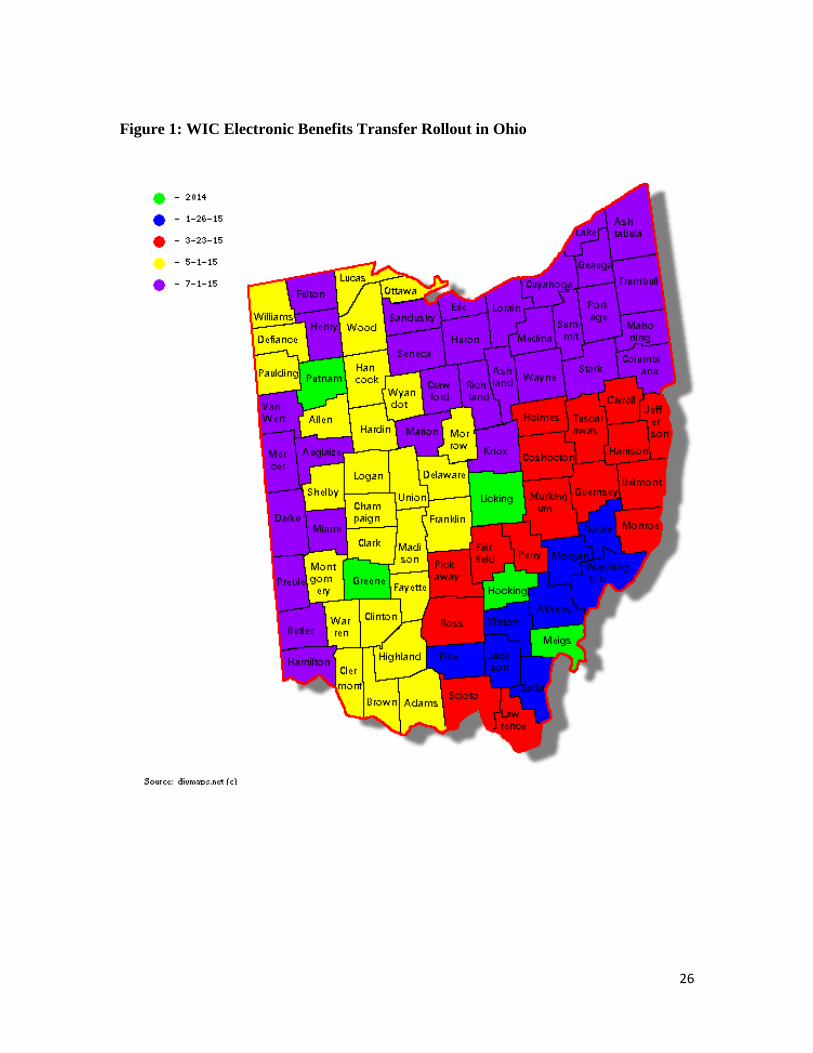
counties that appear in the data. Also, see figure 1 for an illustration of the staggered WIC
EBT rollout across Ohio.
While the data do include expenditures, these expenditures are aggregated at the
weekly level for each household. We also know the store and county where most a
household made most of their purchases that week. In addition, the data are aggregated at
the product category level: bakery, deli, deli packaged, floral, fresh prepared, fresh
produce, general merchandise, grocery, health and beauty care, liquor, meat, natural

12
foods, packaged produce, pharmacy, packaged meat, packaged seafood, seafood, and
supplies. Expenditures for each of these categories are separated into WIC redemptions
and non-WIC expenditures. In addition, WIC redemptions are flagged as purchases using
WIC vouchers or EBT. The following categories include WIC eligible foods: fresh
produce, grocery, health and beauty care (infant formula), and packaged seafood. We
only use the first three categories in our analyses since packaged seafood is rarely
purchased.
Household expenditures are only recorded when a purchase is made at one of the
grocer’s stores, creating an unbalanced panel. We fill in missing weeks with zeros.
Notably, these zeros mean one of three things: 1) the household did not buy anything or
redeem WIC benefits that week; 2) the household purchased groceries or redeemed
benefits at a different store; 3) the household purchased groceries without the loyalty card
and did not redeem benefits. Moreover, there is no county or store associated with these
weeks. We fill in stores and counties for these cases by inserting the store and county
where the household shopped the most frequently on the weeks when transactions were
logged. If there were two or more stores or counties where a household shopped that tied
for highest frequency of household visits, we randomly selected one of the highest
frequency stores and counties and used those as the store and county proxies.
We also note that households are in the sample if they redeemed WIC benefits
any time in 2014 or 2015. Thus some households can be in the sample and not have WIC
redemptions recorded until the end of the sample period, or vice versa. In addition, some
households may not redeem all of their benefits, or may redeem benefits at other stores.
13
In order to adequately measure WIC shopper behavior in this sample we restrict
the sample to households that make a WIC purchase an average of once every month, and
we do this for several reasons. First, this ensures, with high probability, that a household
has WIC benefit redemption data recorded both before and after the EBT transition.
Second, since WIC benefits are distributed at three-month intervals, recipients have to
show up at a clinic every three months to either pick up the new vouchers or have the
benefits “loaded” onto the card. It is plausible that a household member on WIC does not
visit a clinic at the beginning of the cycle to retrieve the new vouchers or re-load the EBT
card. As a result, there may be cases where WIC data are not recorded for a household for
multiple weeks, but the household still has a member enrolled in the WIC program.
Third, this ensures, with high probability, that a household is registered for the WIC
program throughout the whole sample period. This leaves us with 17,714 (N=1,328,550)
households in the final sample of data.
Finally, we aggregate expenditures by month to remove weekly cyclicality in
purchase behavior. Since we received weekly data, we construct months by setting the
first week as the week when the first day of the month occurs (the first week of the data
includes January 1, 2014). With this structure we create some months with four weeks
and some with five. We note that this has little impact on our regression results.
Empirical Specification
To measure the impact of EBT on enrollment and household shopping behavior
we rely on an event-study approach (Binder 1998; Khotari and Warner 2006). The event-
study approach allows us to use the staggered implementation of EBT across counties
14
and states as our identification strategy, and convert it to a difference-in-difference
design. In addition, this approach allows us to track behavior in relation to EBT
implementation and to see how long behavior persists over time, if at all. In this
approach, the baseline period, is coded as zero and all the preceding and subsequent
periods are coded as indicator variables. In the enrollment data, the baseline period is the
month prior to the month when 95% of the state population is exposed to EBT. For the
grocery purchase data, the baseline period is the month prior to the county’s
implementation month. In both cases, all pre- and post-months are relative to the baseline
month.
For our empirical specification for the enrollment data, we include indicator
variables for six months prior and six months post EBT implementation. We include an
event horizon of this length because this is the time for which we have a balanced panel
for the five states of interest. This limits us to a sample size of 65. We also include a
monthly indicator variable and use state fixed effects. The empirical model is as follows:
𝐸𝐸𝐸𝐸𝐸𝐸𝐸𝐸𝐸𝐸𝐸𝐸𝐸𝐸𝐸𝐸𝐸𝐸𝐸𝐸 𝑆𝑆ℎ𝑎𝑎𝐸𝐸𝐸𝐸𝑖𝑖𝑖𝑖 = 𝛽𝛽0 + 𝑷𝑷𝑷𝑷𝑷𝑷𝑷𝑷𝒗𝒗𝑷𝑷𝒆𝒆𝒆𝒆 ∗ 𝚩𝚩𝒑𝒑𝑷𝑷𝑷𝑷 + 𝑷𝑷𝑷𝑷𝑷𝑷𝒆𝒆𝑷𝑷𝒗𝒗𝑷𝑷𝒆𝒆𝒆𝒆 ∗ 𝚩𝚩𝒑𝒑𝑷𝑷𝑷𝑷𝒆𝒆 + 𝑴𝑴𝑷𝑷𝒆𝒆𝒆𝒆𝑴𝑴 ∗
𝚩𝚩𝒎𝒎𝑷𝑷𝒆𝒆𝒆𝒆𝑴𝑴 + 𝑺𝑺𝒆𝒆𝑺𝑺𝒆𝒆𝑷𝑷 ∗ 𝚩𝚩𝐬𝐬𝐬𝐬𝐬𝐬𝐬𝐬𝐬𝐬 + 𝜈𝜈𝑖𝑖,
(1)
where each Β represents a vector of coefficients to be estimated. The variables PreEvent
and PostEvent are both matrices of indicator variables for the pre and post EBT months,
respectively. State and Month are matrices of state and month fixed effects, respectively.
We also estimate robust standard errors. Our outcome variables are total state enrollment

15
share of the state population, and then each WIC enrollment group’s share of total WIC
enrollment.
In our models with transaction data, we use a similar model, but only include a
five-month event horizon. To make the most use of our data, we use unbalanced panel
data since the last two enrollment groups in Ohio only have one or three months after the
baseline month. Furthermore, the first county to implement EBT only has five months
prior to the baseline month. In addition, we run multiple robustness checks to verify the
outcomes we estimate.
In our empirical specification for the transaction data, we estimate month and
county fixed effects models and include the indicator variables for five months before
and after the baseline month. We also estimate robust standard errors. Our empirical
model follows the form:
𝑦𝑦𝑖𝑖𝑖𝑖 = 𝛼𝛼0 + 𝑷𝑷𝑷𝑷𝑷𝑷𝑷𝑷𝒗𝒗𝑷𝑷𝒆𝒆𝒆𝒆 ∗ 𝚨𝚨𝒑𝒑𝑷𝑷𝑷𝑷 + 𝑷𝑷𝑷𝑷𝑷𝑷𝒆𝒆𝑷𝑷𝒗𝒗𝑷𝑷𝒆𝒆𝒆𝒆 ∗ 𝚨𝚨𝒑𝒑𝑷𝑷𝑷𝑷𝒆𝒆 + 𝑴𝑴𝑷𝑷𝒆𝒆𝒆𝒆𝑴𝑴 ∗ 𝚨𝚨𝒎𝒎𝑷𝑷𝒆𝒆𝒆𝒆𝑴𝑴 + 𝑪𝑪𝑷𝑷𝑪𝑪𝒆𝒆𝒆𝒆𝑪𝑪 ∗
𝚨𝚨𝐜𝐜𝐜𝐜𝐜𝐜𝐜𝐜𝐬𝐬𝐜𝐜 + 𝜈𝜈𝑖𝑖. (2)
Outcome variables of interest are total WIC redemptions and non-WIC expenditures, and
non-WIC expenditures and WIC redemptions for general grocery foods, all produce, and
infant formula.
Results
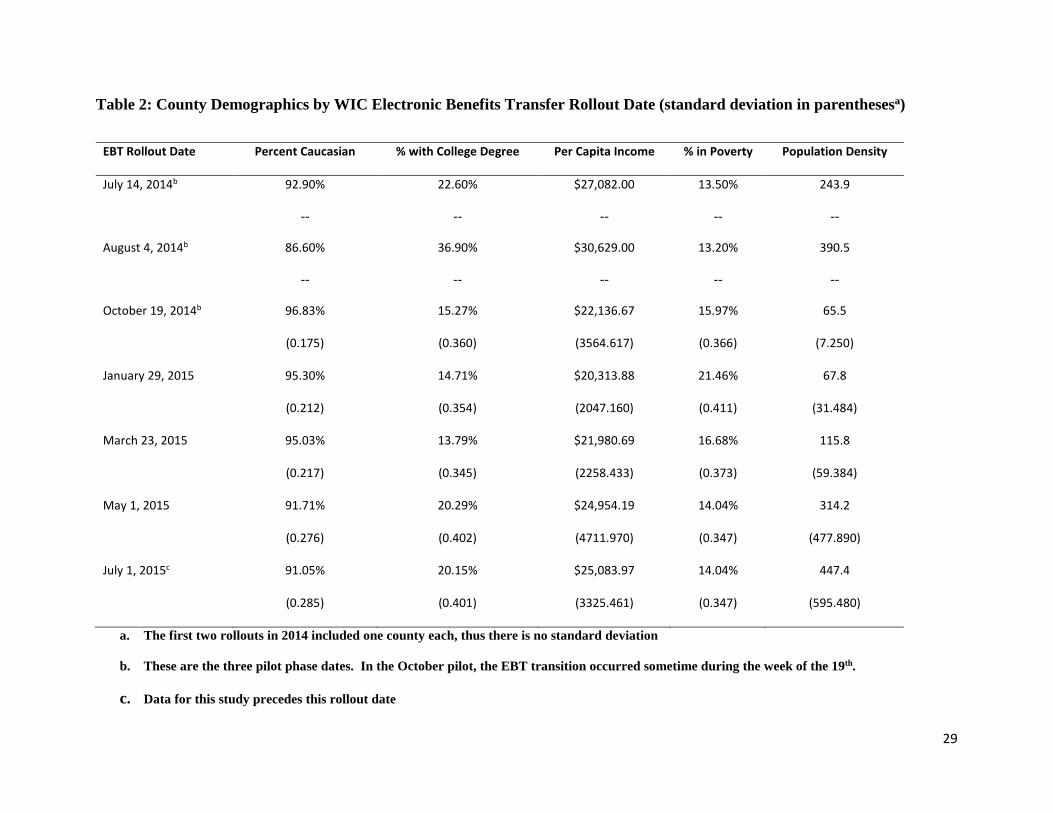
In table 2, we present data on the counties represented in the sample of transaction
data from Ohio, and group them by EBT transition. Notably, after the pilot phases,
population density gradually increases by phase, indicating that larger, more population
dense counties transitioned later. There is less variation in the percentage of the county’s

16
population in poverty, with the highest percentage at 21.46% in the seven counties that
began the transition on January 26, 2015. Racial profiles, based on percentage of
Caucasians in the county, were similar too, though Greene County has the lowest
percentage at 86.60%. Finally, there is variation in the percentage of the population with
a college degree. Notably, on average 13.8% of the residents in the counties that
transitioned on March 23, 2016 have a college degree while on average more than one-
fifth of the residents of the counties that transitioned on May 1 and July 1, 2015 have a
college degree.
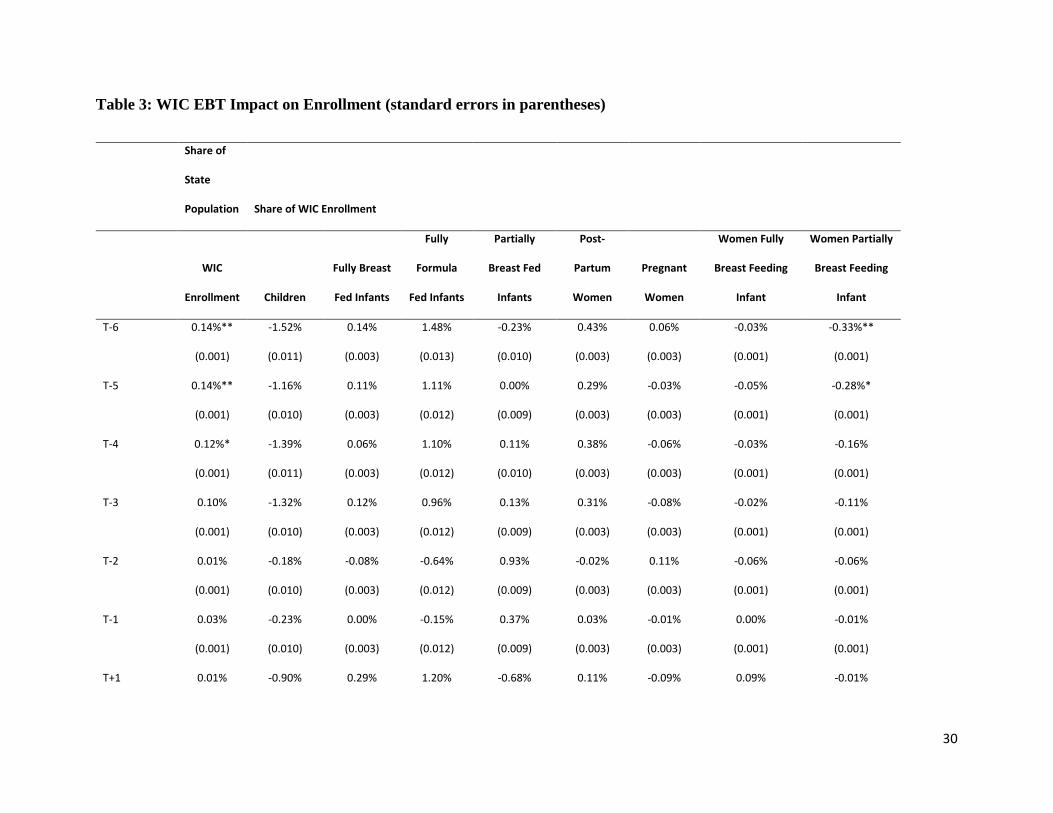
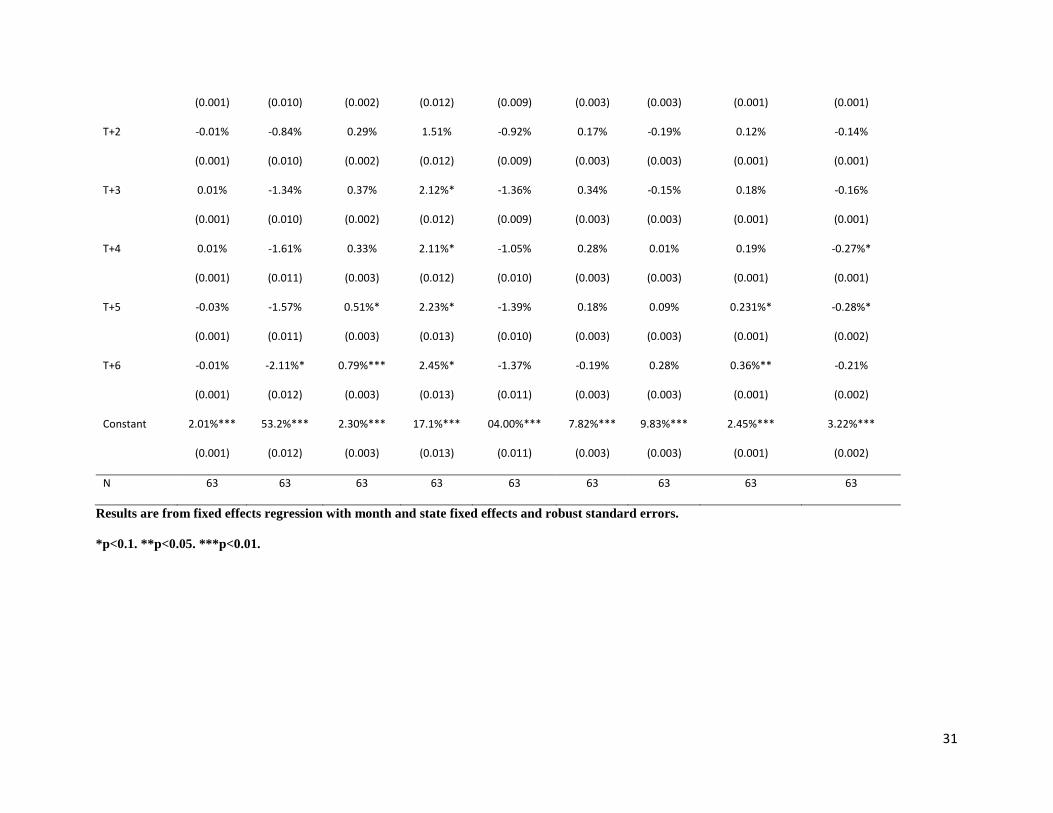
Enrollment
Now we consider the impact that the transition to EBT has on program
enrollment. The first column in table 3 reports the impact of the EBT transition on WIC
enrollment’s share of the state population. Based on our specification, there is no
evidence that EBT has any impact on WIC enrollment in general.
It is plausible, however, that enrollment in different recipient groups in the WIC
program change. In columns 2-8 in table 3, we report results for the different groups in
the WIC program. Overall for each of these groups, we find limited evidence that the
transition to EBT has any impact on enrollment.
What limited evidence we have of any impact appears in month three or later after
the baseline month, though these are primarily significant at the 0.1 level. Two notable
exceptions are the significant increases in month six for fully breast fed infants and
conversely women who fully breast feed their infants. We determine whether or not these
results are state specific by running the regressions and removing one state at a time. We
17
find that when we remove Ohio, these two significant results are eliminated, suggesting
something other than EBT is driving the result.
Household Grocery Purchases
Even though EBT does not seem to increase the chance a women, infant, or child
enrolls in WIC, we find evidence in the transaction data that EBT positively influences
WIC benefit redemptions purchases. We also find evidence that expenditures on non-
WIC foods increase after EBT, though it is not clear this is a result of EBT.
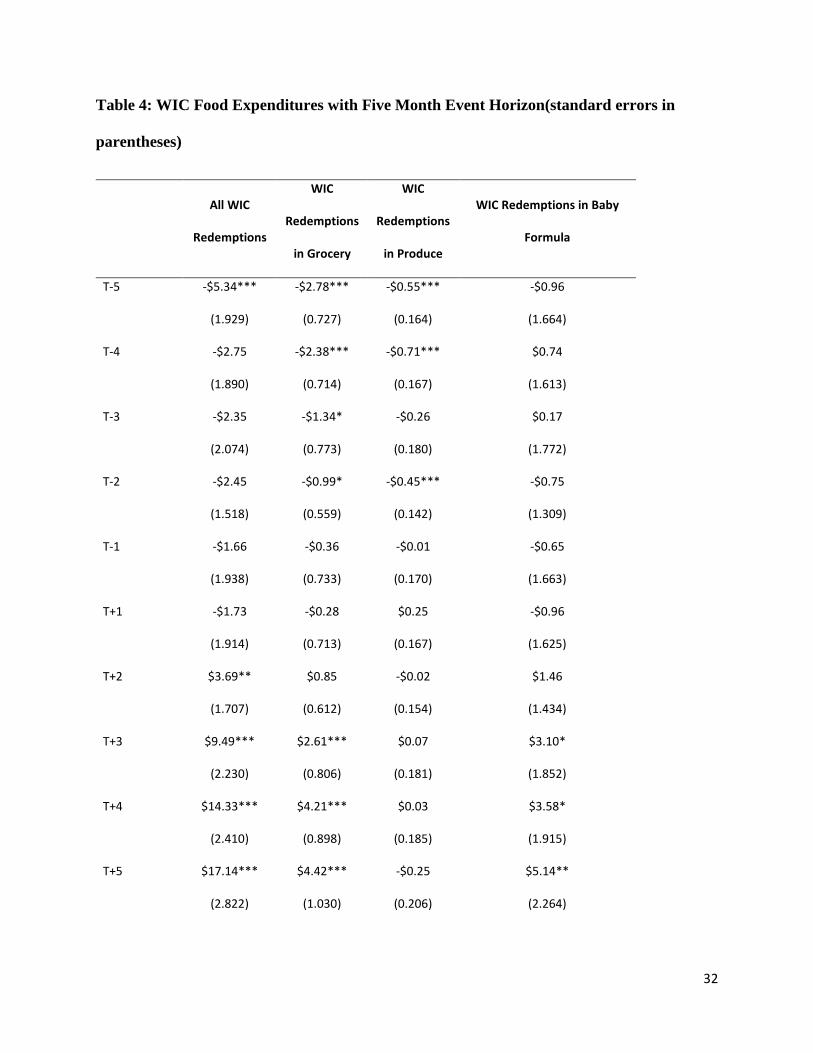
Results in table 4 indicate that households redeem more WIC benefits beginning
at two months after the baseline month. These redemptions increase in magnitude from
$3.69 in month two to $17.14 additional dollars in month five. This increase in
redemptions is driven by redemptions of foods in the grocery category, which includes
items such as cereal, bread, peanut butter, and juice. There are also increases in infant
formula redemptions, though this increase is statistically significant at the 0.05 level only
in month 5. Produce redemptions are not influenced by the transition.
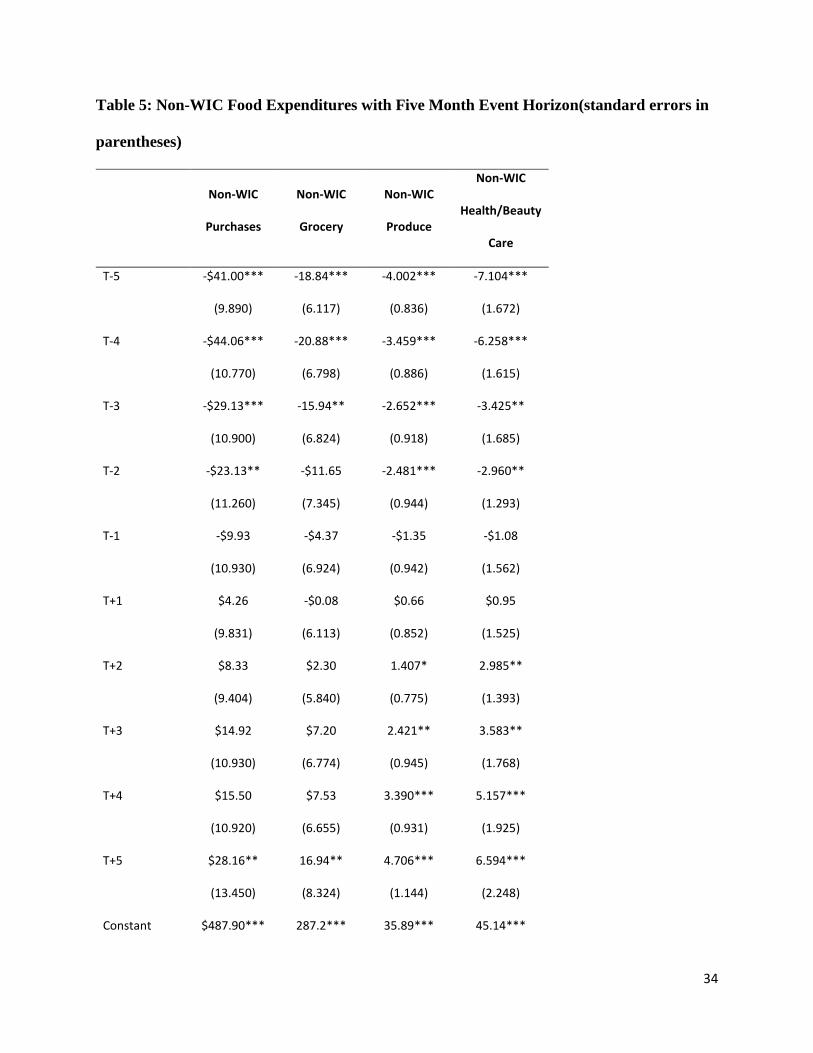
When we estimate our expenditure model with non-WIC food expenditures, we
find some evidence that expenditures increased. In table 5 we report that in the fifth
month after the transition, all non-WIC expenditures increased by $28.16. This increase
is driven by items from all three categories, though expenditures on grocery items
increased by $16.94. We note that expenditures on produce and health and beauty care
increase relative to the baseline month as early as month three.
It is important to note that for Ohio, month five in the grocery purchase data is not
the same calendar month as month five in the enrollment data. Month five in the

18
enrollment data corresponds to November, 2015, while month 5 in the grocery purchase
data depends on implementation date. Since the grocery purchase data do not extend
through November 2015, then no month five in these data corresponds to month five in
the enrollment data.
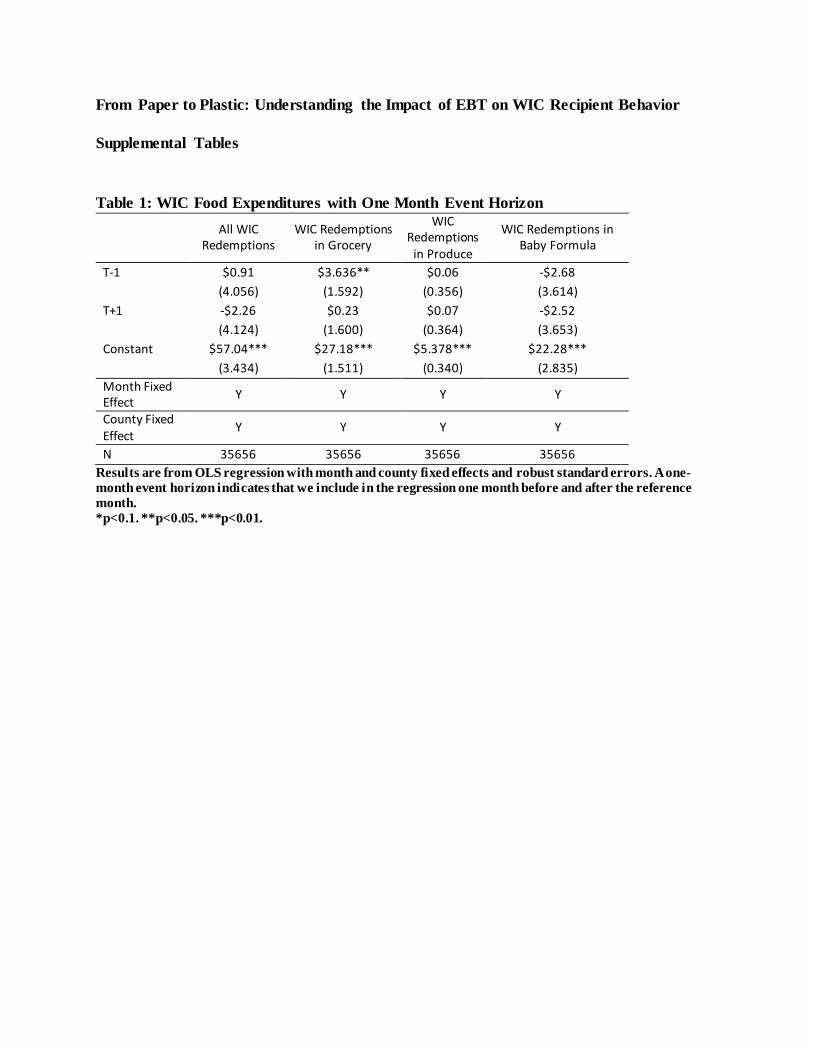
Robustness Checks
We conduct a series of robustness checks to determine the validity of our
transaction results. These robustness checks include event horizons of one and three-
month duration, as well as estimation with a balanced panel with one, three, and five
months in the event horizon. We also estimate models in which we remove households
that purchased baby formula at least once during the study. In addition, we estimate the
models and remove one implementation group at a time. We conduct this set of
regressions with both unbalanced and balanced panels. Finally, we estimate a set of
regression models in which we parse the sample into one-person, two-person, three-
person, four-person, and five or more person households. We use information from the
BLS on monthly food expenditures for each of these households sizes to separate the data
into these groups. All of the results for our robustness checks are available in our
supplemental material.
From our robustness checks, we find consistent evidence for increases in WIC
redemptions beginning somewhere between month two and four after the baseline month.
These results are eliminated only when we remove households that purchased baby
formula at least once during the study period. The decrease in expenditures for all WIC
redemptions and redemptions of foods in grocery and produce prior to EBT (table 4) are
19
not robust to the different specifications so these are likely the result of county or
implementation phase-specific variation. Similarly, the increase in non-WIC expenditures
post-EBT and the decrease in expenditures pre-EBT observed in table 5 are not robust to
the various specifications.
Discussion
In this study, we focus on the impact that the transition to EBT has on enrollment
decisions and shopping behavior of WIC recipients. First, we use enrollment data for five
states currently with WIC EBT to estimate the impact of the transition on WIC
enrollment. Then we utilize a set of transaction data from a major grocer in Ohio that
tracks purchases of more than 17,000 WIC households across 56 counties over a 75 week
period. In both cases, we identify the causal impact of EBT by relying on variation in
benefit transmission across counties and regions to estimate a difference in differences
model. Most importantly, we find no evidence that the transition to EBT influences
enrollment decisions. We do find evidence that the transition increases WIC redemptions
but this increase usually occurs somewhere between two to four months once EBT has
been implemented.
This primary finding from our research highlights an important administrative
complexity in the transition process. WIC benefits are distributed on a three-month basis.
When counties in Ohio transitioned to EBT, people in these counties had up to three
months to use their vouchers. Once this three-month period ended, all recipients in the
county received benefits via EBT. For example, if a WIC recipient received three months
of vouchers the day before the EBT transition, then this person could still use those
20
vouchers for three months. This provides insights into our results that WIC redemptions
began to increase somewhere between month two and four after baseline. Redemptions in
those first months included both voucher and EBT redemptions but by month four, all
benefits should be redeemed via EBT.
We also highlight the sets of counties in the transaction records for which data
appear in the event horizon months. Counties that implemented EBT in Ohio on May 1,
2015 only have one month of data post baseline, though these counties appear in all
months prior to the baseline month. Those counties that implemented EBT in Ohio on
March 23, 2015 have three months of data post baseline, and those that implemented
EBT on January 26, 2015 have five. The pilot counties appear in all five months of the
event horizon (refer to table 1 and figure 1). We note that the counties that appear in
months three through five after the reference month are primarily Appalachian counties.
Thus it is very possible that our results are driven by this specific set of WIC recipients.
Our robustness checks do suggest this to a certain degree. Unfortunately, our limited time
frame does not allow us to explore this further.
In addition to our limited time-frame for both the enrollment and food purchase
data, we also recognize that our enrollment data are only for five states and at the state
level. This limits our ability to detect any potential effects from EBT. Furthermore, the
lack of demographic data with the expenditure data diminishes our ability to precisely
identify specific WIC households in the data, such as those with a pregnant woman and
those with children. In addition, we only have transaction data for WIC households, and
only for foods purchased at this particular location. Furthermore, we do not know what
21
percentage of benefits are redeemed, and on which specific items. Yet we emphasize the
novelty of the data and its value in providing a glimpse into the impact that the transition
to EBT has on WIC recipient behavior.
Conclusions
This study is unique because we leverage variation in EBT implementation across
states, and across counties in Ohio, to identify the causal impact of the transition on
enrollment and shopping decisions. This is the first study to empirically study these
questions and we also use unique transaction data. Given that 16 of the 50 states currently
distribute benefits with EBT and the remainder will do so in the next several years, this is
a very timely research topic. Additionally, WIC reaches some of the country’s most
vulnerable populations – pregnant and postpartum women, infants, and young children –
highlighting the importance of this research. Proper nutrition for pregnant women is
essential to ensure a healthy birth, and children need an appropriate diet to develop well.
Results from this research can inform policy makers of the benefits and challenges
associated with WIC EBT, as well as potential improvements to benefit delivery.
22
References
Ben-Shalom, Yonatan, Moffitt, Robert A., Scholz, John Karl. “An Assessment of the
Effectiveness of Anti-Poverty Programs in the United States.” In Oxford Handbook of
the Economics of Poverty, ed. P. Jefferson (Oxford University Press, 2012).
Binder JJ. “The Event Study Methodology Since 1969.” Review of Quantitative Finance
and Accounting 11 (1998):111-137.
Bitler, Marianne P., Janet Currie. “Does WIC Work? The effects of WIC on pregnancy
and birth outcomes. Journal of Policy Analysis and Management 24, no. 1 (2005): 73-
91.
Black, Maureen M., Diana B. Cutts, Deborah A. Frank, Joni Geppert, Anne Skalicky,
Suzette Levenson, Patrick H. Casey et al. “Special Supplemental Nutrition Program for
Women, Infants, and Children participation and infants’ growth and health: a multisite
surveillance study.” Pediatrics 114, no. 1 (2004): 169-176.
CDC National Immunization Survey: Breastfeeding among U.S. Children Born 2002-
2012. URL: https://www.cdc.gov/breastfeeding/data/NIS_data/. Accessed July 22,
2015.
Currie, Janet. “Welfare and the Well-being of Children: The Relative Effectiveness of
Cash and in-kind Transfers.” In Tax Policy and the Economy, Volume 8 (MIT Press,
1994), pp. 1-44.
Currie, Janet, and Ishita Rajani. “Within-mother estimates of the effects of WIC on birth
outcomes in New York City”. Economic Inquiry 53, no. 4 (2015):1691-1701.
23
Currie, Janet, and Firouz Gahvari. “Transfers in Cash and In-Kind: Theory Meets the
Data.” Journal of Economic Literature 46, no. 2 (2008): 333-383.
Cunha, Jesse M. “Testing paternalism: Cash versus in-kind transfers.” American
Economic Journal. Applied Economics 6, no. 2 (2014): 195-230
Hoynes, Hilary, Marianne Page, and Ann Huff Stevens. “Can targeted transfers improve
birth outcomes?: Evidence from the introduction of the WIC program.” Journal of
Public Economics 95, no. 7 (2011): 813-827.
Jackson, Margot I. “Early childhood WIC participation, cognitive development and
academic achievement.” Social Science & Medicine 126 (2015): 145-153.
Johnson Paul, Erika Huber, Linda Giannarelli, David Betson , and Grant Lovellette.
“National and state-level estimates of Special Supplemental Nutrition Program for
Women, Infants, and Children (WIC) eligibles and program reach, 2013.” Alexandria,
VA, United States Department of Agriculture Food and Nutrition Service, Office of
Policy Support (2015). URL:
http://www.fns.usda.gov/sites/default/files/ops/WICEligibles2013-Volume1.pdf.
Accessed on March 28, 2016.
Joyce, Ted, Diane Gibson, and Silvie Colman. “The changing association between
prenatal participation in WIC and birth outcomes in New York City.” Journal of Policy
Analysis and Management 24, no. 4 (2005): 661-685.
Joyce, Ted, Andrew Racine, and Cristina Yunzal-Butler. “Reassessing the WIC Effect:
Evidence from the Pregnancy Surveillance System.” Journal of Policy Analysis and
Management 27, no. 2 (2008): 277-303.

24
Kohtari, S.P. and Warner, J.B. Econometrics of Event Studies. Chapter 1 in Handbook of
Corporate Finance: Empirical Corporate Finance, Volume A. Ed. B. Espen Eckbo.
(Elsevier/North-Holland, 2006).
Kreider, Brent, John V. Pepper, and Manan Roy. “Identifying the Effects of WIC on
Food Insecurity Among Infants and Children.” Southern Economic Journal (2016).
DOI: 10.1002/soej.12078.
Lee, Bong Joo, and Lucy Mackey-Bilaver. “Effects of WIC and Food Stamp Program
participation on child outcomes.” Children and Youth Services Review 29, no. 4 (2007):
501-517.
Manchester, Colleen Flaherty, and Kevin J. Mumford. “Welfare stigma due to public
disapproval.” Minneapolis, MN: Department of Applied Economics, University of
Minnesota (2010). URL:
http://citeseerx.ist.psu.edu/viewdoc/download?doi=10.1.1.617.4266&rep=rep1&type=p
df. Accessed on April 5, 2016.
Manchester, Colleen Flaherty, and Kevin J. Mumford. “How Costly is Welfare Stigma?
Separating Psychological Costs from Time Costs in Food Assistance Programs.”
Available at SSRN 1544601 (2011). Manuscript. URL:
http://www.krannert.purdue.edu/faculty/kjmumfor/papers/stigma.pdf. Accessed on
April 12, 2016.
Metallinos-Katsaras, Elizabeth, Kathleen S. Gorman, Parke Wilde, and Jan Kallio. “A
longitudinal study of WIC participation on household food insecurity.” Maternal and
Child Health Journal 15, no. 5 (2011): 627-633.

25
Official USDA Food Plans: Cost of Food at Home at Four Levels, U.S. Average, April
2015. URL: http://www.cnpp.usda.gov/sites/default/files/CostofFoodApr2015.pdf.
Accessed July 22, 2016.
Oliveira, Victor. The Food Assistance Landscape: FY 2015 Annual Report, EIB-150.
U.S. Department of Agriculture, Economic Research Service, March 2016.
Phillips, Diane, Loren Bell, Ruth Morgan, and Jennifer Pooler. “Transition to EBT in
WIC: Review of Impact and Examination of Participant Redemption Patterns.”
Rossin-Slater, Maya. “WIC in your neighborhood: New evidence on the impacts of
geographic access to clinics.” Journal of Public Economics 102 (2013): 51-69.
Robinson, Christina. “Younger siblings can be good for your health: An examination of
spillover benefits from the Supplemental Nutrition Program for Women, Infants, and
Children (WIC).” Journal of Family and Economic Issues 34, no. 2 (2013): 172-184.
WIC EBT Activity, July 2016. URL:
http://www.fns.usda.gov/sites/default/files/wic/July2016EBTStatusColorMap.pdf
Accessed on July 22, 2016
26
Figure 1: WIC Electronic Benefits Transfer Rollout in Ohio

27
Table 1: Timeline for WIC Electronic Benefits Transfer Transition in Ohioa
Pilot Studies January 26, 2015 March 23, 2015 May 1, 2015 July 1, 2015c
Jul 14, 2014b Athens Belmont Adams/Brown Ashtabula
Licking Gallia Carroll Allen Auglaize
Aug 4, 2014b Jackson Coshocton Champaign Butler
Greene Noble Fairfield Clark Crawford
Oct 19, 2014b Pike Guernsey Clermont Cuyahoga
Hocking Vinton Harrison Clinton Darke/Mercer
Meigs, Putnam Washington/Morgan Holmes Defiance Erie/Huron
Jefferson Delaware/Morrow/Union Fulton/Henry
Lawrence Fayette Geauga
Monroe Franklin Hamilton
Muskingum Hancock/Hardin Knox
Perry Highland Lake
Ross/Pickaway Logan Lorain
Scioto Lucas Mahoning
Tuscarawas Madison Marion
Montgomery Medina
Ottawa Miami
Paulding Preble
Shelby Portage/Columbiana
Warren Richland/Ashland
Williams Sandusky
Wood Seneca

28
Wyandot Stark
Summit
Trumbull
Van Wert
Wayne
a. Bolded counties appear in the data.
b. These are the three pilot phase dates. In the October pilot, the EBT transition occurred
sometime during the week of the 19th.
c. Data for this study precedes this rollout date
29
Table 2: County Demographics by WIC Electronic Benefits Transfer Rollout Date (standard deviation in parenthesesa)
EBT Rollout Date Percent Caucasian % with College Degree Per Capita Income % in Poverty Population Density
July 14, 2014b 92.90% 22.60% $27,082.00 13.50% 243.9
-- -- -- -- --
August 4, 2014b 86.60% 36.90% $30,629.00 13.20% 390.5
-- -- -- -- --
October 19, 2014b 96.83% 15.27% $22,136.67 15.97% 65.5
(0.175) (0.360) (3564.617) (0.366) (7.250)
January 29, 2015 95.30% 14.71% $20,313.88 21.46% 67.8
(0.212) (0.354) (2047.160) (0.411) (31.484)
March 23, 2015 95.03% 13.79% $21,980.69 16.68% 115.8
(0.217) (0.345) (2258.433) (0.373) (59.384)
May 1, 2015 91.71% 20.29% $24,954.19 14.04% 314.2
(0.276) (0.402) (4711.970) (0.347) (477.890)
July 1, 2015c 91.05% 20.15% $25,083.97 14.04% 447.4
(0.285) (0.401) (3325.461) (0.347) (595.480)
a. The first two rollouts in 2014 included one county each, thus there is no standard deviation
b. These are the three pilot phase dates. In the October pilot, the EBT transition occurred sometime during the week of the 19th.
c. Data for this study precedes this rollout date
30
Table 3: WIC EBT Impact on Enrollment (standard errors in parentheses)
Share of
State
Population Share of WIC Enrollment
WIC
Enrollment Children
Fully Breast
Fed Infants
Fully
Formula
Fed Infants
Partially
Breast Fed
Infants
Post-
Partum
Women
Pregnant
Women
Women Fully
Breast Feeding
Infant
Women Partially
Breast Feeding
Infant
T-6 0.14%** -1.52% 0.14% 1.48% -0.23% 0.43% 0.06% -0.03% -0.33%**
(0.001) (0.011) (0.003) (0.013) (0.010) (0.003) (0.003) (0.001) (0.001)
T-5 0.14%** -1.16% 0.11% 1.11% 0.00% 0.29% -0.03% -0.05% -0.28%*
(0.001) (0.010) (0.003) (0.012) (0.009) (0.003) (0.003) (0.001) (0.001)
T-4 0.12%* -1.39% 0.06% 1.10% 0.11% 0.38% -0.06% -0.03% -0.16%
(0.001) (0.011) (0.003) (0.012) (0.010) (0.003) (0.003) (0.001) (0.001)
T-3 0.10% -1.32% 0.12% 0.96% 0.13% 0.31% -0.08% -0.02% -0.11%
(0.001) (0.010) (0.003) (0.012) (0.009) (0.003) (0.003) (0.001) (0.001)
T-2 0.01% -0.18% -0.08% -0.64% 0.93% -0.02% 0.11% -0.06% -0.06%
(0.001) (0.010) (0.003) (0.012) (0.009) (0.003) (0.003) (0.001) (0.001)
T-1 0.03% -0.23% 0.00% -0.15% 0.37% 0.03% -0.01% 0.00% -0.01%
(0.001) (0.010) (0.003) (0.012) (0.009) (0.003) (0.003) (0.001) (0.001)
T+1 0.01% -0.90% 0.29% 1.20% -0.68% 0.11% -0.09% 0.09% -0.01%
31
(0.001) (0.010) (0.002) (0.012) (0.009) (0.003) (0.003) (0.001) (0.001)
T+2 -0.01% -0.84% 0.29% 1.51% -0.92% 0.17% -0.19% 0.12% -0.14%
(0.001) (0.010) (0.002) (0.012) (0.009) (0.003) (0.003) (0.001) (0.001)
T+3 0.01% -1.34% 0.37% 2.12%* -1.36% 0.34% -0.15% 0.18% -0.16%
(0.001) (0.010) (0.002) (0.012) (0.009) (0.003) (0.003) (0.001) (0.001)
T+4 0.01% -1.61% 0.33% 2.11%* -1.05% 0.28% 0.01% 0.19% -0.27%*
(0.001) (0.011) (0.003) (0.012) (0.010) (0.003) (0.003) (0.001) (0.001)
T+5 -0.03% -1.57% 0.51%* 2.23%* -1.39% 0.18% 0.09% 0.231%* -0.28%*
(0.001) (0.011) (0.003) (0.013) (0.010) (0.003) (0.003) (0.001) (0.002)
T+6 -0.01% -2.11%* 0.79%*** 2.45%* -1.37% -0.19% 0.28% 0.36%** -0.21%
(0.001) (0.012) (0.003) (0.013) (0.011) (0.003) (0.003) (0.001) (0.002)
Constant 2.01%*** 53.2%*** 2.30%*** 17.1%*** 04.00%*** 7.82%*** 9.83%*** 2.45%*** 3.22%***
(0.001) (0.012) (0.003) (0.013) (0.011) (0.003) (0.003) (0.001) (0.002)
N 63 63 63 63 63 63 63 63 63
Results are from fixed effects regression with month and state fixed effects and robust standard errors.
*p<0.1. **p<0.05. ***p<0.01.
32
Table 4: WIC Food Expenditures with Five Month Event Horizon(standard errors in
parentheses)
All WIC
Redemptions
WIC
Redemptions
in Grocery
WIC
Redemptions
in Produce
WIC Redemptions in Baby
Formula
T-5 -$5.34*** -$2.78*** -$0.55*** -$0.96
(1.929) (0.727) (0.164) (1.664)
T-4 -$2.75 -$2.38*** -$0.71*** $0.74
(1.890) (0.714) (0.167) (1.613)
T-3 -$2.35 -$1.34* -$0.26 $0.17
(2.074) (0.773) (0.180) (1.772)
T-2 -$2.45 -$0.99* -$0.45*** -$0.75
(1.518) (0.559) (0.142) (1.309)
T-1 -$1.66 -$0.36 -$0.01 -$0.65
(1.938) (0.733) (0.170) (1.663)
T+1 -$1.73 -$0.28 $0.25 -$0.96
(1.914) (0.713) (0.167) (1.625)
T+2 $3.69** $0.85 -$0.02 $1.46
(1.707) (0.612) (0.154) (1.434)
T+3 $9.49*** $2.61*** $0.07 $3.10*
(2.230) (0.806) (0.181) (1.852)
T+4 $14.33*** $4.21*** $0.03 $3.58*
(2.410) (0.898) (0.185) (1.915)
T+5 $17.14*** $4.42*** -$0.25 $5.14**
(2.822) (1.030) (0.206) (2.264)

33
Constant $50.65*** $25.91*** $4.93*** $16.95***
(2.411) (0.950) (0.216) (2.024)
N 91013 91013 91013 91013
Results are from OLS regression with month and county fixed effects and robust standard errors. A five-
month event horizon indicates that we include in the regression five months before and after the reference
month.
*p<0.1. **p<0.05. ***p<0.01.
34
Table 5: Non-WIC Food Expenditures with Five Month Event Horizon(standard errors in
parentheses)
Non-WIC
Purchases
Non-WIC
Grocery
Non-WIC
Produce
Non-WIC
Health/Beauty
Care
T-5 -$41.00*** -18.84*** -4.002*** -7.104***
(9.890) (6.117) (0.836) (1.672)
T-4 -$44.06*** -20.88*** -3.459*** -6.258***
(10.770) (6.798) (0.886) (1.615)
T-3 -$29.13*** -15.94** -2.652*** -3.425**
(10.900) (6.824) (0.918) (1.685)
T-2 -$23.13** -$11.65 -2.481*** -2.960**
(11.260) (7.345) (0.944) (1.293)
T-1 -$9.93 -$4.37 -$1.35 -$1.08
(10.930) (6.924) (0.942) (1.562)
T+1 $4.26 -$0.08 $0.66 $0.95
(9.831) (6.113) (0.852) (1.525)
T+2 $8.33 $2.30 1.407* 2.985**
(9.404) (5.840) (0.775) (1.393)
T+3 $14.92 $7.20 2.421** 3.583**
(10.930) (6.774) (0.945) (1.768)
T+4 $15.50 $7.53 3.390*** 5.157***
(10.920) (6.655) (0.931) (1.925)
T+5 $28.16** 16.94** 4.706*** 6.594***
(13.450) (8.324) (1.144) (2.248)
Constant $487.90*** 287.2*** 35.89*** 45.14***

35
(13.050) (8.105) (1.099) (2.080)
N 91013 91013 91013 91013
Results are from OLS regression with month and county fixed effects and robust standard errors. A five-
month event horizon indicates that we include in the regression five months before and after the reference
month.
*p<0.1. **p<0.05. ***p<0.01.
From Paper to Plastic: Understanding the Impact of EBT on WIC Recipient Behavior
Supplemental Tables
Table 1: WIC Food Expenditures with One Month Event Horizon
All WIC Redemptions
WIC Redemptions in Grocery
WIC Redemptions
in Produce
WIC Redemptions in Baby Formula
T-1 $0.91 $3.636** $0.06 -$2.68 (4.056) (1.592) (0.356) (3.614)
T+1 -$2.26 $0.23 $0.07 -$2.52 (4.124) (1.600) (0.364) (3.653)
Constant $57.04*** $27.18*** $5.378*** $22.28*** (3.434) (1.511) (0.340) (2.835)
Month Fixed Effect Y Y Y Y
County Fixed Effect
Y Y Y Y
N 35656 35656 35656 35656 Results are from OLS regression with month and county fixed effects and robust standard errors. A one-month event horizon indicates that we include in the regression one month before and after the reference month. *p<0.1. **p<0.05. ***p<0.01.
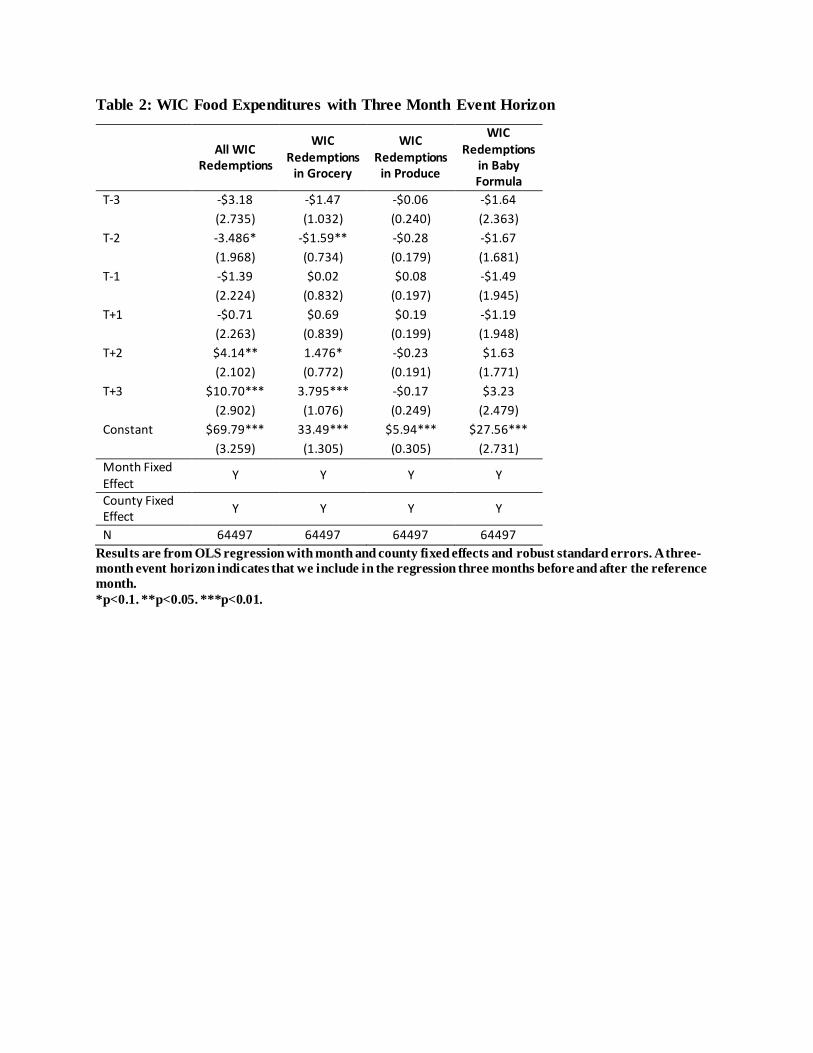
Table 2: WIC Food Expenditures with Three Month Event Horizon
All WIC Redemptions
WIC Redemptions
in Grocery
WIC Redemptions
in Produce
WIC Redemptions
in Baby Formula
T-3 -$3.18 -$1.47 -$0.06 -$1.64 (2.735) (1.032) (0.240) (2.363)
T-2 -3.486* -$1.59** -$0.28 -$1.67 (1.968) (0.734) (0.179) (1.681)
T-1 -$1.39 $0.02 $0.08 -$1.49 (2.224) (0.832) (0.197) (1.945)
T+1 -$0.71 $0.69 $0.19 -$1.19 (2.263) (0.839) (0.199) (1.948)
T+2 $4.14** 1.476* -$0.23 $1.63 (2.102) (0.772) (0.191) (1.771)
T+3 $10.70*** 3.795*** -$0.17 $3.23 (2.902) (1.076) (0.249) (2.479)
Constant $69.79*** 33.49*** $5.94*** $27.56*** (3.259) (1.305) (0.305) (2.731)
Month Fixed Effect
Y Y Y Y
County Fixed Effect Y Y Y Y
N 64497 64497 64497 64497 Results are from OLS regression with month and county fixed effects and robust standard errors. A three-month event horizon indicates that we include in the regression three months before and after the reference month. *p<0.1. **p<0.05. ***p<0.01.
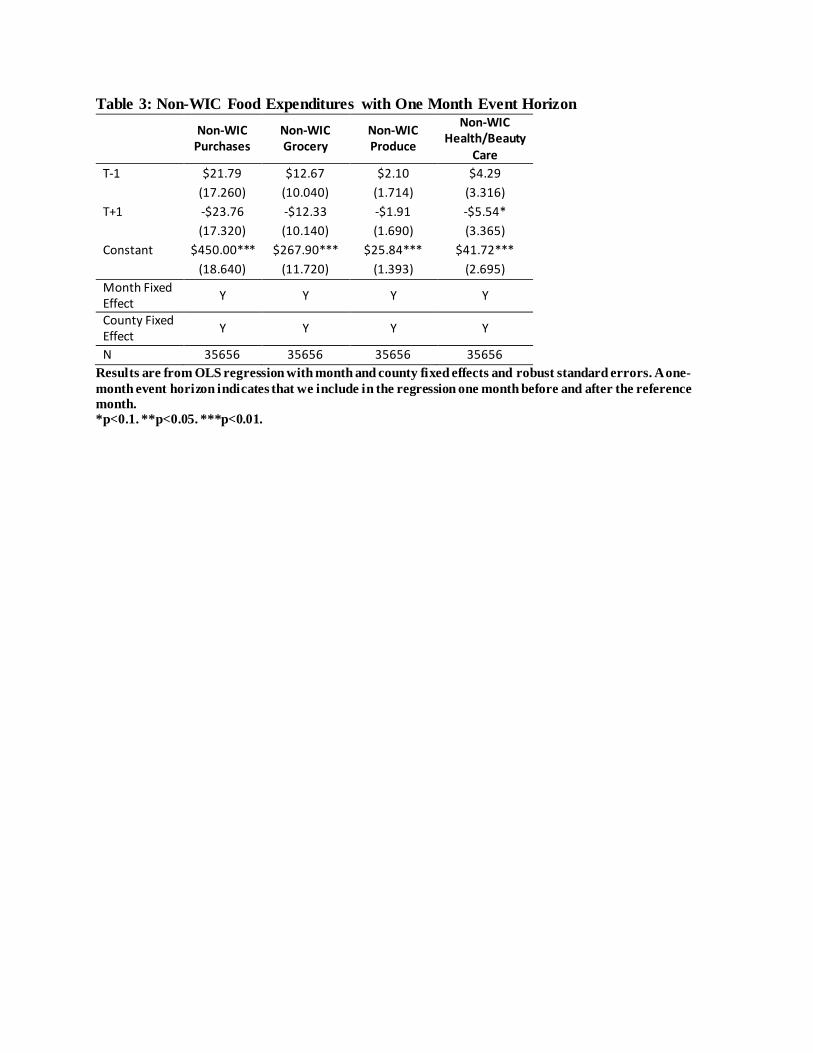
Table 3: Non-WIC Food Expenditures with One Month Event Horizon
Non-WIC Purchases
Non-WIC Grocery
Non-WIC Produce
Non-WIC Health/Beauty
Care T-1 $21.79 $12.67 $2.10 $4.29
(17.260) (10.040) (1.714) (3.316) T+1 -$23.76 -$12.33 -$1.91 -$5.54*
(17.320) (10.140) (1.690) (3.365) Constant $450.00*** $267.90*** $25.84*** $41.72***
(18.640) (11.720) (1.393) (2.695) Month Fixed Effect Y Y Y Y
County Fixed Effect Y Y Y Y
N 35656 35656 35656 35656 Results are from OLS regression with month and county fixed effects and robust standard errors. A one-month event horizon indicates that we include in the regression one month before and after the reference month. *p<0.1. **p<0.05. ***p<0.01.
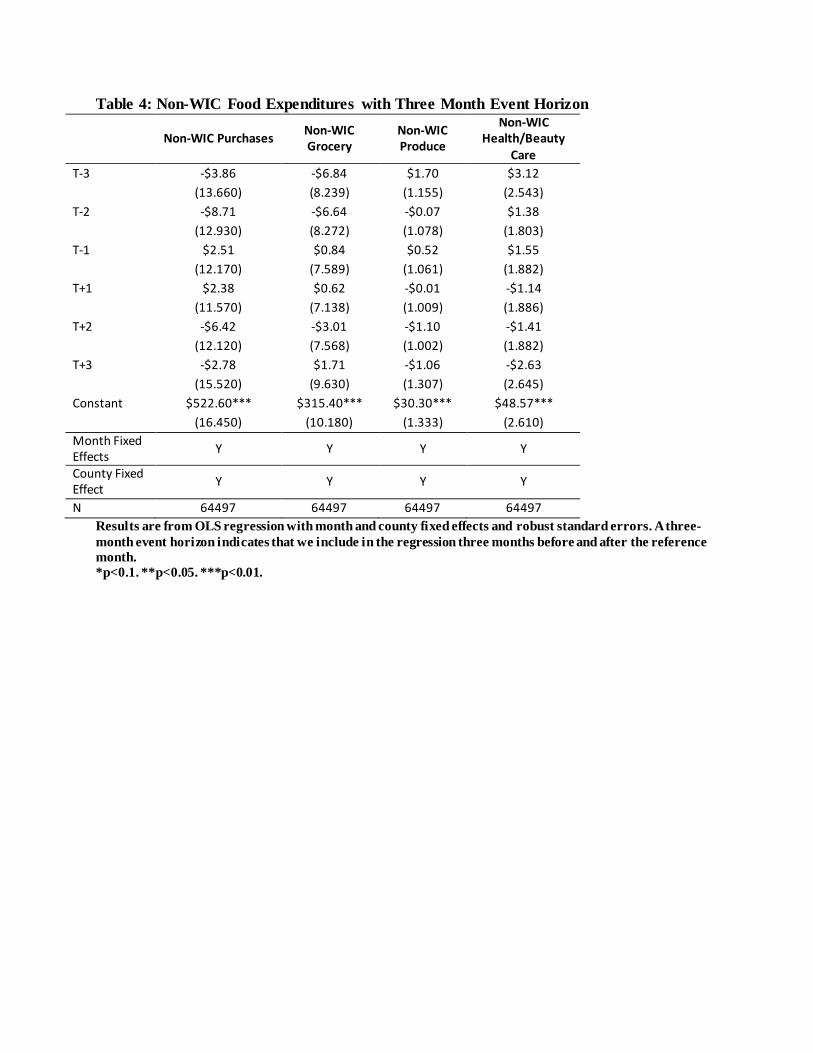
Table 4: Non-WIC Food Expenditures with Three Month Event Horizon
Non-WIC Purchases Non-WIC Grocery
Non-WIC Produce
Non-WIC Health/Beauty
Care T-3 -$3.86 -$6.84 $1.70 $3.12
(13.660) (8.239) (1.155) (2.543) T-2 -$8.71 -$6.64 -$0.07 $1.38
(12.930) (8.272) (1.078) (1.803) T-1 $2.51 $0.84 $0.52 $1.55
(12.170) (7.589) (1.061) (1.882) T+1 $2.38 $0.62 -$0.01 -$1.14
(11.570) (7.138) (1.009) (1.886) T+2 -$6.42 -$3.01 -$1.10 -$1.41
(12.120) (7.568) (1.002) (1.882) T+3 -$2.78 $1.71 -$1.06 -$2.63
(15.520) (9.630) (1.307) (2.645) Constant $522.60*** $315.40*** $30.30*** $48.57***
(16.450) (10.180) (1.333) (2.610) Month Fixed Effects Y Y Y Y
County Fixed Effect Y Y Y Y
N 64497 64497 64497 64497 Results are from OLS regression with month and county fixed effects and robust standard errors. A three-month event horizon indicates that we include in the regression three months before and after the reference month. *p<0.1. **p<0.05. ***p<0.01.
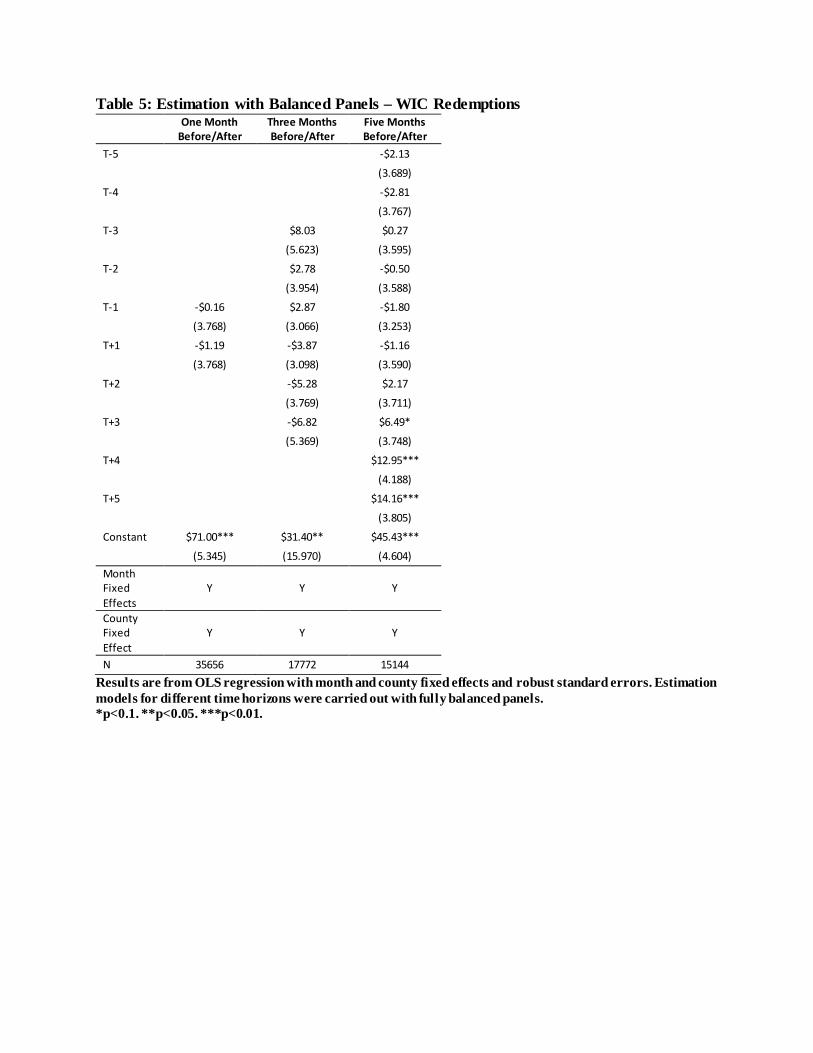
Table 5: Estimation with Balanced Panels – WIC Redemptions One Month
Before/After Three Months Before/After
Five Months Before/After
T-5 -$2.13 (3.689)
T-4 -$2.81 (3.767)
T-3 $8.03 $0.27 (5.623) (3.595)
T-2 $2.78 -$0.50 (3.954) (3.588)
T-1 -$0.16 $2.87 -$1.80 (3.768) (3.066) (3.253)
T+1 -$1.19 -$3.87 -$1.16 (3.768) (3.098) (3.590)
T+2 -$5.28 $2.17 (3.769) (3.711)
T+3 -$6.82 $6.49* (5.369) (3.748)
T+4 $12.95*** (4.188)
T+5 $14.16*** (3.805)
Constant $71.00*** $31.40** $45.43*** (5.345) (15.970) (4.604)
Month Fixed Effects
Y Y Y
County Fixed Effect
Y Y Y
N 35656 17772 15144 Results are from OLS regression with month and county fixed effects and robust standard errors. Estimation models for different time horizons were carried out with fully balanced panels. *p<0.1. **p<0.05. ***p<0.01.
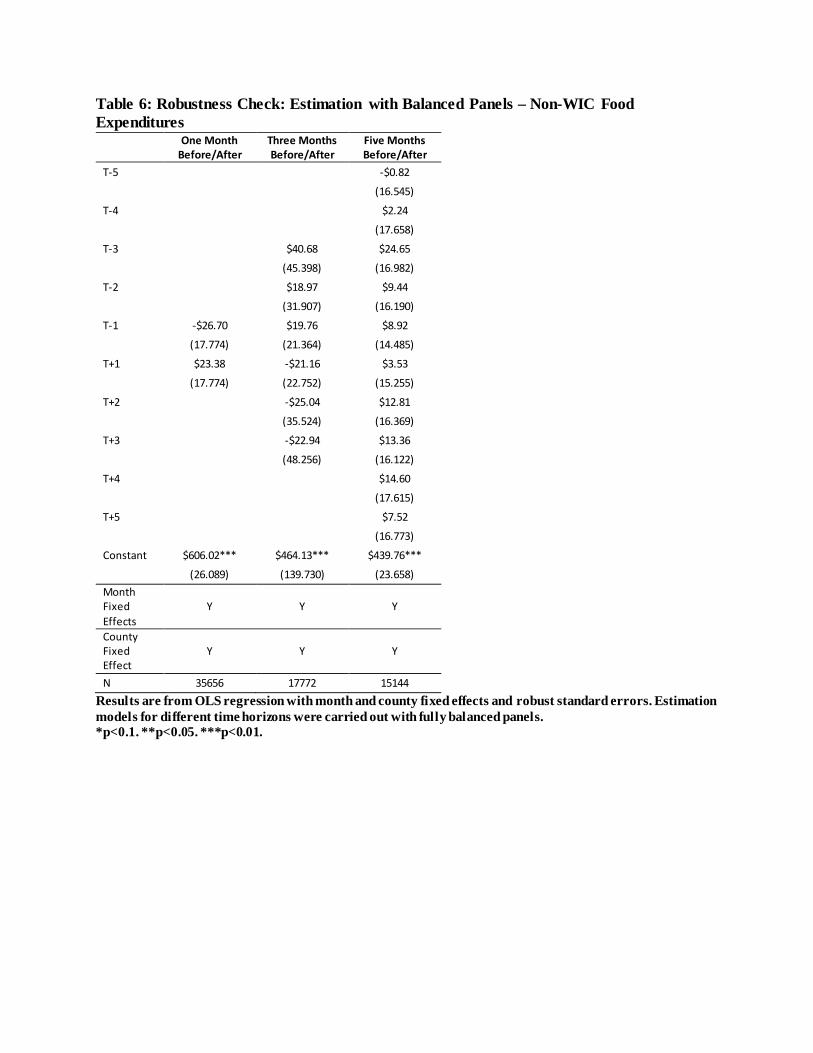
Table 6: Robustness Check: Estimation with Balanced Panels – Non-WIC Food Expenditures
One Month Before/After
Three Months Before/After
Five Months Before/After
T-5 -$0.82 (16.545)
T-4 $2.24 (17.658)
T-3 $40.68 $24.65 (45.398) (16.982)
T-2 $18.97 $9.44 (31.907) (16.190)
T-1 -$26.70 $19.76 $8.92 (17.774) (21.364) (14.485)
T+1 $23.38 -$21.16 $3.53 (17.774) (22.752) (15.255)
T+2 -$25.04 $12.81 (35.524) (16.369)
T+3 -$22.94 $13.36 (48.256) (16.122)
T+4 $14.60 (17.615)
T+5 $7.52 (16.773)
Constant $606.02*** $464.13*** $439.76*** (26.089) (139.730) (23.658)
Month Fixed Effects
Y Y Y
County Fixed Effect
Y Y Y
N 35656 17772 15144 Results are from OLS regression with month and county fixed effects and robust standard errors. Estimation models for different time horizons were carried out with fully balanced panels. *p<0.1. **p<0.05. ***p<0.01.
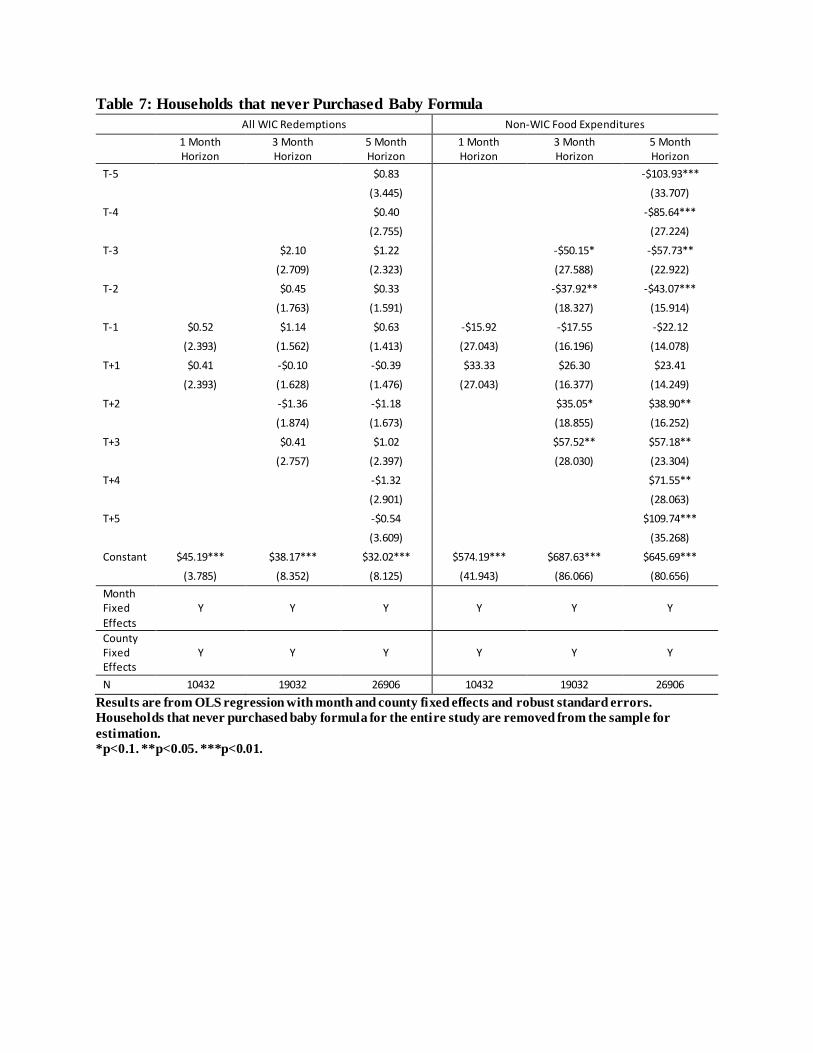
Table 7: Households that never Purchased Baby Formula All WIC Redemptions Non-WIC Food Expenditures
1 Month Horizon
3 Month Horizon
5 Month Horizon
1 Month Horizon
3 Month Horizon
5 Month Horizon
T-5 $0.83 -$103.93*** (3.445) (33.707)
T-4 $0.40 -$85.64*** (2.755) (27.224)
T-3 $2.10 $1.22 -$50.15* -$57.73** (2.709) (2.323) (27.588) (22.922)
T-2 $0.45 $0.33 -$37.92** -$43.07*** (1.763) (1.591) (18.327) (15.914)
T-1 $0.52 $1.14 $0.63 -$15.92 -$17.55 -$22.12 (2.393) (1.562) (1.413) (27.043) (16.196) (14.078)
T+1 $0.41 -$0.10 -$0.39 $33.33 $26.30 $23.41 (2.393) (1.628) (1.476) (27.043) (16.377) (14.249)
T+2 -$1.36 -$1.18 $35.05* $38.90** (1.874) (1.673) (18.855) (16.252)
T+3 $0.41 $1.02 $57.52** $57.18** (2.757) (2.397) (28.030) (23.304)
T+4 -$1.32 $71.55** (2.901) (28.063)
T+5 -$0.54 $109.74*** (3.609) (35.268)
Constant $45.19*** $38.17*** $32.02*** $574.19*** $687.63*** $645.69*** (3.785) (8.352) (8.125) (41.943) (86.066) (80.656)
Month Fixed Effects
Y Y Y Y Y Y
County Fixed Effects
Y Y Y Y Y Y
N 10432 19032 26906 10432 19032 26906 Results are from OLS regression with month and county fixed effects and robust standard errors. Households that never purchased baby formula for the entire study are removed from the sample for estimation. *p<0.1. **p<0.05. ***p<0.01.
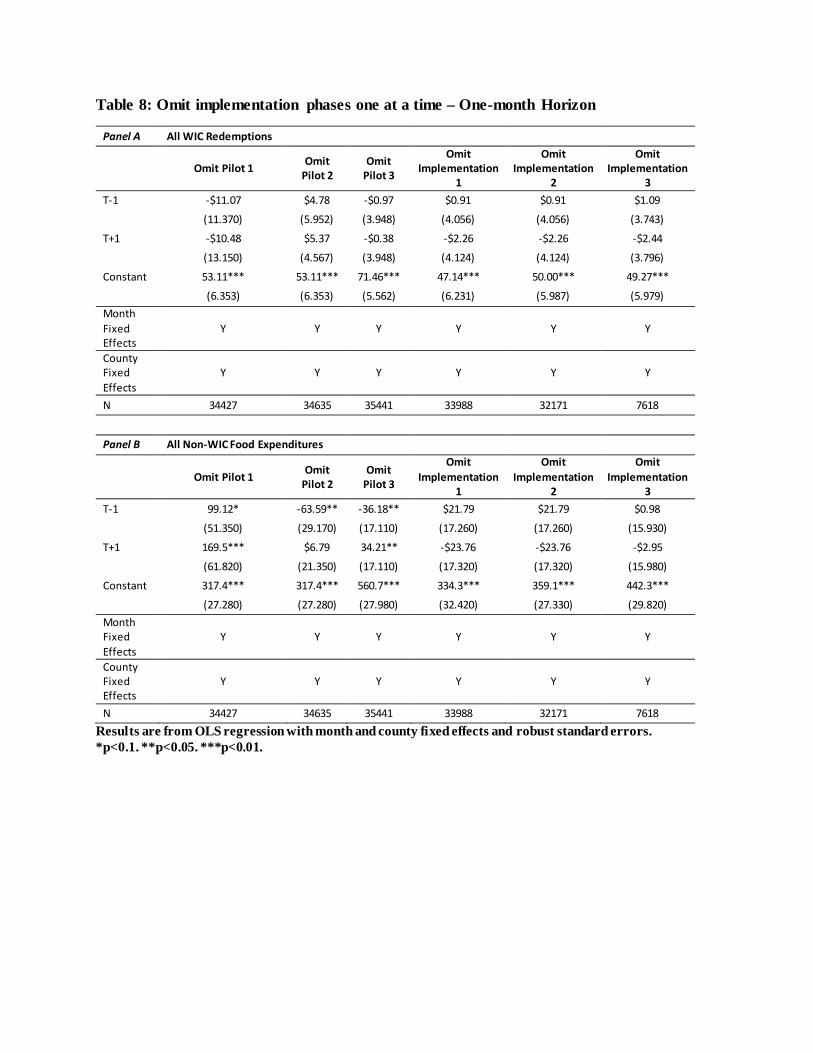
Table 8: Omit implementation phases one at a time – One-month Horizon
Panel A All WIC Redemptions
Omit Pilot 1 Omit Pilot 2
Omit Pilot 3
Omit Implementation
1
Omit Implementation
2
Omit Implementation
3 T-1 -$11.07 $4.78 -$0.97 $0.91 $0.91 $1.09
(11.370) (5.952) (3.948) (4.056) (4.056) (3.743)
T+1 -$10.48 $5.37 -$0.38 -$2.26 -$2.26 -$2.44 (13.150) (4.567) (3.948) (4.124) (4.124) (3.796)
Constant 53.11*** 53.11*** 71.46*** 47.14*** 50.00*** 49.27*** (6.353) (6.353) (5.562) (6.231) (5.987) (5.979)
Month Fixed Effects
Y Y Y Y Y Y
County Fixed Effects
Y Y Y Y Y Y
N 34427 34635 35441 33988 32171 7618
Panel B All Non-WIC Food Expenditures
Omit Pilot 1 Omit Pilot 2
Omit Pilot 3
Omit Implementation
1
Omit Implementation
2
Omit Implementation
3 T-1 99.12* -63.59** -36.18** $21.79 $21.79 $0.98
(51.350) (29.170) (17.110) (17.260) (17.260) (15.930)
T+1 169.5*** $6.79 34.21** -$23.76 -$23.76 -$2.95 (61.820) (21.350) (17.110) (17.320) (17.320) (15.980)
Constant 317.4*** 317.4*** 560.7*** 334.3*** 359.1*** 442.3*** (27.280) (27.280) (27.980) (32.420) (27.330) (29.820)
Month Fixed Effects
Y Y Y Y Y Y
County Fixed Effects
Y Y Y Y Y Y
N 34427 34635 35441 33988 32171 7618 Results are from OLS regression with month and county fixed effects and robust standard errors. *p<0.1. **p<0.05. ***p<0.01.
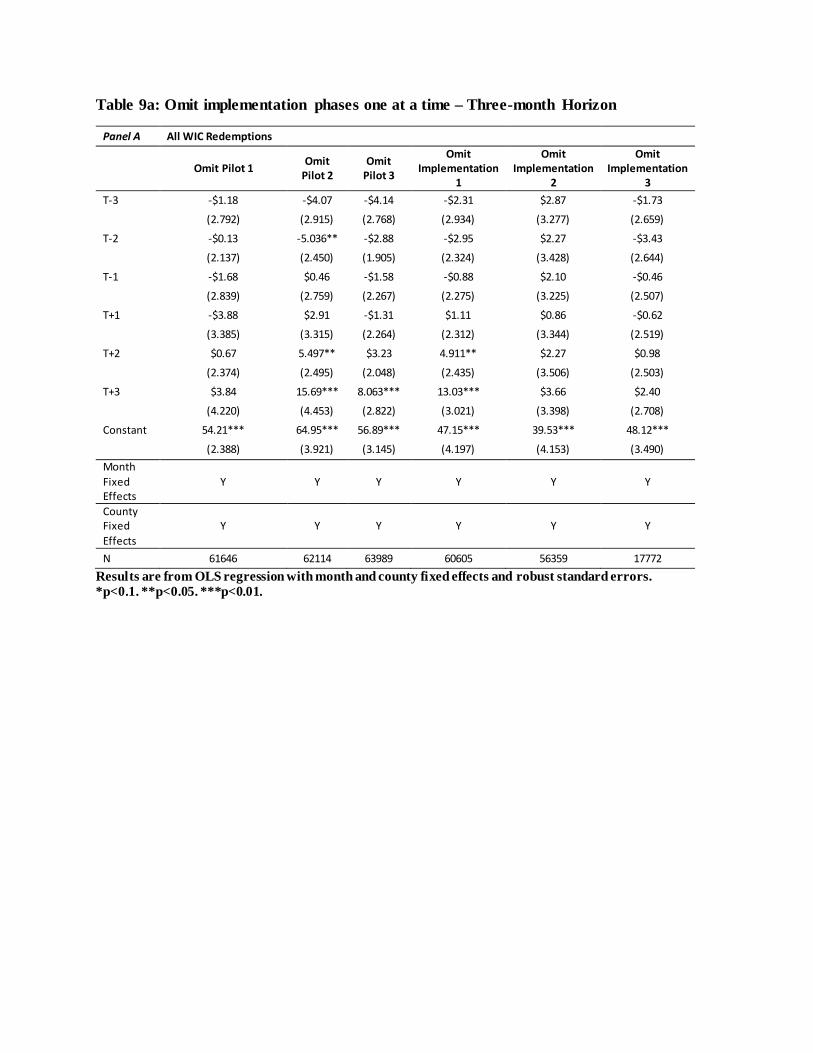
Table 9a: Omit implementation phases one at a time – Three-month Horizon
Panel A All WIC Redemptions
Omit Pilot 1 Omit Pilot 2
Omit Pilot 3
Omit Implementation
1
Omit Implementation
2
Omit Implementation
3 T-3 -$1.18 -$4.07 -$4.14 -$2.31 $2.87 -$1.73
(2.792) (2.915) (2.768) (2.934) (3.277) (2.659)
T-2 -$0.13 -5.036** -$2.88 -$2.95 $2.27 -$3.43 (2.137) (2.450) (1.905) (2.324) (3.428) (2.644)
T-1 -$1.68 $0.46 -$1.58 -$0.88 $2.10 -$0.46 (2.839) (2.759) (2.267) (2.275) (3.225) (2.507)
T+1 -$3.88 $2.91 -$1.31 $1.11 $0.86 -$0.62 (3.385) (3.315) (2.264) (2.312) (3.344) (2.519)
T+2 $0.67 5.497** $3.23 4.911** $2.27 $0.98 (2.374) (2.495) (2.048) (2.435) (3.506) (2.503)
T+3 $3.84 15.69*** 8.063*** 13.03*** $3.66 $2.40 (4.220) (4.453) (2.822) (3.021) (3.398) (2.708)
Constant 54.21*** 64.95*** 56.89*** 47.15*** 39.53*** 48.12*** (2.388) (3.921) (3.145) (4.197) (4.153) (3.490)
Month Fixed Effects
Y Y Y Y Y Y
County Fixed Effects
Y Y Y Y Y Y
N 61646 62114 63989 60605 56359 17772 Results are from OLS regression with month and county fixed effects and robust standard errors. *p<0.1. **p<0.05. ***p<0.01.
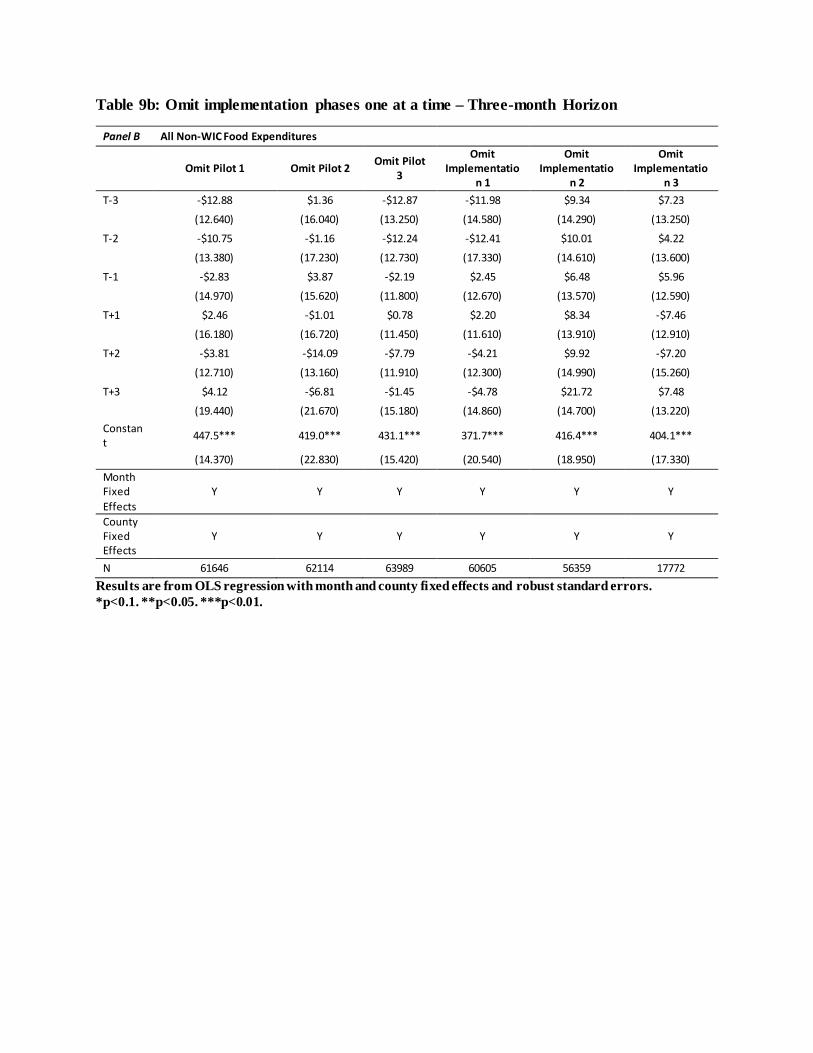
Table 9b: Omit implementation phases one at a time – Three-month Horizon
Panel B All Non-WIC Food Expenditures
Omit Pilot 1 Omit Pilot 2 Omit Pilot 3
Omit Implementatio
n 1
Omit Implementatio
n 2
Omit Implementatio
n 3 T-3 -$12.88 $1.36 -$12.87 -$11.98 $9.34 $7.23
(12.640) (16.040) (13.250) (14.580) (14.290) (13.250)
T-2 -$10.75 -$1.16 -$12.24 -$12.41 $10.01 $4.22 (13.380) (17.230) (12.730) (17.330) (14.610) (13.600)
T-1 -$2.83 $3.87 -$2.19 $2.45 $6.48 $5.96 (14.970) (15.620) (11.800) (12.670) (13.570) (12.590)
T+1 $2.46 -$1.01 $0.78 $2.20 $8.34 -$7.46 (16.180) (16.720) (11.450) (11.610) (13.910) (12.910)
T+2 -$3.81 -$14.09 -$7.79 -$4.21 $9.92 -$7.20 (12.710) (13.160) (11.910) (12.300) (14.990) (15.260)
T+3 $4.12 -$6.81 -$1.45 -$4.78 $21.72 $7.48 (19.440) (21.670) (15.180) (14.860) (14.700) (13.220)
Constant 447.5*** 419.0*** 431.1*** 371.7*** 416.4*** 404.1***
(14.370) (22.830) (15.420) (20.540) (18.950) (17.330) Month Fixed Effects
Y Y Y Y Y Y
County Fixed Effects
Y Y Y Y Y Y
N 61646 62114 63989 60605 56359 17772 Results are from OLS regression with month and county fixed effects and robust standard errors. *p<0.1. **p<0.05. ***p<0.01.
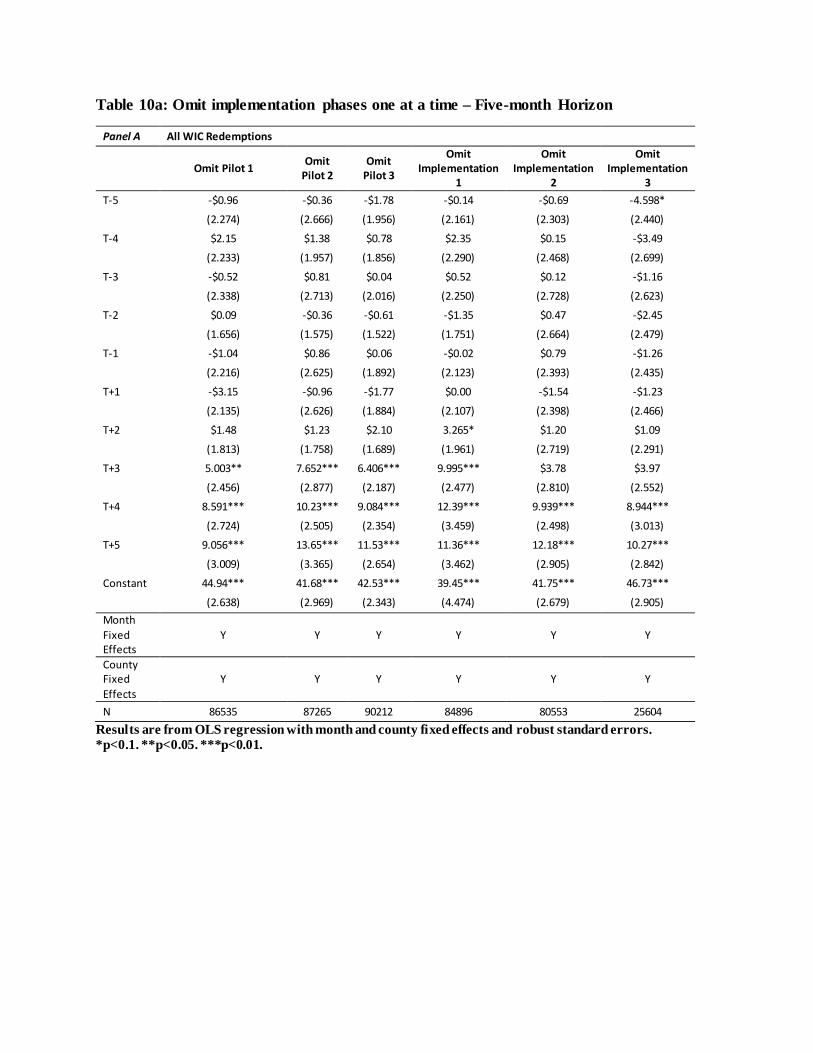
Table 10a: Omit implementation phases one at a time – Five-month Horizon
Panel A All WIC Redemptions
Omit Pilot 1 Omit Pilot 2
Omit Pilot 3
Omit Implementation
1
Omit Implementation
2
Omit Implementation
3 T-5 -$0.96 -$0.36 -$1.78 -$0.14 -$0.69 -4.598*
(2.274) (2.666) (1.956) (2.161) (2.303) (2.440)
T-4 $2.15 $1.38 $0.78 $2.35 $0.15 -$3.49 (2.233) (1.957) (1.856) (2.290) (2.468) (2.699)
T-3 -$0.52 $0.81 $0.04 $0.52 $0.12 -$1.16 (2.338) (2.713) (2.016) (2.250) (2.728) (2.623)
T-2 $0.09 -$0.36 -$0.61 -$1.35 $0.47 -$2.45 (1.656) (1.575) (1.522) (1.751) (2.664) (2.479)
T-1 -$1.04 $0.86 $0.06 -$0.02 $0.79 -$1.26 (2.216) (2.625) (1.892) (2.123) (2.393) (2.435)
T+1 -$3.15 -$0.96 -$1.77 $0.00 -$1.54 -$1.23 (2.135) (2.626) (1.884) (2.107) (2.398) (2.466)
T+2 $1.48 $1.23 $2.10 3.265* $1.20 $1.09 (1.813) (1.758) (1.689) (1.961) (2.719) (2.291)
T+3 5.003** 7.652*** 6.406*** 9.995*** $3.78 $3.97 (2.456) (2.877) (2.187) (2.477) (2.810) (2.552)
T+4 8.591*** 10.23*** 9.084*** 12.39*** 9.939*** 8.944*** (2.724) (2.505) (2.354) (3.459) (2.498) (3.013)
T+5 9.056*** 13.65*** 11.53*** 11.36*** 12.18*** 10.27*** (3.009) (3.365) (2.654) (3.462) (2.905) (2.842)
Constant 44.94*** 41.68*** 42.53*** 39.45*** 41.75*** 46.73*** (2.638) (2.969) (2.343) (4.474) (2.679) (2.905)
Month Fixed Effects
Y Y Y Y Y Y
County Fixed Effects
Y Y Y Y Y Y
N 86535 87265 90212 84896 80553 25604 Results are from OLS regression with month and county fixed effects and robust standard errors. *p<0.1. **p<0.05. ***p<0.01.
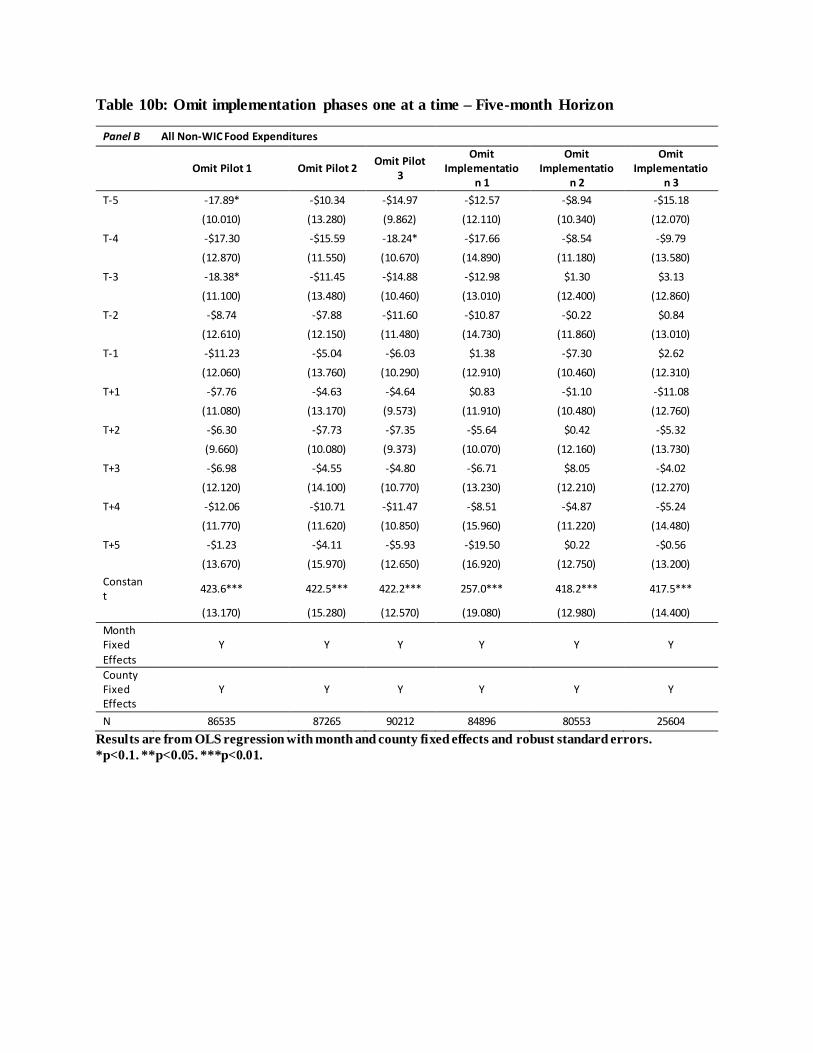
Table 10b: Omit implementation phases one at a time – Five-month Horizon
Panel B All Non-WIC Food Expenditures
Omit Pilot 1 Omit Pilot 2 Omit Pilot 3
Omit Implementatio
n 1
Omit Implementatio
n 2
Omit Implementatio
n 3 T-5 -17.89* -$10.34 -$14.97 -$12.57 -$8.94 -$15.18
(10.010) (13.280) (9.862) (12.110) (10.340) (12.070)
T-4 -$17.30 -$15.59 -18.24* -$17.66 -$8.54 -$9.79 (12.870) (11.550) (10.670) (14.890) (11.180) (13.580)
T-3 -18.38* -$11.45 -$14.88 -$12.98 $1.30 $3.13 (11.100) (13.480) (10.460) (13.010) (12.400) (12.860)
T-2 -$8.74 -$7.88 -$11.60 -$10.87 -$0.22 $0.84 (12.610) (12.150) (11.480) (14.730) (11.860) (13.010)
T-1 -$11.23 -$5.04 -$6.03 $1.38 -$7.30 $2.62 (12.060) (13.760) (10.290) (12.910) (10.460) (12.310)
T+1 -$7.76 -$4.63 -$4.64 $0.83 -$1.10 -$11.08 (11.080) (13.170) (9.573) (11.910) (10.480) (12.760)
T+2 -$6.30 -$7.73 -$7.35 -$5.64 $0.42 -$5.32 (9.660) (10.080) (9.373) (10.070) (12.160) (13.730)
T+3 -$6.98 -$4.55 -$4.80 -$6.71 $8.05 -$4.02 (12.120) (14.100) (10.770) (13.230) (12.210) (12.270)
T+4 -$12.06 -$10.71 -$11.47 -$8.51 -$4.87 -$5.24 (11.770) (11.620) (10.850) (15.960) (11.220) (14.480)
T+5 -$1.23 -$4.11 -$5.93 -$19.50 $0.22 -$0.56 (13.670) (15.970) (12.650) (16.920) (12.750) (13.200)
Constant 423.6*** 422.5*** 422.2*** 257.0*** 418.2*** 417.5***
(13.170) (15.280) (12.570) (19.080) (12.980) (14.400) Month Fixed Effects
Y Y Y Y Y Y
County Fixed Effects
Y Y Y Y Y Y
N 86535 87265 90212 84896 80553 25604 Results are from OLS regression with month and county fixed effects and robust standard errors. *p<0.1. **p<0.05. ***p<0.01.
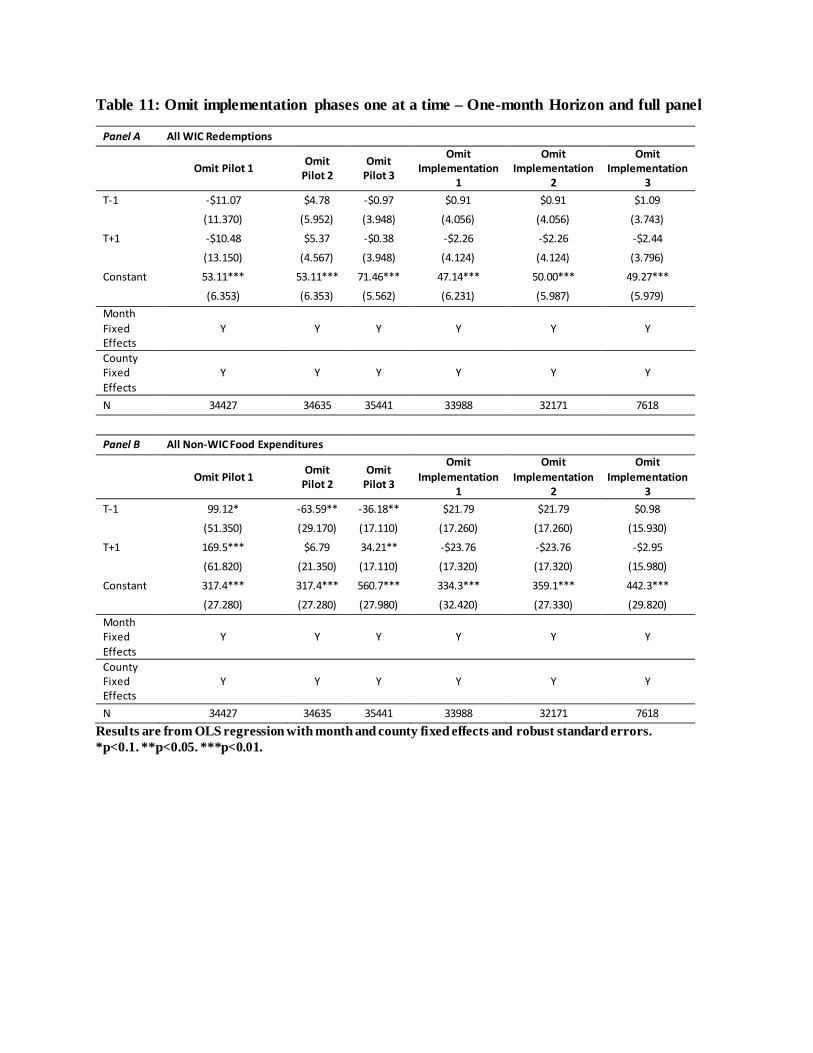
Table 11: Omit implementation phases one at a time – One-month Horizon and full panel
Panel A All WIC Redemptions
Omit Pilot 1 Omit Pilot 2
Omit Pilot 3
Omit Implementation
1
Omit Implementation
2
Omit Implementation
3 T-1 -$11.07 $4.78 -$0.97 $0.91 $0.91 $1.09
(11.370) (5.952) (3.948) (4.056) (4.056) (3.743)
T+1 -$10.48 $5.37 -$0.38 -$2.26 -$2.26 -$2.44 (13.150) (4.567) (3.948) (4.124) (4.124) (3.796)
Constant 53.11*** 53.11*** 71.46*** 47.14*** 50.00*** 49.27*** (6.353) (6.353) (5.562) (6.231) (5.987) (5.979)
Month Fixed Effects
Y Y Y Y Y Y
County Fixed Effects
Y Y Y Y Y Y
N 34427 34635 35441 33988 32171 7618
Panel B All Non-WIC Food Expenditures
Omit Pilot 1 Omit Pilot 2
Omit Pilot 3
Omit Implementation
1
Omit Implementation
2
Omit Implementation
3 T-1 99.12* -63.59** -36.18** $21.79 $21.79 $0.98
(51.350) (29.170) (17.110) (17.260) (17.260) (15.930)
T+1 169.5*** $6.79 34.21** -$23.76 -$23.76 -$2.95 (61.820) (21.350) (17.110) (17.320) (17.320) (15.980)
Constant 317.4*** 317.4*** 560.7*** 334.3*** 359.1*** 442.3*** (27.280) (27.280) (27.980) (32.420) (27.330) (29.820)
Month Fixed Effects
Y Y Y Y Y Y
County Fixed Effects
Y Y Y Y Y Y
N 34427 34635 35441 33988 32171 7618 Results are from OLS regression with month and county fixed effects and robust standard errors. *p<0.1. **p<0.05. ***p<0.01.
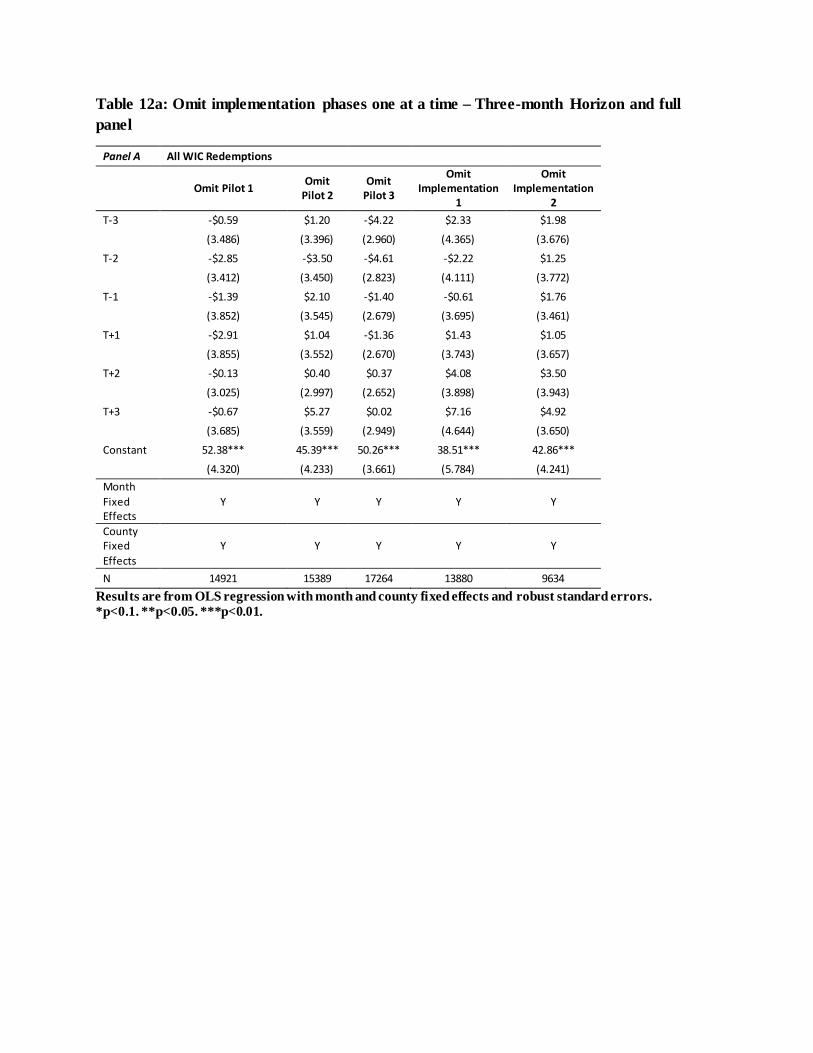
Table 12a: Omit implementation phases one at a time – Three-month Horizon and full panel
Panel A All WIC Redemptions
Omit Pilot 1 Omit Pilot 2
Omit Pilot 3
Omit Implementation
1
Omit Implementation
2 T-3 -$0.59 $1.20 -$4.22 $2.33 $1.98
(3.486) (3.396) (2.960) (4.365) (3.676)
T-2 -$2.85 -$3.50 -$4.61 -$2.22 $1.25 (3.412) (3.450) (2.823) (4.111) (3.772)
T-1 -$1.39 $2.10 -$1.40 -$0.61 $1.76 (3.852) (3.545) (2.679) (3.695) (3.461)
T+1 -$2.91 $1.04 -$1.36 $1.43 $1.05 (3.855) (3.552) (2.670) (3.743) (3.657)
T+2 -$0.13 $0.40 $0.37 $4.08 $3.50 (3.025) (2.997) (2.652) (3.898) (3.943)
T+3 -$0.67 $5.27 $0.02 $7.16 $4.92 (3.685) (3.559) (2.949) (4.644) (3.650)
Constant 52.38*** 45.39*** 50.26*** 38.51*** 42.86*** (4.320) (4.233) (3.661) (5.784) (4.241)
Month Fixed Effects
Y Y Y Y Y
County Fixed Effects
Y Y Y Y Y
N 14921 15389 17264 13880 9634 Results are from OLS regression with month and county fixed effects and robust standard errors. *p<0.1. **p<0.05. ***p<0.01.
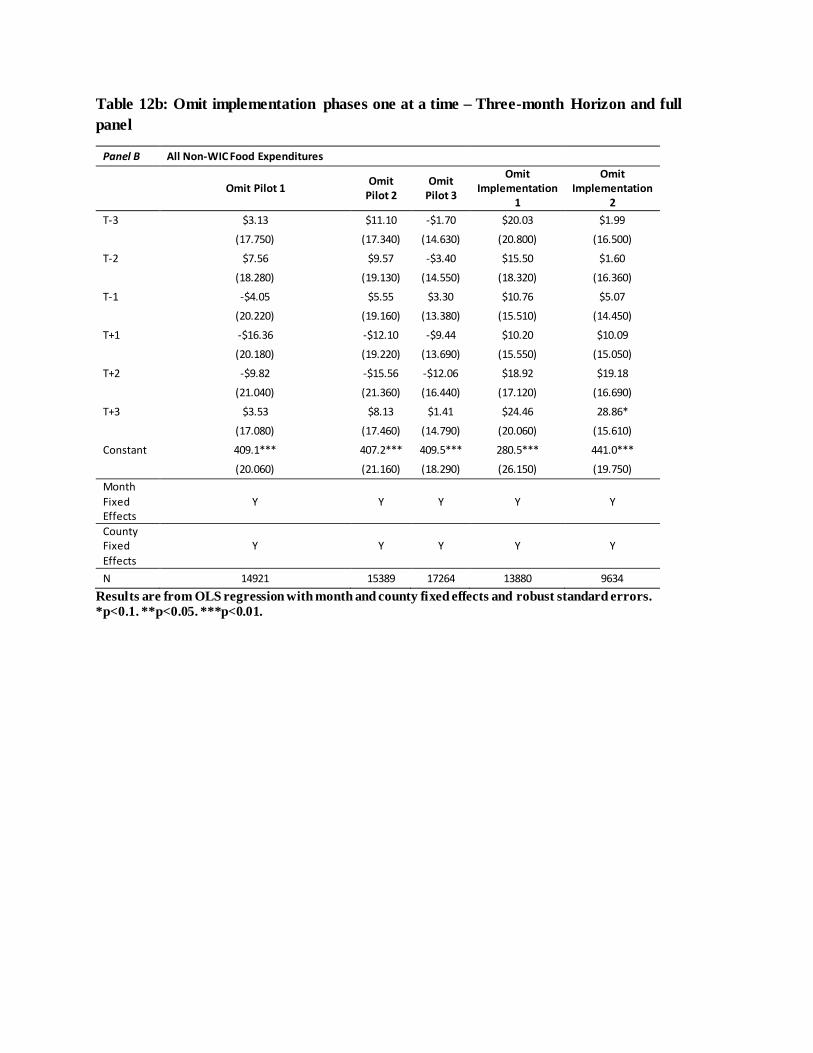
Table 12b: Omit implementation phases one at a time – Three-month Horizon and full panel
Panel B All Non-WIC Food Expenditures
Omit Pilot 1 Omit Pilot 2
Omit Pilot 3
Omit Implementation
1
Omit Implementation
2 T-3 $3.13 $11.10 -$1.70 $20.03 $1.99
(17.750) (17.340) (14.630) (20.800) (16.500)
T-2 $7.56 $9.57 -$3.40 $15.50 $1.60 (18.280) (19.130) (14.550) (18.320) (16.360)
T-1 -$4.05 $5.55 $3.30 $10.76 $5.07 (20.220) (19.160) (13.380) (15.510) (14.450)
T+1 -$16.36 -$12.10 -$9.44 $10.20 $10.09 (20.180) (19.220) (13.690) (15.550) (15.050)
T+2 -$9.82 -$15.56 -$12.06 $18.92 $19.18 (21.040) (21.360) (16.440) (17.120) (16.690)
T+3 $3.53 $8.13 $1.41 $24.46 28.86* (17.080) (17.460) (14.790) (20.060) (15.610)
Constant 409.1*** 407.2*** 409.5*** 280.5*** 441.0*** (20.060) (21.160) (18.290) (26.150) (19.750)
Month Fixed Effects
Y Y Y Y Y
County Fixed Effects
Y Y Y Y Y
N 14921 15389 17264 13880 9634 Results are from OLS regression with month and county fixed effects and robust standard errors. *p<0.1. **p<0.05. ***p<0.01.
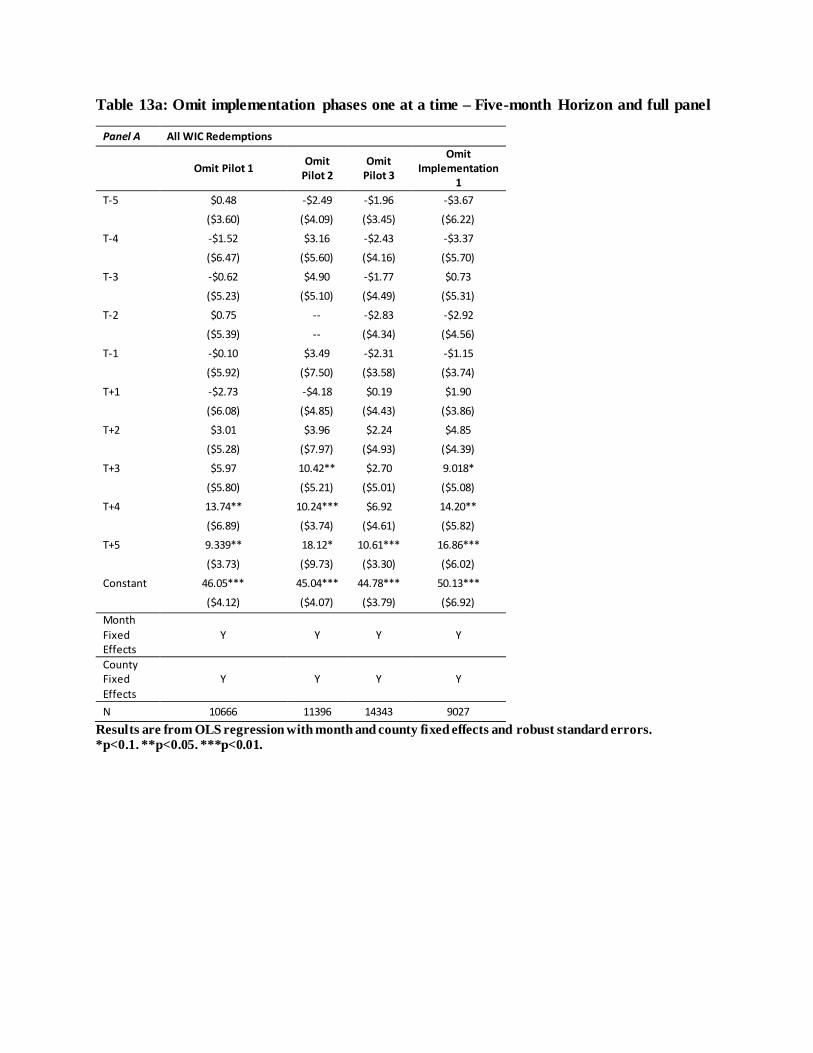
Table 13a: Omit implementation phases one at a time – Five-month Horizon and full panel
Panel A All WIC Redemptions
Omit Pilot 1 Omit Pilot 2
Omit Pilot 3
Omit Implementation
1 T-5 $0.48 -$2.49 -$1.96 -$3.67
($3.60) ($4.09) ($3.45) ($6.22)
T-4 -$1.52 $3.16 -$2.43 -$3.37 ($6.47) ($5.60) ($4.16) ($5.70)
T-3 -$0.62 $4.90 -$1.77 $0.73 ($5.23) ($5.10) ($4.49) ($5.31)
T-2 $0.75 -- -$2.83 -$2.92 ($5.39) -- ($4.34) ($4.56)
T-1 -$0.10 $3.49 -$2.31 -$1.15 ($5.92) ($7.50) ($3.58) ($3.74)
T+1 -$2.73 -$4.18 $0.19 $1.90 ($6.08) ($4.85) ($4.43) ($3.86)
T+2 $3.01 $3.96 $2.24 $4.85 ($5.28) ($7.97) ($4.93) ($4.39)
T+3 $5.97 10.42** $2.70 9.018* ($5.80) ($5.21) ($5.01) ($5.08)
T+4 13.74** 10.24*** $6.92 14.20** ($6.89) ($3.74) ($4.61) ($5.82)
T+5 9.339** 18.12* 10.61*** 16.86*** ($3.73) ($9.73) ($3.30) ($6.02)
Constant 46.05*** 45.04*** 44.78*** 50.13*** ($4.12) ($4.07) ($3.79) ($6.92)
Month Fixed Effects
Y Y Y Y
County Fixed Effects
Y Y Y Y
N 10666 11396 14343 9027 Results are from OLS regression with month and county fixed effects and robust standard errors. *p<0.1. **p<0.05. ***p<0.01.
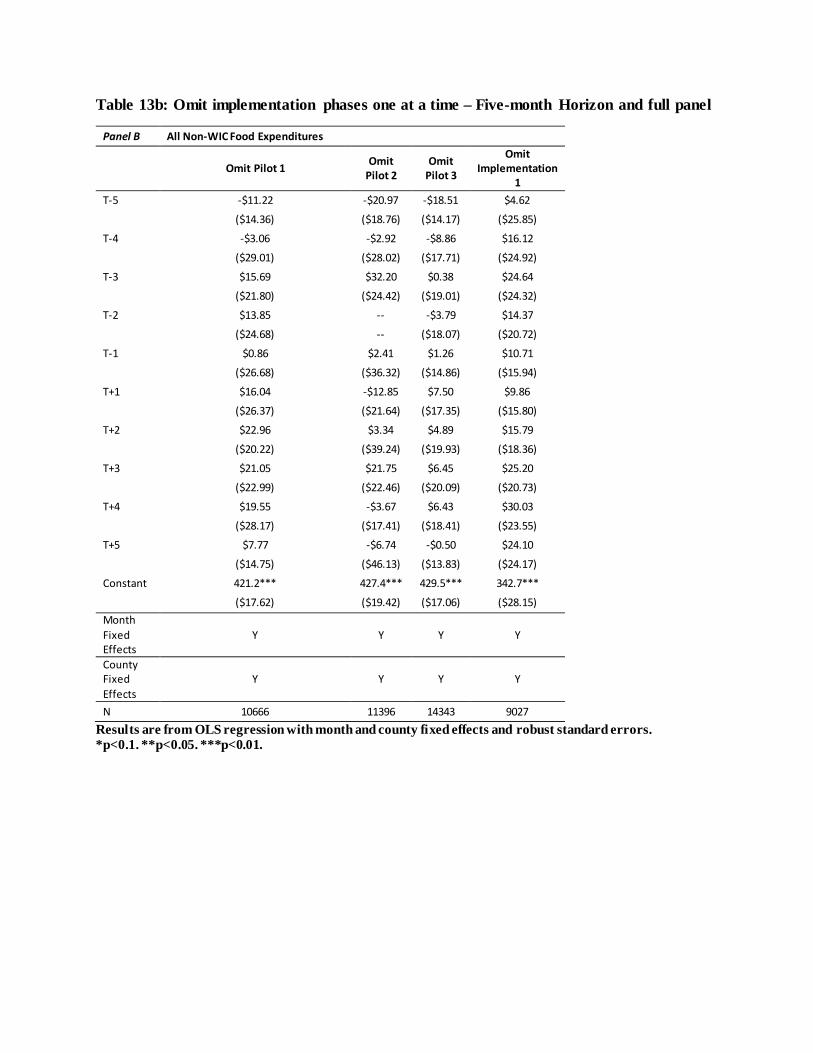
Table 13b: Omit implementation phases one at a time – Five-month Horizon and full panel
Panel B All Non-WIC Food Expenditures
Omit Pilot 1 Omit Pilot 2
Omit Pilot 3
Omit Implementation
1 T-5 -$11.22 -$20.97 -$18.51 $4.62
($14.36) ($18.76) ($14.17) ($25.85)
T-4 -$3.06 -$2.92 -$8.86 $16.12 ($29.01) ($28.02) ($17.71) ($24.92)
T-3 $15.69 $32.20 $0.38 $24.64 ($21.80) ($24.42) ($19.01) ($24.32)
T-2 $13.85 -- -$3.79 $14.37 ($24.68) -- ($18.07) ($20.72)
T-1 $0.86 $2.41 $1.26 $10.71 ($26.68) ($36.32) ($14.86) ($15.94)
T+1 $16.04 -$12.85 $7.50 $9.86 ($26.37) ($21.64) ($17.35) ($15.80)
T+2 $22.96 $3.34 $4.89 $15.79 ($20.22) ($39.24) ($19.93) ($18.36)
T+3 $21.05 $21.75 $6.45 $25.20 ($22.99) ($22.46) ($20.09) ($20.73)
T+4 $19.55 -$3.67 $6.43 $30.03 ($28.17) ($17.41) ($18.41) ($23.55)
T+5 $7.77 -$6.74 -$0.50 $24.10 ($14.75) ($46.13) ($13.83) ($24.17)
Constant 421.2*** 427.4*** 429.5*** 342.7*** ($17.62) ($19.42) ($17.06) ($28.15)
Month Fixed Effects
Y Y Y Y
County Fixed Effects
Y Y Y Y
N 10666 11396 14343 9027 Results are from OLS regression with month and county fixed effects and robust standard errors. *p<0.1. **p<0.05. ***p<0.01.
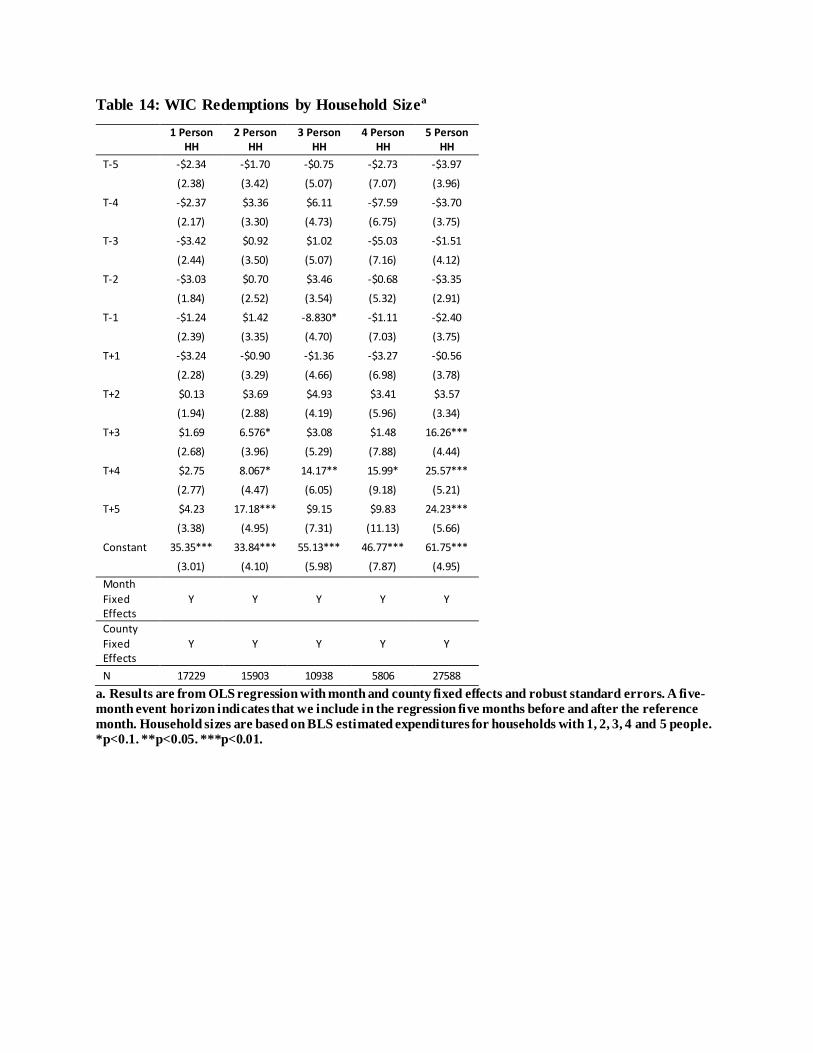
Table 14: WIC Redemptions by Household Sizea
1 Person HH
2 Person HH
3 Person HH
4 Person HH
5 Person HH
T-5 -$2.34 -$1.70 -$0.75 -$2.73 -$3.97 (2.38) (3.42) (5.07) (7.07) (3.96)
T-4 -$2.37 $3.36 $6.11 -$7.59 -$3.70 (2.17) (3.30) (4.73) (6.75) (3.75)
T-3 -$3.42 $0.92 $1.02 -$5.03 -$1.51 (2.44) (3.50) (5.07) (7.16) (4.12)
T-2 -$3.03 $0.70 $3.46 -$0.68 -$3.35 (1.84) (2.52) (3.54) (5.32) (2.91)
T-1 -$1.24 $1.42 -8.830* -$1.11 -$2.40 (2.39) (3.35) (4.70) (7.03) (3.75)
T+1 -$3.24 -$0.90 -$1.36 -$3.27 -$0.56 (2.28) (3.29) (4.66) (6.98) (3.78)
T+2 $0.13 $3.69 $4.93 $3.41 $3.57 (1.94) (2.88) (4.19) (5.96) (3.34)
T+3 $1.69 6.576* $3.08 $1.48 16.26*** (2.68) (3.96) (5.29) (7.88) (4.44)
T+4 $2.75 8.067* 14.17** 15.99* 25.57*** (2.77) (4.47) (6.05) (9.18) (5.21)
T+5 $4.23 17.18*** $9.15 $9.83 24.23*** (3.38) (4.95) (7.31) (11.13) (5.66)
Constant 35.35*** 33.84*** 55.13*** 46.77*** 61.75*** (3.01) (4.10) (5.98) (7.87) (4.95)
Month Fixed Effects
Y Y Y Y Y
County Fixed Effects
Y Y Y Y Y
N 17229 15903 10938 5806 27588 a. Results are from OLS regression with month and county fixed effects and robust standard errors. A five-month event horizon indicates that we include in the regression five months before and after the reference month. Household sizes are based on BLS estimated expenditures for households with 1, 2, 3, 4 and 5 people. *p<0.1. **p<0.05. ***p<0.01.
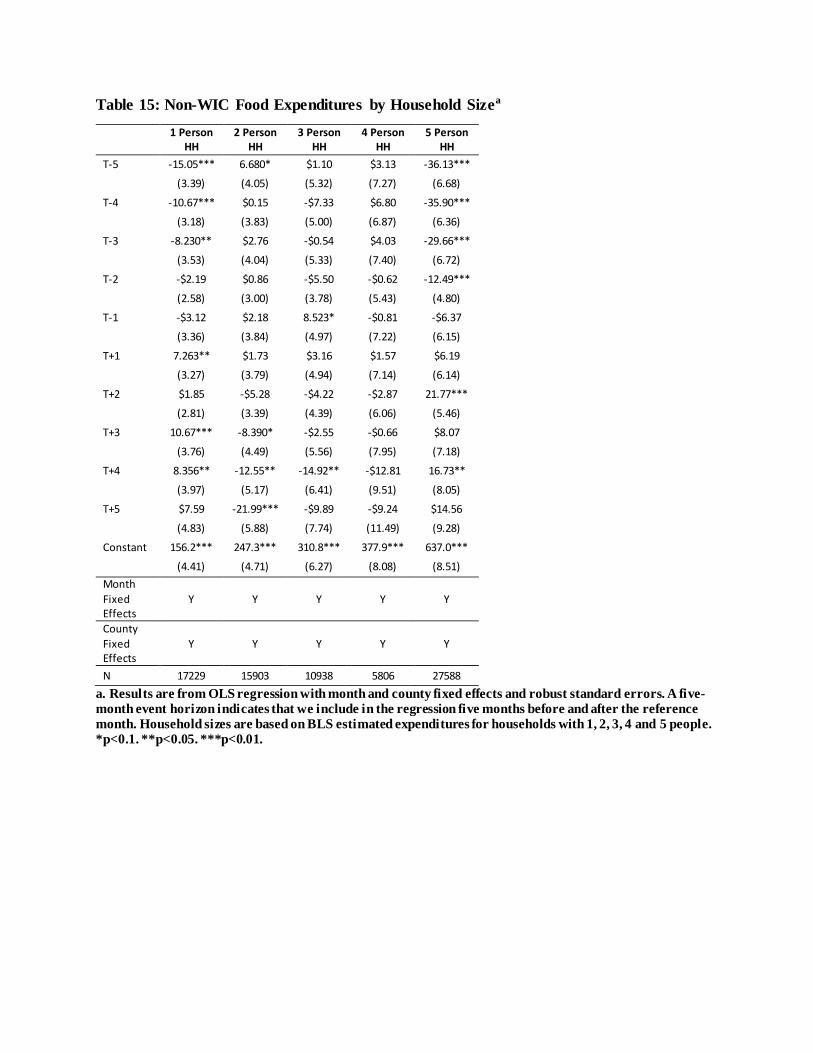
Table 15: Non-WIC Food Expenditures by Household Sizea
1 Person HH
2 Person HH
3 Person HH
4 Person HH
5 Person HH
T-5 -15.05*** 6.680* $1.10 $3.13 -36.13*** (3.39) (4.05) (5.32) (7.27) (6.68)
T-4 -10.67*** $0.15 -$7.33 $6.80 -35.90*** (3.18) (3.83) (5.00) (6.87) (6.36)
T-3 -8.230** $2.76 -$0.54 $4.03 -29.66*** (3.53) (4.04) (5.33) (7.40) (6.72)
T-2 -$2.19 $0.86 -$5.50 -$0.62 -12.49*** (2.58) (3.00) (3.78) (5.43) (4.80)
T-1 -$3.12 $2.18 8.523* -$0.81 -$6.37 (3.36) (3.84) (4.97) (7.22) (6.15)
T+1 7.263** $1.73 $3.16 $1.57 $6.19 (3.27) (3.79) (4.94) (7.14) (6.14)
T+2 $1.85 -$5.28 -$4.22 -$2.87 21.77*** (2.81) (3.39) (4.39) (6.06) (5.46)
T+3 10.67*** -8.390* -$2.55 -$0.66 $8.07 (3.76) (4.49) (5.56) (7.95) (7.18)
T+4 8.356** -12.55** -14.92** -$12.81 16.73** (3.97) (5.17) (6.41) (9.51) (8.05)
T+5 $7.59 -21.99*** -$9.89 -$9.24 $14.56 (4.83) (5.88) (7.74) (11.49) (9.28)
Constant 156.2*** 247.3*** 310.8*** 377.9*** 637.0*** (4.41) (4.71) (6.27) (8.08) (8.51)
Month Fixed Effects
Y Y Y Y Y
County Fixed Effects
Y Y Y Y Y
N 17229 15903 10938 5806 27588 a. Results are from OLS regression with month and county fixed effects and robust standard errors. A five-month event horizon indicates that we include in the regression five months before and after the reference month. Household sizes are based on BLS estimated expenditures for households with 1, 2, 3, 4 and 5 people. *p<0.1. **p<0.05. ***p<0.01.