recharge estimation and sustainability assessment...
TRANSCRIPT

RECHARGE ESTIMATION AND SUSTAINABILITY
ASSESSMENT OF GROUNDWATER RESOURCES
IN THE NORTH CHINA PLAIN
by
GUOLIANG CAO
Dr. CHUNMIAO ZHENG, COMMITTEE CHAIR
Dr. RONA J. DONAHOE
Dr. GEOFF R. TICK
Dr. TIM MASTERLARK
Dr. BRIDGET R. SCANLON
A DISSERTATION
Submitted in partial fulfillment of the requirements
for the degree of Doctor of Philosophy
in the Department of Geological Sciences
in the Graduate School of
The University of Alabama
TUSCALOOSA, ALABAMA
2011

Copyright Guoliang Cao 2011
ALL RIGHTS RESERVED
ii
ABSTRACT
Sustainable use of groundwater resources requires a comprehensive understanding of the
groundwater flow system, including recharge mechanisms and system dynamics to quantify
future availability and variability of groundwater resources in response to climatic conditions
(recharge) and human activities (pumping). This dissertation explores sustainability issues in the
North China Plain (NCP), a region plagued by one of the worst groundwater overuse and
depletion problems globally. The dissertation is organized as three closely related but self-
contained papers.
The first paper describes the development of a regional, three-dimensional groundwater
flow model, and its application in investigating the overall flow dynamics of the groundwater
system across the NCP under both predevelopment and post-development conditions. The
output from the groundwater model provides estimates of groundwater depletion rates over the
post-development period, which average about 4 km3/yr. Mean annual groundwater recharge of
the overall plain, as estimated through calibration of the groundwater model is ~120 mm, which
is in reasonable agreement with previously reported values based on the regional water balance
method. Groundwater storage depletion, as estimated from groundwater level fluctuation data
and from the numerical simulation is highly correlated with variations in precipitation. The
numerical model makes it possible to integrate the available hydrologic data, providing a
comprehensive approach to evaluate sustainability of groundwater resources in the NCP. The
results show a severe imbalance between groundwater recharge and groundwater extraction (the
iii
primary discharge). Finally, some strategies that have been conducted towards more sustainable
groundwater management in the NCP are discussed.
In the work discussed in the second paper, as a way of mitigating the uncertainty inherent
in specifying groundwater recharge as a calibration parameter (as commonly done in regional
groundwater modeling), a simplified vertical one-dimensional unsaturated zone flow model was
coupled with the regional three-dimensional saturated zone flow model. This allows more
realistic simulation of the recharge process at the interface between the unsaturated and saturated
zones. Soil hydraulic parameters were estimated using pedotransfer functions. Simulation over
12 years (1993–2008) was performed across the NCP. Simulated mean annual recharge ranges
from ≤360 mm in the piedmont area to ≤260 mm in the middle and coastal plain areas, with a
mean of ~150 mm across the NCP; this figure represents 18% of the average annual precipitation
plus irrigation. Variability in soil texture and hydraulic properties is primarily responsible for the
large range in simulated recharge rates. Increasing thickness of the unsaturated zone with
groundwater depletion was shown to have little effect on long term mean groundwater recharge.
The third paper discusses the application of direct simulation of groundwater mean age
using a solute transport model to help calibrate the flow model parameters, including recharge
rates. The simulated age distribution and the recalibrated flow model were then used to
characterize the flow regime both under natural conditions and under conditions as altered by
groundwater pumping. The model results indicate that simulated groundwater age in the NCP is
affected both by the paleo-hydrologic conditions and by extensive groundwater pumping. Flow
path analysis, water budget calculations, and the simulated groundwater age distribution all

iv
indicate that the lateral flow to the deep aquifer zone in the NCP is limited, and that the primary
water input to the deep aquifer zone is downward leakage from the shallow aquifer zone; the
extensive pumping of deep groundwater in recent decades has increased this downward flow.
These results confirm that regional pumping has altered the flow regime in the deep aquifer zone,
and that widely distributed vertical leakage has become a dominant process shaping the flow
pattern both in the shallow and deep aquifers of the NCP.

v
DEDICATION
This dissertation is dedicated to my wife, Dongmei, for her love and support.

vi
LIST OF ABBREVIATIONS AND SYMBOLS
< Less than
= Equal
Change of soil water storage
Δp Slope of the saturated vapor pressure curve
A Groundwater mean age
αL Longitudinal dispersivity
αV Vertical dispersivity separately, and the
αT Transverse dispersivity
BCs Boundary conditions
CIGEM China Institute of Geo-Environmental Monitoring
ET Evapotranspiration
ETp potential evapotranspiration
ETa actual evapotranspiration
ETw Wet environment evapotranspiration
ε Brooks-Corey exponent
fT Vapor transfer coefficient
HWCC Hai River Water Resources Commission
IDW Inverse distance weighting
Ir Irrigation

vii
Ks Saturated hydraulic conductivity
( )K is unsaturated hydraulic conductivity
ME The mean error
NCP North China Plain
PTFs Pedo-transfer functions
P Precipitation
QTP Net available energy adjusted to the equilibrium temperature
Rp Potential recharge to the vadose zone
RH Relative humidity
RMSE Root mean square error
SNWD South-to-North Water Diversion
SRTM Shuttle radar topography mapping
σ Stefan-Boltzman constant
θ Volumetric water content
θr Residual water content
θs Saturated water content
T Air temperature
Tp Equilibrium and air temperature
Tdew Dew point temperature
TDS Dissolved solids
t Time

viii
WUE Water use efficiency
z Elevation in the vertical direction
ix
ACKNOWLEDGMENTS
I would like to thank my research advisor, Dr. Chunmiao Zheng, for his guidance and
encouragement during my Ph.D. program. In the past four years, Dr. Zheng has had a significant
role in both my scientific and personal development. As a role model to me in the field of
hydrogeology, especially groundwater modeling, it is he who taught me that modeling is not just
matching observations and simulations, but a way of exploring and understanding the true
hydrogeological behavior of a groundwater system.
I also would like to thank Dr. Rona J. Donahoe, Dr. Geoff R. Tick, and Dr. Tim
Masterlark for serving as my dissertation committee members and for their valuable comments
on my dissertation. Their classes greatly enriched my knowledge base for further study and
research.
For her invaluable contribution to my dissertation, I want to give my special thanks to Dr.
Bridget Scanlon of University of Texas-Austin. Her constructive suggestions and helpful editing
helped me improve my writing and challenged me to become a better hydrogeologist.
For data collection and logistical support, I would like to thank Dr. Jie Liu at Peking
University and other colleagues at China Institute of Geo-Environmental Monitoring and China
Institute of Water Resources and Hydropower Research. Special thanks are given to China
Geological Survey for most of the basic hydrogeologic data for the modeling work.
Finally, I am indebted to my wife Dongmei and my son Yuechuan. They made my life
complete and colorful!

x
CONTENTS
ABSTRACT………………………………………………………………………………………ii
DEDICATION ................................................................................................................................ v
LIST OF ABBREVIATIONS AND SYMBOLS .......................................................................... vi
ACKNOWLEDGMENTS ............................................................................................................. ix
LIST OF TABLES ....................................................................................................................... xiii
LIST OF FIGURES ..................................................................................................................... xiv
CHAPTER 1 INTRODUCTION .................................................................................................. 1
CHAPTER 2 USE OF GROUNDWATER MODELING TO ASSESS SUSTAINABILITY OF
GROUNDWATER RESOURCES IN THE NORTH CHINA PLAIN ................ 11
Abstract .................................................................................................................................. 11
2.1. Introduction .................................................................................................................... 12
2.2. Study Site and Hydraulic Data ....................................................................................... 15
2.2.1. Study Site .............................................................................................................. 15
2.2.2. Hydraulic Data ...................................................................................................... 19
2.3. Groundwater Storage Change from Water Level Change .............................................. 21
2.4. Simulation of the Groundwater Flow System ................................................................ 22
2.4.1. Conceptual Model of the Groundwater Flow System........................................... 22
2.4.2. Flow Model Construction ..................................................................................... 26
2.4.3. Model Calibration ................................................................................................. 29
2.5. Results and Discussion ................................................................................................... 32
2.6. Strategies for Sustainability ............................................................................................ 39
2.7. Conclusions .................................................................................................................... 41

xi
References .............................................................................................................................. 43
CHAPTER 3 INTEGRATION OF SOIL WATER BALANCE AND UNSATURATED FLOW
MODEL FOR ESTIMATING REGIONAL GROUNDWATER RECHARGE IN
THE NORTH CHINA PLAIN.............................................................................. 50
Abstract .................................................................................................................................. 50
3.1. Introduction .................................................................................................................... 51
3.2. Materials and Methods ................................................................................................... 55
3.2.1. Study Site .............................................................................................................. 55
3.2.2. Root Zone Soil Water Balance ............................................................................. 57
3.2.3. Regional Flow Model Description ........................................................................ 58
3.3. Data Sets on Climate, Soils, and Irrigation .................................................................... 60
3.4. Model Setup .................................................................................................................... 62
3.5. Results and Discussion ................................................................................................... 63
3.5.1. Calculated Evapotranspiration Rates .................................................................... 63
3.5.2. Calculated Recharge Rates ................................................................................... 66
3.5.3. Sensitivity and Uncertainty Analysis of Calculated Recharge Rates ................... 73
3.5.4. Arrival Time of Percolating Water to Groundwater ............................................. 74
3.5.5. Validation of Calculated Recharge Rates ............................................................. 75
3.6. Conclusion ...................................................................................................................... 78
References .............................................................................................................................. 79
CHAPTER 4 SUSTAINABILITY EVALUATION OF DEEP GROUNDWATER IN THE
NORTH CHINA PLAIN BY GROUNDWATER FLOW AND AGE
SIMULATION ...................................................................................................... 85
Abstract .................................................................................................................................. 85
4.1. Introduction .................................................................................................................... 86
xii
4.2. Materials and Methods ................................................................................................... 89
4.2.1. Study Area ............................................................................................................ 89
4.2.2. Mean Age Transport Model .................................................................................. 91
4.2.3. Water Level and Groundwater Age Observations ................................................ 92
4.2.4. Numerical Simulation of Flow and Transport ...................................................... 95
4.3. Results and Discussion ................................................................................................... 99
4.3.1. Mean Steady State Age Distribution with Calibrated Recharge ......................... 100
4.3.2. Impact of Paleo-hydrologic Conditions on Age Simulation ............................... 103
4.3.3. Water Budget of the Deep Groundwater ............................................................ 104
4.3.4. Effect of Regional Pumpage on Age Distribution .............................................. 107
4.3.5. Flow Regime Under Natural Conditions and Excessive Exploitation ................ 111
4.3.6. Model Limitation and Future Studies ................................................................. 112
4.4. Sustainability of Deep Groundwater and Responses .................................................... 113
4.5. Conclusions .................................................................................................................. 116
References ............................................................................................................................ 117
CHAPTER 5 CONCLUDING REMARKS .............................................................................. 122
xiii
LIST OF TABLES
Table 3.1. MODFLOW Input Parameters Used in Text. .............................................................. 60
Table 3.2. Annul ET estimated used those estimated using other methods in the NCP. .............. 65
Table 3.3. Annul local and regional recharge rates estimated used other methods in the NCP. .. 76
Table 4.1. Well information, 14
C, and 13
C concentrations. ......................................................... 93
Table 4.2. Sensitivity of simulated mean groundwater age at 97 observation points to
dispersivity and effective porosity. ............................................................................ 97
Table 4.3. Simulated mean flux rate into the deep aquifer zone under the brackish water zone
(unit: 108m
3/yr) ........................................................................................................ 108
xiv
LIST OF FIGURES
Figure 1.1. Location and topography of the North China Plain. .................................................... 3
Figure 1.2. Population density in the NCP based on population on 2003. .................................... 6
Figure 1.3. Precipitation in the NCP from 1951 to 2008 based on measured precipitation data at
23 meteorological stations across the NCP. ................................................................ 7
Figure 2.1. Location and topograph of the North China Plain. (1) Boundaries of geomorphologic
zones (Wu et al., 1996) of (I) piedmont plain; (II) alluvial fan and flood plain and (III)
coastal plain. (2) A-A’ line of cross section in Figure 2.2; and (3) Locations of
observations wells used in water level analysis model calibration. ........................... 16
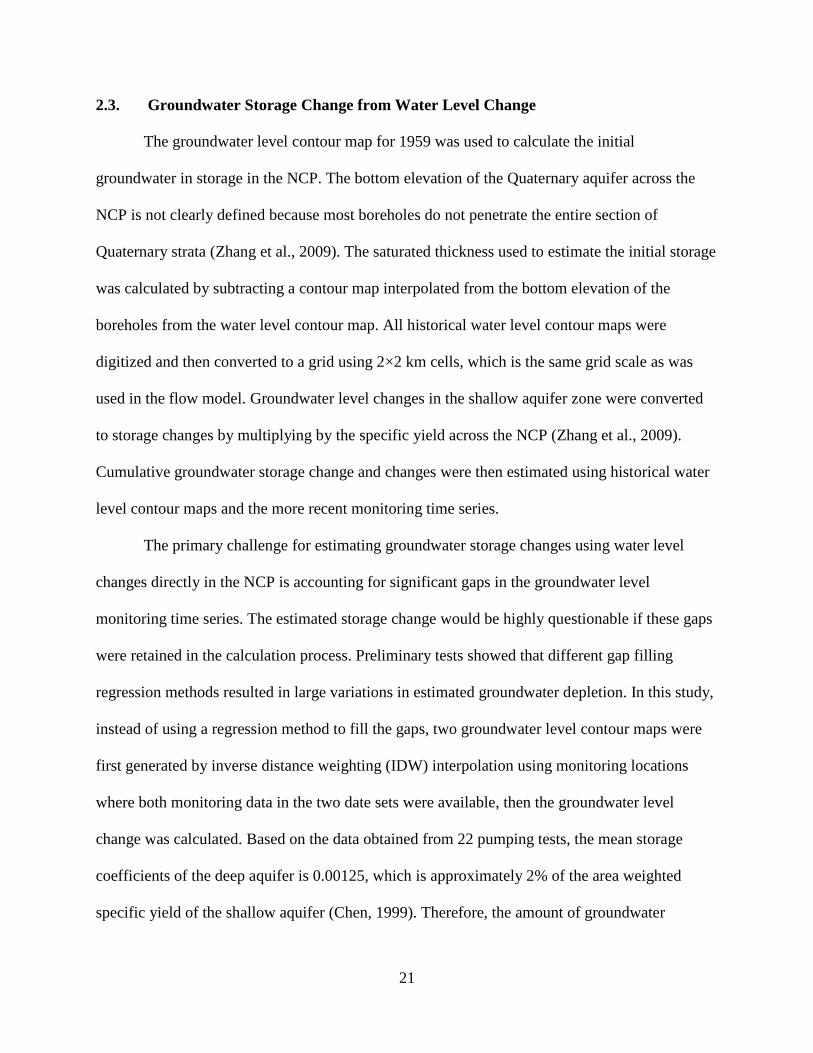
Figure 2.2. Hydrogeological cross section of the NCP along A-A’ in Figure 2.1 (modified from
Chen et al., 2005). ...................................................................................................... 23
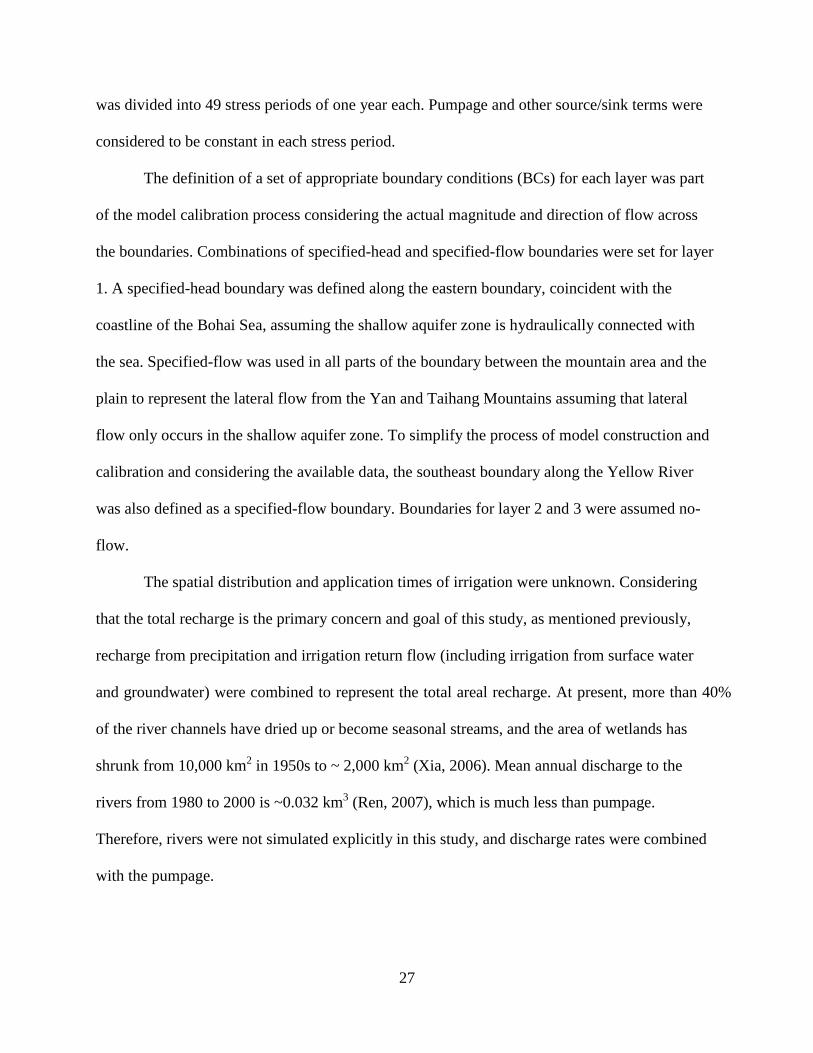
Figure 2.3. Comparison of observed and simulated water level contours in the shallow aquifer
zone in (a) 1959 and (b) 1984. ................................................................................... 30
Figure 2.4. Comparison between observed and simulated annual water levels from 1993 through
2008 at (a) 105 shallow observation wells (in model layer 1), total 1231 observations,
and (b) 72 deep observation wells (in model layer 2 and 3), total 871 observations.
Dotted lines indicate the 95% prediction intervals. ................................................... 31
Figure 2.5. Total groundwater pumping and simulated annual averaged water table depth in the
NCP. The annual groundwater pumpage before 1980 was estimated. ...................... 33
Figure 2.6. Monthly and seasonally averaged groundwater storage change in the NCP calculated
using water level changes data. ................................................................................. 33
Figure 2.7. Cumulative storage change with 1959 as the base year calculated using water level
changes data (dots) and simulated by the model (line) and corresponding change of
total groundwater storage in the NCP. ....................................................................... 35
Figure 2.8. Model simulated groundwater storage change and total groundwater recharge trend
from 1970 to 2008. .................................................................................................... 36
Figure 2.9. Temporal variation of irrigation (assuming irrigation accounting for 70% of total
pumpage), precipitation and model-calibrated groundwater from 1970 through 2008.
................................................................................................................................... 37

xv
Figure 2.10. Spatial distribution of (a) calibrated averaged annual recharge and precipitation
contours interpolated using 23 meteorological stations, and (b) averaged annual total
groundwater abstraction from both shallow and deep aquifers for the period from
1970 through 2008. .................................................................................................... 38
Figure 2.11. Spatial distribution of (a) simulated water table depth in 2008............................... 38
Figure 3.1. Location of the North China Plain and land use in 2000. .......................................... 55
Figure 3.2. Spatially averaged annual PET (dashed line); annual AET (solid line); and seasonal
precipitation (stack): winter (December-February), spring (March-May), summer
(June-August) and autumn (September-November) from 1993 to 2008 in the NCP. 63
Figure 3.3. Spatially averaged monthly precipitation, AET and PET in the NCP. ...................... 64
Figure 3.4. Spatial distribution of mean annual (a) potential evaportranspiration and (b) actual
evaportranspiration , 1993to2008. ............................................................................. 65
Figure 3.5. USDA (U.S. Department of Agriculture) soil texture types in the NCP, translated
from the GSCC (genetic soil classification of China) soil family definitions. .......... 66
Figure 3.6. Saturated vertical hydraulic conductivity of the soil in the NCP calculated by PTFs
developed by Schaap (2001) using soil sand, silt and clay contents, and bulk density.
................................................................................................................................... 67
Figure 3.7. Calculated spatially averaged monthly groundwater recharge from 1993 to 2008. .. 68
Figure 3.8. Calculated distribution of mean annual groundwater recharge at the water table. ... 69
Figure 3.9. Distribution of groundwater recharge for (a) loamy sand, (b) loam, (c) clay and (d)
the entire plain. .......................................................................................................... 70
Figure 3.10. Mean annual recharge as a percentage of mean annual precipitation plus irrigation
at different unsaturated zone thickness. ..................................................................... 71
Figure 3.11. Variation of monthly recharge and infiltration with time at two observation
locations: (a) in the piedmont area with unsaturated thickness of up to 46 m, and (b)
in the central plain with unsaturated zone thickness of up to 3 m. ............................ 72
Figure 3.12. Effect of model parameters and initial conditions (expressed as a fraction of base
case) on the computed recharge (expressed as the ratio of mean annual recharge to
precipitation plus irrigation). ..................................................................................... 74

xvi
Figure 3.13. Statistical distribution of time delay of recharge reaching the water table for (a)
Loamy sand, (b) Loam and (c) Clay at different unsaturated zone thicknesses. ....... 77
Figure 3.14. Comparison of calculated and observed water levels from 1993 through 2008 at 105
observations wells, a total of 13900 monthly observation values in model layer 1,
which represents the shallow aquifer zone. Dotted lines indicate 95% prediction
intervals. ..................................................................................................................... 78
Figure 4.1. Concentration of TDS in the shallow groundwater across the NCP (source: China
Geological Survey, http://water.cgs.gov.cn/web/ShowArticle.asp?ArticleID=640,
obtained at January, 2010), location of the cross section AA’ along which the
simulated groundwater age is presented in Figure 4.5 and the locations of wells for
vertical hydraulic gradient analysis. .......................................................................... 89
Figure 4.2. Distribution of corrected groundwater 14
C age with well depth................................ 95
Figure 4.3. Simulated groundwater mean age distribution in the first model layer, which
represents the first and second aquifer units in the NCP. .......................................... 98
Figure 4.4. Simulated groundwater mean age and the corrected groundwater 14C age in the
second model layer, which represents the third aquifer unit. .................................... 99
Figure 4.5. Simulated advective age and mean age distribution in the second aquifer along the
cross section. ............................................................................................................ 101
Figure 4.6. Comparison of (a) simulated water level and measured water level and (b) simulated
groundwater mean age and measured apparent age based on carbon14. ................ 102
Figure 4.7. Simulated recharge distribution in the NCP. ............................................................ 103
Figure 4.8. Simulated net recharge flux at the water table across the NCP. ............................... 105
Figure 4.9. Two steady state stage model simulated groundwater mean age and the corrected
groundwater 14
C age in the second model layer, which represents the third aquifer
unit. .......................................................................................................................... 106
Figure 4.10. Simulated flow rate for inputs (lateral flow recharge, leakage from shallow aquifer
zone), pumpage and storage decrease in the deep aquifer zone with TDS>1 g/L for
the period of 1970-2008. .......................................................................................... 107
Figure 4.11. Simulated mean age distribution in the end of 2008 in the shallow aquifer zone. . 109
xvii
Figure 4.12. Simulated mean age distribution in the end of 2008 with age change compared with
the steady stage age in the deep aquifer zone. ......................................................... 110
Figure 4.13. Forward tracked advective flow paths starting from selected locations for (a)
predevelopment and (b) post-development condition. Colors change with travel time
along each flow pathline, beginning with blue at start point and changing to red at
advective travel time greater than 10,000 years. ..................................................... 112
Figure 4.14. Vertical hydraulic gradient at selected sites from (a) Zhengding in the piedmont area,
(b) Hengshui and (c) Nanpi in the central alluvial plain to (d) Huanghua in the
coastal plain. Water levels measuring depths are given in parenthesis. .................. 115
Figure 5.1. Conceptual model illustrating flow pattern changes in the NCP aquifer system ..... 123
1
CHAPTER 1
CHAPTER 1
INTRODUCTION
Groundwater sustainability is commonly defined as groundwater development in a
manner that can be maintained throughout entire hydrologic system for an indefinite time
without causing unacceptable environmental, economic, or social consequences (Alley et al.,
1999). It is clear that both groundwater quantity and quality must be considered based on this
definition of sustainability. However, sustainability in terms of quantity alone may be studied
and evaluated separately, or in advance of, sustainability in terms of water quality, and in fact
this is often done in practice. The sustainability of a groundwater pumping activity in terms of
quantity alone—i.e., the hydraulic sustainability—is ultimately possible only if a hydraulic
balance or equilibrium can be established in the groundwater system under the pumping regime.
As pointed out by Theis (1940), a groundwater utilization system is sustainable only when
pumping, as an additional discharge term imposed on a natural system which was originally in a
state of equilibrium, is balanced by the sum of increases in recharge and decreases in natural
discharge. In practical terms, increases in recharge or decreases in natural discharge can rarely be
identified, confirmed, or quantified without a detailed analysis of the original flow regime, the
regime as it exists under pumping, and the process of transition between them. Again in
practical terms, such an analysis and assessment of impact of different groundwater development
scenarios can only be done through simulation (Zhou, 2009).
Accurate water balance and information on groundwater dynamics are important bases
for assessment of sustainability of groundwater resources at a basin scale (Alley et al., 1999 and

2
2004). To properly manage groundwater resources, managers need reliable information on inputs
(recharge) and outputs (pumpage and natural discharge) within the groundwater basin. As a
critical component of the water balance, the groundwater recharge rate and its spatial and
temporal variability are essential in any analysis of groundwater systems (Sophocleous, 2005).
As one of the most overexploited aquifers in the world (Kendy et al., 2003; Liu et al., 2008), the
North China Plain (NCP) aquifer has been subject to very heavy withdrawals since the 1970s
(Liu et al., 2001). Since the 1960s many hydrogeological studies have been conducted in the
NCP. Most of these studies were designed to evaluate the groundwater system, and to develop an
understanding of its evolution in response to pumpage. Against the overall background of serious
water shortages and deterioration of ecological systems, groundwater sustainability has become
the central concept guiding the development and management of the NCP aquifer system in the
21th century (Zhang, 2003; Zhang et al., 2004; Zhang et al., 2009; Wu et al., 2010).
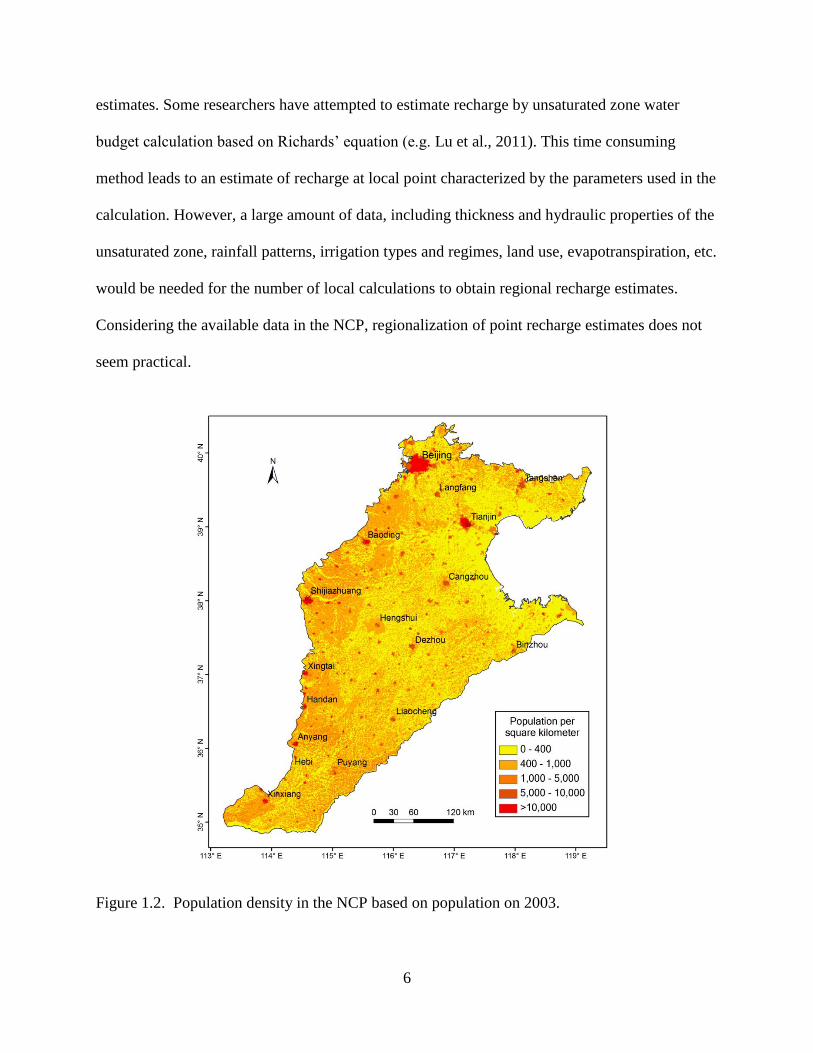
The North China Plain (NCP) refers to an area in northeastern China, having generally
low elevation (altitude of <100 m above mean sea level), and bordered on the north by the
Yanshan Mountains, on the east by the Bohai Sea, on the south by the Yellow River and on the
west by the Taihang Mountains (Figure 1.1) (Wu et al., 1992). The total area of the NCP as
defined is ~140,000 km2. The NCP covers the entire plains of Hebei Province, Beijing
Municipality, Tianjin Municipality, and the northern parts of the plains of Shandong and Henan
Provinces. The population of the NCP, based on 2000 state census data, is ~105 million
(National Bureau of Statistics of China, 2003) with a population density of ~800 persons per km2
(Figure 1.2). The NCP is the dominant national center for wheat and maize production and is an
extremely important economic, political, and cultural region of China, producing ~15% of

3
China’s total gross domestic product (GDP) and ~ 10% of total grain production based on 2009
statistical data (China Statistical Yearbook, 2010).
Figure 1.1. Location and topography of the North China Plain.
The factors affecting recharge in the NCP can be divided into two major categories:
natural climate fluctuations and effect of human activity. Although mean annual precipitation is
500~600 mm, temporal and spatial distribution is uneven, with 50 to 80% of the total
concentrated during the summer monsoon months (July–September), and a generally decreasing

4
trend from southeast to northwest (Chen, 1999). Superimposed on the seasonal variation, there
has been a long-term decrease in mean annual precipitation from ~600 mm in the 1950s to ~ 500
mm in the 2000s (Figure 1.3). Effects of human activity on recharge include changes in the
interaction between surface water and groundwater and changes in the groundwater cycling
pattern, which in turn may alter both areas and process of recharge. Besides the three main river
systems—the Yellow River, the Hai River, and the Luan River, there are nearly 60 small rivers,
such as the Tuhai and the Majia Rivers in the NCP. Under natural conditions with little pumping
and water table depths ranging from 0–5 m in the central and coastal plain to 1–10 m in the
piedmont plain (Zhu and Liu, 1995), these rivers acted primarily as discharge channels of
groundwater system. In the early stages of groundwater development, as water levels fell, most
of the draining reaches would have been converted to a losing condition, recharging the
groundwater system. However, with long-term reduction in precipitation and interception of
streamflow by upstream reservoirs, most of the river reaches in the NCP are now dry or carry
flow only seasonally. As a result of this, leakage from rivers to groundwater has declined; for
example, leakage from the Yellow River decreased by ~50% in 2000 relative to that in 1980 (Fei
et al., 2009). Groundwater recharge from sources other than streams leakage, including
precipitation and irrigation return flow, and discharge by pumping have become the primary
terms in the basin groundwater balance equation.
Previous studies indicated that recharge from infiltration of precipitation accounts for
approximately 70–80% of total natural groundwater recharge in the NCP (Chen, 1999; Chen and
Ma, 2002). A common approach used in recharge estimation in the NCP is to assume that a
certain fraction of precipitation and of the applied irrigation water percolates to the water table,
regardless of the quantity applied (Kendy et al., 2003). The percentage of precipitation as

5
recharge, or ―precipitation infiltration coefficient‖, was determined for different water table
depth and soil property areas, using precipitation and recharge typically calculated using water
level fluctuations in the 1980s (Chen, 1999). A data set of irrigation return flow, as percentage of
applied irrigation water, was determined in the 1980s, and was updated according to changes in
water table depth and irrigation methods. Estimates of annual groundwater recharge from
precipitation and irrigation return flow based on this method range from 70 to 180 mm/yr (Zhu
and Zheng, 1983; Liu and Wei, 1989; Chen, 1999; Water Resources Department of the Hebei
Province, 2003; Ren, 2007). Because the value of the recharge coefficient depends on soil
properties, unsaturated zone thickness, and precipitation amount, the recharge coefficient varies
spatially and temporally (Li, 2009). These recharge estimates represented long time average
values for different periods and did not provide information on recharge variations with time.
Moreover, recharge estimation neglecting unsaturated zone flow processes is considered
inappropriate in arid regions with thick unsaturated zone (Hunt et al., 2008). As a result of the
decades of heavy groundwater exploitation in the NCP, the thickness of the unsaturated zone has
increased from 2–15 m in the 1970s to 8–30 m, at present, and up to 30–56 m in some local areas
(Zhang et al., 2004). Ignoring unsaturated zone processes and using the recharge coefficients
obtained for overly sediments during times of shallow water table could be problematic for
estimation of groundwater recharge under current conditions (Zhang et al., 2007). Finally, water
level rises used in this method cannot distinguish areal recharge and lateral inflow, which is a
significant source of groundwater recharge in the NCP (Kendy et al., 2003).
Many researchers have used environmental tracer methods (Li et al., 2007; Wang et al.,
2008; Liu et al., 2009; von Rohden et al., 2010) to estimate local groundwater recharge.
Averaging of numerous such local values would then be necessary to obtain a regional recharge
6
estimates. Some researchers have attempted to estimate recharge by unsaturated zone water
budget calculation based on Richards’ equation (e.g. Lu et al., 2011). This time consuming
method leads to an estimate of recharge at local point characterized by the parameters used in the
calculation. However, a large amount of data, including thickness and hydraulic properties of the
unsaturated zone, rainfall patterns, irrigation types and regimes, land use, evapotranspiration, etc.
would be needed for the number of local calculations to obtain regional recharge estimates.
Considering the available data in the NCP, regionalization of point recharge estimates does not
seem practical.
Figure 1.2. Population density in the NCP based on population on 2003.

7
This dissertation includes three closely related papers using flow model and transport
model to estimate the recharge distribution and assess groundwater sustainability in the NCP.
The first paper uses a regional multi-layer, three dimensional flow model to simulate both the
predevelopment flow regime, and groundwater dynamics during the development of
groundwater utilization (1960–2008). The groundwater recharge rate and its spatial and temporal
variability were calibrated as the critical model inputs. The results of the regional flow model
provide an overall picture of the predevelopment condition of the aquifer system, of the response
of that system to intense development, and of the resulting variations of each term of
groundwater balance.
Figure 1.3. Precipitation in the NCP from 1951 to 2008 based on measured precipitation data at
23 meteorological stations across the NCP.
The flow model in the first paper focuses on the saturated zone of the NCP aquifer. The
recharge estimated through model calibration depends on the accuracy of the hydraulic
parameters and flow data used in the model. However, the available groundwater withdrawals
are estimated based on the average water consumption norms (Liu et al., 2004), and accurate
groundwater withdrawal information is generally not available. Moreover, because groundwater

8
no longer discharges to rivers, no flow data available can help to achieve a unique solution for
the inverse modeling of recharge. Although this problem has been overcome to some extent by
using the same hydraulic parameters verified by previous models, a better method is needed for
the reliable recharge estimates.
The second paper introduces an integrated model of the soil water balance and
unsaturated flow to estimate groundwater recharge and travel time of water from the land surface
to the water table. Actual evapotranspiration, as a critical term in the soil water budget equation,
was estimated by a method employing the complementary relationship hypothesis of
evapotranspiration. A one dimensional homogeneous unsaturated flow model is used to simulate
the delay of recharge through the unsaturated zone, and the required soil hydraulic parameters
are estimated using pedotransfer functions. The complexity of the soil-plant system was ignored
by using this model construction, and only basic meteorological data and soil data were required
as model inputs.
The deep groundwater zone is the primary source of water supply for the central and
coastal plains. Recharge to this zone, and renewability of its groundwater, must therefore be
considered in any evaluation of sustainable groundwater development (Zhang, 2003; Zhang et al.,
2004; Chen et al., 2009). The third paper attempts to calibrate the steady sate flow model in the
first stage using isotopic groundwater age, using a mean age transport model. The impacts of
assumed paleo-hydraulic conditions and recent decades of intense groundwater pumping are also
evaluated. Flow regime alternation is assessed through groundwater dynamics and flow paths
analyses. Simulated groundwater age distribution and water budget calculation in the deep
aquifer zone are then used to evaluate the sustainability of its groundwater development.

9
References
Alley, W.M., T.E. Reilly, and O.L. Franke. 1999. Sustainability of ground-water resources. U.S.
Geological Survey Circular 1186, no. 79.
Alley, W.M., and S.A. Leake. 2004. The journey from safe yield to sustainability. Ground Water
42, no. 1: 12-16.
Chen, W. 1999. Groundwater in Hebei Province. Beijing: Seismological Press.
Chen, M., and F. Ma. 2002. Groundwater Resources and the related Environment in China.
Beijing: Earthquake Press. (in Chinese)
Chen, Z., H. Gao, W. Wei, J. Chen, F. Zhang, and Y. Wang. 2009. Groundwater Renewal and
Characteristics in the Deep Confined Aquifer in North China Plain. Resources Science 31,
no. 3: 388-393. (in Chinese with English abstract)
Fei, Y., J. Miao, Z. Zhang, Z. Chen, H. Song, and M. Yang. 2009. Analysis on Evolution of
Groundwater Depression Cones and Its Leading Factors in North China Plain. Resources
Science 31, no. 3: 394-399.
Kendy, E., P. Gérard-Marchant, M.T. Walter, Y. Zhang, C. Liu, and T.S. Steenhuis. 2003. A
soil-water-balance approach to quantify groundwater recharge from irrigated cropland in
the north china plain. Hydrological Processes 17, no. 10: 2011-2031.
Li, J. 2009. An analysis of the coefficient of replenishment from infiltration of precipitation.
Hydrogeology & Engineering Geology 2: 29-33.
Liu, C., and Z. Wei. 1989. Agricultural Hydrology and Water Resources in the North China
Plain. Beijing: Science Press. (in Chinese)
Liu, C., J. Yu, and E. Kendy. 2001. Groundwater exploitation and its impact on the environment
in the north china plain. Water International 26, no. 2: 265-272.
Liu, H., G. Wang, and Y. Zhu. 2004. A discussion of methods of investigation and check of
groundwater withdrawal. Hydrogeology and Engineering Geology 5: 109-111.
Liu, J., C. Zheng, L. Zheng, and Y. Lei. 2008. Ground water sustainability: methodology and
application to the north china plain. Ground Water 46, no. 6: 897-909.
Lu, X., M. Jin, M.T. van Genuchten, and B. Wang. 2011. Groundwater Recharge at Five
Representative Sites in the Hebei Plain, China. Ground Water 49, no. 2: 286-294.
Sophocleous, M. 2005. Groundwater recharge and sustainability in the high plains aquifer in
kansas, usa. Hydrogeology Journal 13, no. 2: 351-365.
Theis, C.V. 1940. The source of water derived from wells. Civil Engineering 10, no. 5: 277-280.

10
von Rohden, C., A. Kreuzer, Z. Chen, R. Kipfer, and W. Aeschbach-Hertig. 2010.
Characterizing the recharge regime of the strongly exploited aquifers of the North China
Plain by environmental tracers. Water Resources Research 46, no. 5: W5511.
Wu, A., C. Li, Y. Xu, J. Liu, and G. Luo. 2010. Key Issues Influencing Sustainable Groundwater
Utilization and Its Countermeasures in North China Plain. South-to-North Water Transfers
and Water Science & Technology 6: 110-113.
Wu, Z., X. Chen, and Q. Xu. 1992. Natural environment evolution on the North China Plain over
past 40000 years. Beijing: China Science & Technology Press. (in Chinese)
Zhang, R. 2003. Characteristics of groundwater resources and their reasonable development.
Hydrogeology and Engineering Geology 6: 1-5. (in Chinese with English abstract)
Zhang, G., Y. Fei, J. Shen, and L. Yang. 2007. Influence of unsaturated zone thickness on
precipitation infiltration for recharge of groundwater. Journal of Hydraulic Engineering 38,
no. 5: 611-617. (in Chinese with English abstract)
Zhang, R., X. Liang, and M. Jin. 2004. On researches and practices in hydrogeology and
environmental geology for sustainable development. Hydrogeology and Engineering
Geology 1: 82-86. (in Chinese with English abstract)
Zhou, Y. 2009. A critical review of groundwater budget myth, safe yield and sustainability.
Journal of Hydrology 370, no. 1-4: 207-213.
Zhu, Y., and S. Liu. 1995. Groundwater dynamic environment evolution and its constraints in
hebie plain. Journal of China University of Geosciences 4: 433-437. (in Chinese with
English abstract)
Zhang, Z., G. Luo, Z. Wang, C. Liu, Y. LI, and X. Jiang. 2009. Studyon Sustainable Utilization
of Groundwater in North China Plain. Resources Science 3: 355-360. (in Chinese with
English abastract)

11
CHAPTER 2
CHAPTER 2
USE OF GROUNDWATER MODELING TO ASSESS SUSTAINABILITY OF
GROUNDWATER RESOURCES IN THE NORTH CHINA PLAIN
Abstract
Intensive groundwater development across the Quaternary aquifer of the North China
Plain (NCP) has caused a general, long-term trend of depletion in groundwater storage in both
shallow unconfined and deep confined aquifer zones, adversely affecting the environment and
ecosystems, including drying-up of rivers, land subsidence, seawater intrusion, and groundwater
quality deterioration. The concern is that the severe groundwater depletion will diminish
groundwater supplies and then impact the regional economy and social development. The
objective of this study was to evaluate spatial and temporal variability in groundwater depletion
using groundwater modeling. This study is a major component of a comprehensive regional
groundwater depletion analysis and quality evolution in the NCP with the purpose understanding
long term effects of human activates and alternative land use on groundwater changes. A
numerical groundwater flow model was developed for the NCP and was calibrated for both
predevelopment (1960s) and post-development (1960s–2008) conditions. Initial recharge
estimates and hydraulic parameters were derived from the literature and recharge was modified
through calibration. Steady state flow model presenting the natural condition was calibrated
using water level contours in 1959. Transient flow model for the post-development period was
calibrated using water level contours in 1975, 1984, 2001 and 105 and 72 annual water level time
series from 1993 through 2008 in the shallow and deep aquifers, respectively. Model output
12
indicates that mean groundwater depletion was ~4 km3/yr from 1970 through 2008. Mean annual
groundwater depletion was ~2.5 in the 1970s, and increased to ~4.0 km3 in the 1980s. The mean
depletion rate was ~2.0 km3/yr in 1990-1996; in this period the precipitation show an increasing
trend. The mean depletion rate was ~5.0 km3/yr in 1997–2008, which is the period with smallest
precipitation. Groundwater level hydrograph data from 117 time series were used to detect the
seasonal variation in groundwater storage, and indicate that aquifer depletion occurs mostly in
the spring. Mean annual simulated recharge is ~120 mm/yr and is focused in the Piedmont plain
(200–350 mm/yr) and much lower in the central and coastal plain areas (50–100 mm/yr).
Integrating all available data through groundwater modeling provides a comprehensive approach
to evaluate sustainability of groundwater resources, and the model constructed can be used to
examine potential sustainability strategies to be conducted in the NCP.
2.1. Introduction
Groundwater is a crucial source of water for agricultural, industrial and environmental
uses as well as for drinking water supply due to its generally good quality and widespread
occurrence. At present, groundwater contributes about 20% of people’s fresh water globally
(Kinzelbach et al., 2003), and estimated total groundwater withdrawals range from ~750 to 800
km3/year (Shah et al., 2000). Groundwater exploitation has facilitated economic development
and food production. For example, from 1961 to 2004, global crop yield per area increased by a
factor of 2.3 and total crop yield increased by a factor of 2.4 (Oki and Kanae, 2006); these
increases would not have been possible without major increases in irrigation, a significant share
of which came from groundwater. However, the severe consequences of over exploitation of
groundwater are well known, e.g. groundwater depletion, groundwater quality deterioration,

13
ecosystem degradation, and in some cases land subsidence or sea water intrusion (Sophocleous,
2002; Konikow and Kendy, 2005; Fogg and LaBolle, 2006). During the past 50 years, excessive
groundwater depletion has become a global problem, affecting major regions of North Africa,
the Middle East, South and Central Asia, North China, North America, and Australia (Shah et al.,
2000; Shah et al., 2003; Konikow and Kendy, 2005). The North China Plain is one of the prime
examples of this problem (Alley et al., 2002).
Groundwater sustainability is commonly defined as groundwater development in a
manner that can be maintained for an indefinite time without causing unacceptable
environmental, economic, or social consequences (Alley et al., 1999). Groundwater depletion
refers to sustained loss of groundwater from storage (Hurd et al., 1999; Kinzelbach et al., 2003).
As discussed by Theis (1940), some loss of water from aquifer storage always occurs in response
to any increase in withdrawal from wells. If pumping is initiated in a previously untapped aquifer,
the storage loss will continue until the natural discharge from the aquifer is decreased, and/or the
original recharge rate to the aquifer is increased, by amounts which sum to the total pumping. At
that point a new equilibrium prevails, in which the pumping replaces the natural discharge that
has been lost and accounts as well for any increase in recharge that has occurred. If the aquifer is
initially in use but the pumping rate is increased, the same principle apply, except that a new
equilibrium will not be attained until the total initial discharge has decreased and/or the recharge
has increased, by amounts which sum to the increase in pumping. Should the pumping be
increased by an amount which exceeds the sum of the total reduction in initial discharge and the
total increase in recharge which can be achieved, storage loss will continue until ultimately
falling water levels will force a reduction in pumping rate.
14
Persistent, multi-year declines of water level are usually an indication that pumping has
in fact reached levels that cannot be balanced by the increases in recharge and decreases in prior
discharge which are possible in the aquifer, and thus that the level of pumping is not sustainable.
However, careful analysis of the initial flow regime, the changes imposed to date by pumping,
and the changes likely under continued pumping are generally needed to confirm this
interpretation. These analyses are usually done with the help of flow simulation. Reasonable
information on the components of the water budget and the characteristics of the flow regime at
the various stages of aquifer utilization can only be gained through flow simulation.
Sustainability assessments depend on such information, and must consider areas and periods of
unevenly distributed pumping and recharge fluctuation with time (Alley et al., 1999, 2004;
Foster, 2000). Given the complexity and heterogeneity of aquifer systems, and the ability of
numerical modeling to integrate different data and to evaluate regional groundwater dynamics,
simulation is clearly an excellent tool for use in sustainability assessments (Luckey and Becker,
1999; Kinzelbach et al., 2003; Konikow and Kendy, 2005; Welsh, 2006).
In the North China Plain (NCP), several numerical models have been built to evaluate
groundwater resources and flow dynamics. However, none of these models appears suitable for
evaluation of the water balance and the impact of groundwater development across the entire
NCP. Some were developed to assess groundwater budget during predevelopment (Zhang et al.,
2008), or to evaluate flow dynamics over a relatively short period after the groundwater had been
highly developed (Wang et al., 2007, 2008; Shao et al., 2009). Those models that did have
relatively long simulation periods focused primarily on the shallow part of the aquifer system
(Zhang, 2007; Cui et al., 2009; Xue et al., 2010); however, the deep part of the aquifer system
plays an important role in water supply. Additionally, many of the existing models were

15
restricted to local areas of the NCP (Jia and Liu, 2002; Xie et al., 2002; He et al., 2003; Shao et
al., 2003; Hu et al., 2010).
A further limitation of most existing models is that groundwater recharge is calculated by
multiplying precipitation by a coefficient which is taken constant over time; this approach does
not allow simulation of the impacts of water level decline on recharge. The objective of this
study was to develop a numerical groundwater flow model for the entire NCP for both
predevelopment (1960s) and post-development (1960s–2008) conditions. Groundwater recharge
was varied to match steady state and transient groundwater level data. The calibrated flow model
provides a tool for comprehensive assessment of long-term large-scale groundwater balance and
sustainability issues.
2.2. Study Site and Hydraulic Data
2.2.1. Study Site
The North China Plain (NCP) as defined in this study ranges the Yanshan Mountains in
the north, the Bohai Sea on the east, the Yellow River in the south and the Taihang Mountains on
the west (Figure 2.1). Some studies define the NCP as extending to the Huaihe River in the south
(Song et al., 2010). The total area of the NCP as defined is ~140,000 km2. The NCP covers the
entire plains of Beijing Municipality, Tianjin Municipality and Hebei Province, and the northern
parts of plains of the Shandong and Henan Provinces. The population of the NCP, based on 2000
county census data, is ~105 million (National Bureau of Statistics of China, 2003). The average
population density is ~800 persons per km2, ranging from to ~ 400 persons per km2 in rural areas
to ~12,000 persons per km2 in the Beijing City urban area. The region accounts for ~15% of
16
China’s total gross domestic product (GDP) and ~ 10% of total grain production based on the
2009 statistical data (China Statistical Yearbook, 2010).
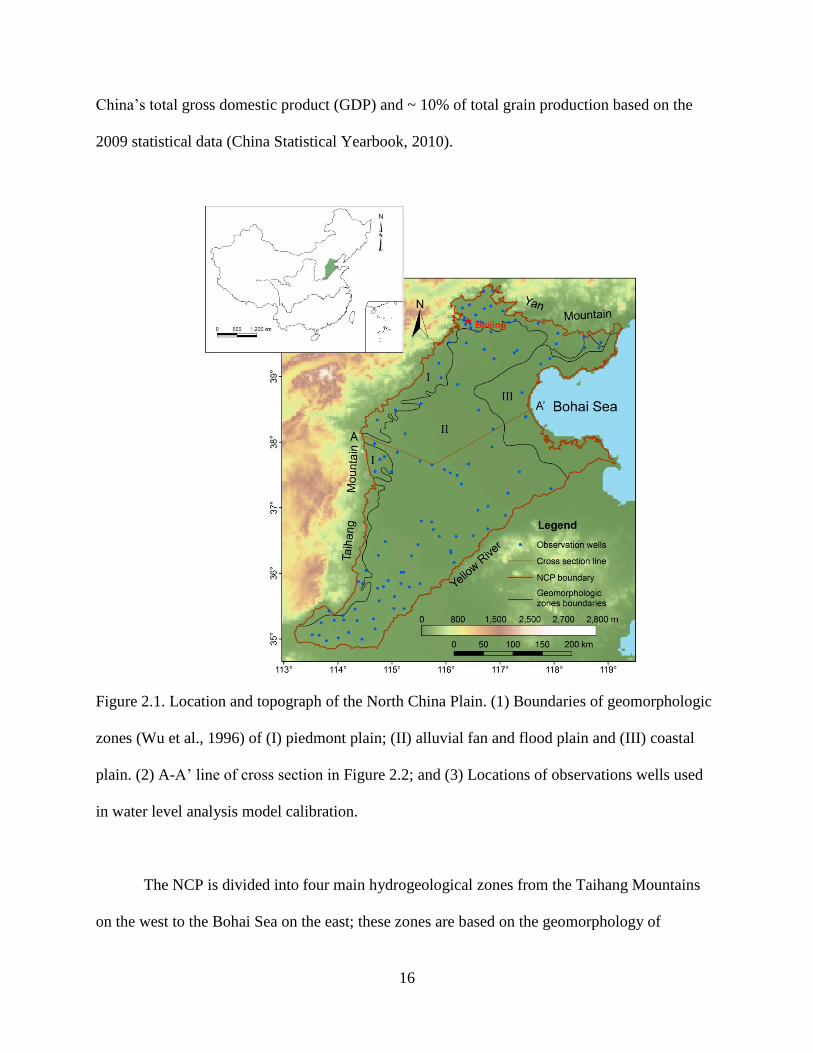
Figure 2.1. Location and topograph of the North China Plain. (1) Boundaries of geomorphologic
zones (Wu et al., 1996) of (I) piedmont plain; (II) alluvial fan and flood plain and (III) coastal
plain. (2) A-A’ line of cross section in Figure 2.2; and (3) Locations of observations wells used
in water level analysis model calibration.
The NCP is divided into four main hydrogeological zones from the Taihang Mountains
on the west to the Bohai Sea on the east; these zones are based on the geomorphology of

17
palaeochannels, in the sense that geomorphology has defined their sedimentary character and
relative geographic positions, as piedmont plain, alluvial fan, alluvial plain, and coastal plain
(Wu et al., 1996). In turn the sedimentary character and geographic position have determined the
geohydrologic rules of the four zones: mountain and piedmont plain as the groundwater recharge
zone, parts of the alluvial plain and coastal plain as the regional groundwater discharge zone, and
the alluvial fan and part of the alluvial plain as an intermediate zone (Chen et al., 2004). The
alluvial fan and alluvial plain, which were formed through the depositional process of the Yellow
River, Haihe River, Luanhe River and their tributaries (Wu et al., 1996; Xu et al., 1996)
constitute the main part of the NCP. The topography is relatively flat with an average elevation
of ~ 30 m a.s.l and slopes from ~100 m a.s.l, at the base of the Taihang Mountians in the west, to
sea level at the coast (Figure 2.1). The piedmont are is the primary area of grain production in the
NCP, where the percentage of wheat cultivation area is much higher than the mean value across
the NCP and most of irrigation is from groundwater (Zhang et al., 2010). According to data on
crop water deficit from 1990 to 2000, the volumes of groundwater consumed by the wheat and
maize are ~5,000 and ~3,000 m3/ha in the piedmont plain and central plain, respectively (Xu et
al., 2005).
The climate in the NCP is continental semi-arid, with mean annual temperature of 12–
13 °C and mean annual precipitation of 400-700 mm (Chen, 2003). Precipitation, influenced by
the East Asia monsoon, decreases from southeast to northwest, and ~70–80% of precipitation
occurs during the monsoon season from June through September (Chen, 1999). Mean annual
precipitation was ~560 mm from 1951 to 2008, and decreased from ~600 mm in the 1950s to
~500 mm in 2000s based on the precipitation at 23 meteorological stations available from the
China Meteorological Administration (http://cdc.cma.gov.cn, accessed in January 2011). Mean

18
annual pan evaporation ranges from 1,100 to 2,000 mm (Chen, 2005), as measured using 20 cm
diameter evaporation pans.
Winter wheat and summer maize are the main crops in the NCP rotation system,
accounting for ~80% of total cultivated area and ~90% of grain yield based on statistical data
from 2009 (China Statistical Yearbook, 2010). Winter wheat is sown at the beginning of October
and harvested in mid-June the following year, and summer maize is planted immediately after
wheat harvest and harvested at the end of September the same year. Long-term lysimeter
measurements show that annual water consumption of the two crops without water deficit
exceeds precipitation by ~300 mm in the Piedmont area (Liu et al., 2002). The monsoon season
coincides with the growing season of maize, whereas only 20–30 % of annual precipitation falls
during the wheat growing season (Liu et al., 2001). As a result, supplemental irrigation is
required for the two crops, especially for production of winter wheat. In recent years,
groundwater has provided ~70% of the total water supply to support grain production and ~50%
of the total urban water supply (Han, 1998); 70–80 % of groundwater exploitation is used for
irrigation (Zhang et al., 2009, 2010).
The Quaternary aquifer of the NCP is traditionally divided into two aquifer zones
referred as the ―shallow‖ and ―deep‖ (Fei, 1988). Extensive groundwater exploitation from the
two aquifer zones has greatly impacted the hydrodynamic and hydrogeochemical system and
caused many environmental problems, such as groundwater depletion, groundwater
contamination and salinization, and land subsidence (Liu et al., 2001). Among these problems,
continuing groundwater depletion in both shallow and deep aquifer zones is a common concern.
Recent field investigations and water level monitoring data have shown that: (a) the maximum
water table depth in the shallow aquifer has reached 65 m, and the area with the water table

19
declines ≥10 m below the land surface is ~62,000 km2, or ~45% of the entire plain; and (b) the
maximum depth to potentiometric surface in the deep aquifer has increased to 110 m, and the
area with the water table or potentiometric surface elevation less than the sea level is ~ 88,000
km2, covering ~70% of the entire plain (Fei et al., 2009).
2.2.2. Hydraulic Data
Data availability in the study area was an important consideration in the selection of
methods to evaluate sustainability of groundwater resources in the NCP. The most direct
approach to the monitoring of groundwater storage change is to use groundwater level
monitoring data, multiplying the water table elevation change by the specific yield and the map
area affected (Konikow and Kendy, 2005). Historical groundwater level data were collected by
the China Institute of Geo-Environmental Monitoring (CIGEM). The data set includes 230
monthly water level monitoring time series from 1993 to 2008 obtained from 178 monitoring
wells (in which 38 wells are multilevel) belonging to the national groundwater level monitoring
network (http://www.cigem.gov.cn, accessed in January 2011). The distribution of wells
monitored in this study was fairly sparse, especially in some parts of the central plain and coastal
plain, where there are relatively few wells in the shallow aquifer zone because shallow
groundwater is brackish and not potable.
In addition to the groundwater level monitoring data set, several series of historical water
level contour maps were available from the China Geological Survey (CGS): maps of the
shallow aquifer zone were available for 1959, 1984, 2001, 2002 (Zhang and Fei, 2009); maps of
the deep aquifer zone were available for 1980, 2001, 2002,2003,2004 (Zhang and Fei, 2009);
maps of each aquifer zone in the Hebei Plain were available for 1959, 1975, 1985, 1992 (Zhang
et al., 2000); and a map of the deep aquifer zone in the Hebei Plain was available for 1969

20
(http://water.cgs.gov.cn, accessed in January 2011). The groundwater level monitoring data set
and these historical ground water level contour maps were used to estimate groundwater storage
change and to calibrate the flow model. Although the available water level monitoring time
series did not cover the entire period since the beginning of groundwater development, they were
the best available data at measurement frequencies sufficient for the estimation of monthly and
seasonal changes in groundwater storage, and were therefore utilized for that purpose.
Hydraulic conductivity, specific yield, and storage coefficient are the principal hydraulic
parameters in the NCP. Investigation work to estimate the hydraulic parameters across the NCP
began in the 1970s, and most of parameters were estimated in the 1980s (Chen, 1990). The
hydraulic conductivity, specific yield, and storage coefficients were estimated using pumping
test data. No detailed information from these pumping tests was collected in this study, but
values of these hydraulic parameters were summarized for the different lithologies across the
NCP by Chen (1999) and Zhang et al. (2009). Horizontal hydraulic conductivity of gravel
generally ranges from 150–700 m/d and 50–100 m/d in the shallow and deep aquifer zones,
respectively. Horizontal hydraulic conductivity of sand generally ranges from 5–200 m/d and 5–
60 m/d in the shallow and deep aquifer zones, respectively. Specific yield ranges from ~3 % for
clay to ~30 % for gravel. Storage coefficient in the deep aquifer zone decrease from 0.001–0.008
in the alluvial plain to 0.0004–0.0005 in the coastal plain. Horizontal hydraulic conductivity,
specific yield, and storage coefficients were mapped across the entire NCP by the CGS (Zhang et
al., 2009). The mapped hydraulic parameters had been verified by several modeling studies in
the NCP (Wang et al., 2007, 2008; Shao et al., 2009; Zhang et al., 2009), and were not adjusted
during model calibration in this study.
21
2.3. Groundwater Storage Change from Water Level Change
The groundwater level contour map for 1959 was used to calculate the initial
groundwater in storage in the NCP. The bottom elevation of the Quaternary aquifer across the
NCP is not clearly defined because most boreholes do not penetrate the entire section of
Quaternary strata (Zhang et al., 2009). The saturated thickness used to estimate the initial storage
was calculated by subtracting a contour map interpolated from the bottom elevation of the
boreholes from the water level contour map. All historical water level contour maps were
digitized and then converted to a grid using 2×2 km cells, which is the same grid scale as was
used in the flow model. Groundwater level changes in the shallow aquifer zone were converted
to storage changes by multiplying by the specific yield across the NCP (Zhang et al., 2009).
Cumulative groundwater storage change and changes were then estimated using historical water
level contour maps and the more recent monitoring time series.
The primary challenge for estimating groundwater storage changes using water level
changes directly in the NCP is accounting for significant gaps in the groundwater level
monitoring time series. The estimated storage change would be highly questionable if these gaps
were retained in the calculation process. Preliminary tests showed that different gap filling
regression methods resulted in large variations in estimated groundwater depletion. In this study,
instead of using a regression method to fill the gaps, two groundwater level contour maps were
first generated by inverse distance weighting (IDW) interpolation using monitoring locations
where both monitoring data in the two date sets were available, then the groundwater level
change was calculated. Based on the data obtained from 22 pumping tests, the mean storage
coefficients of the deep aquifer is 0.00125, which is approximately 2% of the area weighted
specific yield of the shallow aquifer (Chen, 1999). Therefore, the amount of groundwater

22
depletion in the deep aquifers is much less than that in the shallow aquifer, and is ignored in the
storage change calculation. A total of 117 monitoring wells located in the shallow aquifer were
used to calculate groundwater storage change.
2.4. Simulation of the Groundwater Flow System
2.4.1. Conceptual Model of the Groundwater Flow System
In the first regional hydrogeological survey conducted in 1970s (Hebei Bureau of
Geology and Mineral, 1977), the Quaternary aquifers in the NCP were divided into four major
aquifer units (I, II, III and IV; Figure 2.2). The geologic units corresponding to these aquifers are
Holocene series (Q4), and late (Q3), middle (Q2) and early (Q1) Pleistocene series (Zhang et al.,
2009; Foster, 2004). The shallow aquifer zone, as used in this study, corresponds to the first and
second aquifer units as defined in the earlier work; the deep aquifer zone, as used here,
corresponds to the third and fourth units of the earlier classification. A total of 38 multilevel
monitoring wells in the CIGEM monitoring nests show a pervasive downward hydraulic gradient
and a generally increasing trend in the magnitude of that gradient with time. The magnitude of
the vertical hydraulic gradient ranges from a minimum of 0.04 in areas with little pumping to a
maximum of 0.3 within cones of depression. No detailed information on depths of pumping
wells is available for the NCP. To simplify model construction, groundwater flow was assumed
to be horizontal in each separate aquifer, and rates of flow exchange between aquifers were
simulated explicitly by the model.
Precipitation is the dominant source of groundwater recharge in the NCP; other sources
of natural recharge include lateral flow from the Taihang and Yan mountains and leakage from
the lower reach of the Yellow River. Mountain front lateral flow is a significant source of
23
recharge, but is not well understood or quantified (Kendy et al., 2003). Recharge rates from
lateral flow, used in previous regional water resource evaluations, ranged from 1.0 to 2.0 km3/yr
(Zhu et al., Assessment of Groundwater Source in North China Plain, unpublished report, 1990;
Zhang et al., 2009), and were assumed to be restricted to the shallow aquifer (Liu and Wei, 1989).
Some researchers made measurements of percolation rates at a number of selected sites along the
Taihang Mountain front (Chen et al., 2003; Li et al., 2007; Song et al., 2007). A limitation of the
approach is that the total surface area undergoing recharge must be estimated to calculate
regional recharge rates. The amount of lateral flow from the mountain area depends on the
horizontal permeability, thickness of the saturated zone, and local hydraulic gradient. Estimated
mountain front recharge using Darcy’s law based on water level contour maps in this study is 2.8,
2.1 and 3.1 km3 in 1959, 1984, and 2001, respectively.
Figure 2.2. Hydrogeological cross section of the NCP along A-A’ in Figure 2.1 (modified from
Chen et al., 2005).
24
The lower reach of the Yellow River, flowing from the Taohuayu to the Bohai Sea,
serves as the south boundary of the NCP defined in this study. In this section, accumulated
sediment deposits have raised the riverbed several meters higher than the grounds, forming
―above-ground river‖. Leakage from this reach of the Yellow River to the NCP was estimated to
have decreased from ~0.6 km3/yr in the 1980s to ~0.4 km3/yr in the 1990s (Jiao et al., 2005; Ma
et al., 2005) because of the severe cutoff of the lower reach in the 1990s (Cai and Rosegrant,
2004; Liu and Xia, 2004). Analyses of groundwater dynamics and isotope data indicate that the
area affected by seepage from the Yellow River is limited to 10–20 km wide (Zhao et al., 2003).
More than 1,000 reservoirs have been constructed in the NCP since 1950s; these reservoirs
control over 90% of the upstream area. Due to overdevelopment of surface water and
precipitation decreasing, the runoff in the NCP has shrunk significantly and the leakage to
groundwater is limited.
Groundwater is the primary source of water for irrigation in this area (Zhang et al., 2003),
and the area irrigated by groundwater accounts for ~70% of the total irrigation area (Liu et al.,
2004). The other ~30% irrigation water is derived from upstream reservoirs and the Yellow
River by canals. Irrigation return flow is significant because furrow irrigation and flood irrigation
are still the primary irrigation techniques applied both for irrigated area using surface water and
area using groundwater (Jiang et al., 2009). Detailed information about irrigation areas and
applied amount is not available. In this study, natural recharge from precipitation and recharge
from irrigation return flow was estimated as total recharge through model calibration. Therefore,
the results should reflect recharge from the sum of precipitation and total irrigation, whether the
irrigation is originally derived from surface water or groundwater. Using classical groundwater
model calibration or inverse modeling to estimate recharge from information on water levels and
25
hydraulic conductivity may lead to non-unique results (Scanlon et al., 2002) due to the high
correlation between recharge rate and hydraulic conductivity. In this study, most of the hydraulic
conductivities were obtained from pumping tests and had been verified by previous studies.
Therefore, the hydraulic parameters were assumed to be representative, and recharge rates were
the primary calibration parameters.
Natural discharge from the NCP aquifer occurs as discharge to streams,
evapotranspiration from the water table in areas of shallow depth and diffuse groundwater flow
across the eastern boundary of the shallow aquifer zone to the Bohai Sea. Runoff data are
unavailable for streams during predevelopment. In the steady state flow model constructed for
the predevelopment by Zhang et al. (2008), river (RIV) package of MODFLOW was used to
estimate the discharge to streams by mean monthly stream stages in 1965. Natural discharge to
streams during predevelopment was estimated ~9.0 km3/yr by this method; this estimate
provided water budget information helping to calibrate the steady state model in this study. Little
is known about the discharge to the Bohai Sea, but the amount is thought to be small because the
hydraulic conductivity is relatively small for the coastal aquifer and because the horizontal
hydraulic gradient in the coastal plain is quite low.
Artificial discharge from the aquifers in the NCP occurs as pumping by numerous wells.
The volumes of groundwater discharge through pumping are shown in Figure 2.5. The 1970s
was the time of most rapid agricultural development in the NCP, and is the period of most
rapidly increasing groundwater pumpage. In the 1980s and 1990s, groundwater pumping still
increased, but at a relatively slow rate, as agricultural and industrial development continued.
Since the beginning of 2000, environmental problems caused by excessive exploitation of
groundwater have focused attention on environmental problems, and agricultural water saving

26
measures have been promoted; as a result, groundwater pumping has shown a slight decreasing
trend (Zhang et al., 2009).
2.4.2. Flow Model Construction
A multi-layer, heterogeneous and anisotropic model was built to simulate the flow system
in the NCP using MODFLOW-2000 (Harbaugh et al., 2000). The SRTM (Shuttle Radar
Topography Mission) (Rabus et al., 2003) elevation data at 90 m resolution were aggregated to
the model grid and used as the model top elevation. Borehole data were not obtained in this study.
As an alternative, four aquifer units’ bottom elevation contour maps were digitized and then
interpolated into the model grid as needed by the layer-property flow (LPF) package (Harbaugh
et al., 2000) of MODFLOW.
The finite discrete grid consisted of 325 rows and 300 columns, with a regular cell size of
2×2 km. In the three-dimensional reconstruction of the aquifer system, the model grid was
discretized into three layers, rather than into the four layers as identified in the conceptual model.
Aquifer units I and II were combined and represented by the first layer of the grid. One reason
for doing this is that aquifer units I and II are highly connected hydrologically in the piedmont
area and in depression cones due to pumping wells’ penetrating the two units. Moreover, during
the post-development period, parts of aquifer unit I in the piedmont area became dry. If a
separate layer had been used to represent this unit, MODFLOW would have made the wells
located in this layer invalid automatically, and the distribution of total pumping would be
problematic. A different number of active cells were used in each layer to represent their distinct
areal extent. Layer 1 (shallow aquifer zone) has 34329 active cells, layers 2 and 3 (deep aquifer
zone) 32451 cells each. The flow model first simulated steady state flow based on the 1959 water
level data set and then simulated post-development from 1960 through 2008. The transient model
27
was divided into 49 stress periods of one year each. Pumpage and other source/sink terms were
considered to be constant in each stress period.
The definition of a set of appropriate boundary conditions (BCs) for each layer was part
of the model calibration process considering the actual magnitude and direction of flow across
the boundaries. Combinations of specified-head and specified-flow boundaries were set for layer
1. A specified-head boundary was defined along the eastern boundary, coincident with the
coastline of the Bohai Sea, assuming the shallow aquifer zone is hydraulically connected with
the sea. Specified-flow was used in all parts of the boundary between the mountain area and the
plain to represent the lateral flow from the Yan and Taihang Mountains assuming that lateral
flow only occurs in the shallow aquifer zone. To simplify the process of model construction and
calibration and considering the available data, the southeast boundary along the Yellow River
was also defined as a specified-flow boundary. Boundaries for layer 2 and 3 were assumed no-
flow.
The spatial distribution and application times of irrigation were unknown. Considering
that the total recharge is the primary concern and goal of this study, as mentioned previously,
recharge from precipitation and irrigation return flow (including irrigation from surface water
and groundwater) were combined to represent the total areal recharge. At present, more than 40%
of the river channels have dried up or become seasonal streams, and the area of wetlands has
shrunk from 10,000 km2 in 1950s to ~ 2,000 km2 (Xia, 2006). Mean annual discharge to the
rivers from 1980 to 2000 is ~0.032 km3 (Ren, 2007), which is much less than pumpage.
Therefore, rivers were not simulated explicitly in this study, and discharge rates were combined
with the pumpage.

28
Statistical pumpage data were available from 1980 through 2008 (Hai River Water
Resources Commission (HWCC), Haihe Basin Water Sources Bulletin 1998-2008,
http://www.hwcc.gov.cn, accessed in January 2011; Beijing Water Authority, Beijing Water
Sources Bulletin 2003-2008, http://www.bjwater.gov.cn, accessed in January 2011; Tian Water
Authority, Tianjin Water Sources Bulletin 2002-2008, http://www.tjsw.gov.cn, accessed in
January 2011; Water Resources Department of Hebei Province, Hebei Water Sources Bulletin
2000-2007, http://www.hbsw.net, accessed in January 2011; Water Resources Department of
Shandong Province, Shandong Water Sources Bulletin 2003-2008, http://www.sdwr.gov.cn,
accessed in January 2011; Ren, 2007; Zhang et al., 2009). In the NCP, the volume of
groundwater pumped for irrigation per metric ton of grain production was approximately 450 m3
based on total groundwater pumpage and total grain yield statistical data from 1980 through
2008. Total groundwater pumpage before 1980 was estimated based on total grain yield
assuming that number to be applicable over the entire NCP. The groundwater exploitation data
collected in this study were annual pumpage figures at province-level; thus it was necessary to
redistribute this pumpage data to active cells of the model. The planting area for wheat and corn
covers approximately 50% of the total land area and 70% of the total cultivated area (Xu et al.,
2005; Han et al., 2008). In 2000, a total number of 835,370 wells were used over the Hebei
Province, which means ~ 4.4 wells/km2 (Zhang and Li, 2005); thus the withdrawal from each
model cell should represent the discharge from more than 16 pumping wells. This was achieved
in the simulation by locating one ―virtual‖ pumping well in each active model cell, which
accounted for all the simulated withdrawal in that cell. To simplify the model input process, all
recharge terms in each cell in layer 1 were converted into volume rates and combined together
29
with the pumping in that layer into one term; this term and pumping in the other two layers were
input into the model through the well (WEL) package.
Evaporation from the water table was simulated by the linear segmented
evapotranspiration (ETS) package which uses a user-defined segment line to conceptualize the
relationship between water table evaporation and hydraulic head (Banta, 2000). Compared with
the evapotranspiration (EVT) package, the ETS package can more closely represent the actual
nonlinear relationship between evapotranspiration and water table depth (Doble et al., 2009).
Evaporation extinction depth was assigned to 4 m uniformly across the plain, and the potential
evapotranspiration calculated using the Pemnan-Monteith equation (Yang et al., 2009) is
converted to the maximum evapotranspiration rate needed by ETS. The segmentation is decided
according the field measurements of evaporation at different water table depth in the NCP (Li,
2008).
2.4.3. Model Calibration
The calibration process was divided into three parts: calibration of the steady state model;
calibration from 1960 through 1992 only using historic water level contour maps and detailed
calibration from 1993 through 2008 of the transient model. The steady state model representing
predevelopment was calibrated using the groundwater level contour map across the NCP for the
shallow aquifer zone and the potentiometric surface map across the Hebei Plain for the deep
aquifer zone in 1959. Combinations of trial-and-error method and inverse modeling using PEST
(Doherty, 2003) parameter estimation package were implemented in the calibration process of
the steady state model. The total areal recharge in each county administrative region was the
primary calibration parameter. The ratio between vertical and horizontal hydraulic conductivity
(Kh/Kv) was also adjusted in calibration and a uniform value of 10,000 was estimated. Given the
30
horizontal hydraulic conductivity of 3–200 m/d with previously reported vertical hydraulic
conductivity of 0.00003–0.0003 m/d for clay, and 0.005–0.007 m/d for the sand (Chen, 1990) in
the NCP, this Kh/Kv ratio is representative.
Figure 2.3. Comparison of observed and simulated water level contours in the shallow aquifer
zone in (a) 1959 and (b) 1984.
Using the water level distributions as the initial condition for the transient flow model,
the transient model was first roughly calibrated to 1992 data only using water level contour maps
in 1975, 1984, and 1992 (Zhang, 2000; Zhang et al., 2009), and then calibrated from 1993
through 2008 using monitoring water level time series. In this two part calibration process, total
areal recharge in each county administrative region was the primary calibration parameter, and
the spatial distribution of pumping was also adjusted through the trial-and-error calibration
process. Because the majority of wells were monitored manually, the water level monitoring
time series data were pre-filtered to remove obvious erroneous data prior to being used for model
calibration. Due to lack of detailed information on the distribution of irrigated fields or an

31
irrigation density map, the province-level pumpage was first redistributed by county by
comparing simulated with measured water level changes, and then was divided equally into each
active cell in the county.
Figure 2.4. Comparison between observed and simulated annual water levels from 1993 through
2008 at (a) 105 shallow observation wells (in model layer 1), total 1231 observations, and (b) 72
deep observation wells (in model layer 2 and 3), total 871 observations. Dotted lines indicate the
95% prediction intervals.
Figure 2.3 shows simulated and measured annual average groundwater level contours in
1959 and 1984 in the NCP. The goodness of fit between simulated and measured water levels in
the monitoring wells from 1991 through 2008 is presented in Figure 2.4. The mean error (ME)
between simulated and measured water levels was -3.76 m and the root mean square error
(RMSE) was 7.29 m for the 105 shallow observation wells (in model layer 1). The ME and
RMSE were -2.38 m and 15.12 m, respectively, for 72 deep observation wells (in model layer 2
and 3), total 871 observations.

32
2.5. Results and Discussion
The calibrated steady-state distribution of hydraulic head representing the water table in
pre-development is shown in Figure 2.3a. The simulated water table decreases gradually from 90
m depth in the piedmont area of the Taihang Mountain to ~5 m depth in the coastal plain.
Hydraulic gradients are up to 30% in the piedmont area of Taihang and Yan Mountains and
relatively flat in the central and east part of the plain. The flat hydraulic gradient in the coastal
plain means that the amount of water discharged into the Bohai Sea is limited, and groundwater
is discharged mainly through ET and leakage to rivers. In plain view, groundwater flowed into
the plain from the mountain area and then discharged to the Bohai Sea. Vertically, the deep
aquifer zone received leakage from the shallow aquifer zone in the piedmont area and then
discharged to the shallow aquifer in the central and coastal plains. In 1959 and 1960s, the depth
to the water table was 0–3 m below the land surface in most places. Increasing groundwater
withdrawals since the 1970s caused continuing decline of groundwater levels (Figure 2.5).
Simulated annual water table depth shows a nearly linear declining trend (R=0.97). The slope of
the trend line shows an annual water table decline of 0.3 m. Most of the cones of depression in
the shallow aquifer zone were beneath cities in the piedmont districts east of the Taihang and
Yan Mountains. The depression cones in the deep aquifer beneath the eastern part of the plain
merged together and formed an extensive, regional cone of depression.
Figure 2.6 shows the monthly and seasonal groundwater storage changes calculated using
water level change data. Groundwater storage is lowest in spring (March–May) corresponding to
the grain-filling stage of winter wheat (April and May) in the NCP. Groundwater is replenished
mostly during the summer/rainy season (July–September), which corresponds to the maize
cropping season. Generally, maize cultivation does not have much impact on groundwater

33
depletion except during drought years, such as 1997, 1999 and 2002, when average annual
precipitation was less than 400 mm. From October to the beginning of winter wheat irrigation in
the following March, which is the cultivation and vernalization period of next season’s winter
wheat, groundwater storage gradually increases.
Figure 2.5. Total groundwater pumping and simulated annual averaged water table depth in the
NCP. The annual groundwater pumpage before 1980 was estimated.
Figure 2.6. Monthly and seasonally averaged groundwater storage change in the NCP calculated
using water level changes data.
34
The trend in simulated groundwater storage change from 1970 through 2008 is shown in
Figure 2.7 and Figure 2.8. Because in the NCP where water levels are influenced by precipitation,
well pumping and return flow due to applied irrigation, aquifer storage cannot be estimated
accurately through by water level change analysis. Moreover, only 130 monitoring wells were
chosen to be used for storage estimation, which accounts for approximately one well per 1,000
km2. These explain the bias that exists between storage variation calculated by water level
change and simulated by the model in Figure 2.7. By the end of 2008, the simulated total
groundwater storage depletion is ~130 km3, which is ~3.5% of total initial groundwater storage.
Estimated annual groundwater depletion is ~4.0 km3, which corresponds to an average of 0.3
m/yr decrease in groundwater levels across the entire NCP with area weighted specific yield of
0.075. The results showed an overall depletion trend except in 1973, 1977 and 1990 when annual
precipitation exceeded 700 mm and in 1996 when the NCP was affected by a severe flood event.
Mean annual groundwater depletion was ~2.5 in 1970s, and increased to ~4.0 km3 in 1980s. The
mean depletion rate was ~2.0 km3/yr in 1990-1996; in this period the precipitation show an
increasing trend. The mean depletion rate was ~5.0 km3/yr in 1997–2008, which is the period
with smallest precipitation. Model estimated annual groundwater storage change was highly
correlated with precipitation (R=0.92) and was not well correlated with total pumpage (R=-0.38).
Groundwater budgets in the shallow and deep aquifer zones were calculated separately
using Zonebudget (Harbaugh, 1990) to separate depletion from the two zones. Average
groundwater depletion between 1970 and 2008 was 28 mm/yr in the shallow aquifer and 2.6
mm/yr in the deep aquifer. The approximately 10 times difference in depletion between the
shallow and deep aquifer zones indicates that groundwater exploitation from the shallow aquifer
zone was the main driving force of the groundwater depletion in the NCP. The depression cones

35
in the deep aquifer beneath the eastern part of the plain were mainly caused by extensive
groundwater pumping for industrial and urban use. With development of the deep groundwater,
leakage from the shallow aquifer zone had been facilitated. In 2008, calculated leakage from the
shallow aquifer zone accounted for more than 90% of total pumpage from the deep aquifer zone.
This is consistent with water levels in the shallow aquifer zone becoming generally higher than
those in the deep aquifer zone.
Figure 2.7. Cumulative storage change with 1959 as the base year calculated using water level
changes data (dots) and simulated by the model (line) and corresponding change of total
groundwater storage in the NCP.
The calibrated mean annual spatially averaged groundwater recharge across the NCP was
130 mm including 120 mm from precipitation and irrigation and 10 mm from mountain front
recharge and leakage from the Yellow River. The calibrated average groundwater recharge is
consistent with previous point measurements and model results (Kendy et al., 2004; Lu et al.,
2010; Wang et al., 2008). Lower recharge corresponds to large droughts in 1972, 1980 and

36
higher recharge rates correspond to extensive flooding in 1996. Temporal variations in irrigation,
precipitation, and model-calibrated groundwater recharge are presented in Figure 2.9. Applied
irrigaiton in the NCP has been fairly constant since 1980. The trend of rechage variation shows a
similar pattern to the temporal distribution of annual precipitation in the NCP. The linear
correlation coefficient between model-calibrated annual groundwater recharge and annual
precipitation plus irrigation is 0.86; the results, imply that 21% of the total precipitation and
irrigation reach the aquifer as recharge.
Figure 2.8. Model simulated groundwater storage change and total groundwater recharge trend
from 1970 to 2008.
There is considerable spatial variability in pumpage and calibrated recharge over the NCP
(Figure 2.10). Calibrated recharge is highest (200–350 mm/yr) in the piedmont area, and
decreased to 50-100 mm in the central and coastal plains ares. Disagreement between the overall
patterns of groundwater recharge and spatial distribution of mean annual precipitation indicates
that surface boundary conditions, such as soil properties may also be a controlling factor on
spatial distribution of groundwater recharge. Uneven distribution of groundwater pumpage is
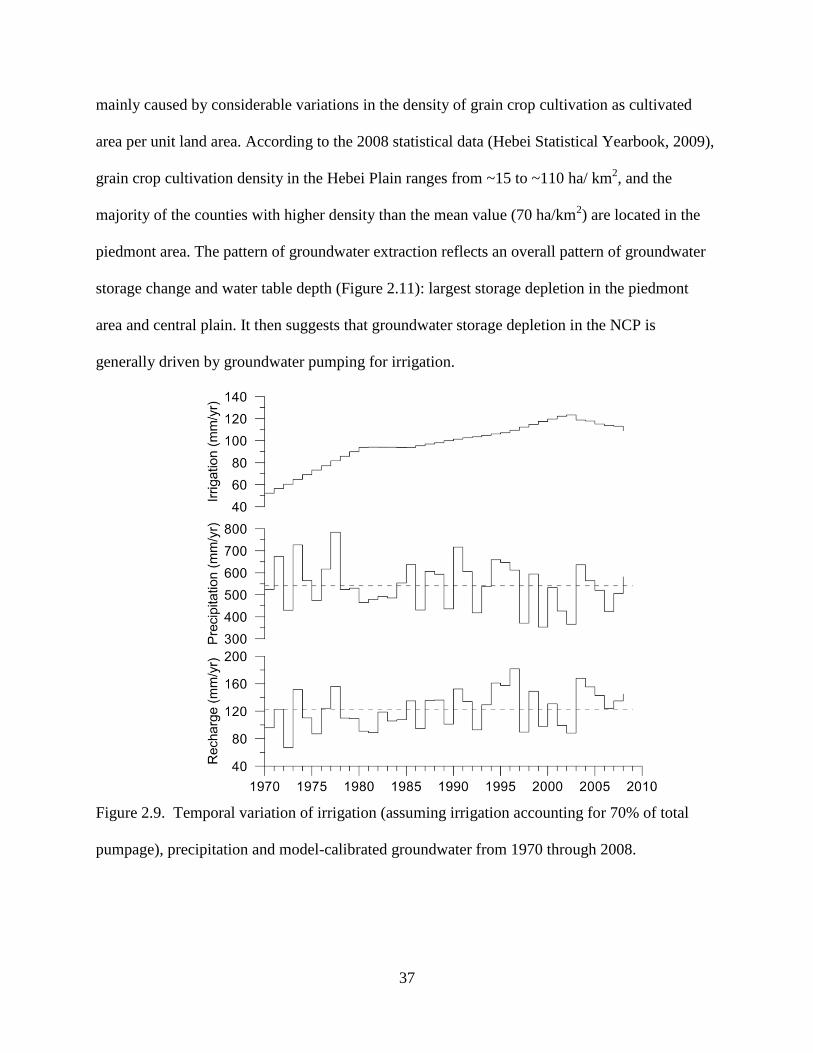
37
mainly caused by considerable variations in the density of grain crop cultivation as cultivated
area per unit land area. According to the 2008 statistical data (Hebei Statistical Yearbook, 2009),
grain crop cultivation density in the Hebei Plain ranges from ~15 to ~110 ha/ km2, and the
majority of the counties with higher density than the mean value (70 ha/km2) are located in the
piedmont area. The pattern of groundwater extraction reflects an overall pattern of groundwater
storage change and water table depth (Figure 2.11): largest storage depletion in the piedmont
area and central plain. It then suggests that groundwater storage depletion in the NCP is
generally driven by groundwater pumping for irrigation.
Figure 2.9. Temporal variation of irrigation (assuming irrigation accounting for 70% of total
pumpage), precipitation and model-calibrated groundwater from 1970 through 2008.
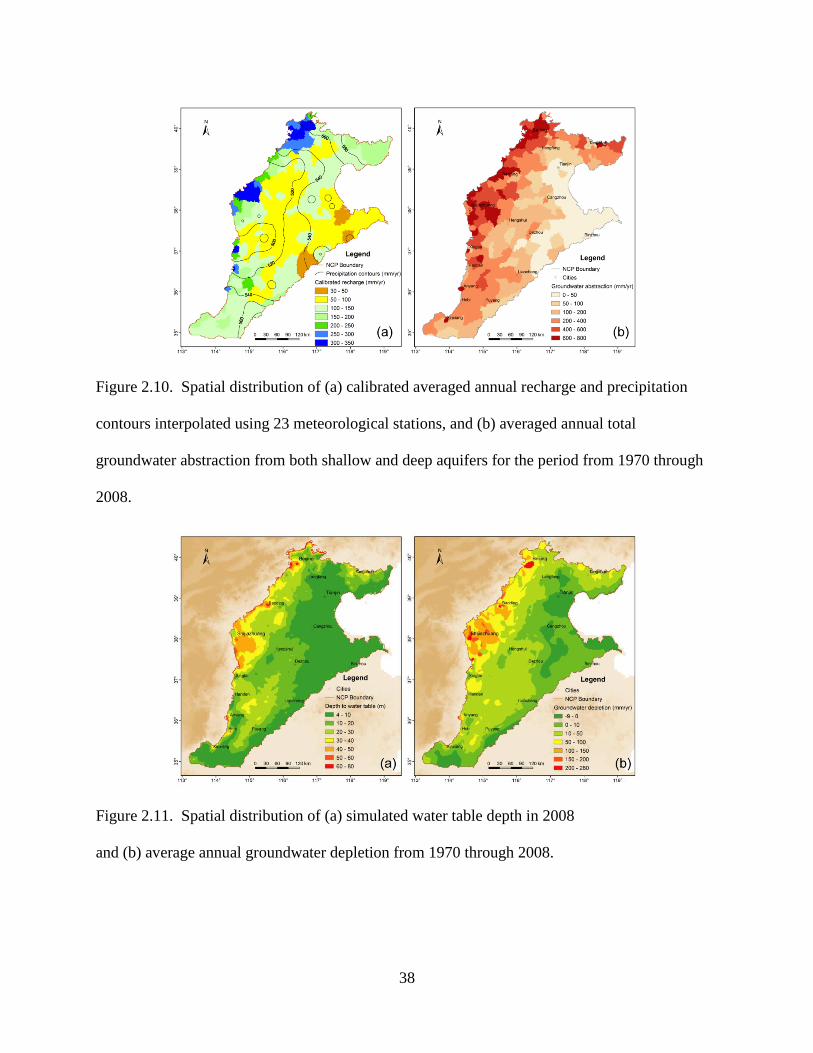
38
Figure 2.10. Spatial distribution of (a) calibrated averaged annual recharge and precipitation
contours interpolated using 23 meteorological stations, and (b) averaged annual total
groundwater abstraction from both shallow and deep aquifers for the period from 1970 through
2008.
Figure 2.11. Spatial distribution of (a) simulated water table depth in 2008
and (b) average annual groundwater depletion from 1970 through 2008.

39
2.6. Strategies for Sustainability
It is clear that the current level of groundwater in the NCP is unsustainable, and
numerous studies have been conducted to explore effective and feasible approaches to mitigate
groundwater depletion. Some of these studies are reviewed by Zheng et al. (2010) and Liu et al.
(2010).
Considering that groundwater depletion is caused mainly by winter wheat production, the
most effective means of reducing irrigation demand is by reducing irrigated acres of winter
wheat. However, over 70% of the food supply for local farmers is currently from wheat (Yang et
al., 2002). Importing food from outside is impractical. Moreover, considering that the wheat is
self-sufficient while the maize supply has relied on in part on importation, substantial reduction
of wheat acreage would conflict with the Chinese government’s emphasis on food security;
moreover, a simple change in agricultural crop rotation would be difficult. The most reasonable
strategies involve the augmentation and conservation of water resources.
Historically, a common response to flood and droughts in the NCP is to construct
reservoirs. The construction of reservoirs in the Hebei Province started in the 1950s. By the end
of 1988, there were total 1176 reservoirs in Hebei including 17 large reservoirs with single
storage capacity larger than 0.1 km3 (Hebei Water Conservancy, 1995). Majority of the large
reservoirs are located in the mountain front area of the Taihang and Yan Mountains, and control
over 90% of the upstream area. The recharge from the rivers has become seasonal. The central
plain has no suitable locations for dams and reservoirs. Depleted aquifers can be transformed
into underground ―reservoirs‖ by artificially recharging excess runoff when available.
In the NCP, the brackish water with locates below most of the middle and coastal plain,
where fresh water are pumped from the deep aquifer zone. At present, pumpage from the deep
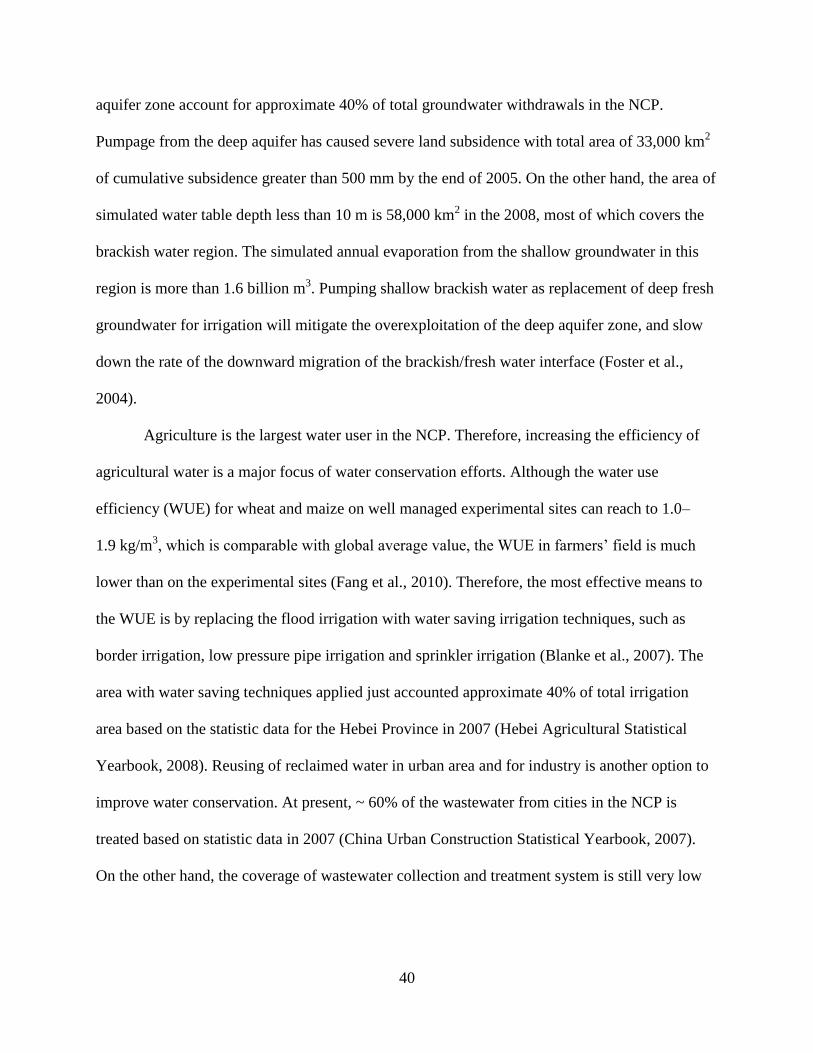
40
aquifer zone account for approximate 40% of total groundwater withdrawals in the NCP.
Pumpage from the deep aquifer has caused severe land subsidence with total area of 33,000 km2
of cumulative subsidence greater than 500 mm by the end of 2005. On the other hand, the area of
simulated water table depth less than 10 m is 58,000 km2 in the 2008, most of which covers the
brackish water region. The simulated annual evaporation from the shallow groundwater in this
region is more than 1.6 billion m3. Pumping shallow brackish water as replacement of deep fresh
groundwater for irrigation will mitigate the overexploitation of the deep aquifer zone, and slow
down the rate of the downward migration of the brackish/fresh water interface (Foster et al.,
2004).
Agriculture is the largest water user in the NCP. Therefore, increasing the efficiency of
agricultural water is a major focus of water conservation efforts. Although the water use
efficiency (WUE) for wheat and maize on well managed experimental sites can reach to 1.0–
1.9 kg/m3, which is comparable with global average value, the WUE in farmers’ field is much
lower than on the experimental sites (Fang et al., 2010). Therefore, the most effective means to
the WUE is by replacing the flood irrigation with water saving irrigation techniques, such as
border irrigation, low pressure pipe irrigation and sprinkler irrigation (Blanke et al., 2007). The
area with water saving techniques applied just accounted approximate 40% of total irrigation
area based on the statistic data for the Hebei Province in 2007 (Hebei Agricultural Statistical
Yearbook, 2008). Reusing of reclaimed water in urban area and for industry is another option to
improve water conservation. At present, ~ 60% of the wastewater from cities in the NCP is
treated based on statistic data in 2007 (China Urban Construction Statistical Yearbook, 2007).
On the other hand, the coverage of wastewater collection and treatment system is still very low

41
in majority of counties and towns (Wang et al., 2006). Therefore, there is significant potential for
agricultural water conservation.
Use source of water other than local groundwater, import surface water from outside river
basin. The Chinese government is heavily relying on the South-to-North Water Diversion
(SNWD) project designed to transfer water from the water-rich south, mainly the Yangtze River,
to the drought-prone north. It consists of three routes: the eastern, the central, and the western,
among which the middle and eastern routes will impact the NCP (Liu and Zheng, 2002).
Construction on the central route began in 2003, and 0.3 and 0.26 billion m3 of water had been
transferred from reservoirs in the Hebei Province to Beijing in 2008 and 2009, respectively. The
first phase of the SNWD was scheduled to be completed in 2010, but environmental concerns
and resettlement issues have pushed the completion date to 2014.
2.7. Conclusions
A multilayer, heterogeneous and anisotropic groundwater flow model was built for the
pre-development and post development conditions of the NCP. In the absence of flow rate data
of the interception between the steams and the groundwater in the study area, recharge rates were
calibrated by water levels. The values of hydraulic conductivity, specific yield and specific
storage parameters used in the model were obtained from a reasonable number of pumping tests
and had been verified by previous model studies. Therefore, in spite of the fact that no accurate
long-term data are available for the recharge from the mountain area and from the leakage of the
Yellow River, the calibration was considered acceptable and within practice standard. Mean
annual spatially averaged total recharge from precipitation and irrigation calibrated through the
model was 130 mm which was ~21% of precipitation and applied irrigation.
42
The flow model produced the development history of the groundwater system, and the
output of the model provided the annual groundwater depletion rates. A monthly series of
groundwater storage change was also obtained independently from water level change data and
specific yield across the NCP. Given the fact that the distributions monitoring wells available in
this study are sparse and uneven, the agreement between the storage change from the model and
that estimated by the water level change data are acceptable. The calibrated flow model revealed
an average of ~30 mm/yr of groundwater depletion rate. The regional transient groundwater flow
model provides a useful tool for reproducing groundwater dynamic field and monitoring
groundwater depletion in those areas such as the NCP especially when available water level
monitoring data is sparse. Moreover, since no strategy alone can solve the groundwater depletion
in the NCP, the groundwater model then can be integrated with climate change model,
agricultural model and economic dynamic model to analyze various groundwater development
and management scenarios and develop effective management strategies that ensure long-term
and stable groundwater supplies while mitigating negative environmental consequences.
Both the temporal and spatial storage change distribution pattern indicated that the main
driving factor of groundwater depletion in the NCP is the groundwater exploitation to maintain
agriculture. The seriousness of groundwater depletion in the NCP is self-explanatory problem
which restrict the development of regional economic. Although evaluating of different
management responses of groundwater depletion in the NCP exceeded this study, those
sustainable management strategies of groundwater resources in the NCP is not only needed for
mitigating the water depletion problem, but is also instructive for many similar places with
facing the same problem and looking for solutions.

43
Acknowledgements
This work was supported by the National Basic Research Program of China (grant
#2006CB403404) and National Natural Science Foundation of China (grant #40911130505). We
appreciate the data support from China Geological Survey and China Institute of Water
Resources and Hydropower Research.
References
Alley, W. M., T. E. Reilly, and O. L. Franke. 1999. Sustainability of ground-water resources,
U.S. Geological Survey Circular 1186, U.S. Geological Survey, Denver, CO.
Alley, W. M., R. W. Healy, J. W. LaBaugh, and T. E. Reilly. 2002. Flow and storage in
groundwater systems. Science 296, no. 5575: 1985-1990.
Alley, W. M., and S. A. Leake. 2004, The journey from safe yield to sustainability. Ground
Water 42, no.1: 12-16.
Banta, E. R. 2000. Modflow-2000, the US Geological survey modular ground-water model-
documentation of packages for simulating evapotranspiration with a segmented function
(ETS1) and drains with return flow (DRT1).
Blanke, A., S. Rozelle, B. Lohmar, J. Wang, and J. Huang. 2007. Water saving technology and
saving water in China. Agricultural Water Management 87, no. 2: 139-150.
Cai, X., and M. W. Rosegrant. 2004. Optional water development strategies for the Yellow River
Basin: Balancing agricultural and ecological water demands. Water Resource Research 40,
no. 8: W4S-W8S. doi:10.1029/2003WR002488.
Chen, J.Y., C.Y. Tang, Y.J. Shen, Y. Sakura, A. Kondoh, and J. Shimada. 2003. Use of water
balance calculation and tritium to examine the dropdown of groundwater table in the
piedmont of the North China Plain (NCP). Environmental Geology 44, no. 5: 564-571.
Chen, J., C. Tang, Y. Sakura, A. Kondoh, J. Yu, J. Shimada, and T. Tanaka. 2004. Spatial
geochemical and isotopic characteristics associated with groundwater flow in the North
China Plain. Hydrological Processes 18, no. 16: 3133-3146.
Chen, W. 1990. Evaluation of water resources and hydraulic parameters for the shallow
groundwater in the Hebei Plain. Hydrogeology and Engineering Geology 6: 19-22. (in
Chinese)

44
Chen, Z.Y., J.X. Qi, J.M. Xu, J.M. Xu, H. Ye, and Y.J. Nan. 2003. Paleoclimatic interpretation
of the past 30 ka from isotopic studies of the deep confined aquifer of the North China
plain. Applied Geochemistry 18, no. 7: 997-1009.
Chen, Z., Z. Nie, Z. Zhang, J. Qi, and Y. Nan. 2005. Isotopes and sustainability of ground water
resources, North China Plain. Ground Water 43, no. 4: 485-493.
Cui, Y., Y. Wang, J. Shao, Y. Chi, and L. Lin. 2009. Research on Groundwater Regulation and
Recoveryin North China Plain after the Implementation of South-to-North Water Transfer.
Resources Science 31, no. 3: 382-387. (in Chinese with English abstract)
Doble, R.C., C.T. Simmons, and G.R. Walker. 2009. Using MODFLOW 2000 to Model ET and
Recharge for Shallow Ground Water Problems. Ground Water 47, no. 1: 129-135.
Doherty, J. 2003. Version 5 of PEST Manual, Watermark Numerical Computing, Brisbane
Australia. Downloadable from: http://www. sspa. com/pest.
Fang, Q.X., L. Ma, T.R. Green, Q. Yu, T.D. Wang, and L.R. Ahuja. 2010. Water resources and
water use efficiency in the North China Plain: Current status and agronomic management
options. Agricultural Water Management 97, no. 8: 1102-1116.
Fei, J. 1988. Groundwater resources in the north china plain. Environmental Geology and Water
Sciences 12, no. 1: 63-67.
Fei, Y., J. Miao, Z. Zhang, Z. Chen, H. Song, and M. Yang. 2009. Analysis on Evolution of
Groundwater Depression Cones and Its Leading Factors in North China Plain. Resources
Science 31, no. 3: 394-399. (in Chinese with English abstract)
Fogg, G.E., and E.M. LaBolle. 2006. Motivation of synthesis, with an example on groundwater
quality sustainability. Water Resources Research 42, no. 3: W3S-W5S.
Foster, S. 2000. Sustainable Groundwater Exploitation for Agriculture. Current Issues and
Recent Initiatives in the Developing World. Papeles del proyecto aguas subterráneas.
Foster, S., H. Garduno, R. Evans, D. Olson, Y. Tian, W. Zhang, and Z. Han. 2004. Quaternary
aquifer of the North China Plain—assessing and achieving groundwater resource
sustainability. Hydrogeology Journal 12, no. 1: 81-93.
Haihe River Water Resources Commission of the Ministry of Water Resources of China. Haihe
River Basin Water Resources Bulletin 1998-2008.
Han, Z. S. 1998. Groundwater for urban water supplies in northern China-An overview.
Hydrogeology Journal 6, no. 3: 416-420.
Harbaugh, A. W. 1990. A computer program for calculating subregional water budgets using
results from the US Geological Survey modular three-dimensional finite-difference
ground-water flow model, Open-File Report 90-392, U.S. Geological Survey, Reston,
Virginia.

45
Harbaugh, A. W., E. R. Banta, M. C. Hill, and M. G. McDonald. 2000. MODFLOW-2000, The
U. S. Geological Survey Modular Ground-Water Model-User Guide to Modularization
Concepts and the Ground-Water Flow Process, Open-File Report 00-92, U.S. Geological
Survey, Reston, Virginia.
He, G., J. L. Shao, Y. L. Cui, and D. Zhang. 2003. Application of FEFLOW to Groundwater
Flow Simulation. Journal of Chengdu University Technology (Sci. Tech. Ed.), 4, 356-361.
(in Chinese)
Hebei Bureau of Geology and Mineral. 1977. Evaluation and Rational Development and
Utilization of Groundwater Resources in the Hebei Plain (Heilonggang Plain) (in Chinese).
Hebei Provincial Bureau of Statistics. 2009. Hebei Agricultural Statistical Yearbook 2008.
Beijing: China Statistics Press.
Hebei Department of Water Resources. 1995. Hebei Water Conservancy (in Chinese).
Shijiazhuang: Hebei People’s Publishing House.
Hu, Y.K., J.P. Moiwo, Y.H. Yang, S.M. Han, and Y.M. Yang. 2010. Agricultural water-saving
and sustainable groundwater management in Shijiazhuang Irrigation District, North China
Plain. Journal of Hydrology 393, no. 3-4: 219-232.
Hurd, B., N. Leary, R. Jones, and J. Smith. 1999. Relative regional vulnerability of water
resources to climate change. Journal of the American Water Resources Association 35, no.
6: 1399-1409.
Jia, J., and C. Liu. 2002. Groundwater Dynamic Drift and Response to Different Exploitation in
the North China Plain: A Case Study of Luancheng County, Hebei Province. Acta
Geographica Sinica 57, no. 2: 201-209. (in Chinese with English abstract)
Jiang, X., H. Li, S. Cai, L. Ji, T. Cheng, and N. Xu. 2009. Investigation and analysis of
farmers’irrigation actions in the North China Plain well irrigation district. Anhui
Agricultural Science Bulletin 15, no. 11: 152-154. (in Chinese with English abstract)
Jiao, H., Y. Duan. 2005. Sustainable utilization of groundwater resource in the Yubei Plain.
Hydrogeology and Engineering Geology 1: 61-66. (in Chinese)
Kendy, E., Y. Zhang, C. Liu, J. Wang, and T. Steenhuis. 2004. Groundwater recharge from
irrigated cropland in the North China Plain: case study of Luancheng County, Hebei
Province, 1949-2000. Hydrological Processes 18, no. 12: 2289-2302.
Kinzelbach, W., P. Bauer, T. Siegfried, and P. Brunner. 2003. Sustainable groundwater
management--Problems and scientific tool. Episodes 26, no. 4: 279-284.
Konikow, L.F., and E. Kendy. 2005. Groundwater depletion: A global problem. Hydrogeology
Journal 13, no. 1: 317-320.
46
Li, F.D., X.F. Song, C.Y. Tang, C.M. Liu, J.J. Yu, and W.J. Zhang. 2007. Tracing infiltration
and recharge using stable isotope in taihang Mt., north China. Environmental Geology 53,
no. 3: 687-696.
LI, J. 2008. The synthesize analysis of the diving evaporation coefficient. Ground Water 06: 27-
30. (in Chinese)
Liu, C., J. Yu, and E. Kendy. 2001. Groundwater exploitation and its impact on the environment
in the North China Plain. Water International 26, no. 2: 265-272.
Liu, C., et al. (2002), Determination of daily evaporation and evapotranspiration of winter wheat
and maize by large-scale weighing lysimeter and micro-lysimeter, Agr. Forest Meteorol.,
111(2), 109-120.
Liu, C., X. Zhang, and Y. Zhang. 2002. Determination of daily evaporation and
evapotranspiration of winter wheat and maize by large-scale weighing lysimeter and
micro-lysimeter. Agricultural and Forest Meteorology 111, no. 2: 109-120.
Liu, C., and J. Xia. 2004. Water problems and hydrological research in the Yellow River and the
Huai and Hai River basins of China. Hydrological Processes 18, no. 12: 2197-2210.
Liu, C., J. Chen, and J. Qiao. 2004. A survey of irrigation status in the well irrigation distict in
the North Chian Plain. Water Resources Development Research 10: 38-41.
Liu, J., C.M. Zheng, L. Zheng, and Y.P. Lei. 2008. Ground Water Sustainability: Methodology
and Application to the North China Plain. Ground Water 46, no. 6: 897-909.
Liu, J., C.M. Zheng, L. Zheng, and Y.P. Lei. 2008. Ground Water Sustainability: Methodology
and Application to the North China Plain. Ground Water 46, no. 6: 897-909.
Loáiciga, H. 2002. Sustainable ground-water exploitation. International Geology Review 44, no.
12: 1115-1121.
Lu, X., M. Jin, M.T. van Genuchten, and B. Wang. 2011. Groundwater Recharge at Five
Representative Sites in the Hebei Plain, China. Ground Water 49, no. 2: 286-294.
Luckey, R. L., and M. F. Becker. 1999. Hydrogeology, water use, and simulation of flow in the
High Plains aquifer in northwestern Oklahoma, southeastern Colorado, southwestern
Kansas, northeastern New Mexico, and northwestern Texas, Water-Resources Inv. Rep.
99-4104, U.S. Geological Survey.
Ma, Z., et al. 2005. Sustainable utilization of groundwater resource in the Lubei plain of
Shandong Province. Hydrogeology and Engineering Geology 2: 1-10. (in Chinese)
Ministry of Housing and Urban-Rural Development of China. 2007. China Urban Construction
Statistical Yearbook 2007, China Construction Press, Beijing.
47
National Bureau of Statistics of China. 2010. China Statistical Yearbook 2010, China Statistics
Press, Beijing.
National Bureau of Statistics of China. 2003. China Population County Census Data 2000, China
Statistics Press, Beijing.
Oki, T., and S. Kanae. 2006. Global hydrological cycles and world water resources. Science 313,
no. 5790: 1068-1072.
Rabus, B., M. Eineder, A. Roth, and R. Bamler. 2003. The shuttle radar topography mission--a
new class of digital elevation models acquired by spaceborne radar. Isprs Journal of
Photogrammetry and Remote Sensing 57, no. 4: 241-262.
Shah, T., D. Molden, R. Sakthivadivel, and D. Seckler. 2000. The global groundwater situation:
overview of opportunities and challenges. International Water Management Institute. Sri
Lanka
Shah, T., A.D. Roy, A.S. Qureshi, and J. Wang. 2003. Sustaining Asia's groundwater boom: An
overview of issues and evidence. Natural Resources Forum 27, no. 130-141.
Shao, J., Y. Cui, Y. Zhao, and G. He. 2003. Groundwater Numerical Modeling And Its
Application in Affected Zone of The Down-yellow River (Henan Section). Journal of
Changchun University of Science and Technology 33, no. 1: 51-55. (in Chinese)
Shao, J., Z. Zhao, Y. Cui, R. Wang, C. Li, and Q. Yang. 2009. Application of Groundwater
Modeling Systemto the Evaluation of Groundwater Resources in North China Plain.
Resources Science 31, no. 3: 361-367. (in Chinese with English abstract)
Song, X., F. Li, C. Liu, C. Tang, Q. Zhang, and W. Zhang. 2007. Water Cycle in Taihang
Mountain and Its Recharge to Groundwater in the North China Plain. Journal of Natural
Resources 22, no. 3: 398-408. (in Chinese with English abstract)
Song, Z.W., H.L. Zhang, R.L. Snyder, F.E. Anderson, and F. Chen. 2010. Distribution and
Trends in Reference Evapotranspiration in the North China Plain. Journal of Irrigation and
Drainage Engineering-Asce 136, no. 4: 240-247.
Wang, B.G., M.G. Jin, J.R. Nimmo, L. Yang, and W.F. Wang. 2008. Estimating groundwater
recharge in Hebei Plain, China under varying land use practices using tritium and bromide
tracers. Journal of Hydrology 356, no. 1-2: 209-222.
Wang, S., J. Shao, X. Song, X. Zhou, and Z. Huo. 2007. The application of groundwater
model,MODFLOW,and GIS technology in the dynamic evaluation of groundwater
resource in North China Plain. Geographical Research 26, no. 5: 975-983.
Wang, S.Q., J.L. Shao, X.F. Song, Y.B. Zhang, Z.B. Huo, and X.Y. Zhou. 2008. Application of
MODFLOW and geographic information system to groundwater flow simulation in North
China Plain, China. Environmental Geology 55, no. 7: 1449-1462.

48
Wang, X.C., P.K. Jin, and X.C. Wang. 2006. Water shortage and needs for wastewater re-use in
the north China. Water Science & Technology 53, no. 9: 35-44.
Welsh, W. D. 2006. Great Artesian Basin transient groundwater model, Bureau of Rural
Sciences, Department of Agriculture, Fisheries and Forestry, Australia.
Wu, C., Q.H. Xu, X.Q. Zhang, and Y.H. Ma. 1996. Palaeochannels on the North China Plain:
Types and distributions. Geomorphology 18, no. 1: 5-14.
Xia, J. 2006. Water Security and Ground Water Problem to Changing Environment in North
China, paper presented at International Symposium on Groundwater Sustainability,
Alicante, Spain.
Xie, X., H. Guo, K. Tang, and M. Yin. 2002. Dual coupled model for integrated assessment of
surface water and groundwater in North China Plain. Journal of Hydraulic Engineering 12:
95-100.
Xu, Q.H., C. Wu, X.Q. Zhu, and X.L. Yang. 1996. Palaeochannels on the North China Plain:
Stage division and palaeoenvironments. Geomorphology 18, no. 1: 15-25.
Xu, Y., X. Mo, Y. Cai, and X. Li. 2005. Analysis on groundwater table drawdown by land use
and the quest for sustainable water use in the Hebei Plain in China. Agricultural Water
Management 75, no. 1: 38-53.
Yang, Y.H., M. Watanabe, Y. Sakura, C.Y. Tang, and S. Hayashi. 2002. Groundwater-table and
recharge changes in the Piedmont region of Taihang Mountain in Gaocheng City and its
relation to agricultural water use. Water Sa 28, no. 2: 171-178.
Yang, G., Z. Wang, H. Wang, and Y. Jia. 2009. Potential evapotranspiration evolution rule and
its sensitivity analysis in Haihe River basin. Advances in Water Science 20, no. 3: 409-415.
(in Chinese)
Zhang, G., Y. Fei, M. Yang, Z. Liu, and J. Wang. 2009. Impact of irrigating farmland increase
production with water save on groundwater exploitation in the plain of Hutuo River basin.
Advances in Water Science 20, no. 3: 350-355. (in Chinese with English abstract)
Zhang, G., Z. Liu, Y. Fei, Y. Lian, and M. Yan. 2010. The relationship between the distribution
of irrigated crops and the supply capability of regional water. Acta Geoscientica Sinica 31,
no. 1: 17-22. (in Chinese with English abstract)
Zhang, X., L. Xue, Q. Zhang, and J. Li. 2008. Simulation of Groundwater Exploitation at Early
Stage and Analysis on Water Budget in Haihe River Basin. Journal of Arid Land
Resources and Environment 09: 102-107. (in Chinese)
Zhang, X. 2007. Numerical simulation of the shallow groundwater in the Haihe Basin. Haihe
Water Resources 03: 52-54. (in Chinese)
Zhang, S., and L. Li. 2005. Water Resouces in China. Sino Maps Press, Beijing. (in Chinese)
49
Zhang, X.Y., D. Pei, and C.S. Hu. 2003. Conserving groundwater for irrigation in the North
China Plain. Irrigation Science 21, no. 4: 159-166.
Zhang, X., L. Xue, Q. Zhang, and J. Li. 2008. Simulation of Groundwater Exploitation at Early
Stage and Analysis on Water Budget in Haihe River Basin. Journal of Arid Land
Resources and Environment 09: 102-107. (in Chinese)
Zhang, Z., Z. Shen, Y. Xue, and F. Ren. 2000. Groundwater environment evolution in the North
China Plain. Beijing: Geological Publishing House. (in Chinese)
Zhang, Z., Y. Fei, Z. Chen, et al. 2009. Investigation and Assessment of Sustainable Utilization
of Groundwater Resources in the North China Plain. Geological Publishing House, Beijing.
(in Chinese)
Zhang, Z. and Y. Fei. 2009. Atlas of Groundwater Sustainable Utilization in the North China
Plain. SinoMaps Press, Beijing. (in Chinese with English Preface)
Zheng, C., J. Liu, G. Cao, E. Kendy, H. Wang, and Y. Jia. 2010. Can China Cope with Its Water
Crisis?-Perspectives from the North China Plain. Ground Water 48, no. 3: 350-354.

50
CHAPTER 3
CHAPTER 3
INTEGRATION OF SOIL WATER BALANCE AND
UNSATURATED FLOW MODEL FOR ESTIMATING REGIONAL GROUNDWATER
RECHARGE IN THE NORTH CHINA PLAIN
Abstract
Accurate estimation of groundwater recharge is important for sustainable groundwater
exploitation, and proper management and protection of groundwater resources. Groundwater
recharge remains one of the principal uncertainties in the water balance of the North China Plain
(NCP). Understanding impacts of climate, surface conditions such as soil properties and land use,
and groundwater withdrawal on groundwater recharge is essential for estimating groundwater
recharge. In this study, spatial and temporal variability in recharge were evaluated by integrating
a soil water balance and one-dimensional unsaturated flow models. Estimated recharge was
verified using a saturated zone flow model. Soil hydraulic parameters were estimated using
pedotransfer functions. Simulation of 12 years (1993–2008) was performed across the NCP.
Simulated mean annual recharge is ~150 mm across the NCP, representing 18% of mean annual
precipitation + irrigation, and ranging from ≤ 360 mm in the piedmont area to ≤ 260 mm in the
middle and coastal plain. Variability of soil texture from clay to loamy sand resulted in a large
range in recharge rates. Increasing thickness of the unsaturated zone has little effect on the long
term mean annual recharge. This work provides useful information toward a comprehensive
assessment of groundwater recharge in the NCP and identifies important parameters controlling
recharge.
51
3.1. Introduction
In arid and semiarid regions where agriculture relies on irrigation, accurate estimation of
groundwater recharge and evapotranspiration (ET) is extremely important for sustainable
exploitation of groundwater. However, recharge is difficult to estimate because of spatial
variability in soil texture, vegetation, and temporal and spatial variations in climatic factors such
as precipitation and ET (Wang et al., 2009). It may be complicated further by irrigation (Gee and
Hillel, 1988). Traditional physical methods to estimate recharge and measure ET directly and
empirical models require large field measurements, and yet are still limited to local scales.
Different approaches can be used to estimate groundwater recharge, including water-balance,
water table fluctuation, chemical and isotopic tracers, and numerical simulations (Simmers, 1987;
Scanlon et al., 2002; Xu and Beekman, 2003). It is difficult to assess the accuracy of any method,
and thus it is highly beneficial to apply multiple methods of estimation to constrain uncertainties
(Healy and Cook, 2002; Scanlon et al., 2002). Furthermore, extrapolating local measurements to
regional scales can be problematic due to variations in climatic, physical and biological
characteristics of the land and subsurface (Scanlon et al., 2002). The optimal choice of methods
depends on the spatial and temporal scales required for the study and data availability at the
study site (Scanlon et al., 2002; Delin et al., 2007).
A primary category of approach for regional groundwater recharge estimation is soil
water balance, which estimates groundwater recharge as the amount of water percolating beneath
the root zone (net infiltration or potential recharge). There are numerous examples of
groundwater recharge estimation using this method such as the U.S. Geological Survey (USGS)
INFIL model (USGS, 2008), BALAN (Samper and García-Vera, 1992) and the U.S.
Environmental Protection Agency (U.S. EPA) HELP model (Schroeder et al., 1994). Although

52
these models can easily and quickly produce reasonable regional groundwater recharge
distributions where the water table is below the base of the root zone, the water flow process in
the unsaturated zone from the base of the root zone to the water table is ignored. Neglecting
unsaturated zone process is inappropriate where the thickness of the unsaturated zone is
significant for storing and transferring water (Harter and Hopmans, 2004; Hunt et al., 2008).
Unsaturated flow modeling is becoming a common tool for evaluating groundwater
recharge ant its spatial and temporal distribution (e.g., Keese et al., 2005; Small, 2005; Liggett et
al., 2009). Although these models, such as DAISY(Hansen et al., 1990), UNSAT-H (Fayer,
2000), SWAP (Kroes and van Dam, 2003) and HYDRUS -1D (Šimůnek et al., 2005) can
simulate unsaturated flow and estimate recharge and ET, the impact of climate, vegetation, and
soil properties on groundwater dynamics cannot be evaluated directly without simulation of the
saturated zone process. Models recently developed integrating groundwater flow in the saturated
zone with variably saturated flow such as HYDRUS-3D (Šimůnek, 2006), MODFLOW-VSF
(Thom et al., 2006), MODFLOW-SURFACT (Panday and Huyakorn, 2008) and
HydroGeoSphere (Therrien et al., 2005) are better at simulating both unsaturated and saturated
flow to estimate the recharge and discharge. However, they are all based on the use of the three-
dimensional Richards’ equation, and their application is heavily constrained by computational
resources (van Walsum and Groenendijk, 2008). For basin-scale simulation, the assumption of
one-dimensional flow is thought to be reasonable (Harter and Hopmans, 2004). Consequently,
models such as MIKE-SHE (Refsgaard et al., 1995) and MODFLOW-UZF (Niswonger et al.,
2005) coupled one-dimensional vertical flow in the unsaturated zone with three-dimensional
flow in saturated zone for simplicity and greater computational efficiency. In MIKE SHE and
MODFLOW-UZF, the one-dimensional form of Richards’ equation is approximated by a

53
kinematic-wave equation solved by the method of characteristics, which precludes the need to
develop a structured grid for the unsaturated zone (Niswonger et al., 2005).
Primary difficulties in application of process-based vadose zone modeling for recharge
estimation are data requirements and model input parameters such as soil hydraulic
characteristics. Harter and Hopmans (2004) provided an excellent review of various methods
based on geostatistical techniques used in upscaling soil hydraulic parameters. Instead of
measuring in situ soil hydraulic characteristics, a simpler alternative is developing a set of so-
called pedotransfer functions (PTFs) (Wösten, 2001 ) to estimate those unsaturated zone
hydraulic characteristics from more readily measured or basic soil properties in the attribute
database of a digital soil survey map (Li et al., 2007). Many of the available and well-established
PTFs for the prediction of soil hydraulic properties from continuous soil properties are based on
statistical regressions (Pachepsky and Rawls, 2004). Most of PTFs were developed to estimate
the soil water retention and saturated hydraulic conductivity (Nemes et al., 2003), and soil
texture, bulk density and organic matter content are most commonly used in developing PTFs.
Most of the models simulating variably saturated flow were developed primarily for application
in agricultural research, and require considerable information on vegetation parameters.
Information on vegetation distribution and land use is often readily available, and remote sensing
data can also aid in determination of vegetation parameters. However, for study areas where
vegetation types are relatively homogeneous and the land use remains largely unchanged during
the simulation period, it is preferable to limit the number of model input parameters to reduce
estimation uncertainty and minimize calibration non-uniqueness.
ET, as a primary discharge term in the soil water budget, strongly affects the accuracy of
recharge estimation. The methods for calculating ET in different codes also vary. The most

54
commonly used method is to calculate the potential or reference ET (ETp) first using
meteorological data (Lu et al., 2005), and then calculate the potential bare soil evaporation and
plant transpiration separately using empirical equations. The actual evaporation and transpiration
are determined based on vegetation and soil moisture conditions and are summed to the actual
ET (ETa). This approach often requires small time scales, i.e., generally daily meteorological
data. Therefore, time steps in the saturated zone flow model should be small, which is usually
unnecessary and infeasible for regional simulation. As a remedy, time sub-steps might be used as
in the HYDRUS package for MODFLOW (Seo et al., 2007).
Methods employing the complementary relationship of ET (Bouchet, 1963) are popular
for estimating regional ET because they permit regional ETa to be estimated solely from routine
meteorological data, and do not need extremely detailed data describing the near-surface
boundary. The models avoid the complexity of the soil-plant system and thus do not require data
on soil moisture or vegetation parameters (Hobbins et al., 2001). Good agreement has been
shown between the ET estimates from this type of models and those from the regional water
balance calculation (e.g., Hobbins et al., 2001; Xu and Singh, 2005).
Coupling a root zone soil water balance and a simplified unsaturated zone flow model
can combine the benefit of different methods for ET estimation and are feasible for regional
scale application and model calibration. The purpose of this study was to determine the effects of
soil type and variation in unsaturated zone thickness on regional groundwater recharge
estimation from precipitation and irrigation based on data from the North China Plain (NCP). A
soil water balance model coupled with the MODFLOW code and the UZF package was used in
this study to construct a regional flow model considering unsaturated flow process explicitly.
Those characteristics of the PTFs and the available data make this method the most reasonable
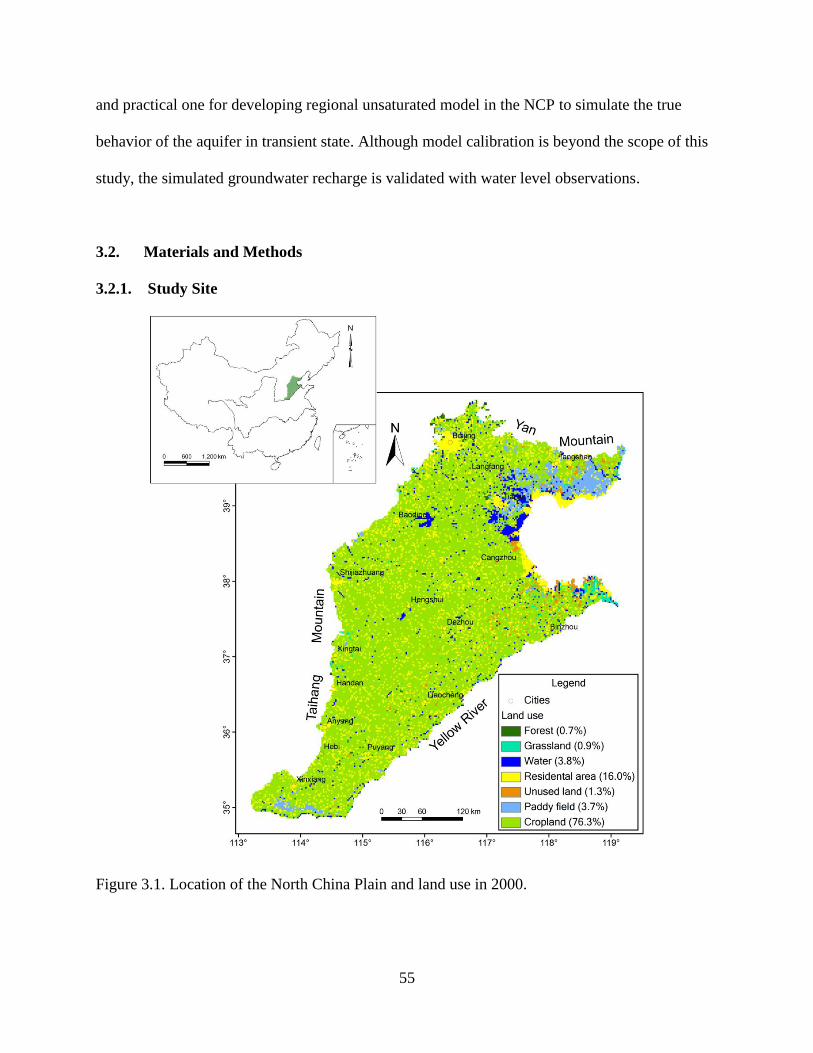
55
and practical one for developing regional unsaturated model in the NCP to simulate the true
behavior of the aquifer in transient state. Although model calibration is beyond the scope of this
study, the simulated groundwater recharge is validated with water level observations.
3.2. Materials and Methods
3.2.1. Study Site
Figure 3.1. Location of the North China Plain and land use in 2000.
56
The North China Plain (NCP) (~140,000 km2) refers to the plain with altitude of <100 m
above mean sea level bordered on the north by the Yanshan Mountains, on the east by the Bohai
Sea, on the south by the Yellow River and on the west by the Taihang Mountains in northeast
China (Figure 3.1). The NCP covers the entire plains of Hebei Province, Beijing Municipality,
Tianjin Municipality and the northern parts of plains of the Shandong and Henan Provinces. The
population of the NCP, based on 2000 county census data, is ~105 million (National Bureau of
Statistics of China, 2003) with a population density of ~800 persons per km2. The NCP is the
dominant national center of wheat and maize production and an extremely important economic,
political and cultural region of China, producing ~15% of China’s total gross domestic product
(GDP) and ~ 10% of total grain production based on the 2009 statistical data (China Statistical
Yearbook, 2010).
Recharge from infiltration of precipitation accounts for approximately 70–80 % of total
natural groundwater recharge in the NCP (Chen, 1999; Chen and Ma, 2002). Most previous
recharge estimates were used in groundwater resources evaluation as a water balance term. A
common approach used in these estimates was to assume that a certain fraction of precipitation
and irrigation percolates to groundwater, regardless of the quantity of water applied (Kendy et al.,
2003). This fraction is represented by the infiltration recharge coefficient (usually expressed as
α), and is multiplied by mean annual precipitation and/or irrigation to calculate mean annual
groundwater recharge. Areal groundwater annual recharge estimation based on this method
ranges from 70 to 180 mm/yr (Zhu and Zheng, 1983; Liu and Wei, 1989; Chen, 1999; Water
Resources Department of the Hebei Province, 2003; Ren, 2007). Because the value of recharge
coefficients depends on soil properties, unsaturated zone thickness, and precipitation amount, it
varies spatially and temporally (Li, 2009). These recharge estimates represent long-term average

57
values for different periods and did not provide information on temporal variability in recharge
rates. Some researchers have estimated local groundwater recharge in the NCP. Although there
are numerous previous studies of local recharge using environmental tracer methods (Wang et al.,
2008; Liu et al., 2009; Song et al., 2009; von Rohden et al., 2010) and unsaturated zone flow
models (Kendy et al., 2004; Lu et al., 2011), a critical challenge is up scaling those typically
local-scale estimates or model parameters to regional scales. Generally, a large amount of data,
including thickness and hydraulic properties of the unsaturated zone, rainfall patterns, irrigation
types and regime, land use and ET is required to regionalize point measurements of groundwater
recharge to obtain regional recharge estimates. Considering the available data in the NCP,
regionalizing point recharge estimates to regional rates seems unpractical.
A key factor affecting recharge estimation in the NCP is the increase in unsaturated zone
thickness. Because of the long period of overexploitation of groundwater in the NCP, the
thickness of the unsaturated zone has increased from 2–15 m in the 1970s to 8–30 m, even up to
30–56 m in some local areas (Zhang et al., 2004). Ignoring unsaturated zone processes could be
problematic for analysis of groundwater recharge changes, especially for assessment of further
groundwater quality evolution and development of groundwater protection strategies. Although
the impact of the unsaturated zone thickness on infiltration has been evaluated by field soil
moisture and potential monitoring and analysis (Zhang, 1992; Zhang et al., 2007), the impact of
the unsaturated zone on groundwater recharge at regional scale has generally not been addressed.
3.2.2. Root Zone Soil Water Balance
The water balance for the soil root zone, in the absence of significant runoff, is
represented by:
p r aR P I ET (3.1)
58
where Rp is potential recharge, P is precipitation, Ir is irrigation, ETa is actual ET, and is
change of soil water storage.
The complementary relationship between actual (ETa) and potential ET (ETp) (Bouchet,
1963) is
2a p wET ET ET (3.2)
where ETa, ETp, and ETw are actual, potential and wet environment ET, respectively.
The complementary relation areal ET (CRAE) method (Morton, 1983; Morton et al.,
1985) calculates ETp and ETw as follows:
3
pET 4n T p pQ f T T T (3.3)
3
w 1 2 1 2ET 4p p
TP n p p a
p p
b b Q b b Q T T T
(3.4)
where, λ is latent heat flux, γ is psychrometirc constant, and Qn is net available energy at the
surface, usually approximated by net absorbed radiation at the surface minus diffusive ground
heat flux, Rn - G. Tp and T are equilibrium and air temperature, respectively; ε is surface
emissivity; σ is Stefan-Boltzman constant, and fT is vapor transfer coefficient. where Δp and QTP
are slope of the saturated vapor pressure curve and net available energy adjusted to equilibrium
temperature.
Actual ET is calculated as a residual in (3.2). The model requires data on average
temperature, wind speed, elevation, and dew point.
3.2.3. Regional Flow Model Description
Vertical flow through a homogeneous unsaturated zone can be described by the one-
dimensional Richards’ equation as:

59
h
K K St z z
(3.5)
where θ is volumetric water content; S is ET rate per unit length; ( )K is unsaturated hydraulic
conductivity as a function of water content; z is elevation in the vertical direction; and t is time.
The UZF package developed for coupling to the MODFLOW code (Niswonger et al.,
2006) simplifies equation (3.5) by removing the diffusive term, assuming that the vertical flux is
only driven by gravitational forces. The equation solved by UZF using the method of
characteristic is:
0
KS
t z
(3.6)
In general, unsaturated flow modeling using Richards’ equation directly requires fine
grids and is notable for the large computational efforts required and associated long runtimes
(Hunt et al., 2008). Moreover, the required data for the soil-water constitutive relationships are
often not readily available for basin scale models. For realistic basin scale simulations, closed-
form solutions for simulating unsaturated flow are highly advantageous because there are no
restrictions for numerical stability. The kinematic wave approximation of the one-dimensional
Richards’ equation through a homogeneous unsaturated zone as used in the UZF package
provides an alternative that is well suited to large-scale models (Niswonger et al., 2006).
The Brooks and Corey (1964) formula is used to relate unsaturated hydraulic
conductivity to water content in the UZF code:
( ) rs
s r
K K
(3.7)
where Ks is saturated hydraulic conductivity; θr is residual water content; θs is saturated water
content; and ε is Brooks-Corey exponent used in the UZF code.

60
Due to the general absence of data that characterize sediment heterogeneity within the
unsaturated zone, the assumption of homogeneous unsaturated zone is reasonable in basin scale
models (Niswonger and Prudic, 2009). The main model parameters needed by the UZF package
include infiltration rate (FINF), vertical saturated hydraulic conductivity (VKS), saturated water
content (THTS) and a Brooks-Corey coefficient, epsilon (EPS), which relates conductivity and
water content (Table 3.1). Infiltration rate is input as positive values of the Rp obtained from the
water balance model for the root zone. The negative flux rate of Rp is simulated as evaporation in
the UZF package.
Table 3.1. MODFLOW Input Parameters Used in Text.
Name Package Used Description
VKS UZF Saturated hydraulic conductivity of soil
EPS UZF Brooks-Corey epsilon
FINF UZF Infiltration rate
THTS UZF Saturated water content
THTI UZF Initial water content
Sy LPF Specific yield
3.3. Data Sets on Climate, Soils, and Irrigation
Precipitation, temperature, wind speed, solar radiation, and relative humidity data were
obtained from China's Monthly Surface Climate Data Set (http://cdc.cma.gov.cn/), which is
maintained by China Meteorological Administration (CMA). The data record for most stations
started in 1957 and is updated continuously. The meteorological data set is in discrete format, i.e.,
point values with 23 station locations available in the NCP. To generate estimates of areal ET,
point values of these variables were interpolated to a grid with the same cell size as the regional
flow model, and ETa was calculated at each resulting grid cell. Because the station networks in
61
this study cannot support the semivariogram estimation required by kriging, an inverse distance
weighted (IDW) scheme was used in the interpolation procedure.
Monthly mean data values were estimated as the mean of the average monthly maximum
and minimum values. Dew point temperature (Tdew) was calculated using temperature and
relative humidity (Allen, 1998):
237.7 ( , )
17.27 ( , )dew
T RHT
T RH
(3.8)
17.27( , ) ln( /100)
237.7
TT RH RH
T
(3.9)
where T is air temperature in degrees Celsius; and RH is the relative humidity.
NASA’s Shuttle Radar Topography Mapping (SRTM) mission (Rabus et al., 2003) produced
digital elevation data at 90 m resolution and these data were aggregated to the model grid and
used as the elevation input for the ETa estimation.
Soil texture (including sand, silt and clay contents) and bulk density were obtained from
the 1:1,000,000 scale the Chinese Soil Data Set (Institute of Soil Science, Chinese Academy of
Sciences). The data set, which is in raster format at 1 km resolution, was aggregated to the grid
used in this study. Seven soil hydraulic parameters (θs, θr, α, n, Ks, K0, L) in van Genuchten
(1980) model were calculated using PTFs developed by Schaap (2001). θs and Ks was input in the
UZF as VKS and THTS, respectively. The Brooks-Corey epsilon (EPS) in the UZF was
calculated as the modified expression derived by Morel-Seytoux et al. (1996) as:
1 2 / (1 1/ )n (3.10)
Soil moisture data were obtained from China’s Crop Growth Data Set
(http://cdc.cma.gov.cn/) maintained by CMA. The dataset contains 104 monitoring stations in the
NCP. The data record for most stations starts in 1993 and is updated continuously. The data set
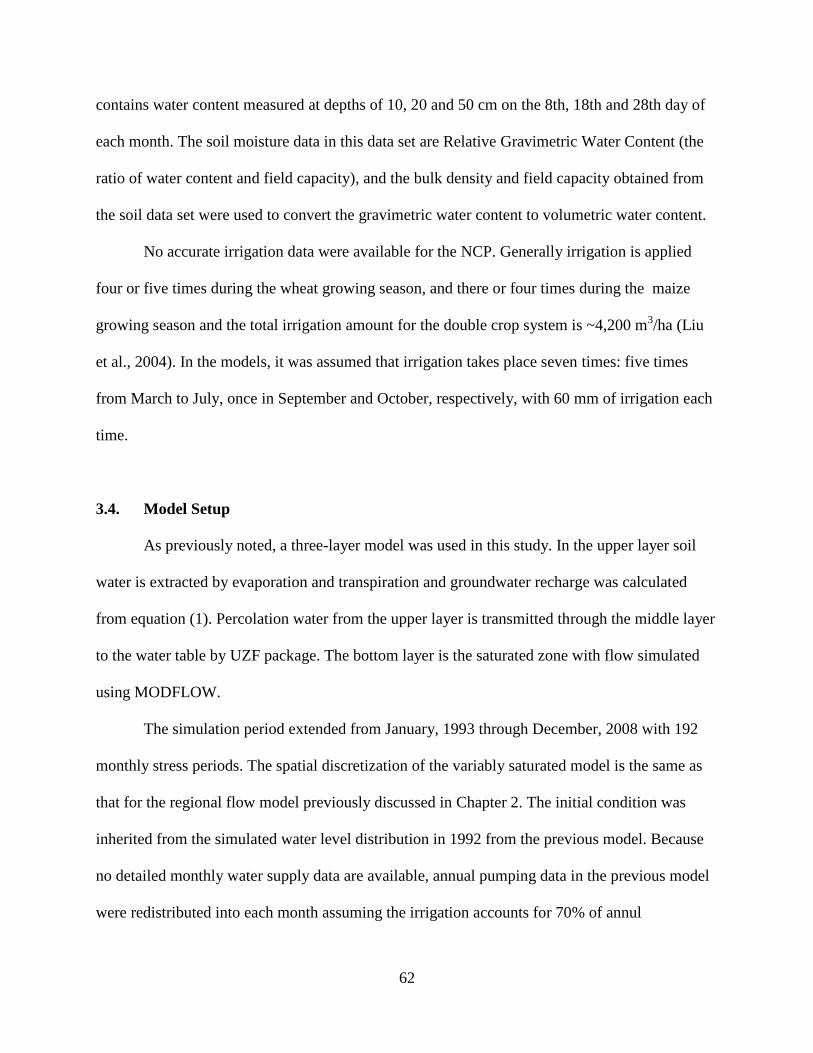
62
contains water content measured at depths of 10, 20 and 50 cm on the 8th, 18th and 28th day of
each month. The soil moisture data in this data set are Relative Gravimetric Water Content (the
ratio of water content and field capacity), and the bulk density and field capacity obtained from
the soil data set were used to convert the gravimetric water content to volumetric water content.
No accurate irrigation data were available for the NCP. Generally irrigation is applied
four or five times during the wheat growing season, and there or four times during the maize
growing season and the total irrigation amount for the double crop system is ~4,200 m3/ha (Liu
et al., 2004). In the models, it was assumed that irrigation takes place seven times: five times
from March to July, once in September and October, respectively, with 60 mm of irrigation each
time.
3.4. Model Setup
As previously noted, a three-layer model was used in this study. In the upper layer soil
water is extracted by evaporation and transpiration and groundwater recharge was calculated
from equation (1). Percolation water from the upper layer is transmitted through the middle layer
to the water table by UZF package. The bottom layer is the saturated zone with flow simulated
using MODFLOW.
The simulation period extended from January, 1993 through December, 2008 with 192
monthly stress periods. The spatial discretization of the variably saturated model is the same as
that for the regional flow model previously discussed in Chapter 2. The initial condition was
inherited from the simulated water level distribution in 1992 from the previous model. Because
no detailed monthly water supply data are available, annual pumping data in the previous model
were redistributed into each month assuming the irrigation accounts for 70% of annul
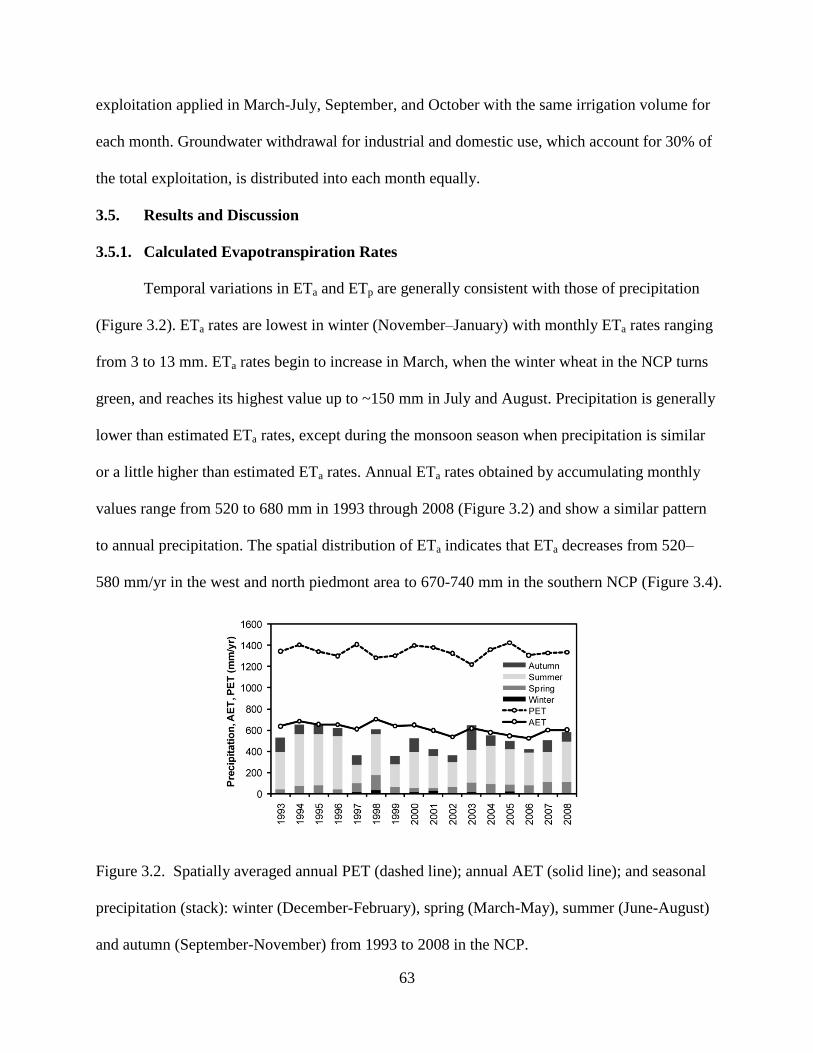
63
exploitation applied in March-July, September, and October with the same irrigation volume for
each month. Groundwater withdrawal for industrial and domestic use, which account for 30% of
the total exploitation, is distributed into each month equally.
3.5. Results and Discussion
3.5.1. Calculated Evapotranspiration Rates
Temporal variations in ETa and ETp are generally consistent with those of precipitation
(Figure 3.2). ETa rates are lowest in winter (November–January) with monthly ETa rates ranging
from 3 to 13 mm. ETa rates begin to increase in March, when the winter wheat in the NCP turns
green, and reaches its highest value up to ~150 mm in July and August. Precipitation is generally
lower than estimated ETa rates, except during the monsoon season when precipitation is similar
or a little higher than estimated ETa rates. Annual ETa rates obtained by accumulating monthly
values range from 520 to 680 mm in 1993 through 2008 (Figure 3.2) and show a similar pattern
to annual precipitation. The spatial distribution of ETa indicates that ETa decreases from 520–
580 mm/yr in the west and north piedmont area to 670-740 mm in the southern NCP (Figure 3.4).
Figure 3.2. Spatially averaged annual PET (dashed line); annual AET (solid line); and seasonal
precipitation (stack): winter (December-February), spring (March-May), summer (June-August)
and autumn (September-November) from 1993 to 2008 in the NCP.

64
Recent ET research in the NCP has focused on the spatial distribution of ETp rates (Mo et
al., 2005; Yang et al., 2009; Song et al., 2010). No spatially distributed measured ETa was
obtained in this study to evaluate the estimation error directly. The ranges of estimated ETp used
other methods (Table 3.2) are first converted to ETa and then are used for comparison. The
estimated ETa in the piedmont area underestimates by ~300 mm/yr compared the measured ETa
by lysimeter. However, measured ETa is under experimental site condition without water supply
restrictions. Due to various irrigation conditions and farmers practice, water demand of the wheat
and corn double cropping system cannot be met, the situation that simulated ETa is less than that
measured by the lysimeter at the experimental station is expected. The spatially averaged mean
annual ETa is estimated as ~620 mm/yr, which is close to those estimated by the remote sensing
methods.
Figure 3.3. Spatially averaged monthly precipitation, AET and PET in the NCP.
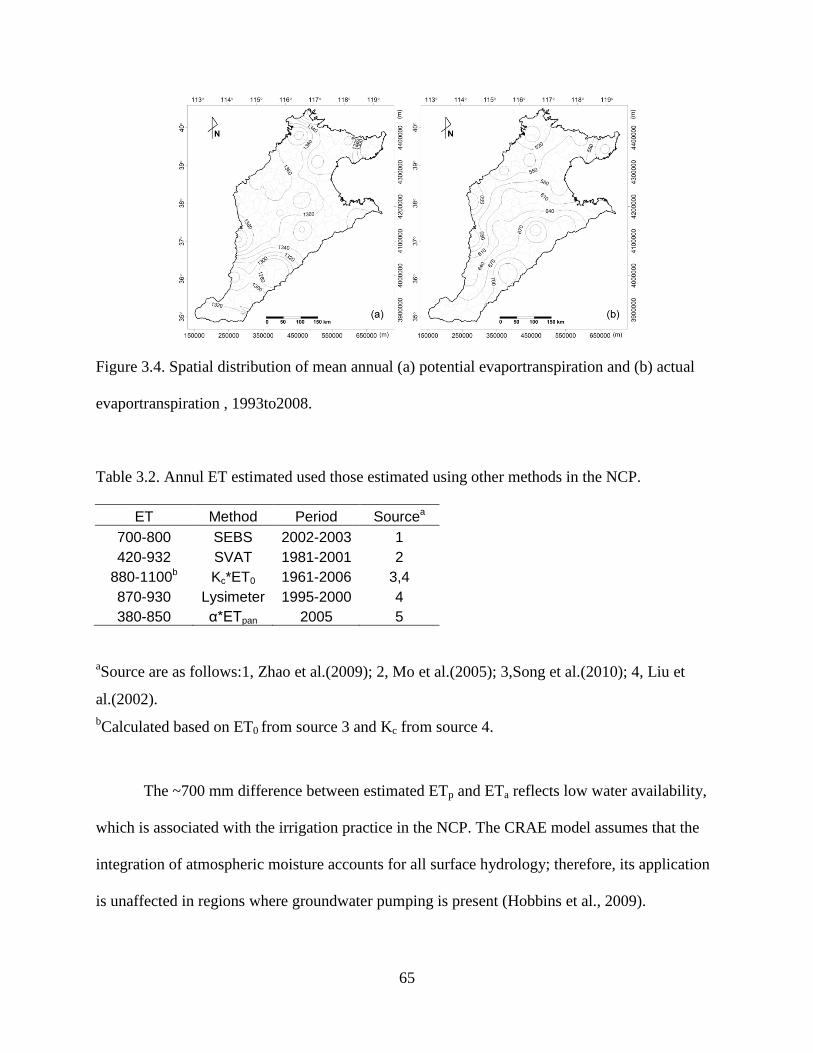
65
Figure 3.4. Spatial distribution of mean annual (a) potential evaportranspiration and (b) actual
evaportranspiration , 1993to2008.
Table 3.2. Annul ET estimated used those estimated using other methods in the NCP.
ET Method Period Sourcea
700-800 SEBS 2002-2003 1
420-932 SVAT 1981-2001 2
880-1100b Kc*ET0 1961-2006 3,4
870-930 Lysimeter 1995-2000 4
380-850 α*ETpan 2005 5
aSource are as follows:1, Zhao et al.(2009); 2, Mo et al.(2005); 3,Song et al.(2010); 4, Liu et
al.(2002).
bCalculated based on ET0 from source 3 and Kc from source 4.
The ~700 mm difference between estimated ETp and ETa reflects low water availability,
which is associated with the irrigation practice in the NCP. The CRAE model assumes that the
integration of atmospheric moisture accounts for all surface hydrology; therefore, its application
is unaffected in regions where groundwater pumping is present (Hobbins et al., 2009).

66
Figure 3.5. USDA (U.S. Department of Agriculture) soil texture types in the NCP, translated
from the GSCC (genetic soil classification of China) soil family definitions.
3.5.2. Calculated Recharge Rates
The timing of groundwater recharge depends on temporal distribution of precipitation
and irrigation. The magnitude of groundwater recharge depends on precipitation and irrigation,
and also ET. Higher groundwater recharge rates occur during the monsoon season from July to
September (Figure 3.7). Figure 3.7 also indicates the importance of antecedent soil moisture and
timing of rainfall, irrigation and ET in generating recharge. More groundwater recharge is
67
generated in cold winter season than in spring with more rainfall, irrigation and corresponding
higher ET.
Figure 3.6. Saturated vertical hydraulic conductivity of the soil in the NCP calculated by PTFs
developed by Schaap (2001) using soil sand, silt and clay contents, and bulk density.
Simulated mean annual recharge ranges from 0 to 360 mm/yr in the piedmont area
(Figure 3.8). This recharge represents up to 44% of the mean annual precipitation plus irrigation.
Simulated recharge is high because the recharge is identical to infiltration over the long term.
The area with recharge ranging from 0 to 260 mm/yr accounts for 90% of the entire NCP. This
recharge represents 30% of mean annual precipitation plus irrigation. Mean annual recharge is
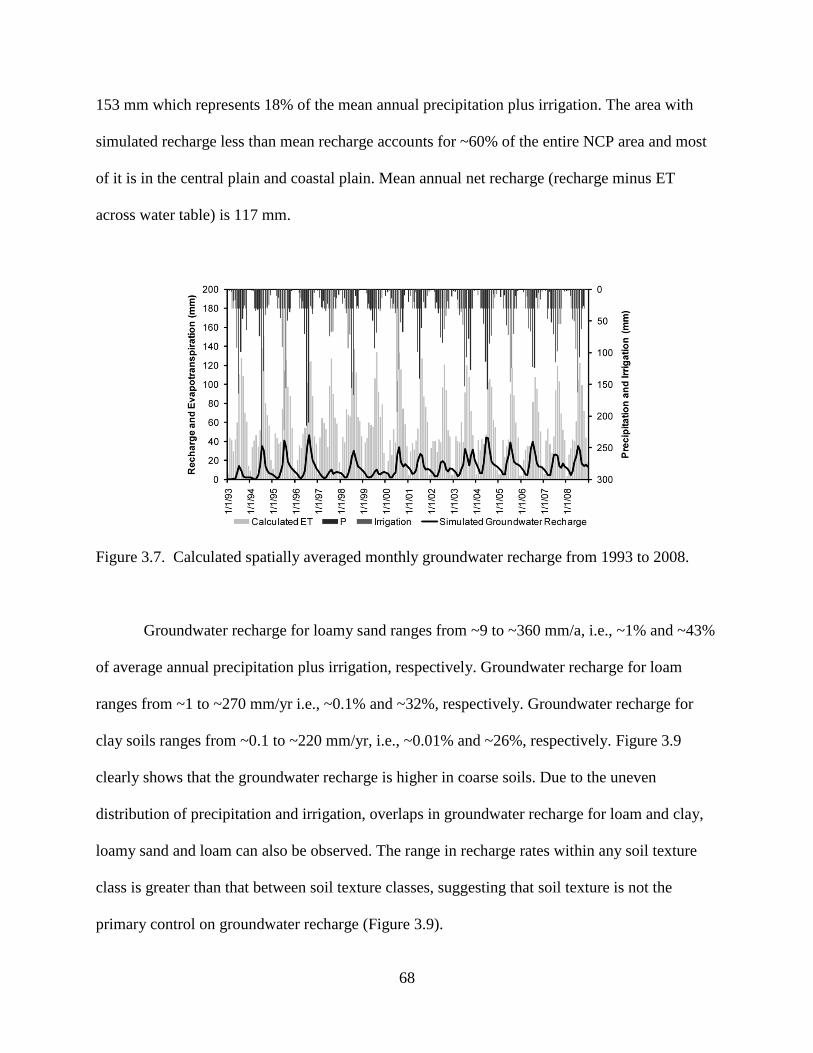
68
153 mm which represents 18% of the mean annual precipitation plus irrigation. The area with
simulated recharge less than mean recharge accounts for ~60% of the entire NCP area and most
of it is in the central plain and coastal plain. Mean annual net recharge (recharge minus ET
across water table) is 117 mm.
Figure 3.7. Calculated spatially averaged monthly groundwater recharge from 1993 to 2008.
Groundwater recharge for loamy sand ranges from ~9 to ~360 mm/a, i.e., ~1% and ~43%
of average annual precipitation plus irrigation, respectively. Groundwater recharge for loam
ranges from ~1 to ~270 mm/yr i.e., ~0.1% and ~32%, respectively. Groundwater recharge for
clay soils ranges from ~0.1 to ~220 mm/yr, i.e., ~0.01% and ~26%, respectively. Figure 3.9
clearly shows that the groundwater recharge is higher in coarse soils. Due to the uneven
distribution of precipitation and irrigation, overlaps in groundwater recharge for loam and clay,
loamy sand and loam can also be observed. The range in recharge rates within any soil texture
class is greater than that between soil texture classes, suggesting that soil texture is not the
primary control on groundwater recharge (Figure 3.9).

69
Figure 3.8. Calculated distribution of mean annual groundwater recharge at the water table.
To assess the relationship of recharge with the unsaturated thickness, the recharge
coefficient, defined as ratio of mean annual recharge to mean annual precipitation plus irrigation,
Rc=R/(P+I), for different unsaturated zone thicknesses is plotted in Figure 3.10. The relation
between the recharge coefficient and unsaturated zone thickness indicates that the thickness of
unsaturated zone does not affect the recharge over a long time period. The Rc value for the
loamy sand is smallest with unsaturated zone thickness less than 2 m, and approaches sable at
~30% with unsaturated zone thickness greater than 2 m. The Rc value for both loam and clay is
highest for unsaturated zone thickness of 2–4 m, and decreases with the increasing unsaturated
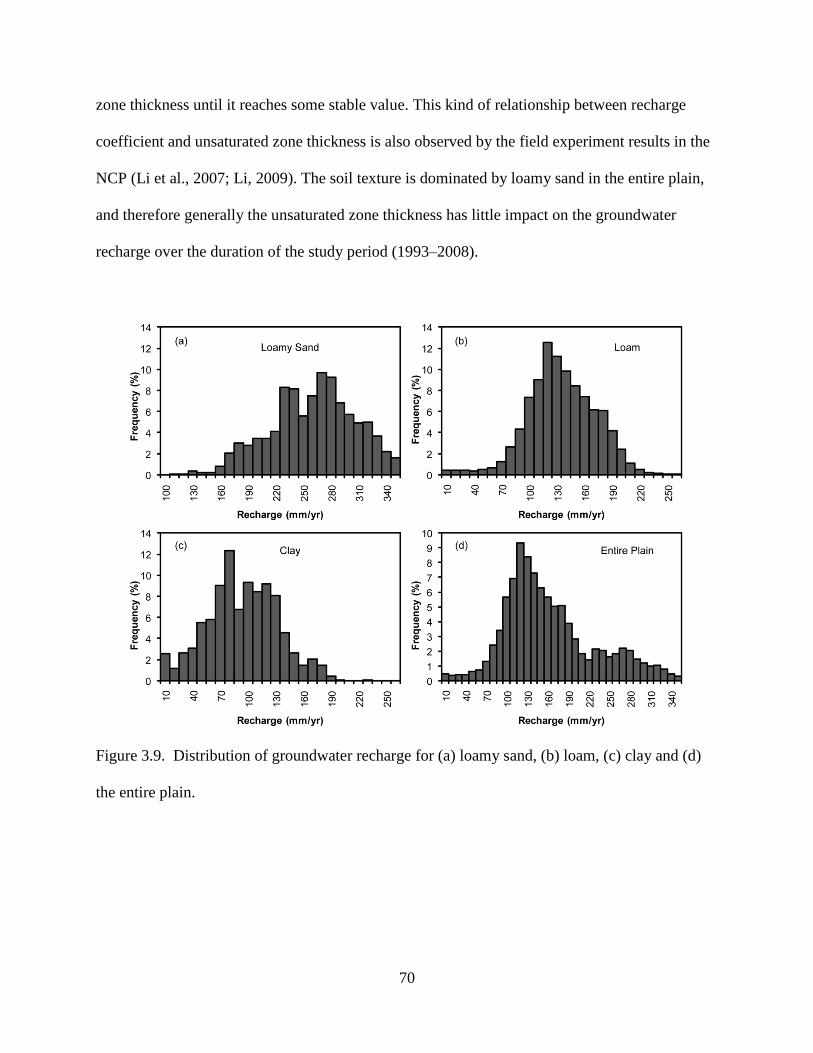
70
zone thickness until it reaches some stable value. This kind of relationship between recharge
coefficient and unsaturated zone thickness is also observed by the field experiment results in the
NCP (Li et al., 2007; Li, 2009). The soil texture is dominated by loamy sand in the entire plain,
and therefore generally the unsaturated zone thickness has little impact on the groundwater
recharge over the duration of the study period (1993–2008).
Figure 3.9. Distribution of groundwater recharge for (a) loamy sand, (b) loam, (c) clay and (d)
the entire plain.
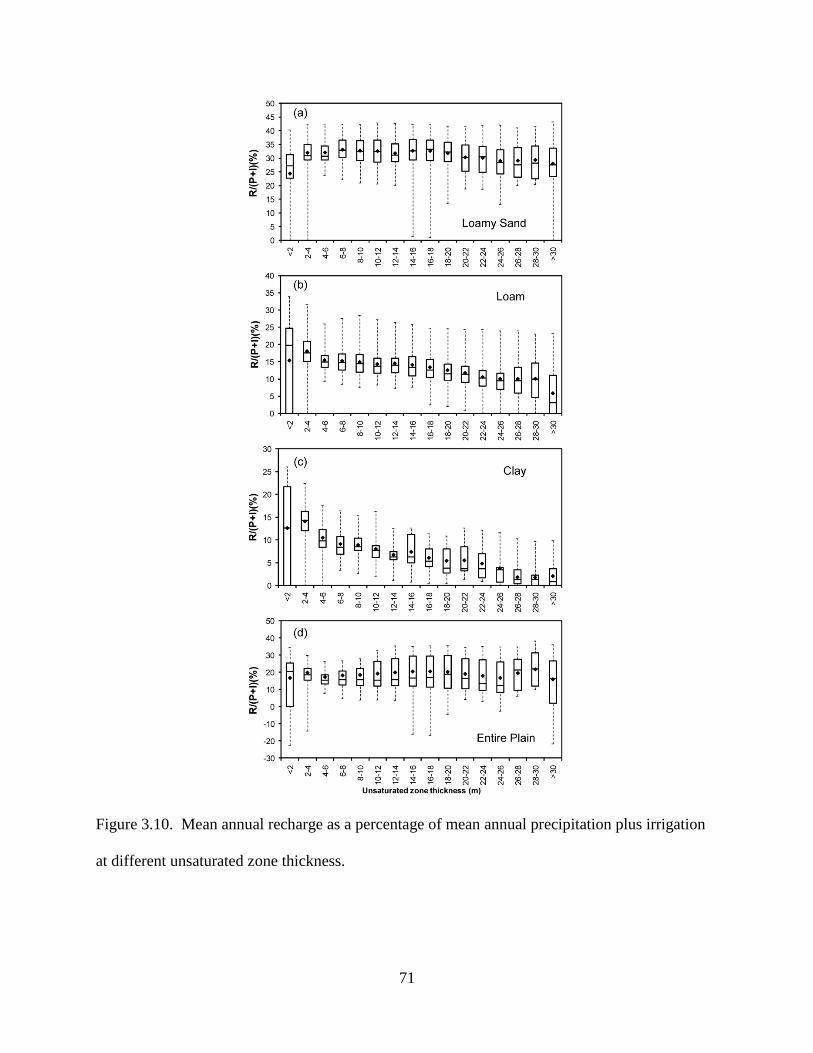
71
Figure 3.10. Mean annual recharge as a percentage of mean annual precipitation plus irrigation
at different unsaturated zone thickness.

72
Figure 3.11. Variation of monthly recharge and infiltration with time at two observation
locations: (a) in the piedmont area with unsaturated thickness of up to 46 m, and (b) in the
central plain with unsaturated zone thickness of up to 3 m.
The simulated monthly recharge variations at two observation model cells located in the
piedmont area and central plain are presented in Figure 3.11. The soil texture types at both
locations are loam and the calculated vertical hydraulic conductivity are 0.14 and 0.15 m/d,
respectively. The thicknesses of unsaturated zone range from 24 to 46 m and 1.5 to 3 m during
the simulation period, respectively. It indicates clearly that the unsaturated zone has effect both
on temporal distribution and magnitude of the recharge arrival at groundwater table. The thick
unsaturated zone not only delayed the arrival time of recharge and smoothed the temporal
variations, but also reduced the amount of recharge arriving at the water table. Thus, in thicker

73
unsaturated zones, both the amount and the timing of the local recharge estimated by the
approach which applies the infiltration leaving the root zone to the water table directly will be
less realistic.
3.5.3. Sensitivity and Uncertainty Analysis of Calculated Recharge Rates
The ratio of mean annual groundwater recharge to precipitation plus irrigation is used to
calculate parameter sensitivity for UZF. A series of simulations were performed in which
individual parameters and initial conditions were multiplied by a factor ranging from 0.1 to 2.5
for saturated water content (THTS), 0.5 to 2.5 for initial water content (THTI), and 0.1 to 10 for
other parameters (Sy, VKS and EPS), while other parameters and initial conditions were
maintained at their base case value (values used in recharge simulation). The effect of changing
these parameters on the simulated ratio was analyzed (Figure 3.12). Factors of 0.3 and 0.4
multiplied by the EPS did not converge and could not be used in the evaluation. Initial water
content is the most sensitive parameter for the UZF. Increasing the THTI by a factor of 2.5
increases recharge by up to a factor of 10. This also indicates that antecedent soil moisture is of
great importance in groundwater recharge. Recharge rates are also highly sensitive to specific
yield (Sy). In addition to using Sy to calculate water storage change in the saturated zone, UZF
additionally use Sy to calculate wetting front velocity and amount of water available to be
captured by a rising water table. Groundwater recharge is inversely related to EPS which is also
has highly sensitive to THTS and VKS. EPS is the only parameter with higher sensitivity than
other parameters when decreasing.

74
Figure 3.12. Effect of model parameters and initial conditions (expressed as a fraction of base
case) on the computed recharge (expressed as the ratio of mean annual recharge to precipitation
plus irrigation).
3.5.4. Arrival Time of Percolating Water to Groundwater
The time required for downward flux to travel from the base of the root zone to the water
table is referred as water travel time in this paper. In the UZF model, it is calculated as the time
when water reaches the water table. To study the effects of groundwater table depth and soil
hydraulic properties on travel time distribution, the statistic criterion of the initial time lag (e.g.,
the time delay between beginning of infiltration and first arrival of recharge at the water table)
for different soil textures with varying unsaturated zone thicknesses is plotted in Figure 3.13.
Due to continuous decline of the water table in the NCP, the travel time is expected increase with
time. The initial time lag is insensitive to unsaturated zone thickness for the loamy sand. The

75
mean time lag increases from 0.6 years for unsaturated zone thickness of less than 2 m to 3 years
for greater than 30 m. The range in time lags remains relatively low. A clear non linear positive
relationship between lag time and unsaturated zone thickness is revealed for loam. The mean
time lag increases from 0.4 years for unsaturated zone thickness of less than 2 m to 8 years for
greater than 30 m, and the time lag variation also increases with unsaturated zone thickness. For
clay, the time lag increases with unsaturated zone thickness of less than 10 m, and remains at
nearly the same value with unsaturated zone thickness from 10 to 26 m, and shows an increasing
trend again with unsaturated zone thickness greater than 26 m.
3.5.5. Validation of Calculated Recharge Rates
The comparison of the simulated water level and measured water levels in the 105
observations wells, total 13900 observation values, is presented in Figure 3.14. The root mean
square error (RMSE) is ~10 m. This result is acceptable regarding the variation range of water
levels (-18.2 to 92.5 m).
An effective recharge of 117 mm/yr is quite high compared to mean annual precipitation
of ~520 mm. Because the fraction of precipitation that contributes to recharge ranges from ~1%
to ~20% (Chen, 1999) this result suggests that a part of the recharge comes from the irrigation
derived from the groundwater pumping. The deficit between pumping (~160 mm/yr) and net
recharge of ~40 mm/yr, divided by the area weighted specific yield of 0.075 results in a water
table decline rate of ~0.5 m/yr.
The groundwater recharge rate estimated by other methods is listed in Table 3.3, and all
estimates had account for the effect of irrigation. Although the range of estimated recharge rates
is quite wide using different methods, estimated groundwater recharge rates are comparable with

76
those estimated by other techniques. Moreover, the estimated recharge in this study is validated
by the saturated zone flow modeling, and should be more reliable.
Table 3.3. Annul local and regional recharge rates estimated used other methods in the NCP.
Region R (mm/yr) Methoda Sourceb
Piedmont Area
150-292 GD 1
170-180 UFM 2
10-200 CMB 3
50-1090 UFM 4
300 GD 7
Alluvial Plain 0-238 GD 1
140-155 UFM 2
Coastal Plain 106-113 GD 1
89 UFM 2
Entire Plain 147 FPI 5
103 FPI 6
aEstimation methods include: UFM, unsaturated flow simulation; CMB, chloride mass balance;
GD, groundwater dating, age gradient derived from tracers (e.g., Tritium and bromide ); FPI,
fraction of precipitation and irrigation.
bSource are as follows:1, Wang et al., (2008); 2, Lu et al., (2011); 3,Liu et al., (2009); 4, Kendy
et al., (2004); 5, Chen, (1999); 6, Ren, (2007); and 7, von Rohden et al., (2010).

77
Figure 3.13. Statistical distribution of time delay of recharge reaching the water table for (a)
Loamy sand, (b) Loam and (c) Clay at different unsaturated zone thicknesses.
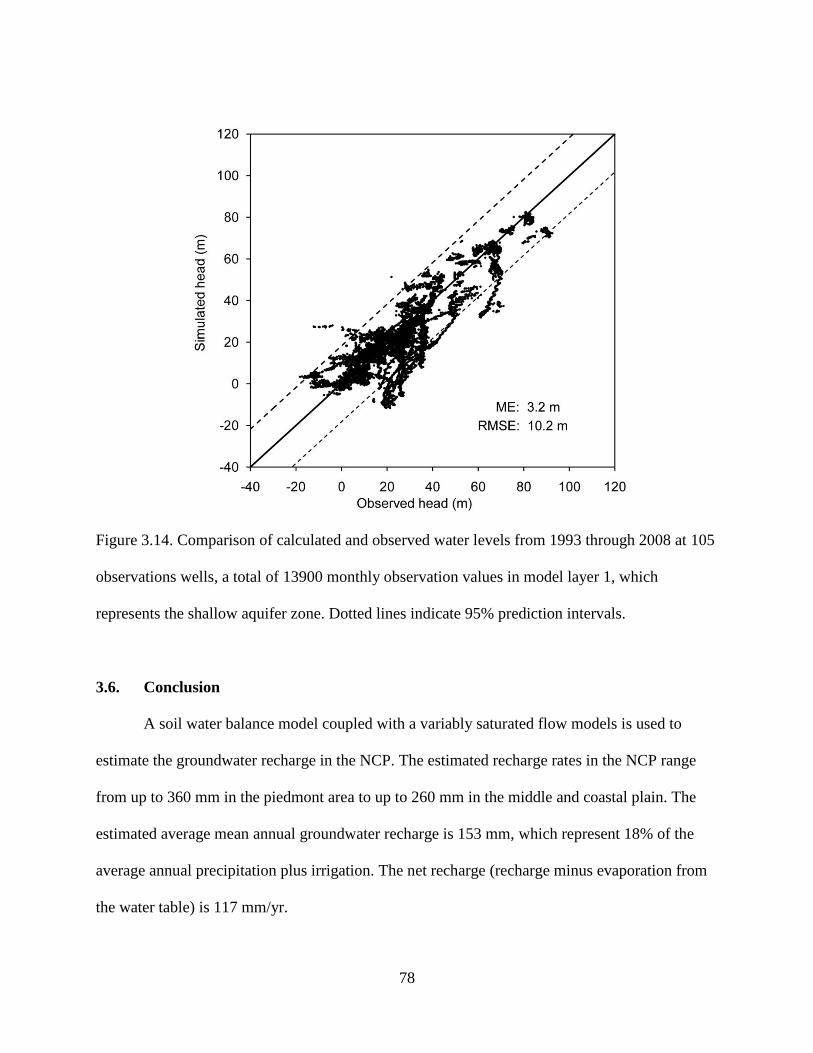
78
Figure 3.14. Comparison of calculated and observed water levels from 1993 through 2008 at 105
observations wells, a total of 13900 monthly observation values in model layer 1, which
represents the shallow aquifer zone. Dotted lines indicate 95% prediction intervals.
3.6. Conclusion
A soil water balance model coupled with a variably saturated flow models is used to
estimate the groundwater recharge in the NCP. The estimated recharge rates in the NCP range
from up to 360 mm in the piedmont area to up to 260 mm in the middle and coastal plain. The
estimated average mean annual groundwater recharge is 153 mm, which represent 18% of the
average annual precipitation plus irrigation. The net recharge (recharge minus evaporation from
the water table) is 117 mm/yr.
79
The model results indicate clearly that the unsaturated zone has affect on both temporal
distribution and magnitude of the recharge arrival at groundwater table. The time lag of the
groundwater recharge in the NCP ranges 0 to 10 years where the current unsaturated zone
thickness is greater than 30 m.
The fundamental cause of water depletion in the NCP is the higher water demand of the
wheat and maize double cropping system than the precipitation allows. The groundwater system
is in a net discharge state because the total pumping exceeds the effective recharge rate. The
deficit results in an annual water table decline of 0.5 m from 1993 to 2008, the duration analyzed
in this study.
Acknowledgements
This work was supported by the National Basic Research Program of China (grant
#2006CB403404) and National Natural Science Foundation of China (grant #40911130505). We
appreciate the data support from China Geological Survey and China Institute of Water
Resources and Hydropower Research.
References
Bouchet, R.J. 1963. Evapotranspiration réelle et potentielle, signification climatique. IAHS Publ
62, no. 134-142.
Brooks, R.H., A.T. Corey, and S.U. Colorado. 1964. Hydraulic properties of porous media.
Chen, W. 1999. Groundwater in Hebei Province. Beijing: Seismological Press. (in Chinese)
Chen, M., and F. Ma. 2002. Groundwater Resources and the related Environment in China.
Beijing: Earthquake Press. (in Chinese)

80
Delin, G.N., R.W. Healy, D.L. Lorenz, and J.R. Nimmo. 2007. Comparison of local- to regional-
scale estimates of ground-water recharge in Minnesota, USA. Journal of Hydrology 334, no.
1-2: 231-249.
Gee, G.W., and D. Hillel. 1988. Groundwater recharge in arid regions: Review and critique of
estimation methods. Hydrological Processes 2, no. 3: 255-266.
Hansen, S., H.E. Jensen, N.E. Nielsen, and H. Svendsen. 1990. DAISY-Soil plant atmosphere
system model, The National Agency for Environmental Protection, Copenhagen, Denmark.
Healy, R.W., and P.G. Cook. 2002. Using groundwater levels to estimate recharge.
Hydrogeology Journal 10, no. 1: 91-109.
Hobbins, M.T., J.A. Ramírez, T.C. Brown, and L.H.J.M. Claessens. 2001. The complementary
relationship in estimation of regional evapotranspiration: The complementary relationship
areal evapotranspiration and advection-aridity models. Water Resources Research 37, no. 5:
1367-1387.
Hunt, R.J., D.E. Prudic, J.F. Walker, and M.P. Anderson. 2008. Importance of unsaturated zone
flow for simulating recharge in a humid climate. Ground Water 46, no. 4: 551-560.
Kendy, E., P. Gérard-Marchant, M.T. Walter, Y. Zhang, C. Liu, and T.S. Steenhuis. 2003. A
soil-water-balance approach to quantify groundwater recharge from irrigated cropland in the
North China Plain. Hydrological Processes 17, no. 10: 2011-2031.
Kendy, E., Y. Zhang, C. Liu, J. Wang, and T. Steenhuis. 2004. Groundwater recharge from
irrigated cropland in the North China Plain: case study of Luancheng County, Hebei Province,
1949-2000. Hydrological Processes 18, no. 12: 2289-2302.
Keese, K.E., B.R. Scanlon, and R.C. Reedy. 2005. Assessing controls on diffuse groundwater
recharge using unsaturated flow modeling. Water Resources Research 41, W6010.
Li, Y., and X. Li. 2007. Study on Precipitation Infiltration Recharge with Groundwater Depth
Variation. Journal of China Hydrology 5: 58-60. (in Chinese with English abstract)
Li, J. 2009. An analysis of the coefficient of replenishment from infiltration of precipitation.
Hydrogeology & Engineering Geology 2: 29-33. (in Chinese with English abstract)
Liggett, J., and D. Allen. 2009. Comparing approaches for modeling spatially distributed direct
recharge in a semi-arid region (Okanagan Basin, Canada). Hydrogeology Journal.
Liggett, J., and D. Allen. 2010. Comparing approaches for modeling spatially distributed direct
recharge in a semi-arid region (Okanagan Basin, Canada). Hydrogeology Journal 18, no. 2:
339.
Lin, W., H. Dong, G. Wang, Z. Su, and L. Chen. 2008. Regional evapotranspiration estimation in
hebei plain based on remote sensing. Remote Sensing for Land & Resources 1: 86-90. (in
Chinese with English abstract)
81
Liu, C., X. Zhang, and Y. Zhang. 2002. Determination of daily evaporation and
evapotranspiration of winter wheat and maize by large-scale weighing lysimeter and micro-
lysimeter. Agricultural And Forest Meteorology 111, no. 2: 109-120.
Liu, J., Z. Chen, Z. Zhang, Y. Fei, F. Zhang, J. Chen, and Z. Wang. 2009. Estimation of Natural
Groundwater Recharge in the Hutuo River Alluvial-Proluvial Fan Using Environmental
Tracers. Geological Science and Technology Information 6: 114-118. (in Chinese with
English abstract)
Liu, C., and Z. Wei. 1989. Agricultural Hydrology and Water Resources in the North China
Plain. Beijing: Science Press. (in Chinese)
Liu, C., J. Chen, and J. Qiao. 2004. A survey of irrigation status in the well irrigation distict in
the North Chian Plain. Water Resources Development Research 10: 38-41 (in Chinese).
Liu, S., R. Sun, Z. Sun, X. Li, and C. Liu. 2004. Comparison of Different Complementary
Relationship Models for Regional Evapotranspiration Estimation. Acta Geographica Sinica
59, no. 3: 331-340. (in Chinese with English abstract)
Lu, X., M. Jin, M.T. van Genuchten, and B. Wang. 2011. Groundwater Recharge at Five
Representative Sites in the Hebei Plain, China. Ground Water 49, no. 2: 286-294.
Mo, X., L. Xue, and Z. Lin. 2005. Spatio-temporal Distribution of Crop Evapotranspiration from
1981-2001 over the North China Plain. Journal of Natural Resources 20, no. 2: 181-187. (in
Chinese with English abstract)
Morel-Seytoux, H.J., P.D. Meyer, M. Nachabe, and J. Touma. 1996. Parameter equivalence for
the Brooks-Corey and van Genuchten soil characteristics: Preserving the effective capillary
drive. Water Resources Research 32, no. 5: 1251-1258.
Morton, F.I. 1983. Operational estimates of areal evapotranspiration and their significance to the
science and practice of hydrology. Journal of Hydrology 66, no. 1-4: 1-76.
Morton, F.I., F. Ricard, and S. Fogarasi. 1985. Operational estimates of areal evapotranspiration
and lake evaporation: Program WREVAP. Inland Waters Directorate, National Hydrology
Research Institute, Environment Canada. Ottawa, Ont.
Niswonger, R.G., D.E. Prudic, and R.S. Regan. 2006. Documen- tation of the Unsaturated-Zone
Flow (UZF1) Package for modeling unsaturated flow between the land surface and the water
table with MODFLOW-2005. U.S. Geological Survey Techniques and Methods 6-A19.
Niswonger, R.G., and D.E. Prudic. 2009. Comment on" Evaluating Interactions between
Groundwater and Vadose Zone Using the HYDRUS-Based Flow Package for MODFLOW"
by Navin Kumar C. Twarakavi, Jirka Simunek, and Sophia Seo. Vadose Zone Journal 8, no.
3: 818.
Pachepsky, Y., and W.J. Rawls. 2004. Development of pedotransfer functions in soil hydrology,
Elsevier.

82
Panday, S., and P.S. Huyakorn. 2008. MODFLOW SURFACT: a state-of-the-art use of vadose
zone flow and transport equations and numerical techniques for environmental evaluations.
Vadose Zone Journal 7, no. 2: 610.
Poulovassilis, A., M. Anadranistakis, A. Liakatas, S. Alexandris, and P. Kerkides. 2001. Semi-
empirical approach for estimating actual evapotranspiration in Greece. Agricultural Water
Management 51, no. 2: 143-152.
Refsgaard, J.C., B. Storm, and V.P. Singh. 1995. MIKE SHE. In Computer Models of Watershed
Hydrology, ed. Singh, V.P. Highlands Ranch, Colorado: Water Resources Publications.
Samper, F.J., and M.A. Garc A-Vera. 1992. BALAN v. 10: program for calculating water and
salt balances in soil. Departamento de Ingeniería del Terreno. Universidad Politécnica de
Cataluña, Spain.
Scanlon, B.R., R.W. Healy, and P.G. Cook. 2002. Choosing appropriate techniques for
quantifying groundwater recharge. Hydrogeology Journal 10, no. 1: 18-39.
Schaap, M.G., F.J. Leij, and M.T. van Genuchten. 2001. ROSETTA: a computer program for
estimating soil hydraulic parameters with hierarchical pedotransfer functions. Journal of
Hydrology 251, no. 3-4: 163-176.
Schroeder, P.R., T.S. Dozier, P.A. Zappi, B.M. McEnroe, J.W. Sjostrom, and R.L. Peyton. 1994.
The hydrologic evaluation of landfill performance (HELP) model: user's guide for version 3.
EPA/600/R-94/168a. Office of Research and Development, U.S. Environmental Protection
Agency, Washington, DC.
Seo, H.S., J. Šimůnek, and E.P. Poeter. 2007. Documentation of the HYDRUS package for
MODFLOW-2000, the US Geological Survey modular ground-water model. GWMI 2007-01.
Int. Ground Water Modeling Ctr., Colorado School of Mines, Golden.
Shang, S.H., L.Y. Sun, and Z.C. Hao. 2008. Using Complementary Relationship to Estimate
Monthly Evapotranspiration in Arid Oasis. Journal of China Hydrology 3: 67-69 (in Chinese
with English abstract).
Simmers, I. 1987. Estimation of natural groundwater recharge, Springer.
Small, E.E. 2005. Climatic controls on diffuse groundwater recharge in semiarid environments of
the southwestern United States. Water Resources Research 41, W4012.
Song, X.F., S.Q. Wang, G.Q. Xiao, Z.M. Wang, X. Liu, and P. Wang. 2009. A study of soil
water movement combining soil water potential with stable isotopes at two sites of shallow
groundwater areas in the North China Plain. Hydrological Processes 23, no. 9: 1376-1388.
Song, Z.W., H.L. Zhang, R.L. Snyder, F.E. Anderson, and F. Chen. 2010. Distribution and
Trends in Reference Evapotranspiration in the North China Plain. Journal of Irrigation And
Drainage Engineering-Asce 136, no. 4: 240-247.
83
Sophocleous, M.A. 1991. Combining the soilwater balance and water-level fluctuation methods
to estimate natural groundwater recharge: Practical aspects. Journal of Hydrology 124, no. 3:
229-241.
Sophocleous, M. 1992. Groundwater recharge estimation and regionalization: the Great Bend
Prairie of central Kansas and its recharge statistics. Journal of Hydrology 137, no. 1: 113-140.
Thoms, R.B., R.L. Johnson, R.W. Healy, and S.U. Geological. 2006. User's guide to the variably
saturated flow (VSF) process for MODFLOW. U.S. Geological Survey Techniques and
Methods 6-A18.
U.S. Geological Survey. 2008. Documentation of computer program INFIL 3. 0 - Distributed-
parameter watershed model to estimate net infiltration below the root zone. U.S. Geological
Survey Scientific Investigations Report 2008-5006.
van Walsum, P.E.V., and P. Groenendijk. 2008. Quasi steady-state simulation of the unsaturated
zone in groundwater modeling of lowland regions. Vadose Zone Journal 7, no. 2: 769.
von Rohden, C., A. Kreuzer, Z. Chen, R. Kipfer, and W. Aeschbach-Hertig. 2010.
Characterizing the recharge regime of the strongly exploited aquifers of the North China
Plain by environmental tracers. Water Resources Research 46, no. 5: W5511.
Wang, B.G., M.G. Jin, J.R. Nimmo, L. Yang, and W.F. Wang. 2008. Estimating groundwater
recharge in Hebei Plain, China under varying land use practices using tritium and bromide
tracers. Journal of Hydrology 356, no. 1-2: 209-222.
Wang, T., V.A. Zlotnik, J. Imunek, and M.G. Schaap. 2009. Using pedotransfer functions in
vadose zone models for estimating groundwater recharge in semiarid regions. Water
Resources Research 45, no. 4: W4412.
Wösten, J., Y.A. Pachepsky, and W.J. Rawls. 2001. Pedotransfer functions: bridging the gap
between available basic soil data and missing soil hydraulic characteristics. Journal of
Hydrology 251, no. 3-4: 123-150.
Xu, C.Y., and V.P. Singh. 2005. Evaluation of three complementary relationship
evapotranspiration models by water balance approach to estimate actual regional
evapotranspiration in different climatic regions. Journal of Hydrology 308, no. 1-4: 105-121.
Xu, Y., and H.E. Beekman. 2003. Groundwater recharge estimation in Southern Africa.
UNESCO IHP Series No. 64.
Yang, G., Z. Wang, H. Wang, and Y. Jia. 2009. Potential evapotranspiration evolution rule and
its sensitivity analysis in Haihe River basin. Advances in Water Science 20, no. 3: 409-415.
(in Chinese with English abstract)
Zhang, G. 1992. Measuring groundwater recharge through thick unsaturate zone. Ground Water
2: 81-84. (in Chinese)
84
Zhang, G., Y. Fei, and K. Liu. 2004. Evolution of and countermeasure for the groundwater in the
Haihe Plain. Beijing: Science Press. (in Chinese)
Zhang, G., Y. Fei, J. Shen, and L. Yang. 2007. Influence of unsaturated zone thickness on
precipitation infiltration for recharge of groundwater. Journal of Hydraulic Engineering 38,
no. 5: 611-617. (in Chinese with English abstract)
Zhao, J., J. Shao, Y. Cui, and Z. Xie. 2009. Estimating Regional Evapotranspiration in North
China Plain with Remote Sensing Method. Urban Geology 4, no. 1: 43-48. (in Chinese with
English abstract)

85
CHAPTER 4
CHAPTER 4
SUSTAINABILITY EVALUATION OF DEEP GROUNDWATER IN THE NORTH CHINA
PLAIN BY GROUNDWATER FLOW AND AGE SIMULATION
Abstract
Groundwater in the deep aquifer beneath an intermediate, brackish flow zone across the
central and coastal parts of the North China Plain (NCP) is the primary water resource for
irrigation and domestic use. Accurate information about the groundwater recharge regime and
alternation by extensive groundwater abstraction is necessary for sustainability assessment for
the deep groundwater in the NCP. This paper presents the application of direct simulation of
groundwater mean ages to the NCP through the use of a solute transport model. This provides an
effective means to constrain the regional flow model and improve the estimation of flow
parameters, including recharge rates. The simulated age distribution and the calibrated flow
model are then used to characterize the flow regime under natural conditions and an altered state
by groundwater pumping. The model results indicate that simulated groundwater ages in the
NCP are affected by both paleo-hydrologic conditions and extensive groundwater pumping.
Flow paths analysis, water budget calculation and simulated groundwater age distribution show
that the lateral flow to the deep aquifer in the NCP is limited and that the primary inflow is the
downward leakage from the shallow aquifer, which is enhanced by the extensive development of
the deep aquifer. Transient flow modeling reflecting the post-development conditions confirms
that widely distributed vertical recharge and resulting flow have become the dominant processes
shaping the flow patterns both in the shallow and deep aquifers in the NCP.
86
4.1. Introduction
Understanding groundwater circulation and renewability is essential to evaluate how
sustainable groundwater resources are under natural and human-induced conditions in this region.
Groundwater age (or residence time) is the average over the water molecules in a sample of the
time elapsed since recharge, integrating the effects of advection, hydrodynamic mixing and
geochemical reaction along the flow path (Goode, 1996; Bethke and Johnson, 2002a). The
groundwater age data can provide highly valuable information about the circulation and
historical evolution of the groundwater, such as the recharge rate, flow velocity and flow path
(Smethie et al., 1992; Zoellmann et al., 2001; Pint et al., 2003; Xu and Beekman, 2003; Sturchio
et al., 2004). Therefore, the groundwater age can be used to help calibrate groundwater flow
models, understand the groundwater flow regime, and assess the renewability, and hence the
sustainability of the groundwater (Sultan et al., 2000; Zhu, 2000; Sanford et al., 2004; Chen et al.,
2005; Bethke et al., 2008).
Although various techniques based on environmental tracers can be used to date
groundwater (Clark and Fritz, 1997; Kazemi et al., 2006), they commonly cannot treat the water
sample as mixtures or give the age distribution. The spatial distribution of groundwater age is
often obtained by interpolation of measured sample ages (Chen, 2001). To quantify the
distribution of ages in aquifers, several types of mathematical models have been developed
during the past decades. A classical age modeling is lumped-parameter models (Richter et al.,
1993; Amin and Campana, 1996). This analytical model assumes that the specific age
distributions describing piston flow, exponential mixing or dispersive mixing are known
beforehand, and the inverse problem is solved by fitting the model results and measured age.
Given a known velocity field, age distribution considering only advection can be calculated by

87
an analytical method or particle tracking algorithms. However, the resulting advective ages
ignore the effect of dilution, dispersion and mixing along the flow path (Bethke and Johnson,
2002a and 2002b). Moreover, the particle tracking method cannot calculate the residence-time
distributions, since the moving groundwater volumes are not associated to the simulated ages
(Kazemi et al., 2006).
More elaborate methods use the advective-dispersive equation to describe the age
transport through aquifers. Goode (1996) derived the transport equation with a source term and
with mean age as the primary variable. Engesgaard and Molson (1998) applied the technique to
interpret a regional flow system using tritium as tracer and found the simulated age compared
well with observed tritium data. Castro and Goblet (2005) found that direct simulation of the
mean age filed employing this method yielded the most consistent results when mixing process
in a particular groundwater system is not negligible. Varni and Carrera (1998) made further
developments using moment analysis and established equations for moments of groundwater age.
Bethke and Johnson (2002b) showed that the contribution of aquitards to groundwater age
depends only on the ratio of aquitard to aquifer flow volumes and derived an idealized
groundwater age equation in aquitard. Ginn (1999) derived a four dimensional (space and age)
advection-dispersion governing equation for groundwater age, where transport in the age
dimension is with unit velocity and zero dispersion-diffusion, and showed that previous age
equations (Goode, 1996; Varni and Carrera, 1998; Bethke and Johnson, 2002b) can be derived
from this governing equation (Ginn et al., 2009). These mathematical models have paved the
way for regional scale simulation of groundwater age. The link between these efforts and the
isotopic age data can then help to verify the model results and to interpret the isotopic ages more
confidently.

88
In the North China Plain, direct measurements of base flow are often not available. It is
well known that simulated water levels are only sensitive to the ratios of recharge and hydraulic
conductivity, and better model calibration can be performed using known flow rates (e.g.
groundwater discharge rate to the surface water). The distribution of groundwater age can be
used to constrain flux and hence recharge.
In the NCP, environmental traces have been used to determine the recharge rate (Wang et
al., 2008; Liu et al., 2009; von Rohden et al., 2010), and to characterize the groundwater age
regime and flow path (Zhang et al., 1987; Zhang et al., 1997; Chen et al., 2005). The principal
problem in previous isotopic age studies is the conflict between groundwater age determined by
14C and 36Cl for the deep aquifer in the central plain and coastal plain. Groundwater age obtained
based on 14C ranges from 10 to 30 kyr (Zhang et al., 1987; Zhang et al., 2001; Chen et al., 2005;
Wu et al., 2007), however, the 36Cl age is old up to 250–300 kyr (Liu et al., 1993; Dong et al.,
2002).
The primary goal of this study is to improve the estimates of recharge values used in the
flow model which has been developed in the North China Plain. The calibrated flow model is
then used to simulate the age distribution in the entire aquifer system, and to characterize the
flow regime.
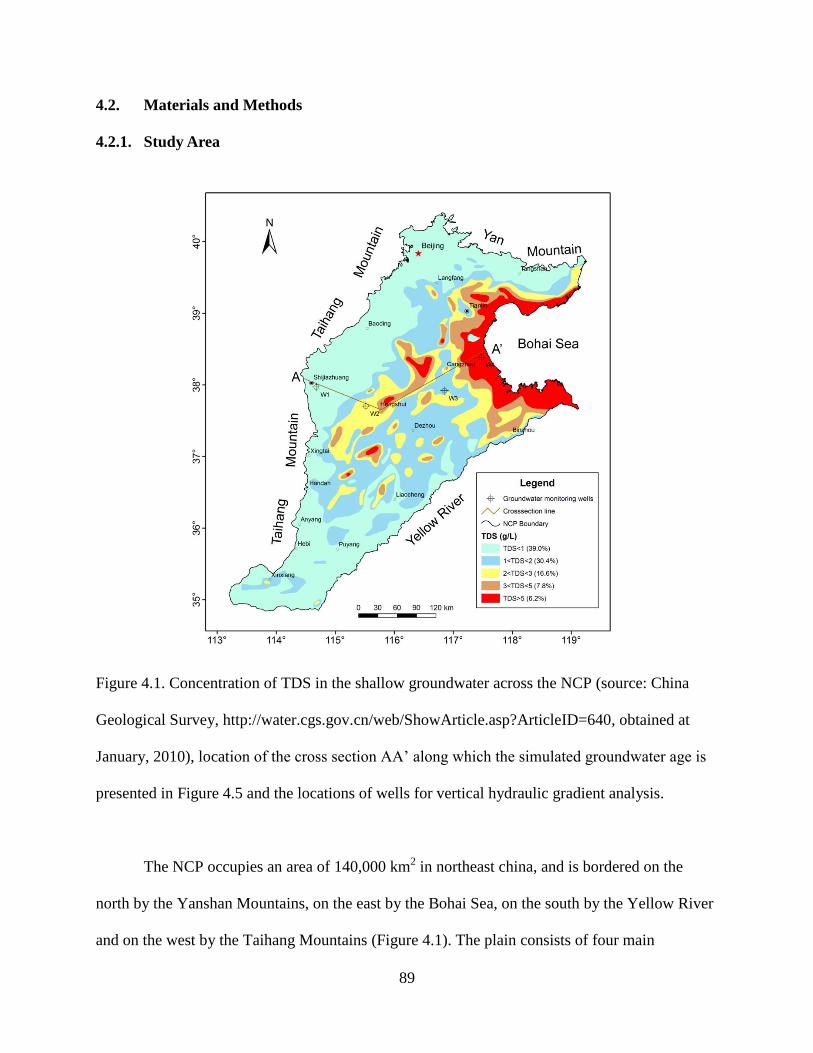
89
4.2. Materials and Methods
4.2.1. Study Area
Figure 4.1. Concentration of TDS in the shallow groundwater across the NCP (source: China
Geological Survey, http://water.cgs.gov.cn/web/ShowArticle.asp?ArticleID=640, obtained at
January, 2010), location of the cross section AA’ along which the simulated groundwater age is
presented in Figure 4.5 and the locations of wells for vertical hydraulic gradient analysis.
The NCP occupies an area of 140,000 km2 in northeast china, and is bordered on the
north by the Yanshan Mountains, on the east by the Bohai Sea, on the south by the Yellow River
and on the west by the Taihang Mountains (Figure 4.1). The plain consists of four main
90
hydrogeological zones from the Taihang Mountain to the Bohai Sea: piedmont pluvial plain, the
central alluvial and flood plains, and the coastal plain (Wu et al., 1996). The population of the
NCP, based on 2000 state census data, is approximate 105 million. This region accounts for ~15%
of China’s total gross domestic product (GDP) and ~10% of total grain production based on the
2009 statistical data (China Statistical Yearbook, 2010). In the North China Plain, approximately
70–80% of the annual water supply comes from groundwater pumping.
The Quaternary aquifers with a thickness ranging from 200 to 600 m in the NCP are
traditionally divided into four major aquifer units often referred as aquifer I, II, III and IV. The
corresponding geologic units of the aquifers are Holocene series (Q4), and late (Q3), middle (Q2)
and early (Q1) Pleistocene series, respectively (Zhu et al., 1995). The NCP aquifer is
traditionally divided into two aquifer zones referred as the ―shallow‖ and ―deep‖ (Wu et al.,
2010). The first aquifer unit which is unconfined and the second aquifer unit which is semi-
confined are together referred as the ―shallow‖ aquifer zone due to the strong hydraulic
connection between the two aquifers. The third and fourth aquifer units are confined and are
together referred as the ―deep‖ aquifer zone, which is characterized by poor hydraulic connection
because the low permeability clay layers inhibit the downward groundwater flow.
In the central and east parts of the NCP, in conjunction with continental salinization and
transgression, shallow groundwater is frequently characterized by high mineralization. The area
of the saline water with the concentration of total dissolved solids (TDS) >1g/L in the shallow
aquifer zone is ~80,000 km2 (Fang et al., 2003), which accounts for ~60% of the entire plain
(Figure 4.1). The primary source of water supply in these regions is the third and fourth aquifer
units. Extensive groundwater exploitation from the two aquifer zones has greatly impacted the
hydrodynamic and hydrogeochemical characteristics of the flow system and caused many
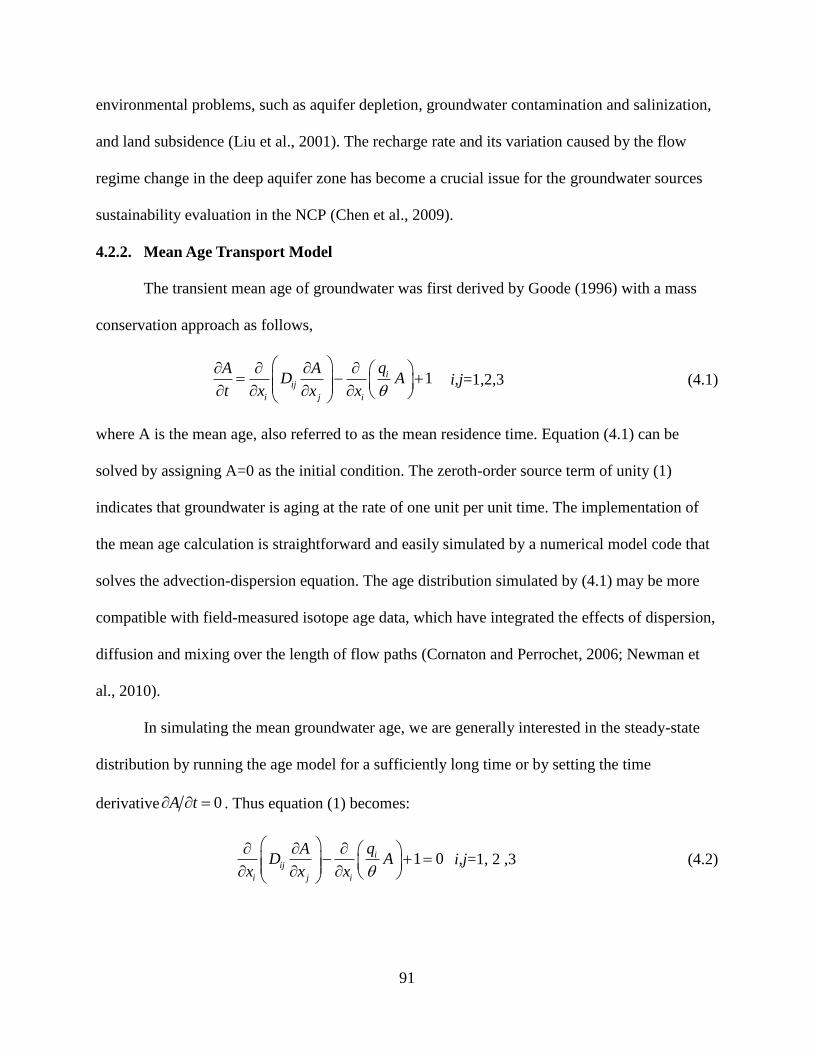
91
environmental problems, such as aquifer depletion, groundwater contamination and salinization,
and land subsidence (Liu et al., 2001). The recharge rate and its variation caused by the flow
regime change in the deep aquifer zone has become a crucial issue for the groundwater sources
sustainability evaluation in the NCP (Chen et al., 2009).
4.2.2. Mean Age Transport Model
The transient mean age of groundwater was first derived by Goode (1996) with a mass
conservation approach as follows,
1iij
i j i
qA AD A
t x x x
i,j=1,2,3 (4.1)
where A is the mean age, also referred to as the mean residence time. Equation (4.1) can be
solved by assigning A=0 as the initial condition. The zeroth-order source term of unity (1)
indicates that groundwater is aging at the rate of one unit per unit time. The implementation of
the mean age calculation is straightforward and easily simulated by a numerical model code that
solves the advection-dispersion equation. The age distribution simulated by (4.1) may be more
compatible with field-measured isotope age data, which have integrated the effects of dispersion,
diffusion and mixing over the length of flow paths (Cornaton and Perrochet, 2006; Newman et
al., 2010).
In simulating the mean groundwater age, we are generally interested in the steady-state
distribution by running the age model for a sufficiently long time or by setting the time
derivative 0A t . Thus equation (1) becomes:
1 0iij
i j i
qAD A
x x x
i,j=1, 2 ,3 (4.2)
92
For the boundary conditions, a no-flow boundary in the flow model become a no ―age-
mass‖ boundary in the age transport model. A specified inflow boundary also becomes a no age-
mass boundary since the age of any inflow entering the model domain is considered zero. An
outflow boundary, on the other hand, is allowed to carry an advective ―age-mass‖ freely out of
the model domain.
An important question that should be kept in mind is how the initial-condition affects the
current age distribution. Indeed we cannot prove that that the groundwater age distribution is in
steady state and the initial condition may matter to the current age distribution. That means
simulating groundwater age distributions requires specification of initial conditions that may
involve connate waters or other information related to the creation of the actual subsurface (Ginn
et al., 2009). However this challenge is from characterization limitations and not from the
fundamental models.
4.2.3. Water Level and Groundwater Age Observations
The groundwater flow model set up in this study is to simulate steady-state groundwater
flow prior to the development of groundwater in the NCP. The amount of groundwater pumpage
was limited prior to the 1960s in the NCP. The water level contour maps can represent the
groundwater potential field in the predevelopment period. A total of 289 and 164 locations were
digitized from the water level contour maps for model calibration. Water level data were
collected at all the multilevel monitoring wells on monthly basis from 1993 to 2008.
Although a significant number of isotopic age data have been acquired by previous
studies, to keep the consistency of different data sources, only the carbon-14 activities were
collected to be used in this study. Moreover, to remove the effect of mixing with shallow young
groundwater, only those samples with 3H content less than 1 TU (tritium unit) were used in the
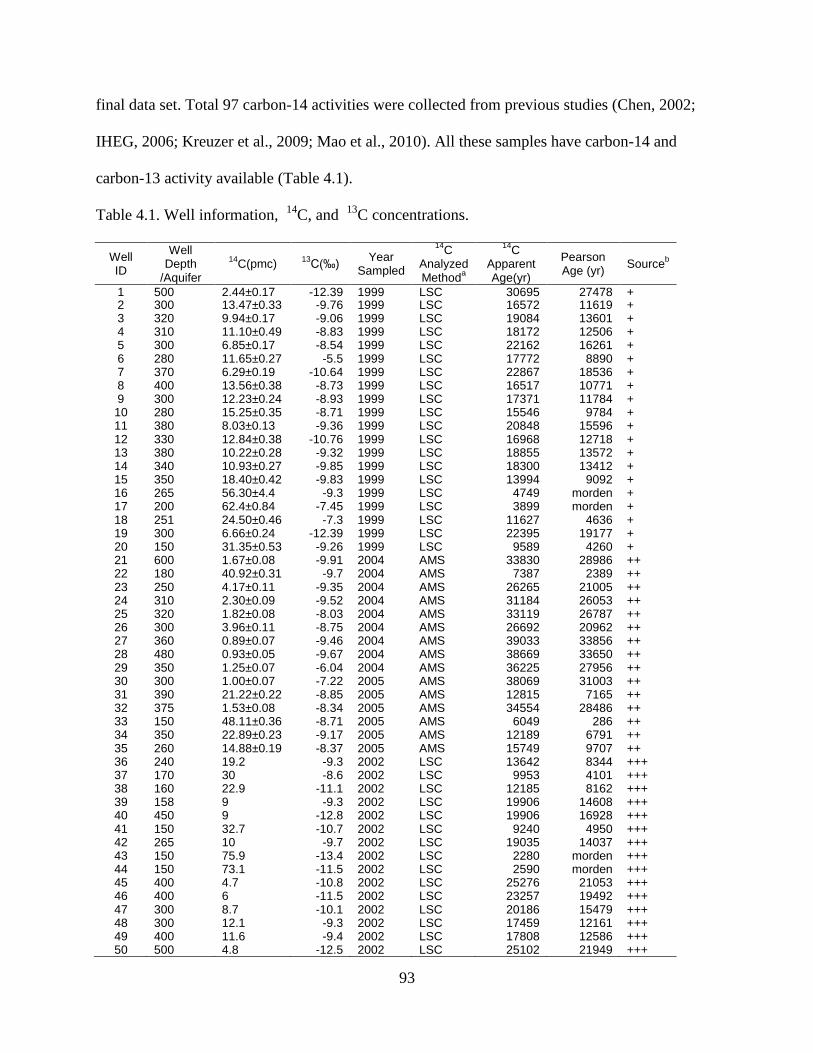
93
final data set. Total 97 carbon-14 activities were collected from previous studies (Chen, 2002;
IHEG, 2006; Kreuzer et al., 2009; Mao et al., 2010). All these samples have carbon-14 and
carbon-13 activity available (Table 4.1).
Table 4.1. Well information, 14
C, and 13
C concentrations.
Well ID
Well Depth
/Aquifer
14C(pmc)
13C(‰)
Year Sampled
14C
Analyzed Method
a
14C
Apparent Age(yr)
Pearson Age (yr)
Sourceb
1 500 2.44±0.17 -12.39 1999 LSC 30695 27478 + 2 300 13.47±0.33 -9.76 1999 LSC 16572 11619 + 3 320 9.94±0.17 -9.06 1999 LSC 19084 13601 + 4 310 11.10±0.49 -8.83 1999 LSC 18172 12506 + 5 300 6.85±0.17 -8.54 1999 LSC 22162 16261 + 6 280 11.65±0.27 -5.5 1999 LSC 17772 8890 + 7 370 6.29±0.19 -10.64 1999 LSC 22867 18536 + 8 400 13.56±0.38 -8.73 1999 LSC 16517 10771 + 9 300 12.23±0.24 -8.93 1999 LSC 17371 11784 + 10 280 15.25±0.35 -8.71 1999 LSC 15546 9784 + 11 380 8.03±0.13 -9.36 1999 LSC 20848 15596 + 12 330 12.84±0.38 -10.76 1999 LSC 16968 12718 + 13 380 10.22±0.28 -9.32 1999 LSC 18855 13572 + 14 340 10.93±0.27 -9.85 1999 LSC 18300 13412 + 15 350 18.40±0.42 -9.83 1999 LSC 13994 9092 + 16 265 56.30±4.4 -9.3 1999 LSC 4749 morden + 17 200 62.4±0.84 -7.45 1999 LSC 3899 morden + 18 251 24.50±0.46 -7.3 1999 LSC 11627 4636 + 19 300 6.66±0.24 -12.39 1999 LSC 22395 19177 + 20 150 31.35±0.53 -9.26 1999 LSC 9589 4260 + 21 600 1.67±0.08 -9.91 2004 AMS 33830 28986 ++ 22 180 40.92±0.31 -9.7 2004 AMS 7387 2389 ++ 23 250 4.17±0.11 -9.35 2004 AMS 26265 21005 ++ 24 310 2.30±0.09 -9.52 2004 AMS 31184 26053 ++ 25 320 1.82±0.08 -8.03 2004 AMS 33119 26787 ++ 26 300 3.96±0.11 -8.75 2004 AMS 26692 20962 ++ 27 360 0.89±0.07 -9.46 2004 AMS 39033 33856 ++ 28 480 0.93±0.05 -9.67 2004 AMS 38669 33650 ++ 29 350 1.25±0.07 -6.04 2004 AMS 36225 27956 ++ 30 300 1.00±0.07 -7.22 2005 AMS 38069 31003 ++ 31 390 21.22±0.22 -8.85 2005 AMS 12815 7165 ++ 32 375 1.53±0.08 -8.34 2005 AMS 34554 28486 ++ 33 150 48.11±0.36 -8.71 2005 AMS 6049 286 ++ 34 350 22.89±0.23 -9.17 2005 AMS 12189 6791 ++ 35 260 14.88±0.19 -8.37 2005 AMS 15749 9707 ++ 36 240 19.2 -9.3 2002 LSC 13642 8344 +++ 37 170 30 -8.6 2002 LSC 9953 4101 +++ 38 160 22.9 -11.1 2002 LSC 12185 8162 +++ 39 158 9 -9.3 2002 LSC 19906 14608 +++ 40 450 9 -12.8 2002 LSC 19906 16928 +++ 41 150 32.7 -10.7 2002 LSC 9240 4950 +++ 42 265 10 -9.7 2002 LSC 19035 14037 +++ 43 150 75.9 -13.4 2002 LSC 2280 morden +++ 44 150 73.1 -11.5 2002 LSC 2590 morden +++ 45 400 4.7 -10.8 2002 LSC 25276 21053 +++ 46 400 6 -11.5 2002 LSC 23257 19492 +++ 47 300 8.7 -10.1 2002 LSC 20186 15479 +++ 48 300 12.1 -9.3 2002 LSC 17459 12161 +++ 49 400 11.6 -9.4 2002 LSC 17808 12586 +++ 50 500 4.8 -12.5 2002 LSC 25102 21949 +++
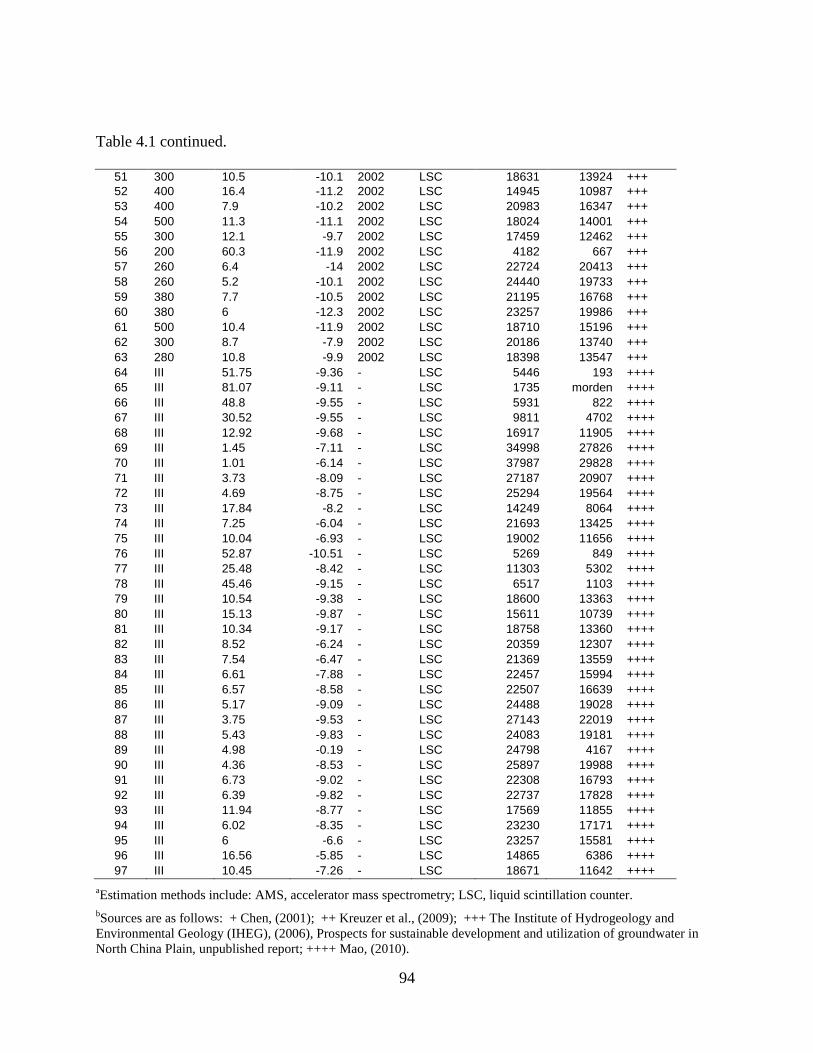
94
Table 4.1 continued.
51 300 10.5 -10.1 2002 LSC 18631 13924 +++
52 400 16.4 -11.2 2002 LSC 14945 10987 +++
53 400 7.9 -10.2 2002 LSC 20983 16347 +++
54 500 11.3 -11.1 2002 LSC 18024 14001 +++
55 300 12.1 -9.7 2002 LSC 17459 12462 +++
56 200 60.3 -11.9 2002 LSC 4182 667 +++
57 260 6.4 -14 2002 LSC 22724 20413 +++
58 260 5.2 -10.1 2002 LSC 24440 19733 +++
59 380 7.7 -10.5 2002 LSC 21195 16768 +++
60 380 6 -12.3 2002 LSC 23257 19986 +++
61 500 10.4 -11.9 2002 LSC 18710 15196 +++
62 300 8.7 -7.9 2002 LSC 20186 13740 +++
63 280 10.8 -9.9 2002 LSC 18398 13547 +++
64 III 51.75 -9.36 - LSC 5446 193 ++++
65 III 81.07 -9.11 - LSC 1735 morden ++++
66 III 48.8 -9.55 - LSC 5931 822 ++++
67 III 30.52 -9.55 - LSC 9811 4702 ++++
68 III 12.92 -9.68 - LSC 16917 11905 ++++
69 III 1.45 -7.11 - LSC 34998 27826 ++++
70 III 1.01 -6.14 - LSC 37987 29828 ++++
71 III 3.73 -8.09 - LSC 27187 20907 ++++
72 III 4.69 -8.75 - LSC 25294 19564 ++++
73 III 17.84 -8.2 - LSC 14249 8064 ++++
74 III 7.25 -6.04 - LSC 21693 13425 ++++
75 III 10.04 -6.93 - LSC 19002 11656 ++++
76 III 52.87 -10.51 - LSC 5269 849 ++++
77 III 25.48 -8.42 - LSC 11303 5302 ++++
78 III 45.46 -9.15 - LSC 6517 1103 ++++
79 III 10.54 -9.38 - LSC 18600 13363 ++++
80 III 15.13 -9.87 - LSC 15611 10739 ++++
81 III 10.34 -9.17 - LSC 18758 13360 ++++
82 III 8.52 -6.24 - LSC 20359 12307 ++++
83 III 7.54 -6.47 - LSC 21369 13559 ++++
84 III 6.61 -7.88 - LSC 22457 15994 ++++
85 III 6.57 -8.58 - LSC 22507 16639 ++++
86 III 5.17 -9.09 - LSC 24488 19028 ++++
87 III 3.75 -9.53 - LSC 27143 22019 ++++
88 III 5.43 -9.83 - LSC 24083 19181 ++++
89 III 4.98 -0.19 - LSC 24798 4167 ++++
90 III 4.36 -8.53 - LSC 25897 19988 ++++
91 III 6.73 -9.02 - LSC 22308 16793 ++++
92 III 6.39 -9.82 - LSC 22737 17828 ++++
93 III 11.94 -8.77 - LSC 17569 11855 ++++
94 III 6.02 -8.35 - LSC 23230 17171 ++++
95 III 6 -6.6 - LSC 23257 15581 ++++
96 III 16.56 -5.85 - LSC 14865 6386 ++++
97 III 10.45 -7.26 - LSC 18671 11642 ++++
aEstimation methods include: AMS, accelerator mass spectrometry; LSC, liquid scintillation counter.
bSources are as follows: + Chen, (2001); ++ Kreuzer et al., (2009); +++ The Institute of Hydrogeology and
Environmental Geology (IHEG), (2006), Prospects for sustainable development and utilization of groundwater in
North China Plain, unpublished report; ++++ Mao, (2010).
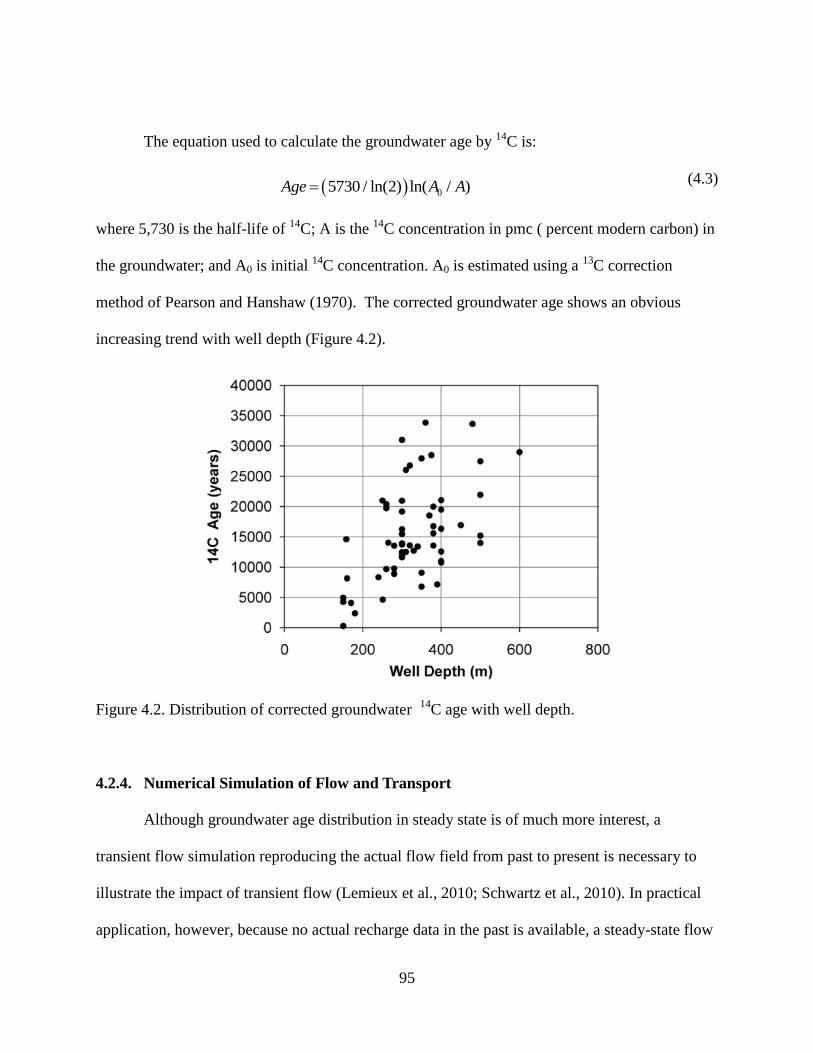
95
The equation used to calculate the groundwater age by 14C is:
05730 / ln(2) ln( / )Age A A (4.3)
where 5,730 is the half-life of 14C; A is the 14C concentration in pmc ( percent modern carbon) in
the groundwater; and A0 is initial 14C concentration. A0 is estimated using a 13C correction
method of Pearson and Hanshaw (1970). The corrected groundwater age shows an obvious
increasing trend with well depth (Figure 4.2).
Figure 4.2. Distribution of corrected groundwater 14
C age with well depth.
4.2.4. Numerical Simulation of Flow and Transport
Although groundwater age distribution in steady state is of much more interest, a
transient flow simulation reproducing the actual flow field from past to present is necessary to
illustrate the impact of transient flow (Lemieux et al., 2010; Schwartz et al., 2010). In practical
application, however, because no actual recharge data in the past is available, a steady-state flow

96
filed which is simulated under the current recharge condition is commonly used assuming a
steady-state flow in the past. In the NCP, although the paleo-climate change has been interpreted
by isotopic data (Chen et al., 2003) for the past 30,000 years, the actual recharge data are not
available. Therefore, the flow field in the pre-development period in the NCP simulated by the
steady-state flow which has been constructed in Chapter 2 serves as the flow field required by
the age model. The effect of paleo-flow conditions of the age distribution is evaluated using a
two steady-state stage flow model as used by Sanford et al. (1996). The transient flow model
developed in Chapter 2 for the post development period (1970–2008) using MODFLOW 2000
(Harbaugh et al., 2000) with sub-regional water budget calculation code Zonebudget (Harbaugh,
1990) are used to analyze the variation in the recharge rate to the deep groundwater.
Pathlines starting from selected locations were determined by MODPATH (Pollock, 1994)
using the three dimensional hydraulic head distributions computed by the flow model. Particles
were introduced on the water table at selected model grid cells across the plain and tracked
forward to their end points. Advective flowpaths obtained do not account for dispersion, but
provide an approximation of the flow pattern. The advective travel time provides an indicator of
the time scale of the flowpaths. A value of 25% for effective porosity is used in travel time
calculations. The value does not impact flowpaths locations but changes travel times.
The mean age distribution controlled by advection and dispersion was simulated using
MT3DMS (Zheng and Wang, 1999; Zheng, 2010) with a steady-state transport simulation option.
Because there are no constraints on the dispersivity, sensitivity analysis was conducted by
changing the magnitude of longitudinal dispersivity (αL) and vertical dispersivity (αV) separately,
and the transverse dispersivity (αT) was taken as one tenth of αL. The mean and standard
deviation of simulated groundwater age at those locations with the 14C age measurement are
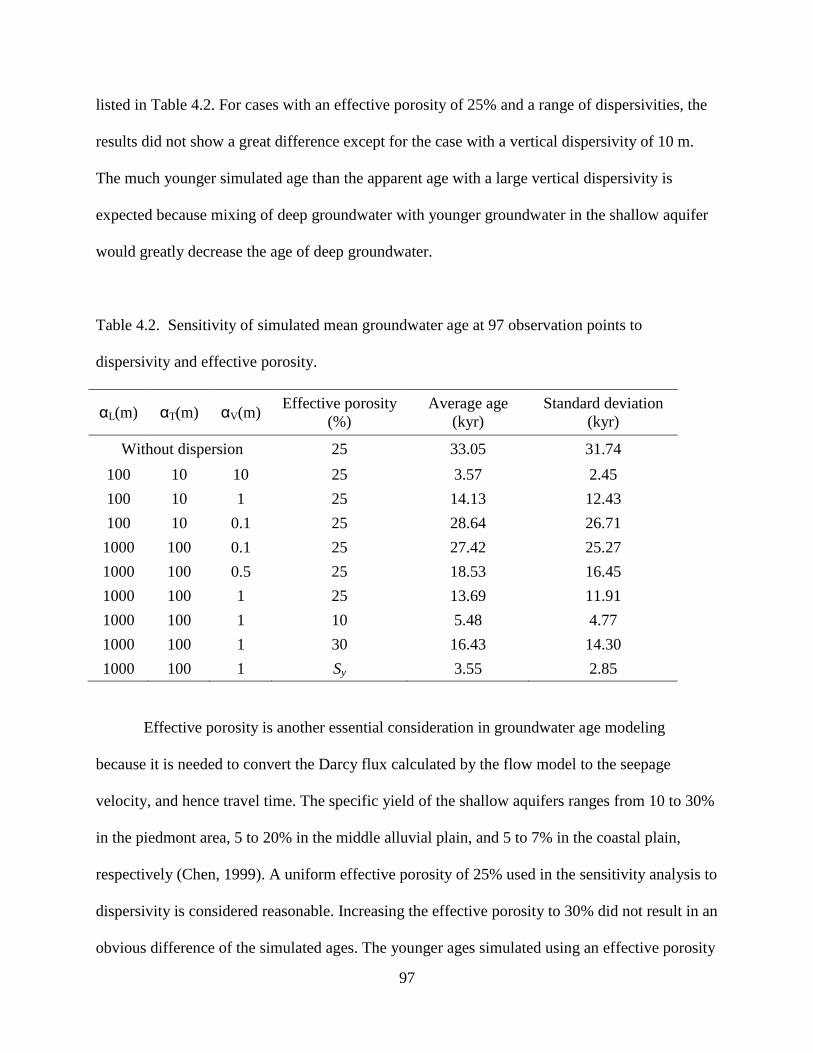
97
listed in Table 4.2. For cases with an effective porosity of 25% and a range of dispersivities, the
results did not show a great difference except for the case with a vertical dispersivity of 10 m.
The much younger simulated age than the apparent age with a large vertical dispersivity is
expected because mixing of deep groundwater with younger groundwater in the shallow aquifer
would greatly decrease the age of deep groundwater.
Table 4.2. Sensitivity of simulated mean groundwater age at 97 observation points to
dispersivity and effective porosity.
αL(m) αT(m) αV(m) Effective porosity
(%)
Average age
(kyr)
Standard deviation
(kyr)
Without dispersion 25 33.05 31.74
100 10 10 25 3.57 2.45
100 10 1 25 14.13 12.43
100 10 0.1 25 28.64 26.71
1000 100 0.1 25 27.42 25.27
1000 100 0.5 25 18.53 16.45
1000 100 1 25 13.69 11.91
1000 100 1 10 5.48 4.77
1000 100 1 30 16.43 14.30
1000 100 1 Sy 3.55 2.85
Effective porosity is another essential consideration in groundwater age modeling
because it is needed to convert the Darcy flux calculated by the flow model to the seepage
velocity, and hence travel time. The specific yield of the shallow aquifers ranges from 10 to 30%
in the piedmont area, 5 to 20% in the middle alluvial plain, and 5 to 7% in the coastal plain,
respectively (Chen, 1999). A uniform effective porosity of 25% used in the sensitivity analysis to
dispersivity is considered reasonable. Increasing the effective porosity to 30% did not result in an
obvious difference of the simulated ages. The younger ages simulated using an effective porosity

98
of 10% and the specific yield are expected as smaller effective porosity increases the seepage
velocity. A uniform effective porosity of 25% is used in the following simulation.
Automatic model calibration code PEST (Doherty, 2003) was employed to calibrate the
recharge distribution based on the water levels and apparent ages converted from carbon-14 data.
In this study, a total of 332 observations, including 239 hydraulic heads digitized from the water
level contour map and 93 observed groundwater 14C apparent ages were used in the calibration
procedure.
Figure 4.3. Simulated groundwater mean age distribution in the first model layer, which
represents the first and second aquifer units in the NCP.
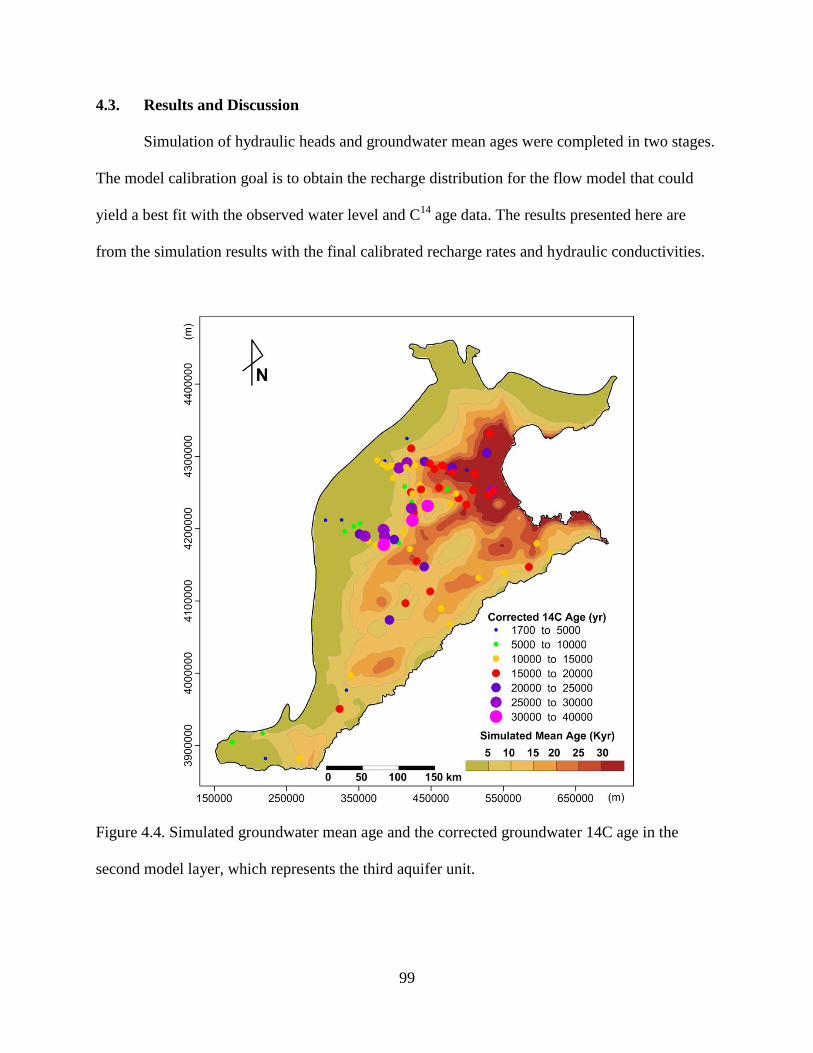
99
4.3. Results and Discussion
Simulation of hydraulic heads and groundwater mean ages were completed in two stages.
The model calibration goal is to obtain the recharge distribution for the flow model that could
yield a best fit with the observed water level and C14 age data. The results presented here are
from the simulation results with the final calibrated recharge rates and hydraulic conductivities.
Figure 4.4. Simulated groundwater mean age and the corrected groundwater 14C age in the
second model layer, which represents the third aquifer unit.
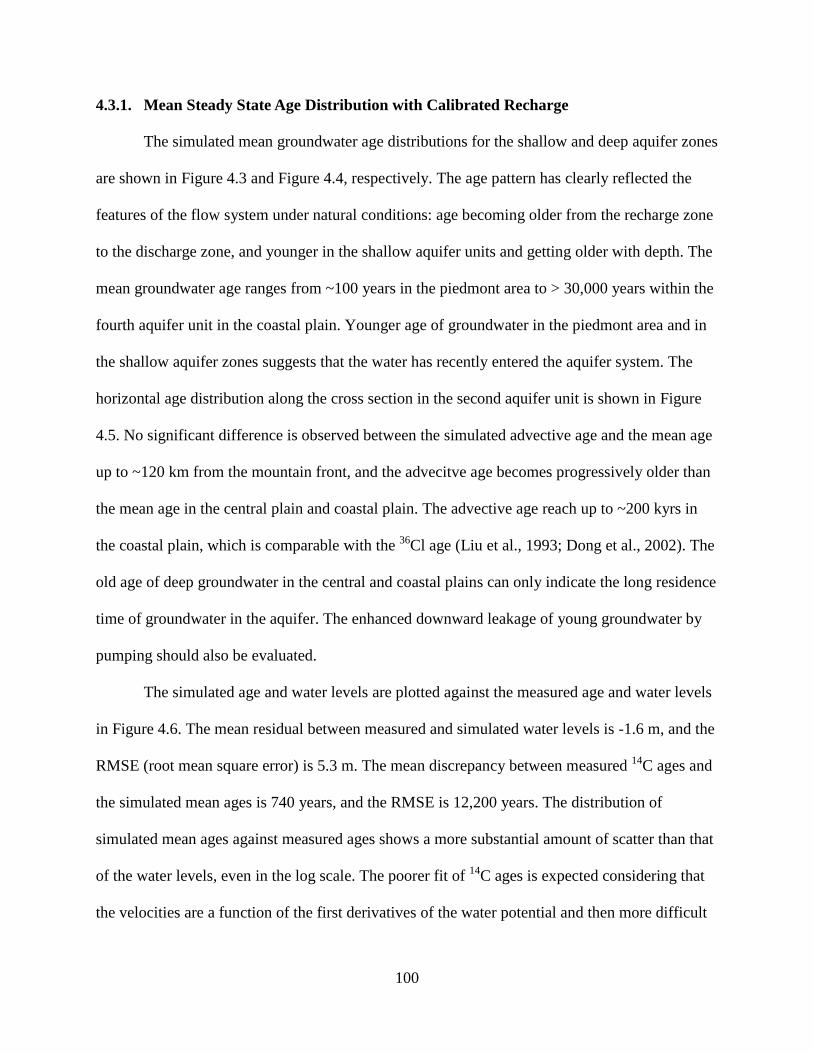
100
4.3.1. Mean Steady State Age Distribution with Calibrated Recharge
The simulated mean groundwater age distributions for the shallow and deep aquifer zones
are shown in Figure 4.3 and Figure 4.4, respectively. The age pattern has clearly reflected the
features of the flow system under natural conditions: age becoming older from the recharge zone
to the discharge zone, and younger in the shallow aquifer units and getting older with depth. The
mean groundwater age ranges from ~100 years in the piedmont area to > 30,000 years within the
fourth aquifer unit in the coastal plain. Younger age of groundwater in the piedmont area and in
the shallow aquifer zones suggests that the water has recently entered the aquifer system. The
horizontal age distribution along the cross section in the second aquifer unit is shown in Figure
4.5. No significant difference is observed between the simulated advective age and the mean age
up to ~120 km from the mountain front, and the advecitve age becomes progressively older than
the mean age in the central plain and coastal plain. The advective age reach up to ~200 kyrs in
the coastal plain, which is comparable with the 36Cl age (Liu et al., 1993; Dong et al., 2002). The
old age of deep groundwater in the central and coastal plains can only indicate the long residence
time of groundwater in the aquifer. The enhanced downward leakage of young groundwater by
pumping should also be evaluated.
The simulated age and water levels are plotted against the measured age and water levels
in Figure 4.6. The mean residual between measured and simulated water levels is -1.6 m, and the
RMSE (root mean square error) is 5.3 m. The mean discrepancy between measured 14C ages and
the simulated mean ages is 740 years, and the RMSE is 12,200 years. The distribution of
simulated mean ages against measured ages shows a more substantial amount of scatter than that
of the water levels, even in the log scale. The poorer fit of 14C ages is expected considering that
the velocities are a function of the first derivatives of the water potential and then more difficult

101
to fit, which is confirmed in the study of Sanford et al. (2004). Moreover, hydrodynamic
dispersion is also considered in this study and it could improve the fit quality had it not been
assumed to be uniform across the plain. However, insufficient data exist to allow the calibration
of dispersivity.
Figure 4.5. Simulated advective age and mean age distribution in the second aquifer along the
cross section.
The final calibrated recharge distribution is presented in Figure 4.7. The average recharge
is 85 mm/yr. The groundwater recharge is higher in the southeast than in the northwest part of
the plain, which shows a similar pattern with the mean annual precipitation in the NCP. The
estimated higher recharge rate in the piedmont area along parts of the west boundary is believed
to be contributed from the mountain recharge. The net recharge distribution (estimated recharge
subtracted by the simulated and specified leakage to river) shows an obvious discharge zone
along the boundary between the piedmont plain and the central plain (Figure 4.8). This zone is
also spread along the boundary between high hydraulic conductivity zones in the piedmont area

102
and low hydraulic conductivity zones, the boundary between shallow fresh water and shallow
brackish water zones.
Figure 4.6. Comparison of (a) simulated water level and measured water level and (b) simulated
groundwater mean age and measured apparent age based on carbon14.
103
Figure 4.7. Simulated recharge distribution in the NCP.
4.3.2. Impact of Paleo-hydrologic Conditions on Age Simulation
The large discrepancies between simulated and measured ages in the coastal plain are
attributed to the assumption of steady-state flow. The conclusion that the period when the
groundwater in the third aquifer unit received recharge was the last glacial period has been
confirmed by isotopic studies (Chen et al., 2003). It means that the groundwater ages in the third
aquifer unit had been affected by the flow conditions in the last glacial period. At the peak of the
last glacial period, approximately 18,000 years ago the sea level was 150 m below its present

104
level in eastern China (Ren, 2006) and the shoreline was 150-180 km east of its present location.
These conditions allow higher groundwater velocities than present. To evaluate the effect of the
paleo-flow condition on the groundwater age distribution, a simple two steady-state flow
modeling method similar to the study of Sanford et al. (1996) is used. Two steady-state flow
simulations were first made to represent the flow condition 10,000 years ago and that from
10,000 years ago to present. The simulated age distribution in the third aquifer unit (model layer
2) is plotted together with the residuals between corrected 14C ages and simulated mean ages in
Figure 4.9. Although positive residuals, i.e., underestimation, still occur in the piedmont area, the
discrepancy between corrected 14C age and simulated mean age are slightly reduced in the
coastal plain.
4.3.3. Water Budget of the Deep Groundwater
The main water budget terms for the deep aquifer zone under the brackish water zone is
shown in Table 4.3 and Figure 4.10. Both the lateral recharge and leakage from the shallow
aquifer zone show an increasing trend with the development of the deep groundwater. The
lateral recharge increased from ~0.4 km3/yr in 1970s to ~0.5 km3/yr in 2000s, which account for
only 13-20% of the pumpage. The low percentage of lateral recharge contributing to the water
for pumpage is consistent with the results of the previous water balance evaluation for the Hebei
Plain (Chen et al., 1992; Guo et al., 1995; Chen, 1999). The leakage from the shallow aquifer
zone increased by ~2.0 km3 and accounted for 62-85% of the pumpage. The elastic storage
release only contributed ~7% of the pumpage.
In this study, the inelastic storage release related to land subsidence was not simulated,
which can account for 20–40% of the pumpage (Guo et al., 1995; Wang and Li, 2004). By the
end of 2005, the area with cumulative land subsidence greater than 0.5, 1.0, and 2.0 m is 33,400,
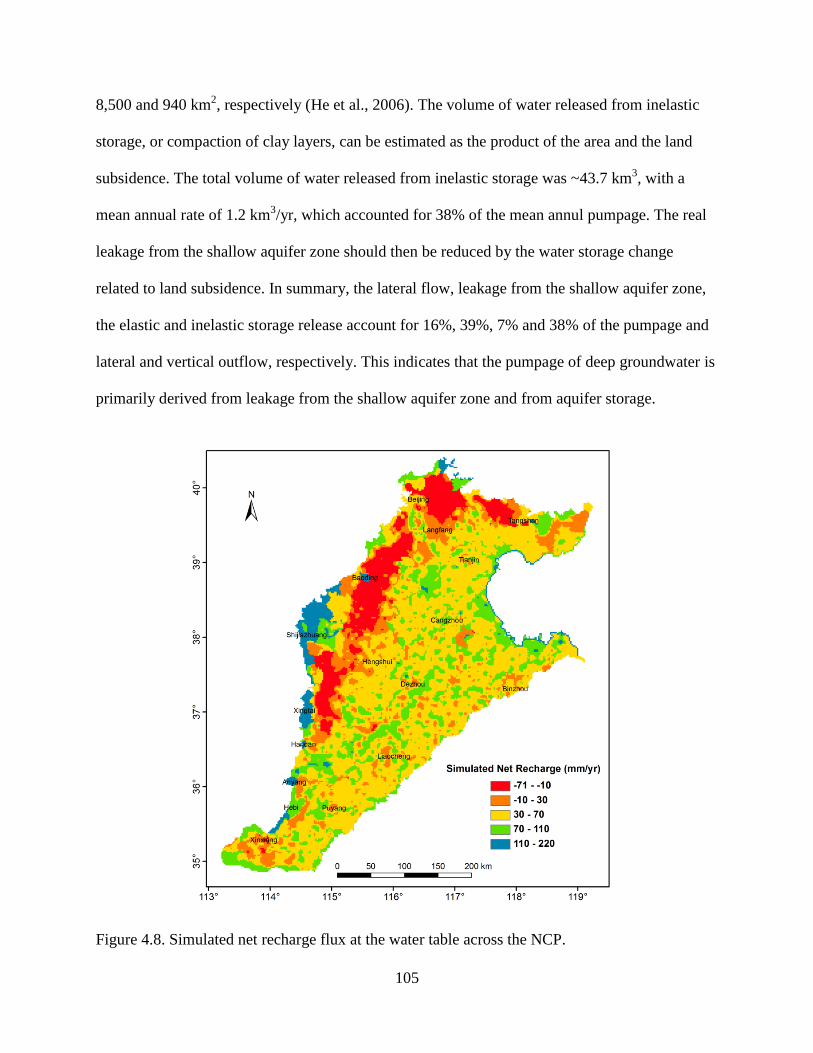
105
8,500 and 940 km2, respectively (He et al., 2006). The volume of water released from inelastic
storage, or compaction of clay layers, can be estimated as the product of the area and the land
subsidence. The total volume of water released from inelastic storage was ~43.7 km3, with a
mean annual rate of 1.2 km3/yr, which accounted for 38% of the mean annul pumpage. The real
leakage from the shallow aquifer zone should then be reduced by the water storage change
related to land subsidence. In summary, the lateral flow, leakage from the shallow aquifer zone,
the elastic and inelastic storage release account for 16%, 39%, 7% and 38% of the pumpage and
lateral and vertical outflow, respectively. This indicates that the pumpage of deep groundwater is
primarily derived from leakage from the shallow aquifer zone and from aquifer storage.
Figure 4.8. Simulated net recharge flux at the water table across the NCP.
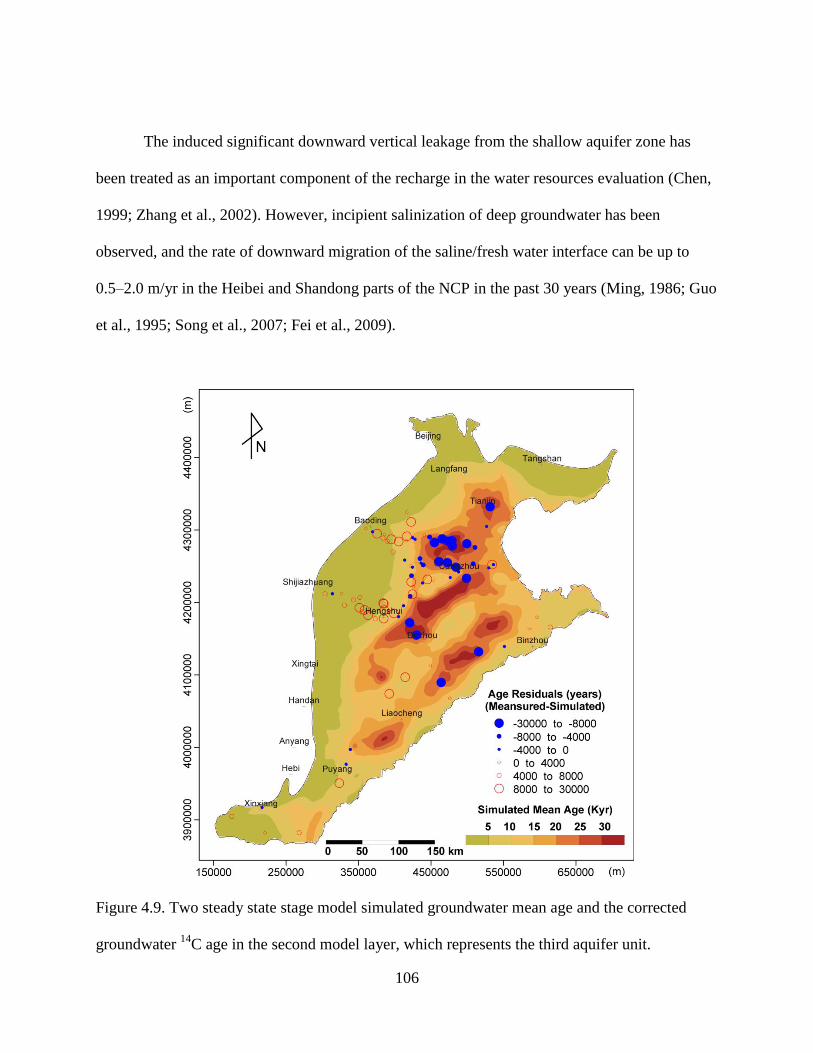
106
The induced significant downward vertical leakage from the shallow aquifer zone has
been treated as an important component of the recharge in the water resources evaluation (Chen,
1999; Zhang et al., 2002). However, incipient salinization of deep groundwater has been
observed, and the rate of downward migration of the saline/fresh water interface can be up to
0.5–2.0 m/yr in the Heibei and Shandong parts of the NCP in the past 30 years (Ming, 1986; Guo
et al., 1995; Song et al., 2007; Fei et al., 2009).
Figure 4.9. Two steady state stage model simulated groundwater mean age and the corrected
groundwater 14
C age in the second model layer, which represents the third aquifer unit.
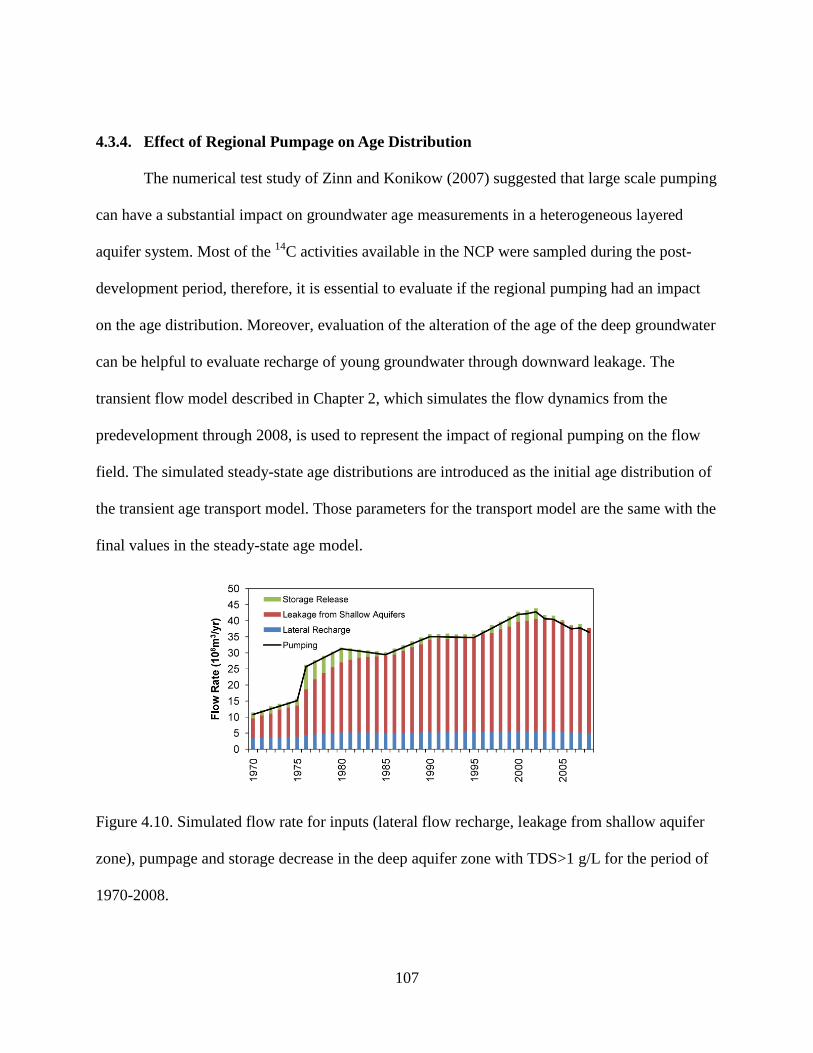
107
4.3.4. Effect of Regional Pumpage on Age Distribution
The numerical test study of Zinn and Konikow (2007) suggested that large scale pumping
can have a substantial impact on groundwater age measurements in a heterogeneous layered
aquifer system. Most of the 14C activities available in the NCP were sampled during the post-
development period, therefore, it is essential to evaluate if the regional pumping had an impact
on the age distribution. Moreover, evaluation of the alteration of the age of the deep groundwater
can be helpful to evaluate recharge of young groundwater through downward leakage. The
transient flow model described in Chapter 2, which simulates the flow dynamics from the
predevelopment through 2008, is used to represent the impact of regional pumping on the flow
field. The simulated steady-state age distributions are introduced as the initial age distribution of
the transient age transport model. Those parameters for the transport model are the same with the
final values in the steady-state age model.
Figure 4.10. Simulated flow rate for inputs (lateral flow recharge, leakage from shallow aquifer
zone), pumpage and storage decrease in the deep aquifer zone with TDS>1 g/L for the period of
1970-2008.
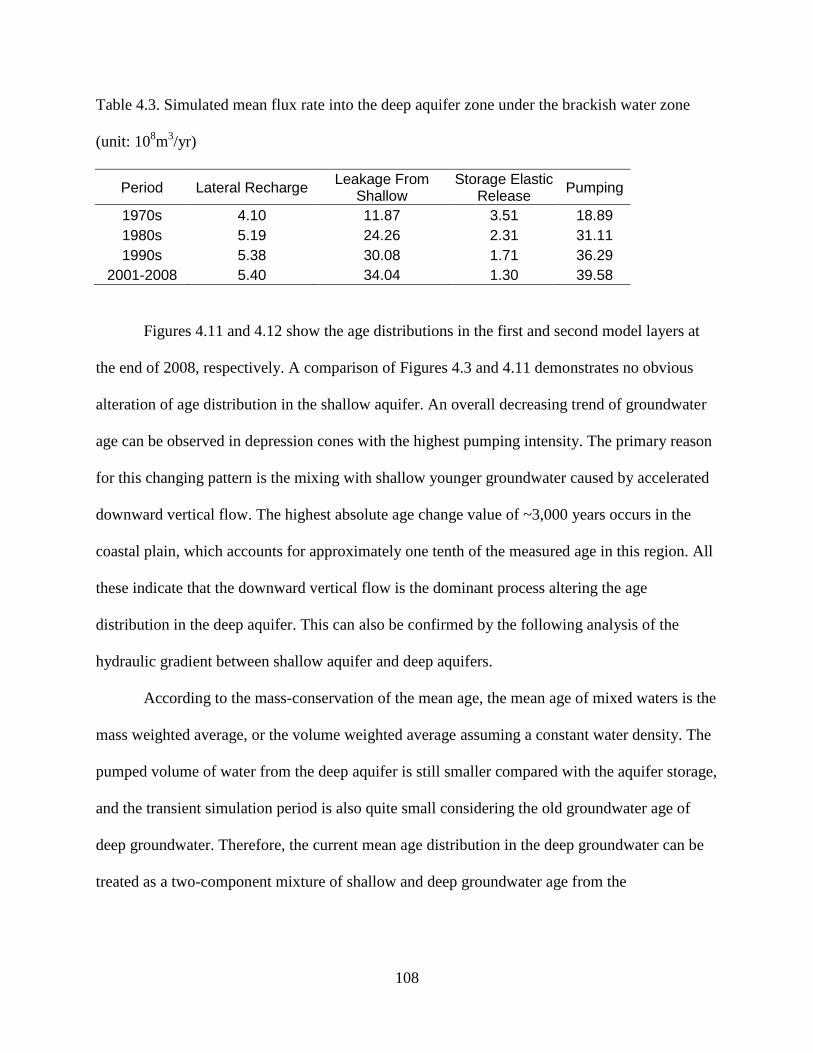
108
Table 4.3. Simulated mean flux rate into the deep aquifer zone under the brackish water zone
(unit: 108m
3/yr)
Period Lateral Recharge Leakage From
Shallow Storage Elastic
Release Pumping
1970s 4.10 11.87 3.51 18.89
1980s 5.19 24.26 2.31 31.11
1990s 5.38 30.08 1.71 36.29
2001-2008 5.40 34.04 1.30 39.58
Figures 4.11 and 4.12 show the age distributions in the first and second model layers at
the end of 2008, respectively. A comparison of Figures 4.3 and 4.11 demonstrates no obvious
alteration of age distribution in the shallow aquifer. An overall decreasing trend of groundwater
age can be observed in depression cones with the highest pumping intensity. The primary reason
for this changing pattern is the mixing with shallow younger groundwater caused by accelerated
downward vertical flow. The highest absolute age change value of ~3,000 years occurs in the
coastal plain, which accounts for approximately one tenth of the measured age in this region. All
these indicate that the downward vertical flow is the dominant process altering the age
distribution in the deep aquifer. This can also be confirmed by the following analysis of the
hydraulic gradient between shallow aquifer and deep aquifers.
According to the mass-conservation of the mean age, the mean age of mixed waters is the
mass weighted average, or the volume weighted average assuming a constant water density. The
pumped volume of water from the deep aquifer is still smaller compared with the aquifer storage,
and the transient simulation period is also quite small considering the old groundwater age of
deep groundwater. Therefore, the current mean age distribution in the deep groundwater can be
treated as a two-component mixture of shallow and deep groundwater age from the

109
predevelopment condition, assuming that the age mass extracted by pumping and produced in the
simulation period can be ignored, as follows:
(1 )DC SP DPA A A (4.4)
where ADC is the current age of the deep groundwater, ASP and ADP are the predevelopment
groundwater age of the shallow and deep groundwaters, respectively. is the volume mixing
ratio of shallow groundwater, defined as the ratio of volume of mixed shallow groundwater to
the volume of the deep groundwater.
Figure 4.11. Simulated mean age distribution in the end of 2008 in the shallow aquifer zone.
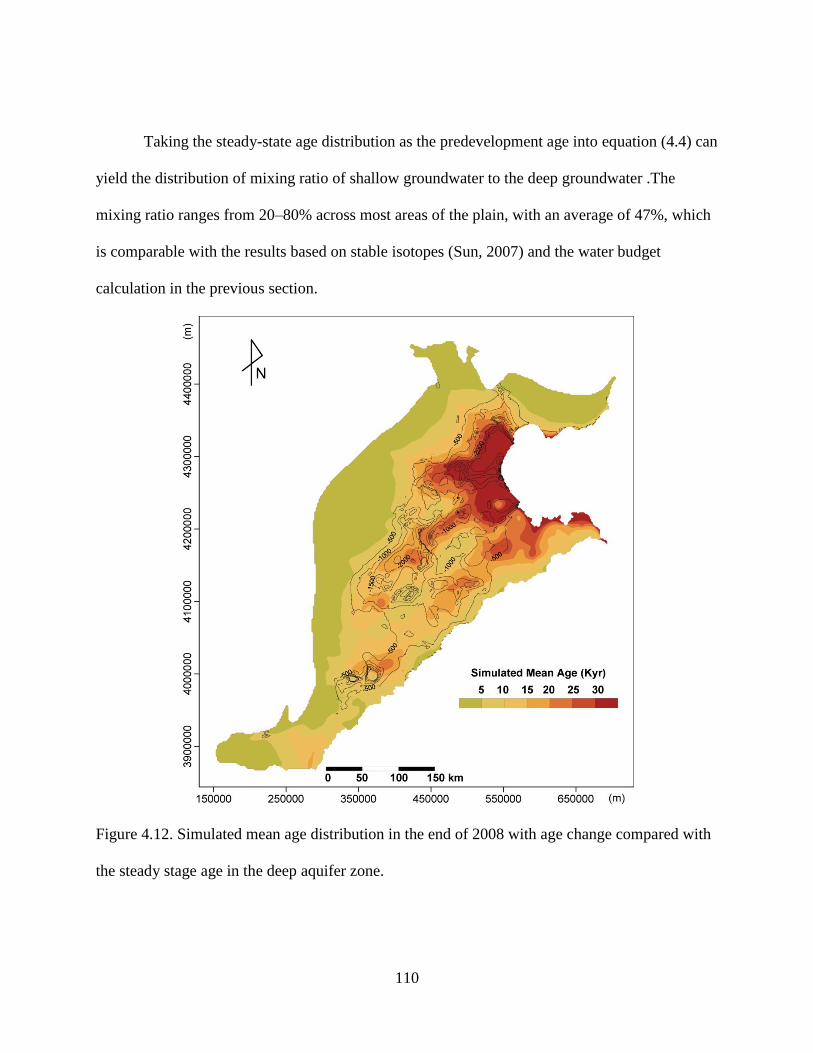
110
Taking the steady-state age distribution as the predevelopment age into equation (4.4) can
yield the distribution of mixing ratio of shallow groundwater to the deep groundwater .The
mixing ratio ranges from 20–80% across most areas of the plain, with an average of 47%, which
is comparable with the results based on stable isotopes (Sun, 2007) and the water budget
calculation in the previous section.
Figure 4.12. Simulated mean age distribution in the end of 2008 with age change compared with
the steady stage age in the deep aquifer zone.

111
4.3.5. Flow Regime Under Natural Conditions and Excessive Exploitation
The water table contours for the shallow aquifer and water level contours map for the
deep aquifer under natural conditions suggest a possible regional flow path from the west
mountain front toward the east coastal plain. The increasing trend of isotopic ages from the
piedmont area toward the coastal plain in the deep aquifer also yields such a plausible flow path
(Zhang et al., 1987; Zhang et al., 1997; Chen et al., 2005). Our flow paths simulation does not
show the existence of such regional flow paths (Figure 4.13a). The flow paths starting from the
west mountain front end in the junction zone between the piedmont plain and the central plain,
which is also the zone where both lithology and thickness of the aquifers begin to change. The
flowpaths starting from the recharge zone ends in the central and coastal plains only along
southwest-northeast direction. This is consistent with the distribution pattern of paleochannels in
the central flood plain (Wu et al., 1996). This indicates that the primary lateral recharge source of
the deep groundwater in the central and coastal plains is groundwater from the southwest part of
the plain. With the current pumping situation, the lateral travel distance of the flow paths has
been reduced dramatically, and the flow paths become more vertical (Figure 4.13b).
Vertical gradients in the hydraulic head provide useful information on the vertical flow
direction of groundwater. Selected wells along the flow paths from the piedmont area to the
coastal plain show a similar pattern of downward gradient (Figure 4.14). Hydraulic gradients
plotted in Figure 4.14 were calculated as the difference in water level between shallow and deep
screens, or between adjacent shallow and deep well pairs, divided by the vertical distance
between the well screen midpoints. Positive gradients indicate the potential for downward water
movement in the aquifer. Small gradient is observed in the piedmont area (Figure 4.14a),
suggesting an effective connection between the shallow and deep aquifer layers. All other

112
locations in the central plain and coastal plain shows an increasing trend of positive vertical
gradients (Figure 4.14b, c and d). Based on the water level contours in 2001, the horizontal
hydraulic gradient in the shallow aquifer in the central and coastal plains is generally 0.1%,
which is smaller than the vertical hydraulic gradient between the shallow aquifer and the deep
aquifer. The larger vertical hydraulic gradient indicates that vertical flow has become the
dominant process controlling the flow pattern in the deep aquifer.
Figure 4.13. Forward tracked advective flow paths starting from selected locations for (a)
predevelopment and (b) post-development condition. Colors change with travel time along each
flow pathline, beginning with blue at start point and changing to red at advective travel time
greater than 10,000 years.
4.3.6. Model Limitation and Future Studies
This study simulated the mean age distribution in the North China Plain, and compared
the simulated age and measured 14C age. Furthermore, a two-step steady-state flow model is used
to evaluate the effect of paleo-hydrologic conditions on the age simulation. To simulate the age
113
evolution more realistically, a transient flow model which can represent actual paleo-conditions
may be constructed in future study. The groundwater age based on 14C shows a significant
increasing trend with depth (Figure 4.2). However, due to limited availability of data, the current
model only contains three model layers to represent the aquifer system, which is more complex
than a three-layer system. The mixing of younger groundwater from the upper aquifers with
older groundwater should be evaluated by a model with a fine vertical grid resolution in future
studies.
4.4. Sustainability of Deep Groundwater and Responses
The effects of spatial variations in hydrogeologic parameters on the simulated recharge
locations, flow paths and groundwater age indicate the relative importance of the geologic
characteristics on flow patterns under natural conditions. Natural predevelopment hydraulic
gradients were generated by the relative flat topography across the plain. The human impact on
both the shallow and deep flow systems is greater than any geologic control. Both the horizontal
and vertical hydraulic gradients have been enhanced by pumping, causing the flowpaths to be
more vertical and more locally variable.
Sustainability of the deep groundwater depends primarily on the recharge sources and
flow paths. The simulated steady-state age, flow paths and response to regional pumping
demonstrate different recharge regimes of the shallow and deep aquifer units. The shallow
aquifer receives direct recharge from precipitation and lateral recharge from mountain areas.
Spatially distributed recharge and vertical flow are the dominant process shaping the age
distribution in the unconfined aquifer.

114
The recharge regime for the deep aquifer is different in distinct hydrogeological units,
and has been altered by extensive pumping. Under natural conditions, the deep water is refreshed
through vertical flow in the piedmont area. However, due to the large difference of hydraulic
conductivity between the alluvial fans and central plain, the lateral flow from the piedmont area
to the central plain is limited. The primary discharge means for the deep groundwater in this
region should be the upward flow to the shallow aquifer, and then uptake by evapotranspiration
and leakage to rivers. This has been demonstrated by the simulated net recharge flux in natural
conditions and the flow paths analysis. The main lateral recharge flux may be from the southwest
recharge zone along the SW-NE oriented flow paths. Under developed conditions, due to
extensive pumping in the shallow aquifer in the piedmont area, the downward vertical gradient is
small, and the amount of shallow groundwater which vertically flows into the deep aquifer is
limited. The primary replenishment source of deep groundwater in the middle and coastal plains
is the downward vertical flow from the shallow aquifer zone, and maybe the upward vertical
flow from much deeper aquifers.
Several water resources management strategies focusing attention on deep groundwater
depletion had been proposed or carried out (Duan and Xiao, 2003; Foster et al., 2004; Zhang et
al., 2009). Among these strategies, utilization of shallow brackish water for irrigation is thought
to be the measure with significant potential for reducing deep groundwater abstraction (Fang et
al., 2003; Zhang et al., 2004). Considerable experimental studies on using brackish water for
irrigation have been carried out since 1970s (Fang and Chen, 1999). In the Hebei Plain, the
current brackish water withdrawal is ~0.3 km3/yr, which accounts only 25% of the total recharge
in the brackish water zone (Zhang et al., 2004). The utilization of brackish water should continue
to be encouraged as an alternative to extraction the deep fresh groundwater.

115
Figure 4.14. Vertical hydraulic gradient at selected sites from (a) Zhengding in the piedmont area,
(b) Hengshui and (c) Nanpi in the central alluvial plain to (d) Huanghua in the coastal plain.
Water levels measuring depths are given in parenthesis.
116
4.5. Conclusions
The major findings of this study are summarized as follows:
(1) Groundwater in the shallow aquifer of the NCP receives direct recharge from
precipitation and irrigation, and has a higher renewability potential as characterized by younger
groundwater age. In the deep aquifer below the central and coastal plains, there exists water
recharged during the last glacial period with a limited renewability potential.
(2) The old age of groundwater in the middle and coastal plains does not lend support to
the hypothesis of the existence of regional flow paths from the west piedmont area to the central
and coastal plains. Lateral flow recharge to the deep aquifer is primarily from the southwest part
of the plain, and is enhanced by groundwater pumping.
(3) The extensive groundwater withdrawal had a significant influence on the
hydrogeology of the NCP flow system. Widely distributed recharge and vertical flow are the
dominant process shaping the flow pattern in both the shallow and deep aquifers in the NCP.
(4) Under overexploitation conditions, groundwater pumped from the productive deep
aquifer is primarily replenished by the enhanced downward leakage from the shallow aquifer and
also from depletion of elastic and inelastic aquifer storage.
Acknowledgements
This work was supported by the National Basic Research Program of China (grant
#2006CB403404) and National Natural Science Foundation of China (grant #40911130505). We
appreciate the data support from China Geological Survey and China Institute of Water
Resources and Hydropower Research.

117
References
Amin, I.E., and M.E. Campana. 1996. A general lumped parameter model for the interpretation
of tracer data and transit time calculation in hydrologic systems. Journal of Hydrology 179,
no. 1-4: 1-21.
Bethke, C.M., and T.M. Johnson. 2002a. Ground water age. Ground Water 40, no. 4: 337-339.
Bethke, C.M., and T.M. Johnson. 2002b. Paradox of groundwater age. Geological Society of
America 30, no. 2: 107-110.
Cornaton, F., and P. Perrochet. 2006. Groundwater age, life expectancy and transit time
distributions in advective—Dispersive systems: 1. Generalized reservoir theory. Advances in
Water Resources 29, no. 9: 1267-1291.
Chen, N., X. Zhao, Y. Zang, D. Zhang, and L. Yang. 1992. Development of deep groundwater in
the Heilonggang Plain. Water Resources and Hydropower Engineering 5: 35-40. (in Chinese)
Chen, W. 1999. Groundwater in Hebei Province. Beijing: Seismological Press (in Chinese).
Chen, Z. 2001. Groundwater resources evolution based on paleo-environmental information
from groundwater system in the North China Plain. Dissertation, Jilin University.
Chen, Z.Y., J.X. Qi, J.M. Xu, J.M. Xu, H. Ye, and Y.J. Nan. 2003. Paleoclimatic interpretation
of the past 30 ka from isotopic studies of the deep confined aquifer of the North China plain.
Applied Geochemistry 18, no. 7: 997-1009.
Chen, Z.Y., Z.L. Nie, Z.J. Zhang, J.X. Qi, and Y.J. Nan. 2005. Isotopes and sustainability of
ground water resources, North China Plain. Ground Water 43, no. 4: 485-493.
Chen, Z., H. Gao, W. Wei, J. Chen, F. Zhang, and Y. Wang. 2009. Groundwater Renewal and
Characteristics in the Deep Confined Aquifer in North China Plain. Resources Science 31, no.
3: 388-393. (in Chinese with English abstract)
Clark, I.D., and P. Fritz. 1997. Environmental isotopes in hydrogeology, CRC Press.
Crosbie, R.S., P. Binning, and J.D. Kalma. 2005. A time series approach to inferring
groundwater recharge using the water table fluctuation method. Water Resources Research 41,
no. 1:1 -9.
Doherty, J. 2003. Version 5 of PEST Manual. Watermark Numerical Computing, Brisbane
Australia. Downloadable from: http://www. sspa. com/pest.
Dong, Y., M. He, S. Jiang, S. Wu, and S. Jiang. 2002. Chlorine-36 Age Study for Deep
Groundwater of Quaternary Sediments, Hebei Plain. Earth Science—Journal of China
University of Geosciences 27, no. 1: 105-109. (in Chinese with English abstract)
118
Duan, Y., and G. Xiao. 2003. Sustainable utilization of groundwater resources in Hebie Plain.
Hydrogeology and Engineering Geology 30, no. 1: 2-8. (in Chinese with English abstract)
Fang, S., X. Chen, and T.M. Boers. 2003. Sustainable Utilization of Water Resources in The
Eastern Part of The North China Plain. Water Resources Planning and Design 4: 24-31. (in
Chinese with English abstract)
Fei, Y., Z. Zhang, H. Song, Y. Qain, J. Chen, and S. Meng. 2009. Discussion of vertical
variations of saline groundwater and mechanism in North China Plain. Water Resources
Protection 25, no. 6: 21-23. (in Chinese with English abstract)
Ginn, T.R. 1999. On the distribution of multicomponent mixtures over generalized exposure time
in subsurface flow and reactive transport: Foundations, and formulations for groundwater age,
chemical heterogeneity, and biodegradation. Water Resources Research 35, no. 5: 1395-1407.
Ginn, T.R., H. Haeri, A. Massoudieh, and L. Foglia. 2009. Notes on Groundwater Age in
Forward and Inverse Modeling. Transport in Porous Media 79, no. 1: 117-134.
Goode, D.J. 1996. Direct simulation of groundwater age. Water Resources Research 32, no. 2:
289-296.
Gu, Y., S.Z. Nanjing, and Z. Zhong. 1995. The property of deep-lying groundwater resources
in Hebei plain and its reasonable evaluation in view of land subsidence. Journal of China
Univeristy of Geosciences 20, no. 4: 415-420. (in Chinese with English abstract)
Guo, Y., Z. Shen, and Z. Zhong. 1995. Relathionship between saline water downgoing and
shallow water desalinization in the Hebei Plain. Hydrogeology & Engineering Geology 2: 8-
12. (in Chinese with English abstract)
Engesgaard, P., and J. Molson. 1998. Direct simulation of ground water age in the Rabis Creek
Aquifer, Denmark. Ground Water 36, no. 4: 577-582.
Harbaugh, A.W., E.R. Banta, M.C. Hill, and M.G. McDonald. 2000. MODFLOW-2000, the u. S.
Geological survey modular ground-water model-user guide to modularization concepts and
the ground-water flow process. U.S. Geological Survey Open-File Report 00-92.
Harbaugh, A.W. 1990. A computer program for calculating subregional water budgets using
results from the U.S. geological survey modular three-dimensional finite-difference ground-
water flow model. U.S. Geological Survey Open-File Report 90-392.
He, Q., W. Liu, and Z. Li. 2006. Land Subsidence Survey and Monitoring in the North China
Plain. Geological Journal of China Universities 12, no. 2: 195-209. (in Chinese with English
abstract)
Hunt, R.J., D.E. Prudic, J.F. Walker, and M.P. Anderson. 2008. Importance of unsaturated zone
flow for simulating recharge in a humid climate. Ground Water 46, no. 4: 551-560.
Kazemi, G.A., J.H. Lehr, and P. Perrochet. 2006. Groundwater age, Wiley-Interscience.

119
Kendy, E., P. Gérard-Marchant, M.T. Walter, Y. Zhang, C. Liu, and T.S. Steenhuis. 2003. A
soil-water-balance approach to quantify groundwater recharge from irrigated cropland in the
North China Plain. Hydrological Processes 17, no. 10: 2011-2031.
Lemieux, J.M., and E.A. Sudicky. 2010. Simulation of groundwater age evolution during the
Wisconsinian glaciation over the Canadian landscape. Environmental Fluid Mechanics 10, no.
1-2: 91-102.
Liu, C., and Z. Wei. 1989. Agricultural Hydrology and Water Resources in the North China
Plain. Beijing: Science Press. (in Chinese with English abstract)
Liu, C., P. Wang, L. Zhou, S. Jiang, S. Jiang, H. Guo, and L. Huang. 1993. Cl dating of
quaternary groundwater in Hebei Plain. Hydrogeology and Engineering Geology 6: 35-38. (in
Chinese)
Lu, X., M. Jin, M.T. van Genuchten, and B. Wang. 2011. Groundwater Recharge at Five
Representative Sites in the Hebei Plain, China. Ground Water 49, no. 2: 286-294.
Ming, M. 1986. Salinization of deep groundwater in Hengshui. Hydrogeology & Engineering
Geology 5: 42-44 (in Chinese).
Newman, B.D., K. Osenbruck, W. Aeschbach-Hertig, S.D. Kip, P. Cook, K. Rozanski, and R.
Kipfer. 2010. Dating of'young'groundwaters using environmental tracers: advantages,
applications, and research needs. Isotopes In Environmental And Health Studies 46, no. 3:
259.
Pearson, F.J., and B.B. Hanshaw. 1970. Sources of dissolved carbonate species in ground-water
and their effects on carbon-14 dating. In: IAEA (Editor), Isotope Hydrology 1970. IAEA,
Vienna, pp. 271–285.
Pint, C.D., R.J. Hunt, and M.P. Anderson. 2003. Flowpath Delineation and Ground Water Age,
Allequash Basin, Wisconsin. Ground Water 41, no. 7: 895-902.
Pollock, D.W. 1994. User's Guide for MODPATH/MODPATH-PLOT, Version 3: A particle
tracking post-processing package for MODFLOW, the U.S. Geological Survey finite-
difference ground-water flow model. U.S. Geological Survey Open-File Report 94, no. 464: 6.
Ren, M. Sediment Discharge of the Yellow River, China: Past, Present and Future—A Synthesis.
Advances in Earth Science 21, no. 6: 551-563. (in Chinese)
Richter, J., P. Szymczak, T. Abraham, and H. Jordan. 1993. Use of combinations of lumped-
parameter models to interpret groundwater isotopic data. Journal of Contaminant Hydrology
14, no. 1: 1-13.
Sturchio, N.C., X. Du, R. Purtschert, et al. 2004. One million year old groundwater in the Sahara
revealed by krypton-81 and chlorine-36. Geophysical Research Letters 31, L055035.

120
Smethie, W.M., D.K. Solomon, S.L. Schiff, and G.G. Mathieu. 1992. Tracing groundwater-flow
in the borden aquifer using Kr-85. Journal of Hydrology 130, no. 1-4: 279-297.
Sophocleous, M. 1992. Groundwater recharge estimation and regionalization: the Great Bend
Prairie of central Kansas and its recharge statistics. Journal of Hydrology 137, no. 1: 113-140.
Song, H., Z. Zhang, F. Fei, Z. Wang, Y. Qian, and W. Wei. 2007. Down-movement of the fresh-
saline groundwater interface in the middle of the Hebei Plain under the condition of
exploitation. Hydrogeology & Engineering Geology 1: 10-17. (in Chinese with English
abstract)
Song, X.F., S.Q. Wang, G.Q. Xiao, Z.M. Wang, X. Liu, and P. Wang. 2009. A study of soil
water movement combining soil water potential with stable isotopes at two sites of shallow
groundwater areas in the North China Plain. Hydrological Processes 23, no. 9: 1376-1388.
Sultan, M., N.C. Sturchio, H. Gheith, Y.A. Hady, and M. El Anbeawy. 2000. Chemical and
isotopic constraints on the origin of Wadi El-Tarfa ground water, Eastern Desert, Egypt.
Ground Water 38, no. 5: 743-751.
Sun, X. 2007. Sustainable utilization study of groundwater resources in Circum-Bohai-Sea
region. Dissertaiton, China Univerisy of Geosciences.
Varni, M., and J. Carrera. 1998. Simulation of groundwater age distributions. Water Resources
Research 34, no. 12: 3271-3281.
von Rohden, C., A. Kreuzer, Z. Chen, R. Kipfer, and W. Aeschbach-Hertig. 2010.
Characterizing the recharge regime of the strongly exploited aquifers of the North China
Plain by environmental tracers. Water Resources Research 46, no. 5: W5511.
Wang, J.B., and P. Li. 2004. Composition of groundwater resources in deep-seated aquifers
under the condition of land subsidence in Tianjin Plain. Hydrogeology and Engineering
Geology 5: 35-37. (in Chinese with English abstract)
Wu, J., A. Zhou, H. Cai, and X. LI. 2007. New understanding of 14C age of groundwater in the
Hebei plain. Hydrogeology & Engineering Geology 5: 39-44. (in Chinese with English
abstract)
Wu, C., Q.H. Xu, Y.H. Ma, and X.Q. Zhang. 1996. Palaeochannels on the North China Plain:
Palaeoriver geomorphology. Geomorphology 18, no. 1: 37-45.
Xu, Y., and H.E. Beekman. 2003. Groundwater recharge estimation in Southern Africa.
UNESCO IHP Series No. 64.
Zhang, Z., D. Shi, F. Ren, Z. Yin, J. Sun, and C. Zhang. 1997. Evolution of the Quanternary
Goundwater in the North China Plain. Science in China,Ser.D 2: 168-173. (in Chinese)
Zhang, G., Z. Chen, Y. Fei, and Z. Nie. 2001. Regional Distribution Characteristics of
Groundwater Isotopic Ages and Hydrogeological Chemical Types in the Plain of Haihe River
121
Basin. Bulletin of Mineralogy Petrology and Geochemistry 20, no. 4: 412-414. (in Chinese
with English abstract)
Zhang, G., and J. Wang. 2002. Mechanism of Confined Groundwater Recharge and Release in
the Middle-East Plain of Haihe River Basin. Hydrology 22, no. 3: 5-9. (in Chinese with
English abstract)
Zhang, G., Y. Fei, J. Shen, and L. Yang. 2007. Influence of unsaturated zone thickness on
precipitation infiltration for recharge of groundwater. Journal of Hydraulic Engineering 38,
no. 5: 611-617. (in Chinese with English abstract)
Zhang, G., Y. Fei, and K. Liu. 2004. Evolution of and countermeasure for the groundwater in the
Haihe Plain. Beijing: Science Press. (in Chinese)
Zhang, Z., G. Luo, Z. Wang, C. Liu, Y. LI, and X. Jiang. 2009. Study on Sustainable Utilization
of Groundwater in North China Plain. Resources Science 31, no. 3: 355-360. (in Chinese with
English abstract)
Zheng, C. and P.P. Wang, 1999, MT3DMS: A Modular Three-Dimensional Multispecies Model
for Simulation of Advection, Dispersion and Chemical Reactions of Contaminants in
Groundwater Systems; Documentation and User’s Guide, Contract Report SERDP-99-1, U.S.
Army Engineer Research and Development Center, Vicksburg, MS, 1999.
Zheng, C. 2010, MT3DMS v5.3 Supplemental user’s guide. Technical Report, Department of
geological sciences, University of Alabama, Tuscaloosa, Alabama.
Zhu, C. 2000. Estimate of recharge from radiocarbon dating of groundwater and numerical flow
and transport modeling. Water Resources Research 36, no. 9: 2607-2620.
Zoellmann, K., W. Kinzelbach, and C. Fulda. 2001. Environmental tracer transport (H-3 and SF6)
in the saturated and unsaturated zones and its use in nitrate pollution management. Journal of
Hydrology 240, no. 3-4: 187-205.

122
CHAPTER 5
CHAPTER 5
CONCLUDING REMARKS
This study represents a first attempt at a comprehensive assessment of the groundwater
recharge and sustainability in the North China Plain (NCP) from a basin-scale, process-based
modeling approach. Relying on multiple data sources including meteorological data, land use
data, aquifer water level data, soil property data, isotopic groundwater age data, this study yields
the spatial and temporal distributions of groundwater recharge between 1993 and 2008 through
variably saturated flow modeling, flow budget and flow path analysis, and direct groundwater
age simulation. This information provides the basis for quantitative evaluation of the long-term
sustainability of groundwater resources in the NCP.
The mathematical models developed in this study include a regional soil-water balance
model, a regional variably saturated flow model that couples one-dimensional vertical
unsaturated flow with three-dimensional saturated flow, and a regional three-dimensional flow
and transport model calibrated with hydraulic heads and isotopic groundwater age data. These
models are used to evaluate the groundwater recharge process from different perspectives and to
provide comparison and consistency check between the results from different models. The
outcome is a comprehensive picture and improved understanding of the groundwater recharge
process and overall flow system dynamics in the NCP.
The model-calculated recharge rates are in reasonably good agreement with those from
field-based experimental studies at local scales. Although the climatic condition is still the
primary factor controlling the recharge distribution for the shallow groundwater, the recharge
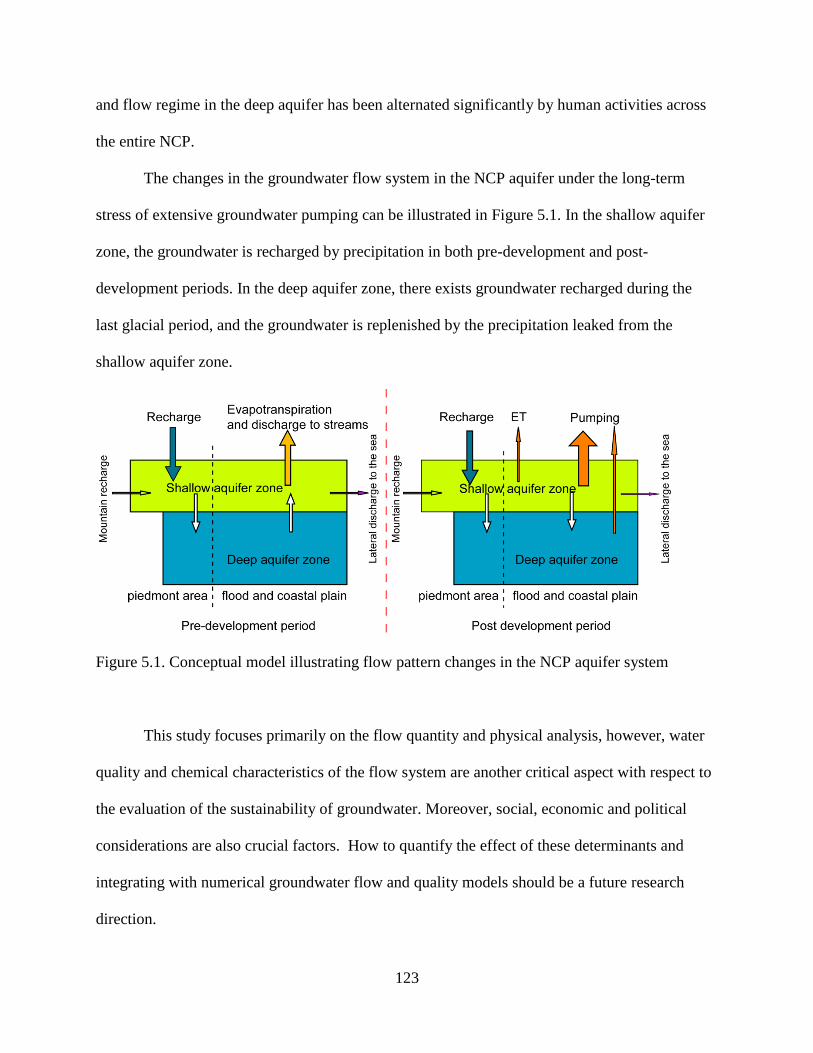
123
and flow regime in the deep aquifer has been alternated significantly by human activities across
the entire NCP.
The changes in the groundwater flow system in the NCP aquifer under the long-term
stress of extensive groundwater pumping can be illustrated in Figure 5.1. In the shallow aquifer
zone, the groundwater is recharged by precipitation in both pre-development and post-
development periods. In the deep aquifer zone, there exists groundwater recharged during the
last glacial period, and the groundwater is replenished by the precipitation leaked from the
shallow aquifer zone.
Figure 5.1. Conceptual model illustrating flow pattern changes in the NCP aquifer system
This study focuses primarily on the flow quantity and physical analysis, however, water
quality and chemical characteristics of the flow system are another critical aspect with respect to
the evaluation of the sustainability of groundwater. Moreover, social, economic and political
considerations are also crucial factors. How to quantify the effect of these determinants and
integrating with numerical groundwater flow and quality models should be a future research
direction.

124
Although reducing irrigated acreage and changing the land use and crop system to
dryland farming has the most significant potential in reducing groundwater overuse, whether it is
applicable is still in doubt because of the current food security policies in China. The main
applicable strategies towards sustainable groundwater development in the NCP include:
groundwater recharge enhancement with excess surface runoff, improvement of the efficiency of
irrigation system and water use efficiency, utilization of brackish groundwater water for
irrigation, desalination of seawater for industrial and domestic water use in coastal cities, and
conjunctive use of groundwater and surface water from water transfer projects.