recession 2008: what will be the montana impacts? paul e. polzin the bureau of business and economic...
TRANSCRIPT

Recession 2008:
What Will be the Montana Impacts?
Paul E. PolzinPaul E. PolzinThe Bureau of Business and Economic Research, The Bureau of Business and Economic Research, The University of Montana-MissoulaThe University of Montana-Missoula

What Caused the 2008 Recession?
• House price bubble bursts
• Rising interest rates lead to mortgage defaults
• Credit crunch. Flight to quality
• $100/barrel oil

Foreclosure Activity- November 2007
Source: www.realitytrac.com
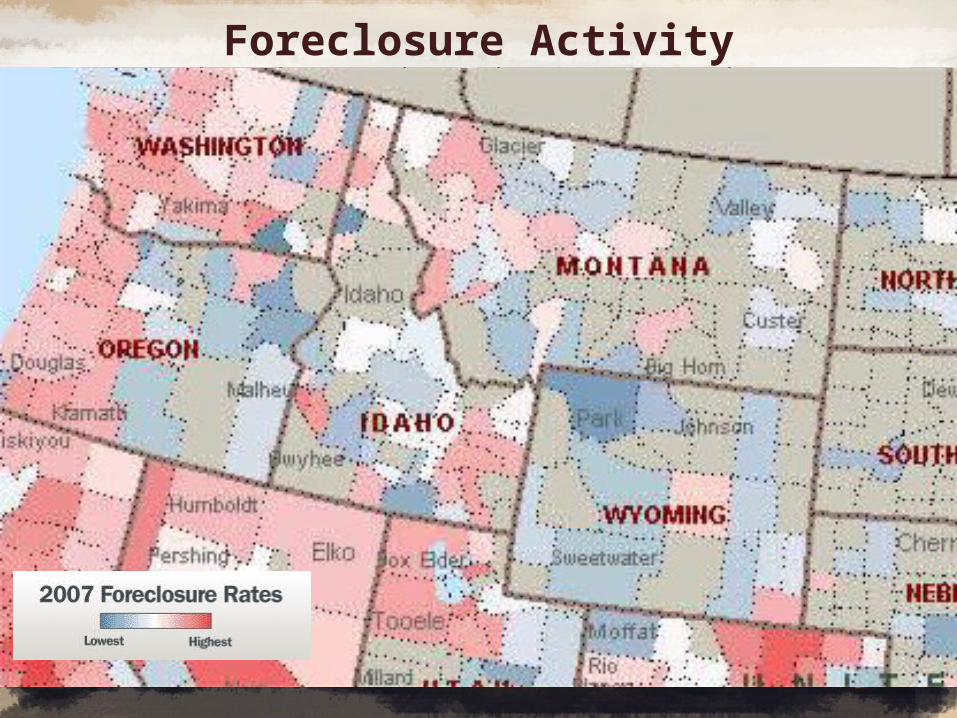
Foreclosure Activity

0
5
10
15
20
25
30
'98
'99
'00
'01
'02
'03
'04
'05
'06
'07
Index of Single-Family Home Prices,
Annual Percent Change
U.S.
MONTANA
OREGON
WASHINGTON
Source: U.S. Office of Federal Housing Oversight

• Nonresident Travel• Mining• Manufacturing
-Wood and paper• Agriculture
Federal Gov’t (Incl. Military)
90%90%
Montana’s Economic Base

U.S. Industries Likely to be Impacted by 2008 Slowdown/Recession
-Financial Services
-Durable manufacturing
-Automobiles
-Home building (wood products)
-Construction

0123456789
10
'05 '06 '07 '08 '09 '10 '11
Actual Projected
Actual and Projected Change in Nonfarm Labor Income, Montana, 2005-2011
4.4
5.9
4.54.1 4.0 4.14.0

Causes of Montana’s Boom• Mining / oil and gas. High commodity / energy
prices
• Manufacturing. High-tech recovery, oil refinery upgrades
• Nonresident travel- steady two percent growth
• Federal government. Post Sept. 11 homeland security
• Agriculture. $8/bushel wheat
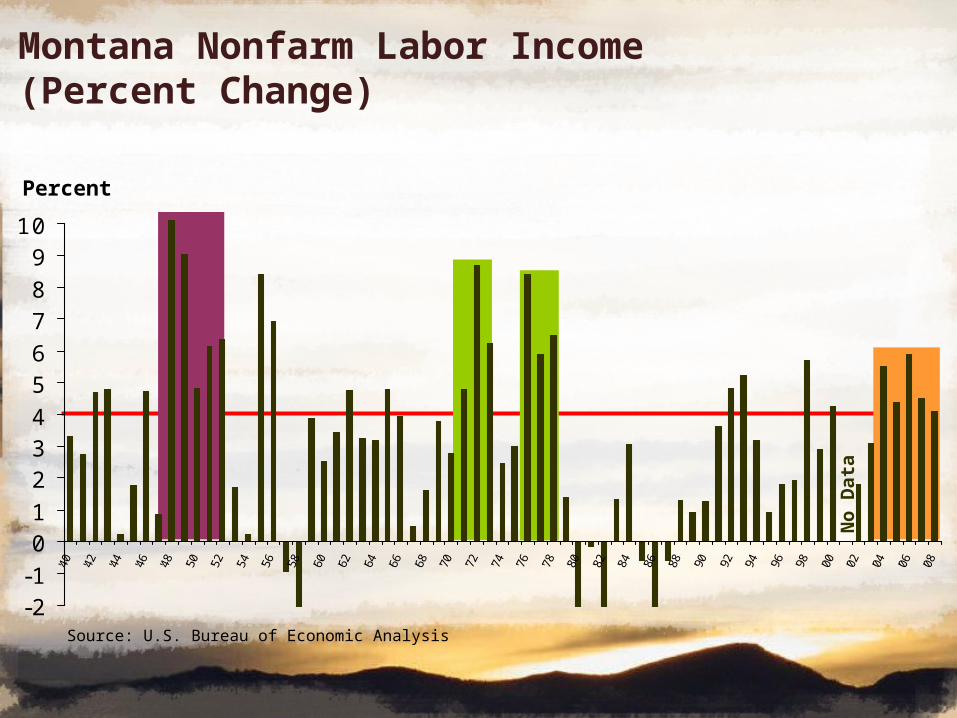
Percent
No D
ata
Montana Nonfarm Labor Income (Percent Change)
Source: U.S. Bureau of Economic Analysis
-2-10123456789
10
'40
'42
'44
'46
'48
'50
'52
'54
'56
'58
'60
'62
'64
'66
'68
'70
'72
'74
'76
'78
'80
'82
'84
'86
'88
'90
'92
'94
'96
'98
'00
'02
'04
'06
'08

75
125
175
225
275
325
375
425475
525
575
2003 2004 2005 2006 2007
Oil Zinc
LeadCopper
Index
Wheat
Source: International Monetary Fund.
Commodity Prices

1990-2005 2006 2007f 2008f
WTI Oil ($/barrel)
26 66 66 60
Nymex Natural Gas ($/mmbtu)
3.32 6.99 7.50 8.00
Copper ($/lb) 1.01 3.05 2.70 2.25
Zinc ($/lb) .50 1.49 2.00 1.40
Nickel ($/lb) 3.64 11.00 13.50 18-20.00
Source: Scotiabank Commodity Price Index.
60
7.65
3.10
1.70
20.00
69
6.95
3.30
1.52
17.35
70
6.95
2.95
1.35
13.50-14.50
Commodity Price Forecasts

0
1
2
3
4
5
6
7
8
Source: World Bank
Developing Countries
Developed Countries
World GDP (Percent Change)

0
5
10
15
20
25
30
35
40
45
50
Percent manufacturing
China
MalaysiaIndonesia South Korea
IndiaU.S.
Percent Manufacturing
Source: Economist
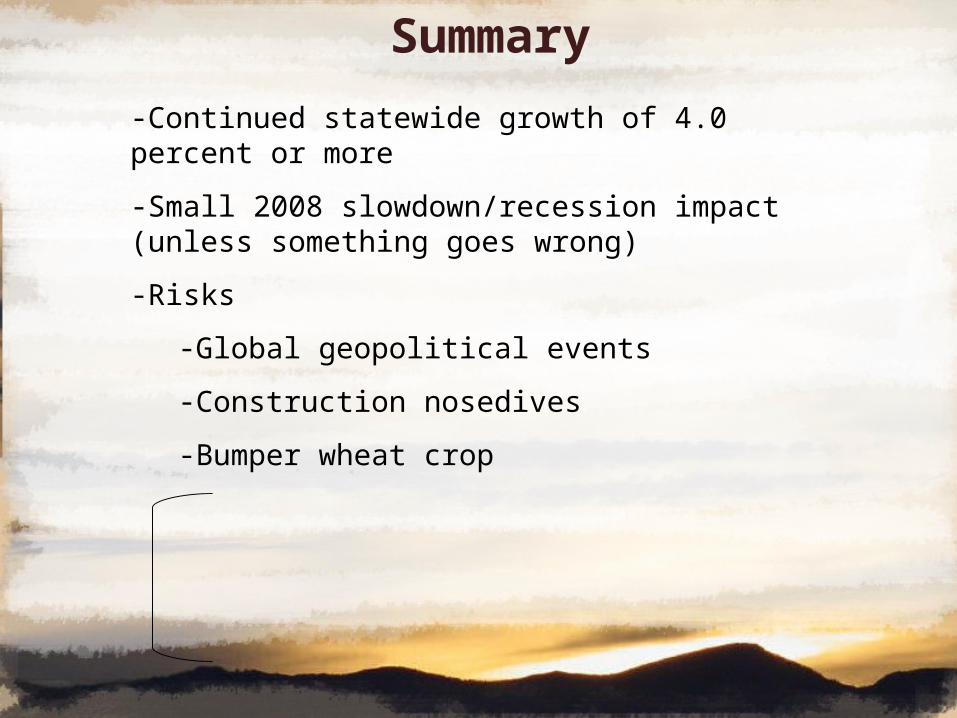
Summary
-Continued statewide growth of 4.0 percent or more
-Small 2008 slowdown/recession impact (unless something goes wrong)
-Risks
-Global geopolitical events
-Construction nosedives
-Bumper wheat crop
A Final Montana Impact
• Montana tax revenues– Dividends, interest and rents– Capital gains– Corporate profits

QUESTIONS?