receptor design and extraction of inorganic fluoride ion … · · 2011-05-31central salt and...
TRANSCRIPT

1
Supplementary information
Receptor Design and Extraction of Inorganic Fluoride Ion from Aqueous Solution
Priyadip Das, Amal K. Mandal, Manoj K. Kesharwani, E. Suresh, Bishwajit Ganguly* and
Amitava Das*
Central Salt and Marine Chemicals Research Institute (CSIR),
G.B. Marg, Bhavnagar: 364002, Gujarat, India.
Email address: [email protected], [email protected]
Telephone number: +91 278 2567760 [672]; Fax number: +91 278 2567562/6970
Electronic Supplementary Material (ESI) for Chemical CommunicationsThis journal is © The Royal Society of Chemistry 2011

2
Table of Contents:-
Materials and method S3
Synthetic scheme S3
Syntesis and characterisation of (2) S4
Synthesis and characterisation of (3) S4
Synthesis and characterisation of (L) S5
1H NMR spectra of L S6
13C NMR spectra of L S7
UV-VIS titration of L with Fluoride in acetonitrile S8
Benesi Hildebrand plot for the titration of L with Fluoride S8
UV-VIS titration of L with di hydrogen phosphate in acetonitrile S9
Benesi Hildebrand plot for the titration of L with di hydrogen phosphate S9
Mass spectra of (2:1) complex of Fluoride with L S10
Mass spectra of (2:1) complex of dihydrogen phosphate with L S11
Mass spectra of (2:1) complex of L.2F-(H2O)2, extracted in CH2Cl2 layer. S12
1H NMR spectra of L in absence and presence of different anions at room temperature S13
1H NMR spectra of L in presence of 10 mol eq and excess F− ion at room temperature S14
31P NMR of L with in presence and absence of different anions S14
UV-VIS spectra of L in presence of 5 and 100 mole eq. F- and t-BuoK S15
Optimized geometries of L, L.2Fˉ and L.2H2PO4ˉ S16
Optimized geometries of L, L.Fˉ and L.H2PO4ˉ S16
Extraction procedure for different water sample analysis S17
Measurement of extraction efficiency of L S17
Photograph for 0. 25ppm NaH2PO4 extraction by CH2Cl2 solution of L S18
Interference Study during the extraction of fluoride in presence H2PO4- S19
Evaluation of the binding constant of L towards Fˉ from the extraction process S20
1H NMR of L with varying concentration of TBAF at -20°C S21
Extraction ability of L from aq solution of NaF at different pH S22
Electronic Supplementary Material (ESI) for Chemical CommunicationsThis journal is © The Royal Society of Chemistry 2011

3
Materials and method:
The chemical such as 2,3 dimethyl anthraquinone, N-bromo succinamide (NBS) dibenzoyl
peroxide , trtrabutyl ammonium salt of various anions and sodium hexafluoro phosphate were
obtained from sigma-Aldrich and were as received without any purification, Triphenyl
phosphene, sodium fluoride and all the other reagents used were of reagent grade (S. D. Fine
chemical, India) and were used as received.Various analytical and spectroscopic data
obtained for these intermediates provided necessary supports for the proposed formulation
and required purity. HPLC grade acetonitrile (Fisher Scientific), water was used as a solvent.
Chloroform, Methanol, carbon tetrachloride was used for different synthetic procedure and
studies, were purified through distillation following standard procedures, prior to use.
Microanalysis (C, H, N) were performed using a Perkin-Elmer 4100 elemental analyzer.
FTIR spectra were recorded as KBr pellets using Perkin Elmer Spectra GX 2000
spectrometer. 1H and 31P NMR spectra were recorded on Bruker 200 MHz (Avance-DPX
200)/ 500 MHz (Bruker Avance II 500) FT NMR. Electronic spectra were recorded with
Cary-Varian UV-VIS NIR spectrophotometer
Synthetic scheame:
Electronic Supplementary Material (ESI) for Chemical CommunicationsThis journal is © The Royal Society of Chemistry 2011

4
Synthesis of 2 (2,3 dimethyl bromo anthraquinone):
N-bromosuccinamide (NBS) (662.2 mg, 3.7243 mmol) and a catalytic amount of
recrystallized dibenzoylperoxide were added to a solution of 1 (400mg, 1.6929mmol
dissolved in 80 ml of CCl4). The resulting mixture was refluxed for 4 h with irradiation of
a100 W lamp. The decomposed product of NBS was then separated by filtration and the
filtrate was evaporated to dryness to afford a yellow coloured solid residue, which was
subjected to column chromatography on silica gel as stationary phase and chloroform/hexane
solvent mixture (1:1, v/v) as the eluent to get the 2 as a pure product (480 mg, 71.2%). 1H
NMR (200 MHz, CDCl3, 25 °C, TMS) δ (ppm): 8.348 - 8.33 (m, 2H; ArH), 8.30 (s, 2H;
ArH), 7.87 – 7.812(m, 2H; ArH), 4.760(s, 4H; -CH2). IR (KBr) νmax/cm-1: 3037, 1677, 1589,
1331, 1298, 1227, 966, 795, 714, 622. ESI-MS (m/z): 415 ((M+ + Na+), 100%). Elemental
analysis: C16H10Br2O2: calculated C (48.77), H (2.56); found C (48.21), H (2.73).
Synthesis of 3 (2,3-Bis(triphenylposphoniomethyl)anthraquinone dibromide):
A solution of 2 (200mg, 0.508mmol) and triphenyl phosphene (281mg, 1.117mmol) in 50ml
dry chloroform was refluxed for 3-4 hrs , then the reaction mixture was allowed to stir at
room temperature for 14 hrs. Then the reaction mixture was evaporated to dryness to afford a
thick oily residue, this was treated with diethyl ether and on constant stirring afford a
yellowish solid residue, which was filtered off, dried properly and finally recrystalised from
minimum volume of chloroform to get the pure product 3 (428mg, 92%). 1H NMR (500
MHz, CDCl3, 25 °C, TMS) δ (ppm): 8.208-8.198 (m, 6H; ArH), 7.827 (s, 2H; ArH), 7.692 –
7.653 (m, 20H; ArH), 7.556 (t, J = 7Hz, 2H; ArH), 7.488 – 7.473 (m, 6H; ArH), 6.785 (d, J
= 15.5Hz, 4H; Ar-CH2P), . IR (KBr) νmax/cm-1: 3462, 3056, 1674, 1589, 1436, 1328,
1298,1111, 718, 690, 539, ESI-MS (m/z): 839 ((M+ - Br-), 20%), 757.28 ((M+ - 2Br-), 30%).
Elemental analysis: C52H40O2P2Br2: calculated C (67.99), H (4.39); found C (66.85), H
(4.51).
Electronic Supplementary Material (ESI) for Chemical CommunicationsThis journal is © The Royal Society of Chemistry 2011

5
Synthesis of L (2, 3-Bis(triphenylphosphoniomethyl)anthraqunone di hexa
fluorophosphates:
To a solution 0.1g (0.476mmol) of 2, 3-bis(triphenylphosphoniomethyl)anthraquinone
dibromide (3) in 20mL of MeOH, NaPF6 (0.106g, 0.654 mmol) was added. The reaction
mixture was stirred for 5hrs, which afford a yellow precipitate. The yellow solid was
collected by filtration and dried properly to give L 85mg (74.5%). 1H NMR (500 MHz,
CD3CN, 25 °C, TMS) δ (ppm): 8.17-8.14 (m, 2H; ArH), 7.93 – 7.87 (m, 8H; ArH), 7.72-
7.68 (m, 14H; ArH), 7.53– 7.49 (m, 12H; ArH), 3.97 (d, J = 15.5Hz, 4H; Ar -CH2P). 13C
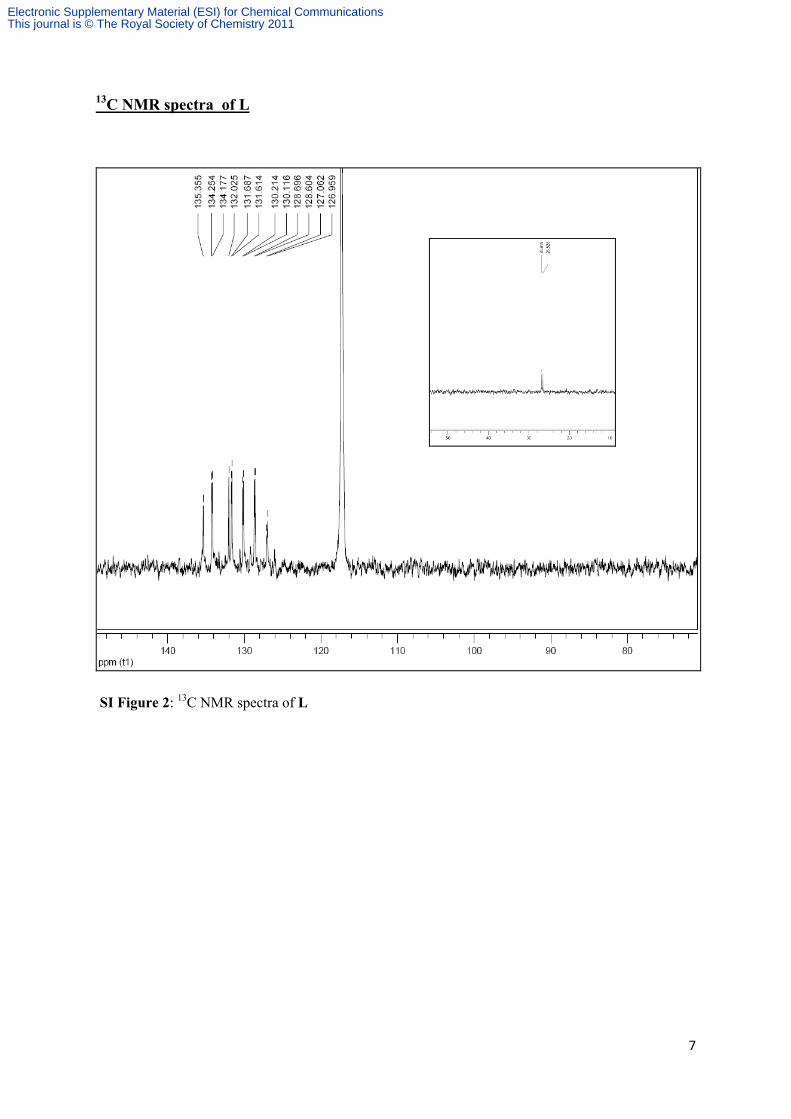
NMR (200 MHz, CD3CN, 25 °C, TMS) δ (ppm): 26.72 (d, Ar -CH2P), 115.58, 116.587,
126.944, 130.350, 130.452, 130.837, 134.120, 134.2, 134.973, 135.921 (Ar- and P-Ar). IR
(KBr) νmax/cm-1: 3336, 1679, 1589, 1440, 1330, 1295, 1110, 837, 745, 689, 558, 513, ESI-
MS (m/z): 757.59 ((M+ - 2PF6-), 63%), 903 ((M+ - PF6
-), 40%). Elemental analysis:
C52H40F12O2P4: calculated C (59.55), H (3.84); found C (60.12), H (3.53).
Electronic Supplementary Material (ESI) for Chemical CommunicationsThis journal is © The Royal Society of Chemistry 2011

6
1H NMR spectra of L
SI Figure 1:1H NMR spectra of L
Electronic Supplementary Material (ESI) for Chemical CommunicationsThis journal is © The Royal Society of Chemistry 2011
7
13C NMR spectra of L
SI Figure 2: 13C NMR spectra of L
Electronic Supplementary Material (ESI) for Chemical CommunicationsThis journal is © The Royal Society of Chemistry 2011
8
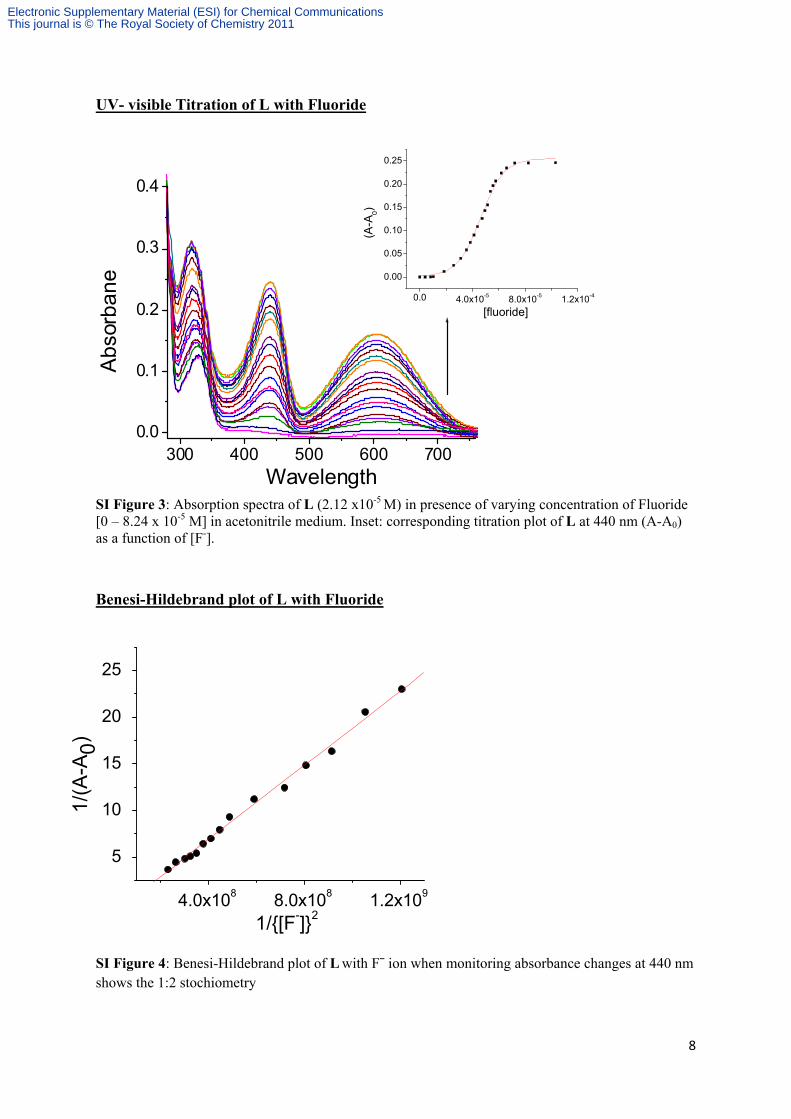
UV- visible Titration of L with Fluoride
SI Figure 3: Absorption spectra of L (2.12 x10⁻⁵ M) in presence of varying concentration of Fluoride [0 – 8.24 x 10⁻⁵ M] in acetonitrile medium. Inset: corresponding titration plot of L at 440 nm (A-A0) as a function of [F-].
Benesi-Hildebrand plot of L with Fluoride
SI Figure 4: Benesi-Hildebrand plot of L with Fˉ ion when monitoring absorbance changes at 440 nm shows the 1:2 stochiometry
0.0 4.0x10⁻⁵ 8.0x10⁻⁵ 1.2x10⁻⁴
0.00
0.05
0.10
0.15
0.20
0.25
(A-A
0)
[fluoride]
300 400 500 600 7000.0
0.1
0.2
0.3
0.4
Abs
orba
ne
Wavelength
4.0x10⁸ 8.0x10⁸ 1.2x10⁹
5
10
15
20
25
1/(A
-A0)
1/{[F-]}2
Electronic Supplementary Material (ESI) for Chemical CommunicationsThis journal is © The Royal Society of Chemistry 2011

9
UV- visible Titration of L with di hydrogen phosphate
SI Figure 5: Absorption spectra of L (2.12 x10⁻⁵ M) in presence of varying concentration of H2PO4- [0
– 1.23 x 10⁻⁴ M] in acetonitrile medium. Inset: corresponding titration plot of L at 602 nm (A-A0) as a function of [H2PO4
-]
Benesi-Hildebrand plot of L with di hydrogen phosphate
SI Figure 6: Benesi-Hildebrand plot of L with H2PO4- ion when monitoring absorbance changes at
602 nm show the 1:2 stochiometry
3 00 4 00 500 6 0 0 7000 .0
0 .1
0 .2
0 .3
Abs
orba
nce
W av ele ngth(nm )
0.0 4.0x10⁻⁵ 8.0x10⁻⁵ 1.2x10⁻⁴
0.00
0.04
0.08
0.12
0.16
(A-A
0)
[H2PO4-]
0.0 4.0x10⁸ 8.0x10⁸ 1.2x10⁹
10
20
30
40
50
1/(A
-A0)
1/[H2PO4-]2
Electronic Supplementary Material (ESI) for Chemical CommunicationsThis journal is © The Royal Society of Chemistry 2011

10
Mass spectra of (2:1) complex of Fluoride with L
SI Figure 7: ESI-mass spectra of L in presence of 5 mole equivalent of added F−.
Electronic Supplementary Material (ESI) for Chemical CommunicationsThis journal is © The Royal Society of Chemistry 2011
11
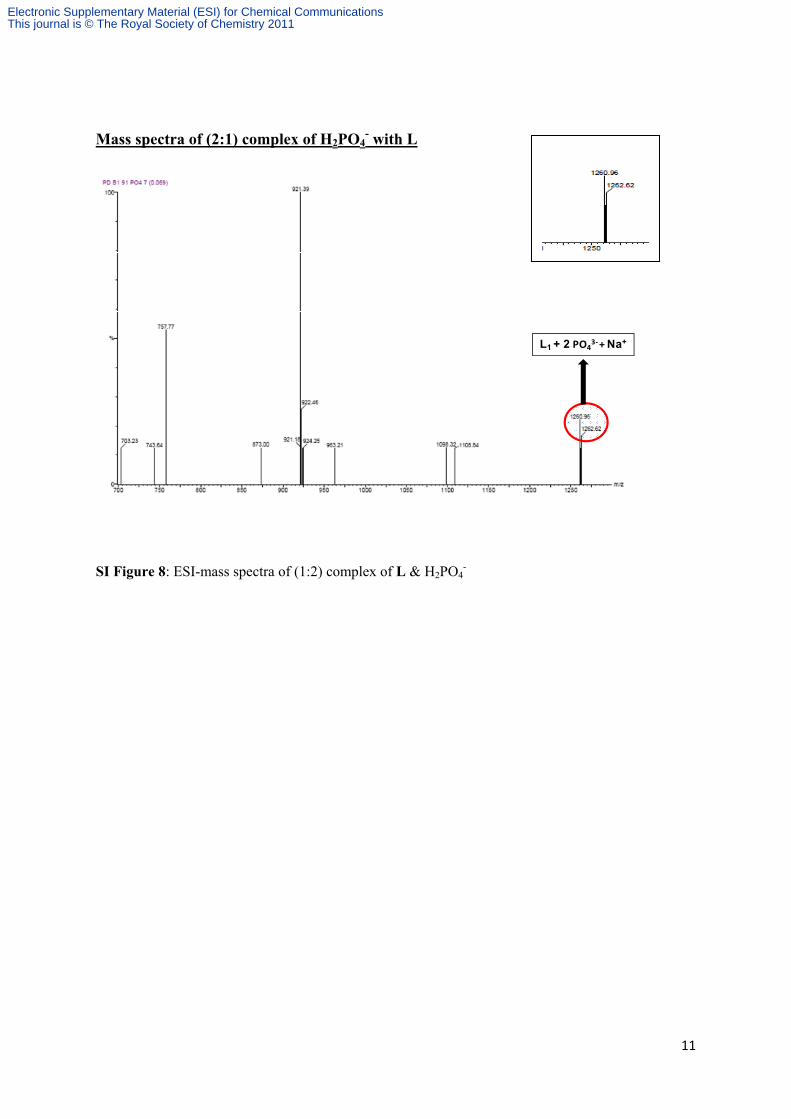
Mass spectra of (2:1) complex of H2PO4- with L
L1 + 2 PO43- + Na+
SI Figure 8: ESI-mass spectra of (1:2) complex of L & H2PO4-
Electronic Supplementary Material (ESI) for Chemical CommunicationsThis journal is © The Royal Society of Chemistry 2011

12
Mass spectra of extracted complex L.2F- (H2O)2 in CH2Cl2 layer.
L1 - PF6- + 2 F- + 2 H2O + Na+
SI Figure 9: ESI-mass spectra complex of L.2F- (H2O)2 layer, which was extracted from aqueous solution of NaF.
Electronic Supplementary Material (ESI) for Chemical CommunicationsThis journal is © The Royal Society of Chemistry 2011

13
1H NMR of L with differnt anions at room temperature
SI Figure 10: 1H NMR spectra of compound L upon the addition of F-, H2PO4- (50 mole equivalent)
in CD3CN at room temperature.
SI Figure 11: 1H NMR spectra of compound L upon the addition of other different anions (50 mole equivalent) in CD3CN at room temperature.
8 7 6 5 4δ (ppm)
L+NO3-
L+Cl-
L+HSO4-
L+Br-
L
L+I -
8 7 6 5 4
L
δ(ppm)
L+F-
L+H2PO4-
Electronic Supplementary Material (ESI) for Chemical CommunicationsThis journal is © The Royal Society of Chemistry 2011

14
1H NMR of L with excess (100 mole eq) of fluoride ion at room temperature
SI Figure 13:1H NMR spectra of compound L before and after addition of 100eq F− at room temperature in CD3CN.
31P NMR of L with presence of different anions
SI Figure 14:31P NMR spectra of compound L before and after addition of F-, H2PO4-(5eq )and other
Cl-, Br-(30eq) in CD3CN at room temperature.
28 26 24 22
L
δ(ppm)
L+F-
L+H2PO4-
L+Cl-
L+Br-
20 18 16 14 12
L only
δ(ppm)
20 18 16 14 12
L +10 equivalent F-
20 18 16 14 12
L +100 equivalent F-
Electronic Supplementary Material (ESI) for Chemical CommunicationsThis journal is © The Royal Society of Chemistry 2011
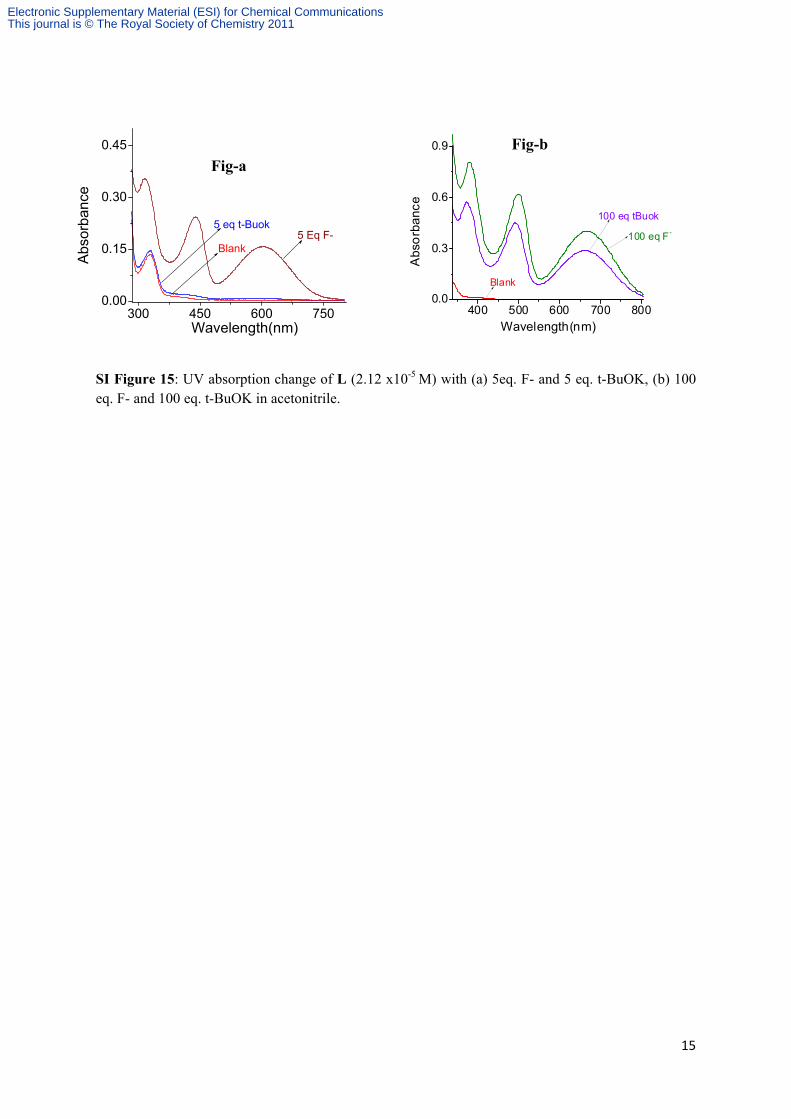
15
SI Figure 15: UV absorption change of L (2.12 x10⁻⁵ M) with (a) 5eq. F- and 5 eq. t-BuOK, (b) 100 eq. F- and 100 eq. t-BuOK in acetonitrile.
400 500 600 700 8000.0
0.3
0.6
0.9
Blank
100 eq tBuok
100 eq F-
Abs
orba
nce
Wavelength(nm)
Fig-a Fig-b
300 450 600 7500.00
0.15
0.30
0.45
Blank
5 eq t-Buok5 Eq F-
Abs
orba
nce
Wavelength(nm)
Electronic Supplementary Material (ESI) for Chemical CommunicationsThis journal is © The Royal Society of Chemistry 2011
16
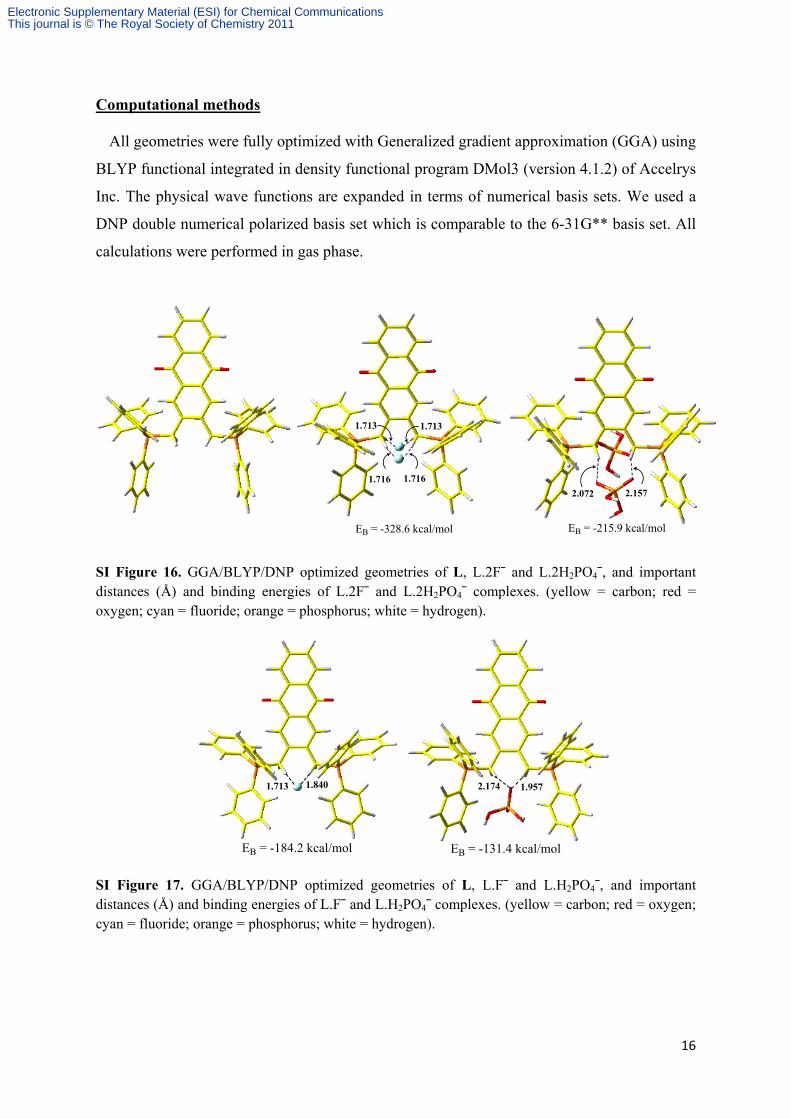
Computational methods
All geometries were fully optimized with Generalized gradient approximation (GGA) using
BLYP functional integrated in density functional program DMol3 (version 4.1.2) of Accelrys
Inc. The physical wave functions are expanded in terms of numerical basis sets. We used a
DNP double numerical polarized basis set which is comparable to the 6-31G** basis set. All
calculations were performed in gas phase.
1.7161.716
2.072 2.157
EB = -328.6 kcal/mol EB = -215.9 kcal/mol
1.713 1.713
SI Figure 16. GGA/BLYP/DNP optimized geometries of L, L.2Fˉ and L.2H2PO4ˉ, and important distances (Å) and binding energies of L.2Fˉ and L.2H2PO4ˉ complexes. (yellow = carbon; red = oxygen; cyan = fluoride; orange = phosphorus; white = hydrogen).
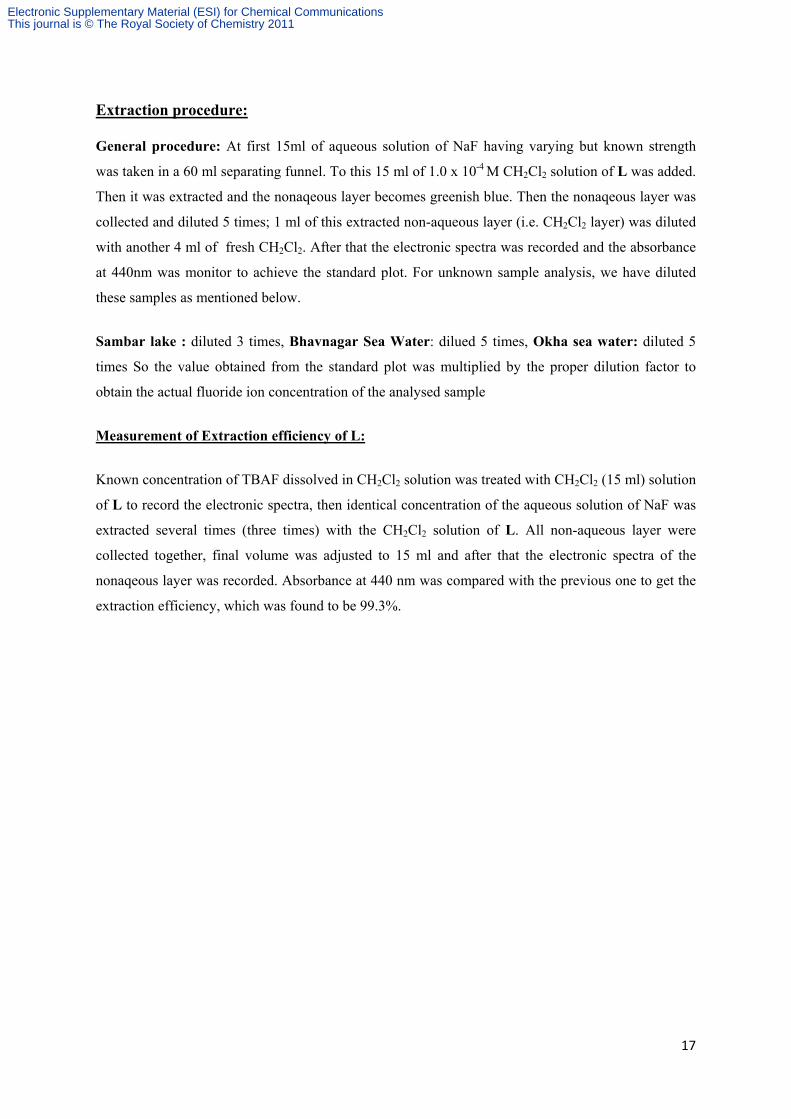
1.713 1.840 2.174 1.957
EB = -184.2 kcal/mol EB = -131.4 kcal/mol
SI Figure 17. GGA/BLYP/DNP optimized geometries of L, L.Fˉ and L.H2PO4ˉ, and important distances (Å) and binding energies of L.Fˉ and L.H2PO4ˉ complexes. (yellow = carbon; red = oxygen; cyan = fluoride; orange = phosphorus; white = hydrogen).
Electronic Supplementary Material (ESI) for Chemical CommunicationsThis journal is © The Royal Society of Chemistry 2011
17
Extraction procedure:
General procedure: At first 15ml of aqueous solution of NaF having varying but known strength
was taken in a 60 ml separating funnel. To this 15 ml of 1.0 x 10⁻⁴ M CH2Cl2 solution of L was added.
Then it was extracted and the nonaqeous layer becomes greenish blue. Then the nonaqeous layer was
collected and diluted 5 times; 1 ml of this extracted non-aqueous layer (i.e. CH2Cl2 layer) was diluted
with another 4 ml of fresh CH2Cl2. After that the electronic spectra was recorded and the absorbance
at 440nm was monitor to achieve the standard plot. For unknown sample analysis, we have diluted
these samples as mentioned below.
Sambar lake : diluted 3 times, Bhavnagar Sea Water: dilued 5 times, Okha sea water: diluted 5
times So the value obtained from the standard plot was multiplied by the proper dilution factor to
obtain the actual fluoride ion concentration of the analysed sample
Measurement of Extraction efficiency of L:
Known concentration of TBAF dissolved in CH2Cl2 solution was treated with CH2Cl2 (15 ml) solution
of L to record the electronic spectra, then identical concentration of the aqueous solution of NaF was
extracted several times (three times) with the CH2Cl2 solution of L. All non-aqueous layer were
collected together, final volume was adjusted to 15 ml and after that the electronic spectra of the
nonaqeous layer was recorded. Absorbance at 440 nm was compared with the previous one to get the
extraction efficiency, which was found to be 99.3%.
Electronic Supplementary Material (ESI) for Chemical CommunicationsThis journal is © The Royal Society of Chemistry 2011
18
Experiment for Phosphate interference:
Taken from “Water, Water Everywhere. HACH Company. Second Edition. 1991”.
Phosphates enter waterways from human and animal waste, phosphorus rich bedrock, laundry, cleaning, industrial effluents, and fertilizer runoff. These phosphates become detrimental when they over fertilize aquatic plants and cause stepped up eutrophication.
Phosphate is an essential nutrient for the proper growth of aquatic life (plant and animal). However, too much phosphate in the water has an adverse influence on the aquatic life and turns toxic and cause animal death. The optimum concentration for sea water between 0.05 to 0.20 mg/l (ppm) phosphate and beyond this, this is toxic to aquatic life.
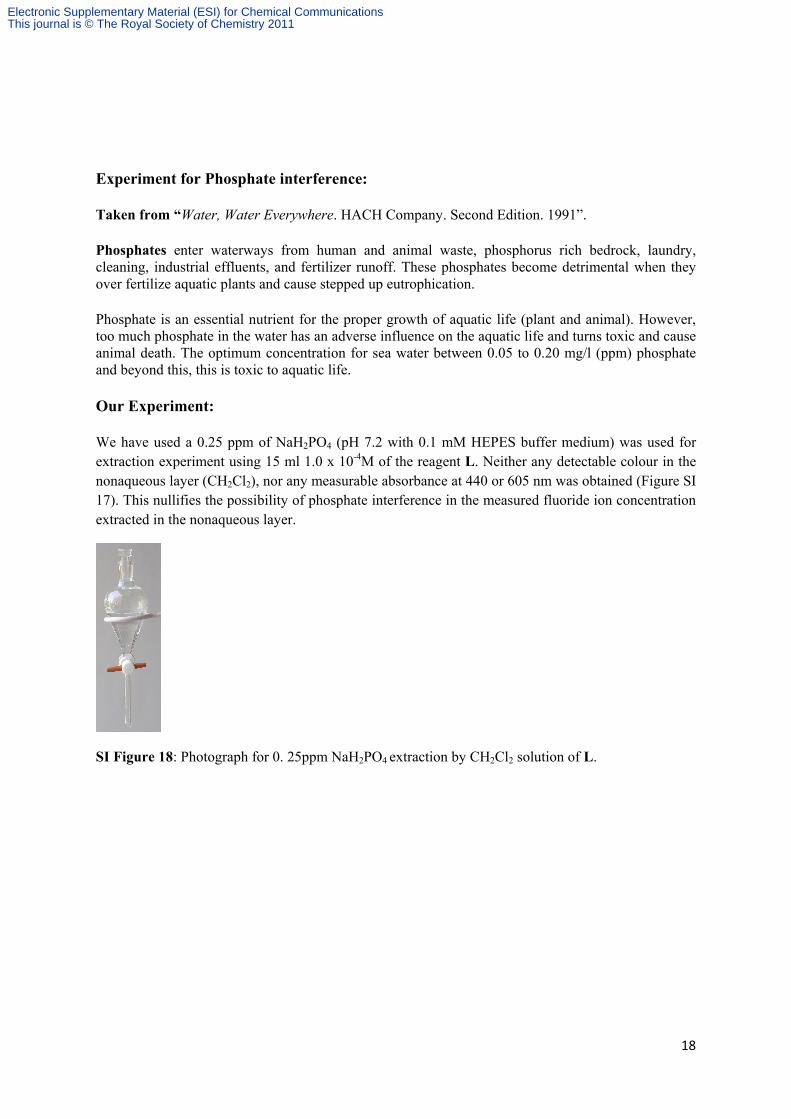
Our Experiment:
We have used a 0.25 ppm of NaH2PO4 (pH 7.2 with 0.1 mM HEPES buffer medium) was used for extraction experiment using 15 ml 1.0 x 10⁻⁴M of the reagent L. Neither any detectable colour in the nonaqueous layer (CH2Cl2), nor any measurable absorbance at 440 or 605 nm was obtained (Figure SI 17). This nullifies the possibility of phosphate interference in the measured fluoride ion concentration extracted in the nonaqueous layer.
SI Figure 18: Photograph for 0. 25ppm NaH2PO4 extraction by CH2Cl2 solution of L.
Electronic Supplementary Material (ESI) for Chemical CommunicationsThis journal is © The Royal Society of Chemistry 2011
19
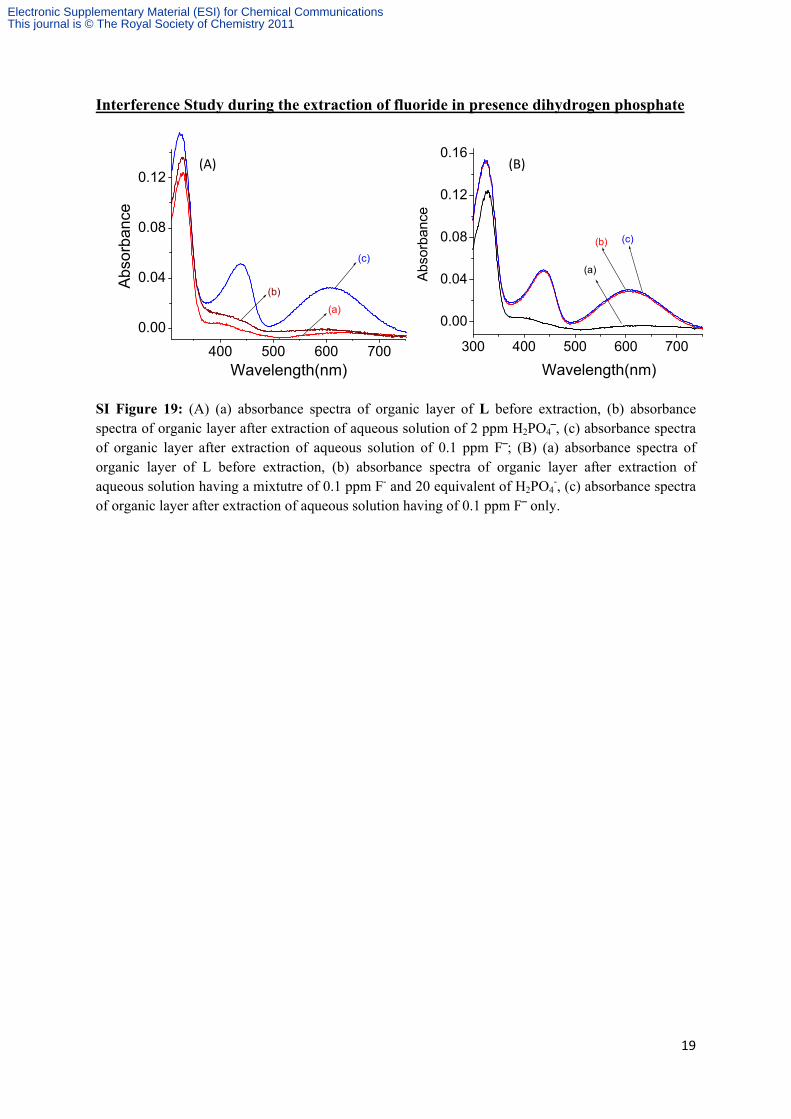
Interference Study during the extraction of fluoride in presence dihydrogen phosphate
SI Figure 19: (A) (a) absorbance spectra of organic layer of L before extraction, (b) absorbance spectra of organic layer after extraction of aqueous solution of 2 ppm H2PO4‾, (c) absorbance spectra of organic layer after extraction of aqueous solution of 0.1 ppm F‾; (B) (a) absorbance spectra of organic layer of L before extraction, (b) absorbance spectra of organic layer after extraction of aqueous solution having a mixtutre of 0.1 ppm F- and 20 equivalent of H2PO4
-, (c) absorbance spectra of organic layer after extraction of aqueous solution having of 0.1 ppm F‾ only.
(A) (B)
400 500 600 700
0.00
0.04
0.08
0.12
(a)
(c)
(b)Abso
rban
ce
Wavelength(nm)300 400 500 600 700
0.00
0.04
0.08
0.12
0.16
(c)
(a)
(b)
Abso
rban
ce
Wavelength(nm)
Electronic Supplementary Material (ESI) for Chemical CommunicationsThis journal is © The Royal Society of Chemistry 2011

20
Evaluation of the binding constant of L towards Fˉ from the extraction process:
300 400 500 600 7000.0
0.1
0.2
0.3
Abs
orba
nce
Wavelength(nm)
SI Figure 20: Absorption spectra of L (2.02 x10⁻⁵ M) following solvent extraction process with varying concentration of NaF [0 – 8.00 x 10⁻⁵ M] in aqueous solution of neutral pH. Calculated
binding constant for the formation of L.2Fˉ was found to be (1.7 ± 0.15) x 106M-2, which is slightly lower than the value that was evaluated in pure acetonitrile medium. Higher salvation of Fˉ in aqueous solution could have accounted for this.
Electronic Supplementary Material (ESI) for Chemical CommunicationsThis journal is © The Royal Society of Chemistry 2011

21
1H NMR of L with varying concentration of TBAF at -20°C
6 5 4.0 3.9
L
δ (ppm)
L + 5eq F-
L + 50 eq F-
L + 10eq F-
18 17 16 15 14δ(ppm)
L+5eq F-
L+10 eq F-
L
L+50 eq F-
(A)
(B)
SI Figure 21: 1H NMR spectra of compound L (A) upon the addition of varying concentration of Fˉ in CD3CN at -20°C; (B) Partial 1H NMR spectra that reveals the generation of HF2ˉ on deprotonation of L in presence of excess of TBAF (50 mole equivalent) in CD3CN medium at -20˚C. Deprotonation of L or the generation of HF2ˉ was not evident with 10 mole equivalent of TBAF at -20 ˚C.
Electronic Supplementary Material (ESI) for Chemical CommunicationsThis journal is © The Royal Society of Chemistry 2011
22
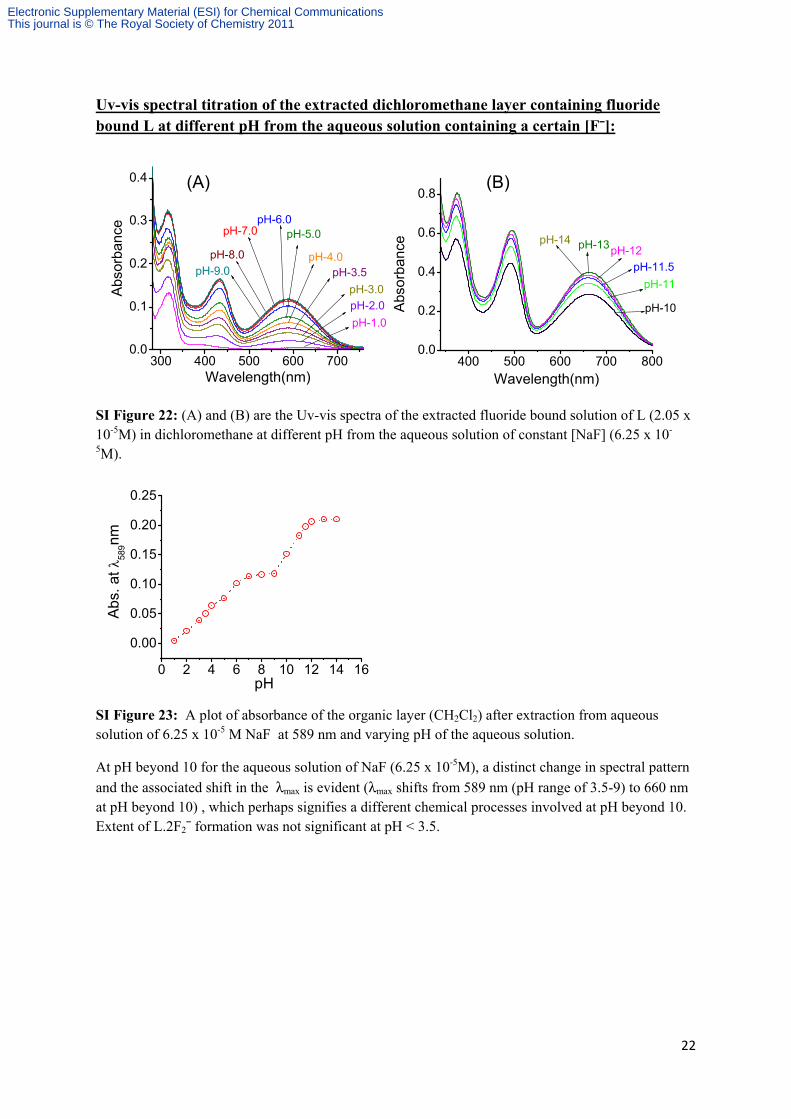
Uv-vis spectral titration of the extracted dichloromethane layer containing fluoride bound L at different pH from the aqueous solution containing a certain [Fˉ]:
300 400 500 600 7000.0
0.1
0.2
0.3
0.4
pH-9.0
pH-7.0
pH-8.0
pH-1.0pH-2.0pH-3.0
pH-3.5pH-4.0
pH-5.0pH-6.0
Abs
orba
nce
Wavelength(nm)400 500 600 700 800
0.0
0.2
0.4
0.6
0.8
pH-14 pH-13pH-12pH-11.5
pH-11
pH-10Abs
orba
nce
Wavelength(nm)
(A) (B)
SI Figure 22: (A) and (B) are the Uv-vis spectra of the extracted fluoride bound solution of L (2.05 x 10⁻⁵M) in dichloromethane at different pH from the aqueous solution of constant [NaF] (6.25 x 10-
5M).
SI Figure 23: A plot of absorbance of the organic layer (CH2Cl2) after extraction from aqueous solution of 6.25 x 10⁻⁵ M NaF at 589 nm and varying pH of the aqueous solution.
At pH beyond 10 for the aqueous solution of NaF (6.25 x 10⁻⁵M), a distinct change in spectral pattern
and the associated shift in the λmax is evident (λmax shifts from 589 nm (pH range of 3.5-9) to 660 nm at pH beyond 10) , which perhaps signifies a different chemical processes involved at pH beyond 10. Extent of L.2F2ˉ formation was not significant at pH < 3.5.
0 2 4 6 8 10 12 14 16
0.00
0.05
0.10
0.15
0.20
0.25
Abs
. at λ
589nm
pH
Electronic Supplementary Material (ESI) for Chemical CommunicationsThis journal is © The Royal Society of Chemistry 2011