recent trends in worker quality: a midwest perspective daniel aaronson and daniel sullivan federal...
TRANSCRIPT
Recent Trends in Worker Quality:A Midwest Perspective
Daniel Aaronson and Daniel Sullivan
Federal Reserve Bank of Chicago
November 2002
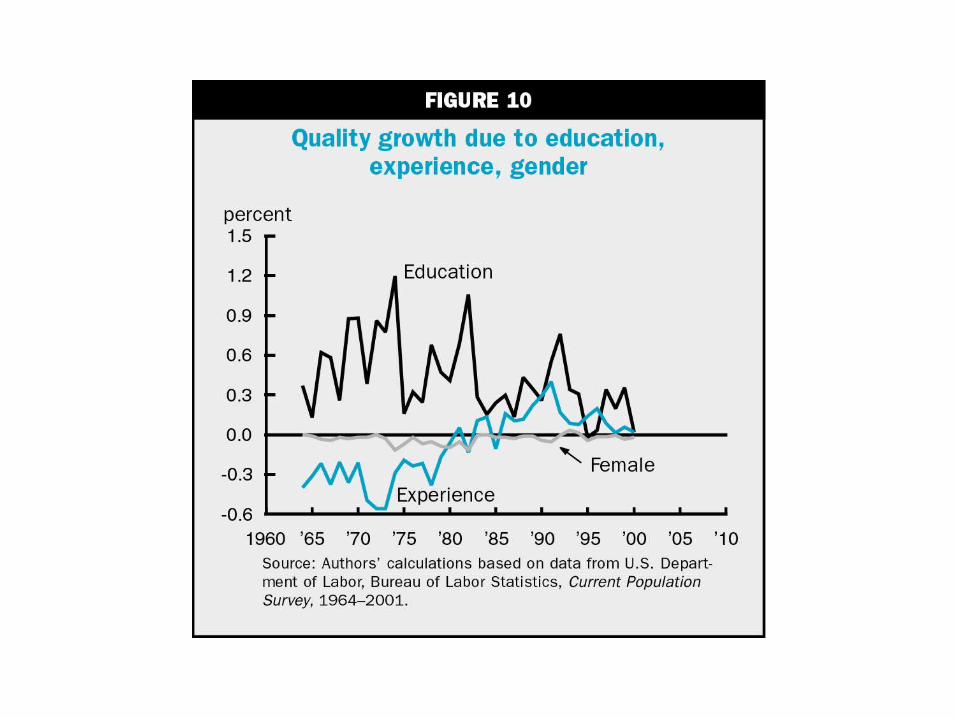
Worker Quality
• AKA Worker Composition
• Quantifies impact on labor productivity of certain aspects of the human capital stock– Years of Education– Years of Potential Experience– Sex– Other factors?
Worker Quality
• One of several factors underlying labor productivity growth– Accounts for 0.22 of 2.7 percent average
growth in labor productivity since 1967
• Drives wages as well
• May be influenced by public policies
Worker Quality Methodology
• Basic assumption is that variation in wages across workers reflects productivity
• Can use cross-sectional data to quantify the impact of worker characteristics on wages
• Implies we can quantify the productivity impact of changes over time in the distribution of worker characteristics
Methodological Caveats
• Misses all but the most gross variation in education and work experience– Year at Harvard = Year at Community College
• Wages may not equal productivity– Discrimination, signaling, rat race, etc
• Misses externalities from education– workers may not capture the full benefits their
of education
Preview of Results
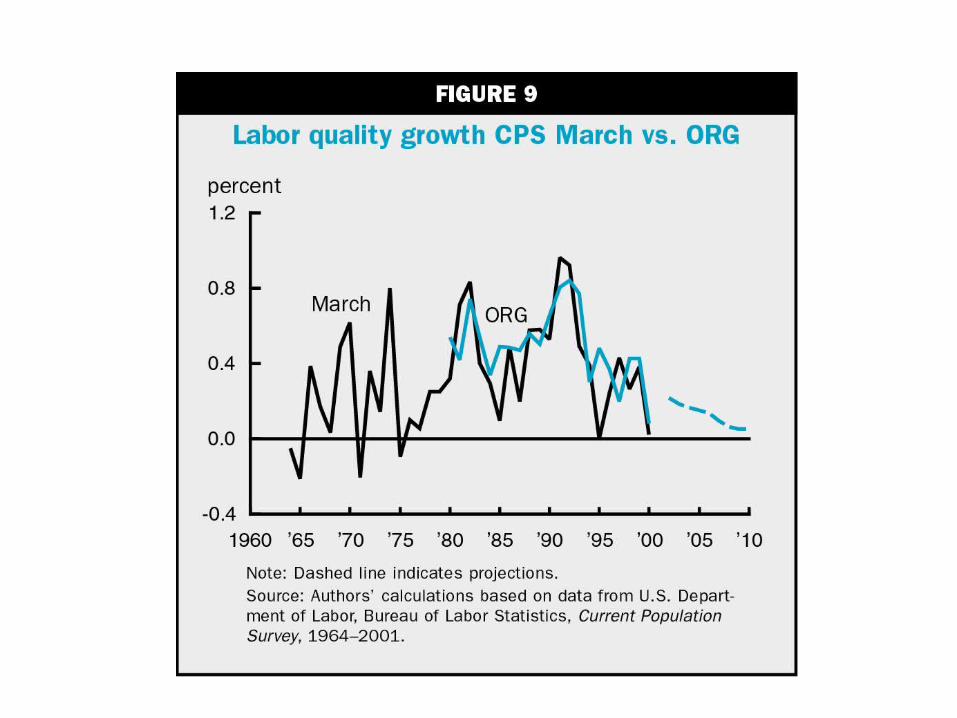
• Labor quality growth varies over time
• Relatively rapid in late 1980s and early 1990s (0.5 percentage points per year)
• Recently about half that fast
• Labor quality growth likely to slow further– Education levels will be rising more slowly– Baby boomers will be going over the hill
Midwest
• Very similar to the nation as a whole
• Recently caught up to nation in education
• Somewhat better than nation on experience
• Overall, slightly above nation in level
• Modestly faster growth over last 20 years
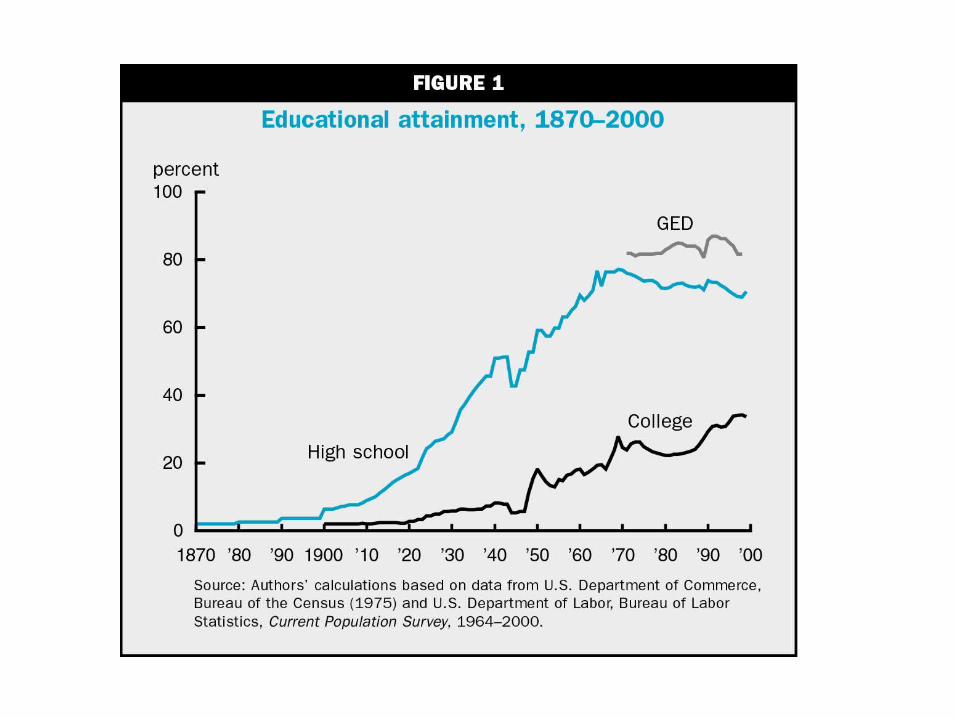
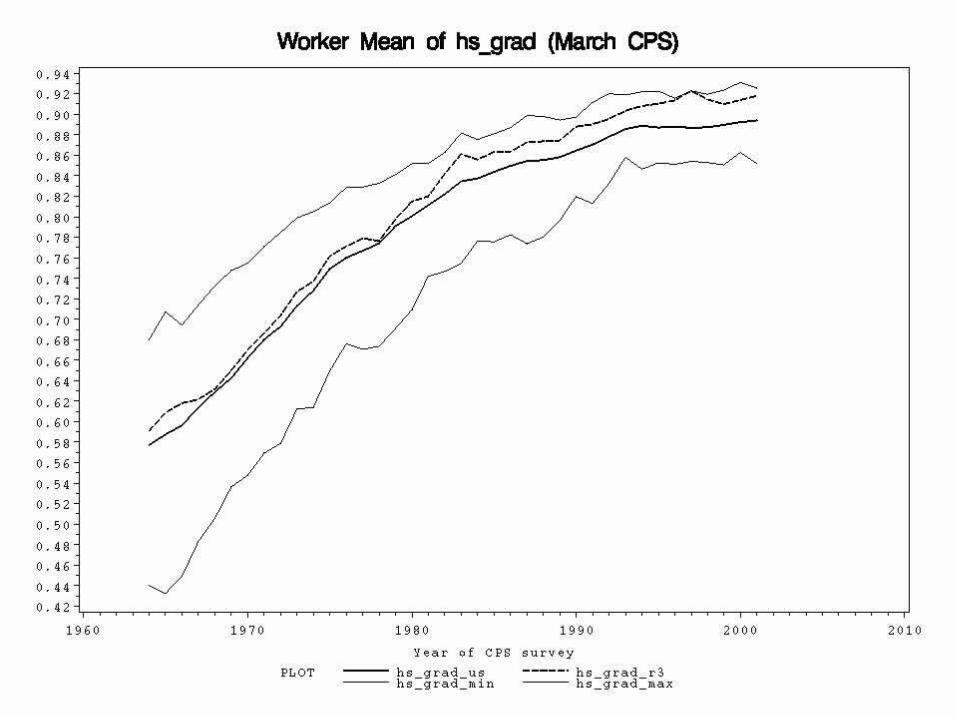
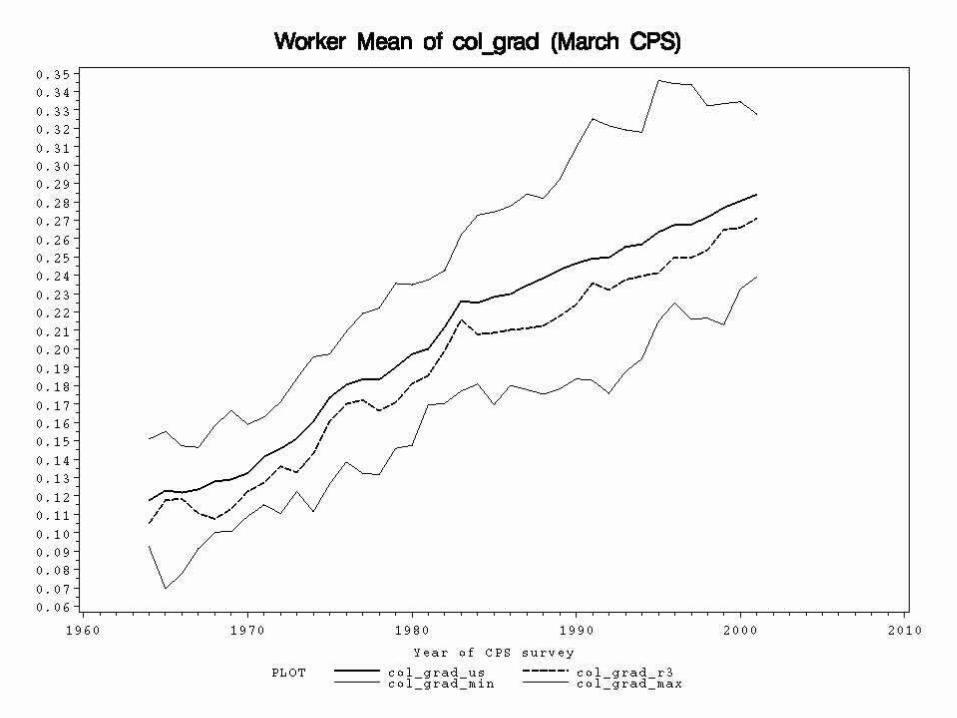
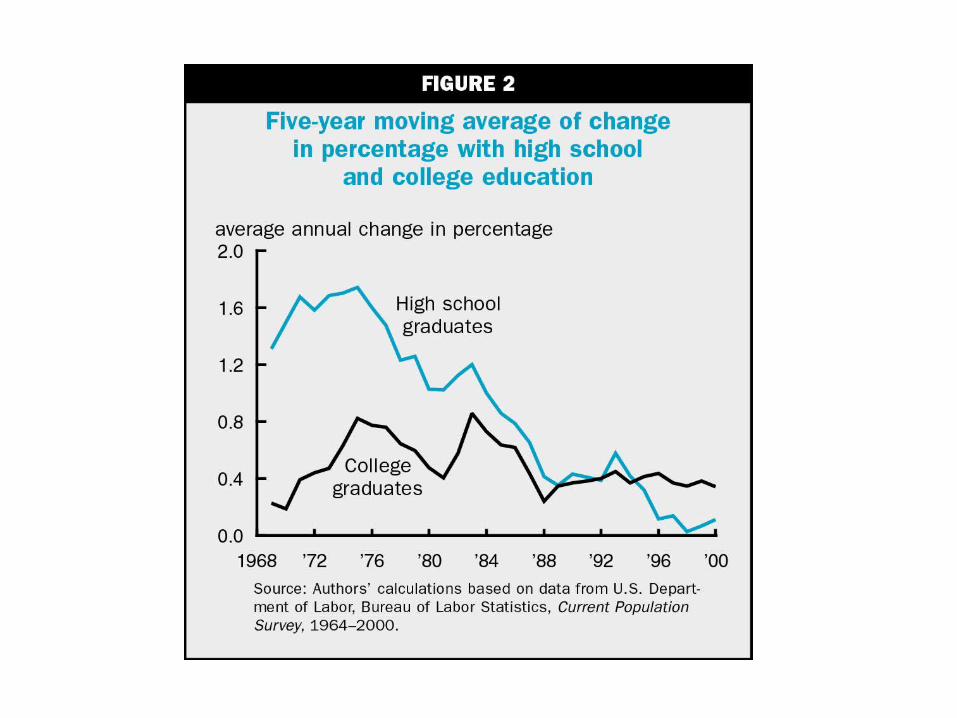
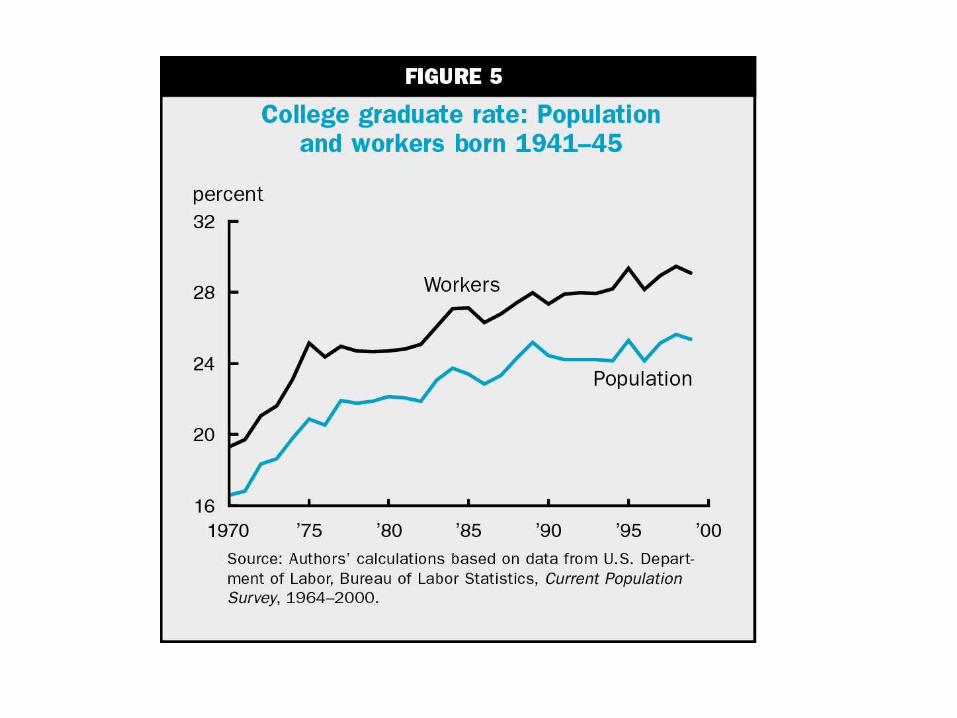
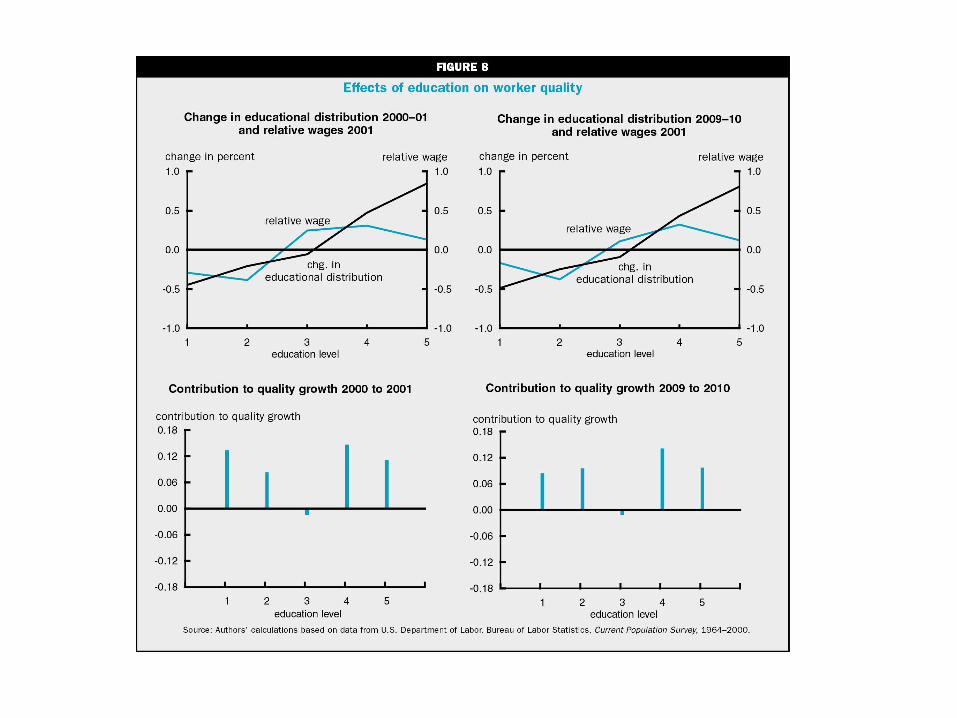
U.S. Educational Attainment
• Very large increases over the last century
• Rapid increases in early 1970s and 1980s– Driven by entrance of large baby-boom cohorts
• Slowing somewhat since then– Less favorable demographics offset increases
in enrollment rates
• Significant role for adult education?
Current Population Survey
• Monthly “mini census”
• March Annual Demographic Files– At least 50,000 households per year– Available (conveniently) since 1964
• Outgoing Rotation Groups (Earner Study)– At least 150,000 households per year– Available since 1979
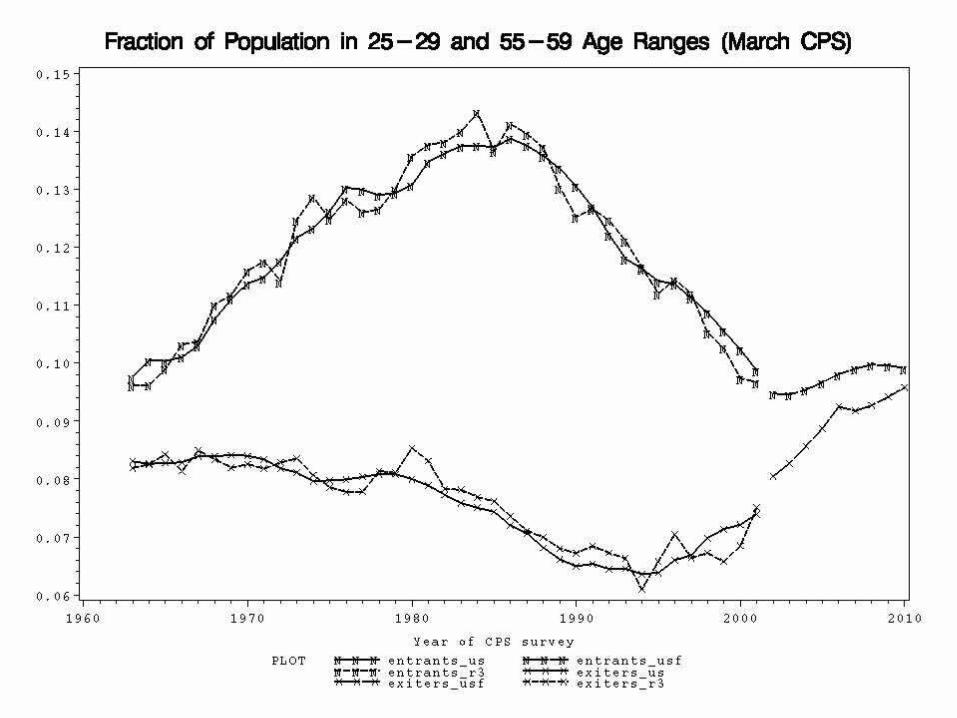
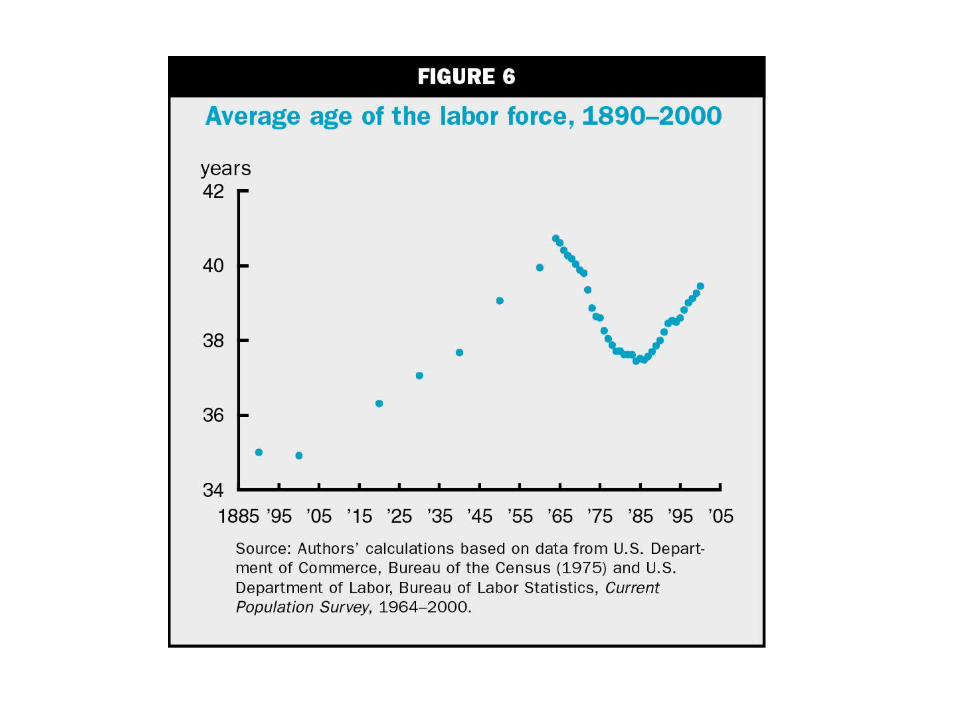
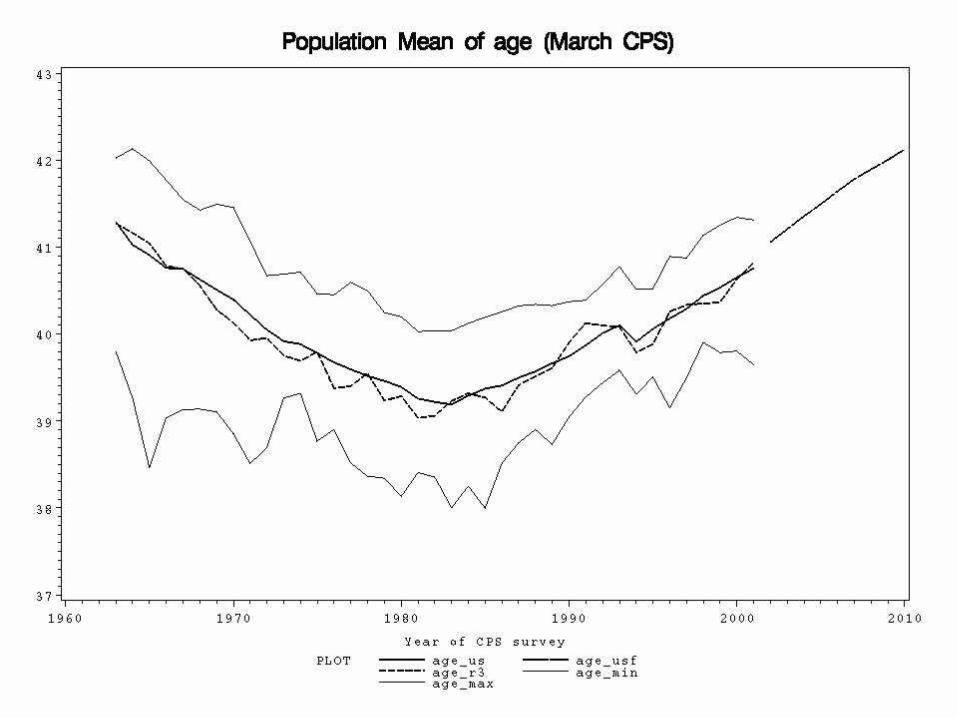
U.S. Age Distribution
• Average age of workers rose over the last century
• Average age declined significantly with entry of baby boom
• Started rising again in the mid 1980s
• Soon we will see a falling share of prime-age workers
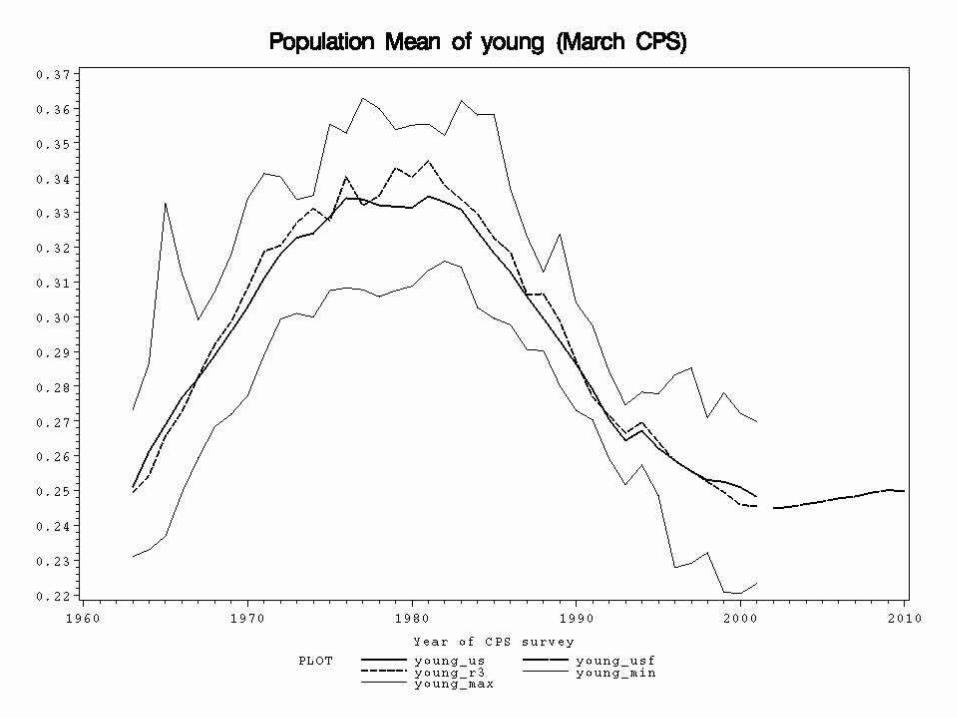
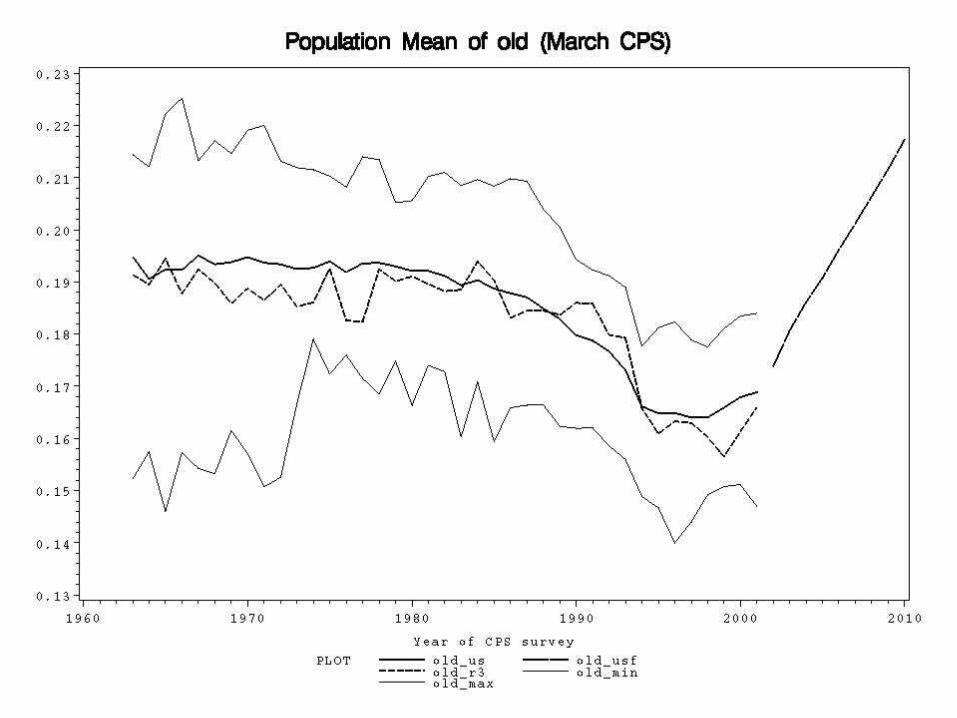
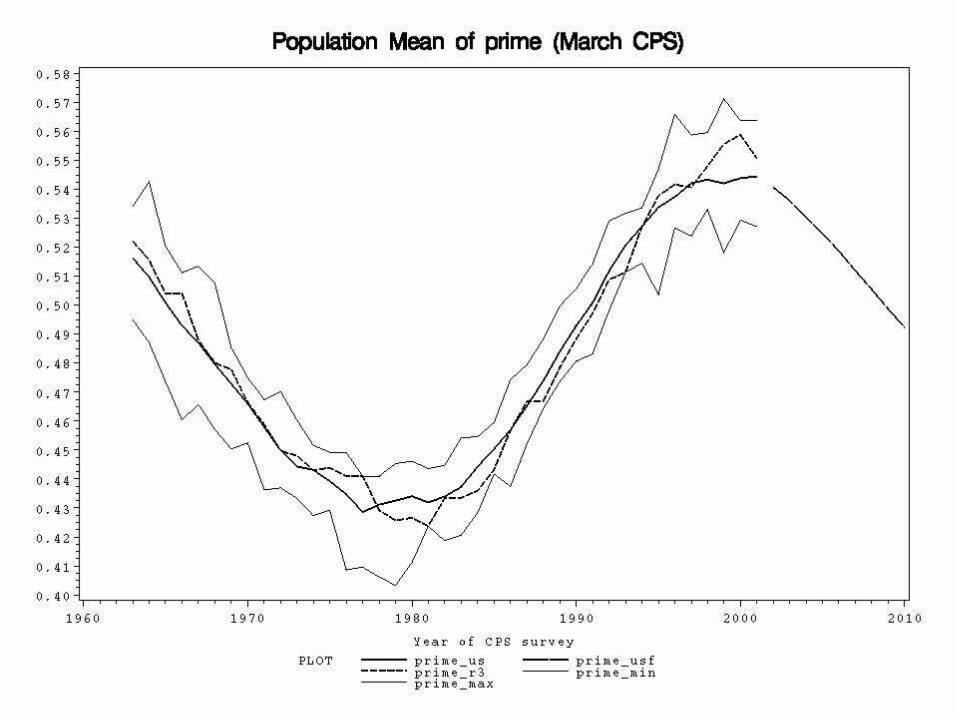
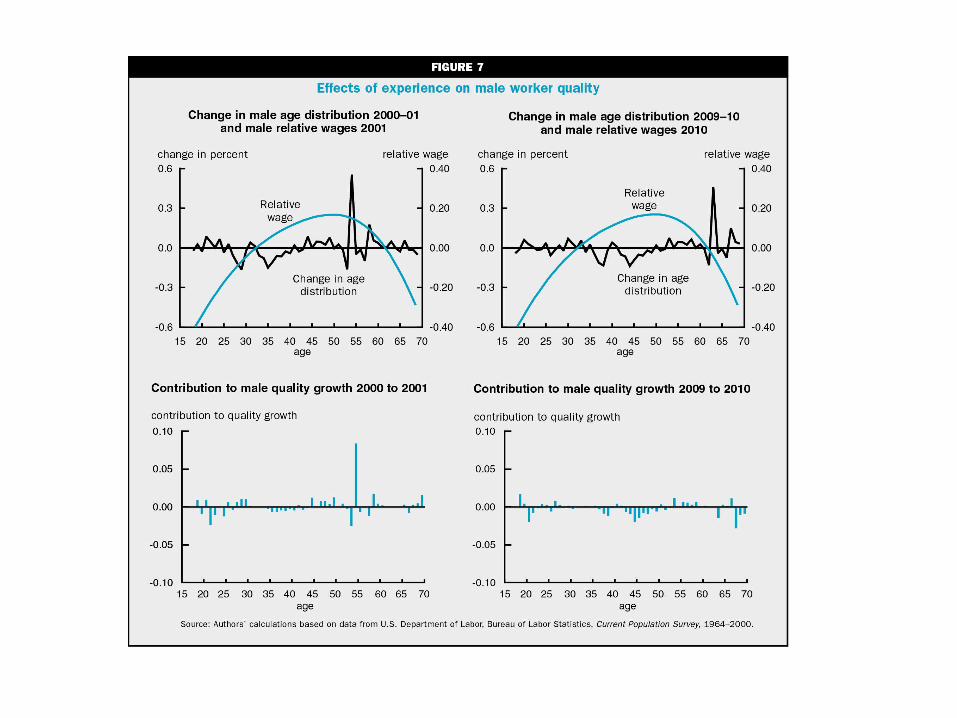
Age Distribution
• Mean is not a sufficient statistic
• Wages first rise, then eventually fall with work experience
• Define– Young: Under 30– Prime age: 30-54– Old: 55 and and up
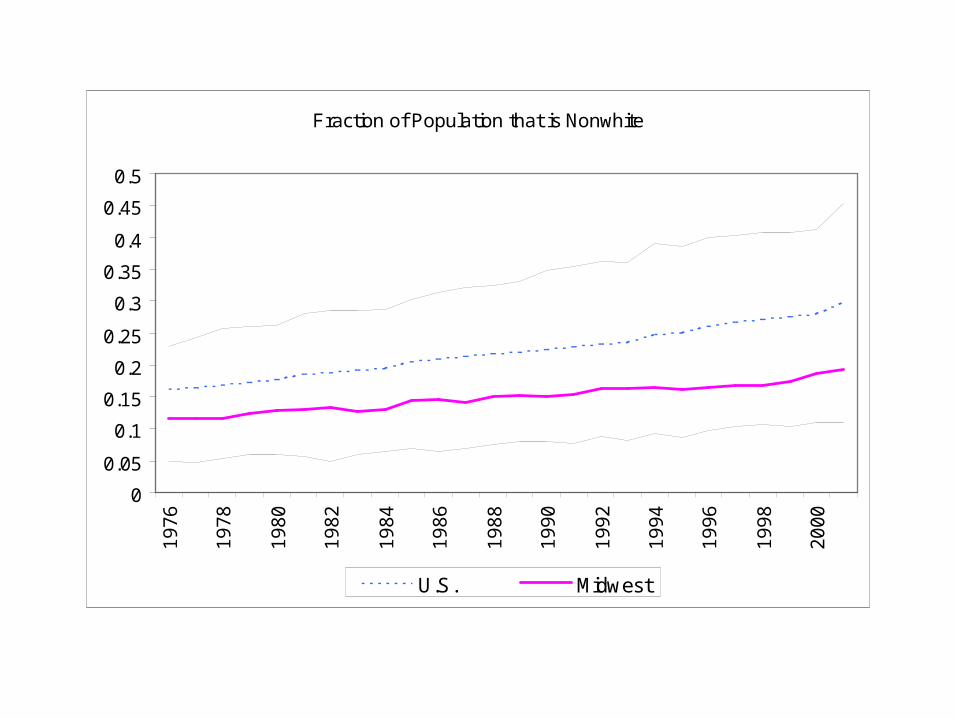
Other Workforce Characteristics
• Rising fraction of work force is female
• Minority share is growing– Midwest has lower share of minorities
• Fraction married is shrinking– Midwest somewhat above average
• Unionization is declining– Midwest much higher than average
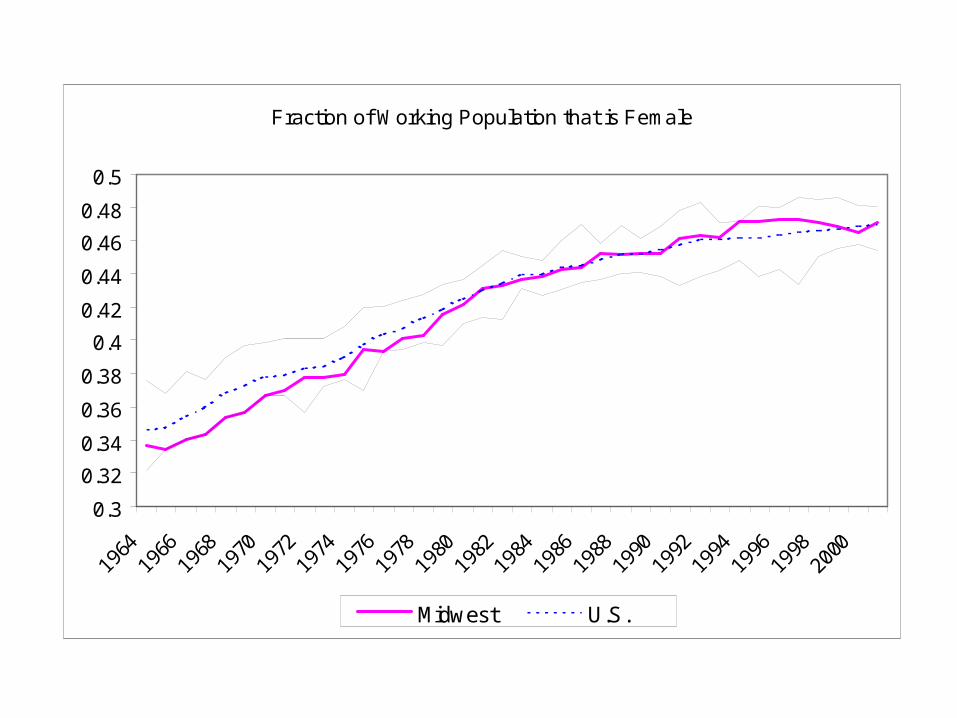
Fraction of Working Population that is Female
0.3
0.32
0.34
0.36
0.38
0.4
0.42
0.44
0.46
0.48
0.5
1964
1966
1968
1970
1972
1974
1976
1978
1980
1982
1984
1986
1988
1990
1992
1994
1996
1998
2000
Midwest U.S.
Fraction of Population that is Nonwhite
0
0.05
0.1
0.15
0.2
0.25
0.3
0.35
0.4
0.45
0.51
97
6
19
78
19
80
19
82
19
84
19
86
19
88
19
90
19
92
19
94
19
96
19
98
20
00
U.S. Midwest
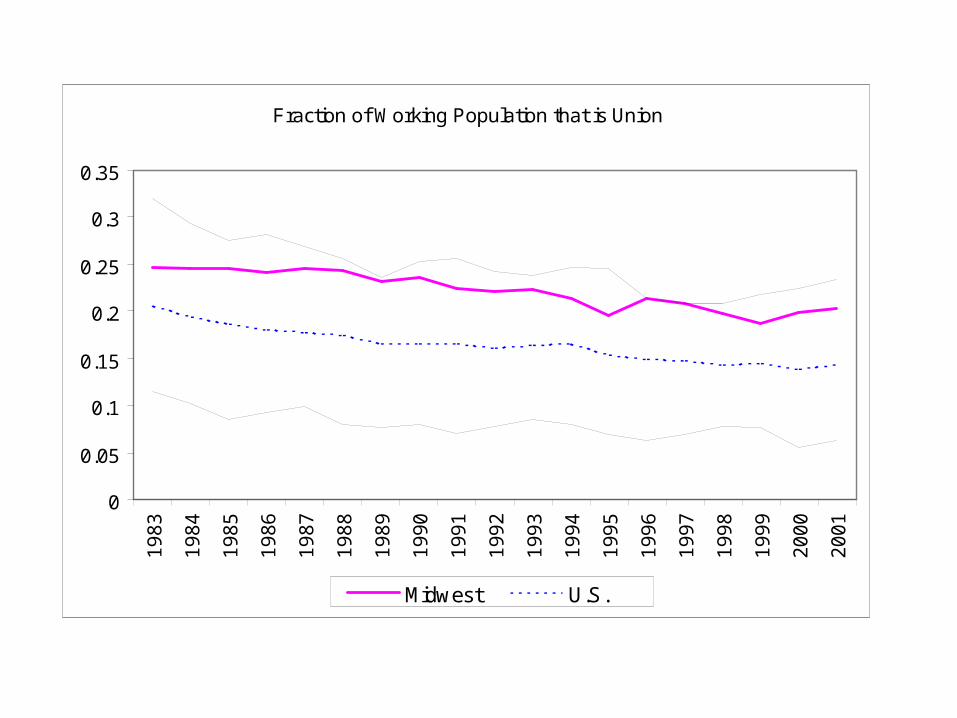
Fraction of Working Population that is Union
0
0.05
0.1
0.15
0.2
0.25
0.3
0.351
98
3
19
84
19
85
19
86
19
87
19
88
19
89
19
90
19
91
19
92
19
93
19
94
19
95
19
96
19
97
19
98
19
99
20
00
20
01
Midwest U.S.
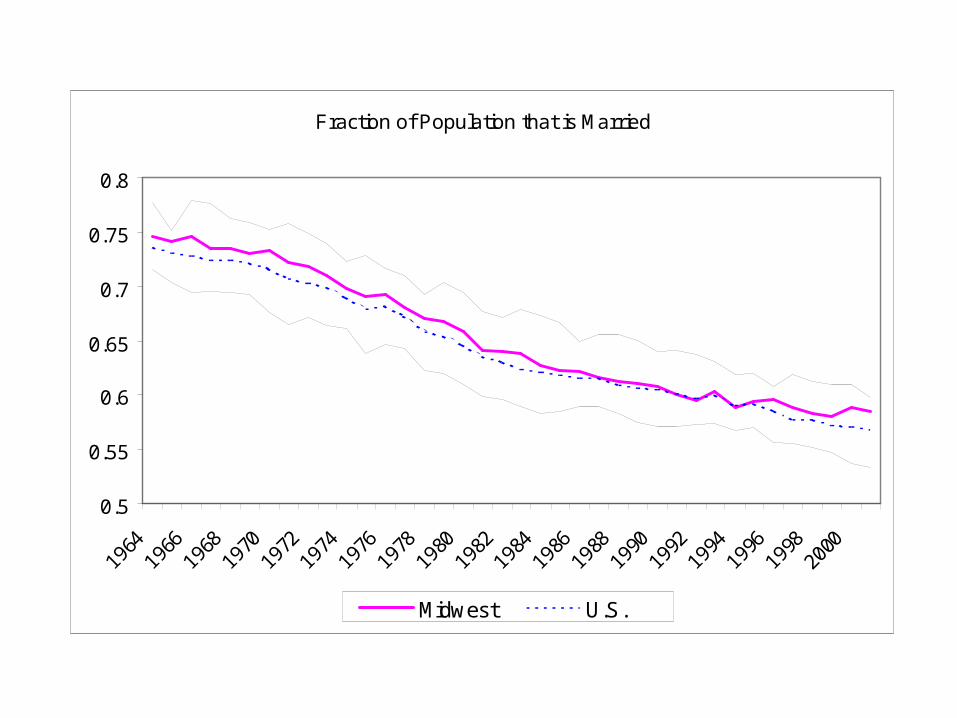
Fraction of Population that is Married
0.5
0.55
0.6
0.65
0.7
0.75
0.8
1964
1966
1968
1970
1972
1974
1976
1978
1980
1982
1984
1986
1988
1990
1992
1994
1996
1998
2000
Midwest U.S.
Labor Quality Methodology
• Estimate regression model for logarithm of wages as a function of– Education (< HS, HS only, Some College,
College, Post-graduate)– Potential experience (Age minus years of
education) interacted with sex– Other variables (Race, Marital status, etc)
Labor Quality Methodology
• Predict wages of sampled workers at time t0 and time t1 using time t0 regression
• Calculate ratio of average predicted wages in the two periods
• Repeat using time t1 regression
• Take geometric average to get growth rate of worker quality from t0 to t1
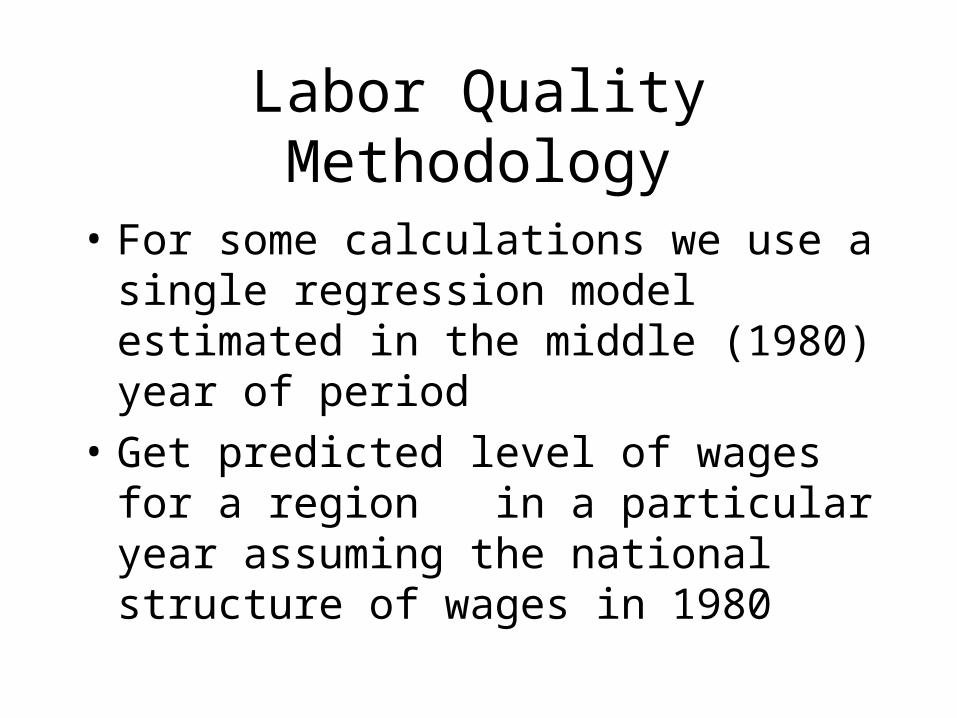
Labor Quality Methodology
• For some calculations we use a single regression model estimated in the middle (1980) year of period
• Get predicted level of wages for a region in a particular year assuming the national structure of wages in 1980
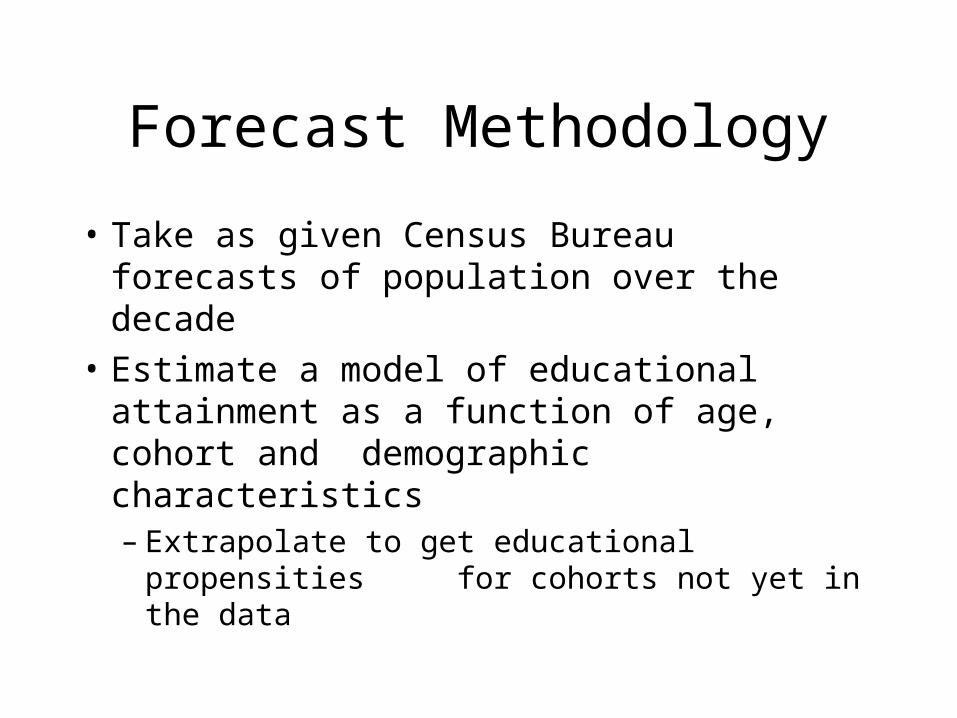
Forecast Methodology
• Take as given Census Bureau forecasts of population over the decade
• Estimate a model of educational attainment as a function of age, cohort and demographic characteristics– Extrapolate to get educational propensities
for cohorts not yet in the data
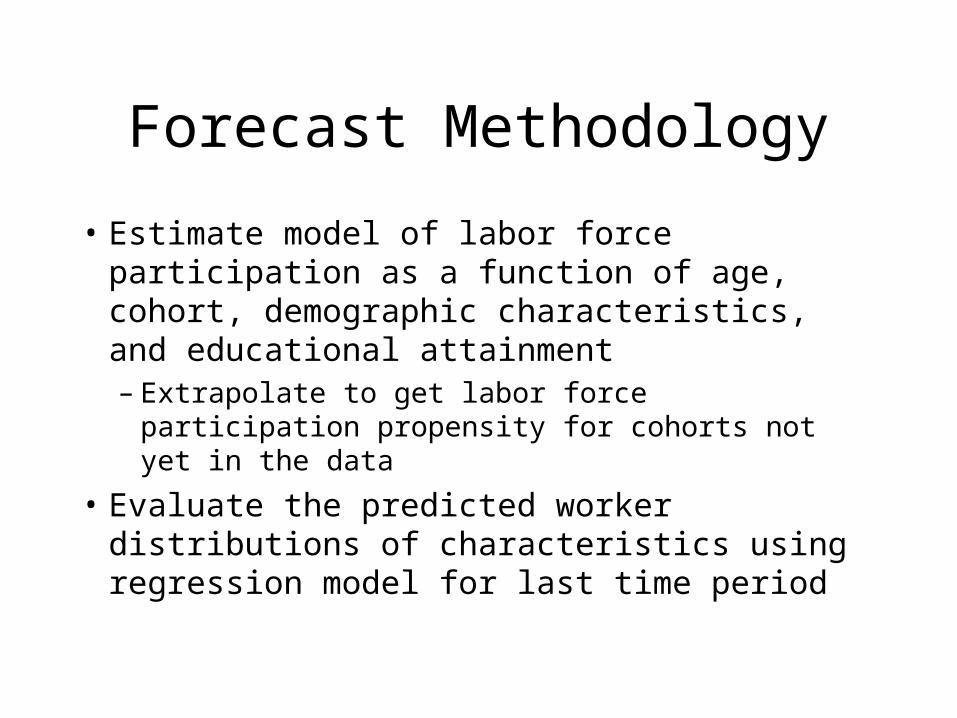
Forecast Methodology
• Estimate model of labor force participation as a function of age, cohort, demographic characteristics, and educational attainment – Extrapolate to get labor force participation
propensity for cohorts not yet in the data
• Evaluate the predicted worker distributions of characteristics using regression model for last time period
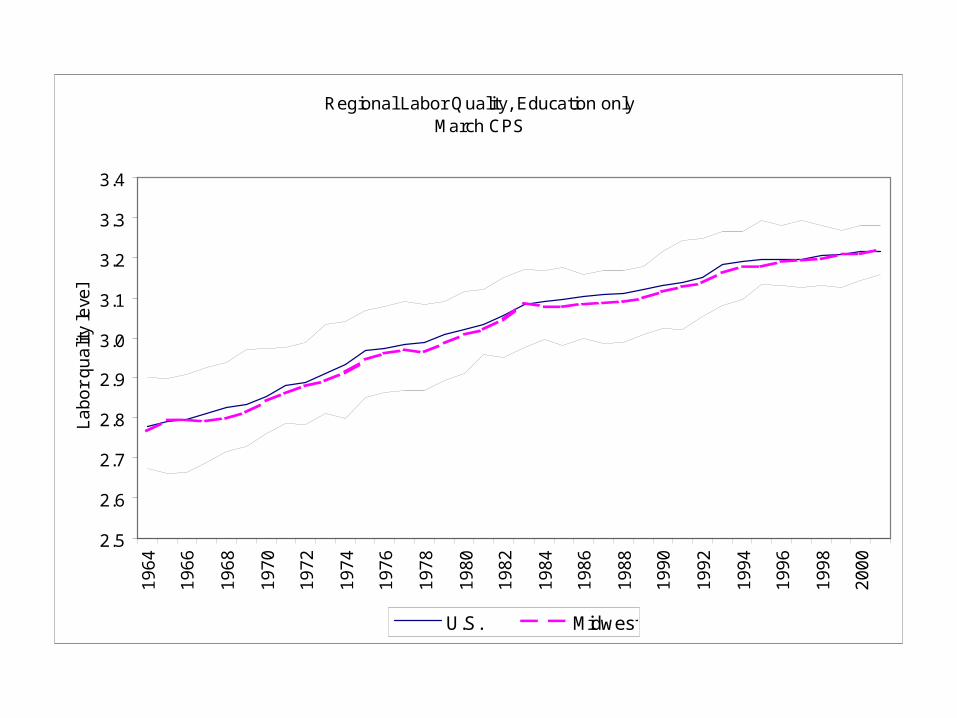
Regional Labor Quality, Education onlyMarch CPS
2.5
2.6
2.7
2.8
2.9
3.0
3.1
3.2
3.3
3.4
19
64
19
66
19
68
19
70
19
72
19
74
19
76
19
78
19
80
19
82
19
84
19
86
19
88
19
90
19
92
19
94
19
96
19
98
20
00
La
bo
r q
ua
lity
leve
l
U.S. Midwest
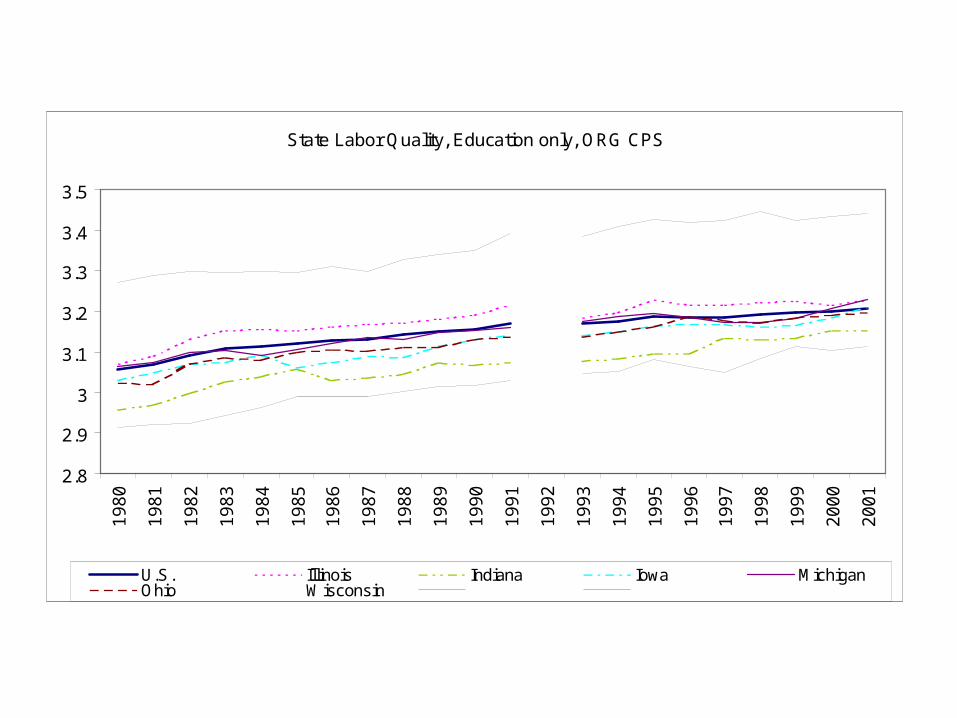
State Labor Quality, Education only, ORG CPS
2.8
2.9
3
3.1
3.2
3.3
3.4
3.5
19
80
19
81
19
82
19
83
19
84
19
85
19
86
19
87
19
88
19
89
19
90
19
91
19
92
19
93
19
94
19
95
19
96
19
97
19
98
19
99
20
00
20
01
U.S. Illinois Indiana Iowa MichiganOhio Wisconsin
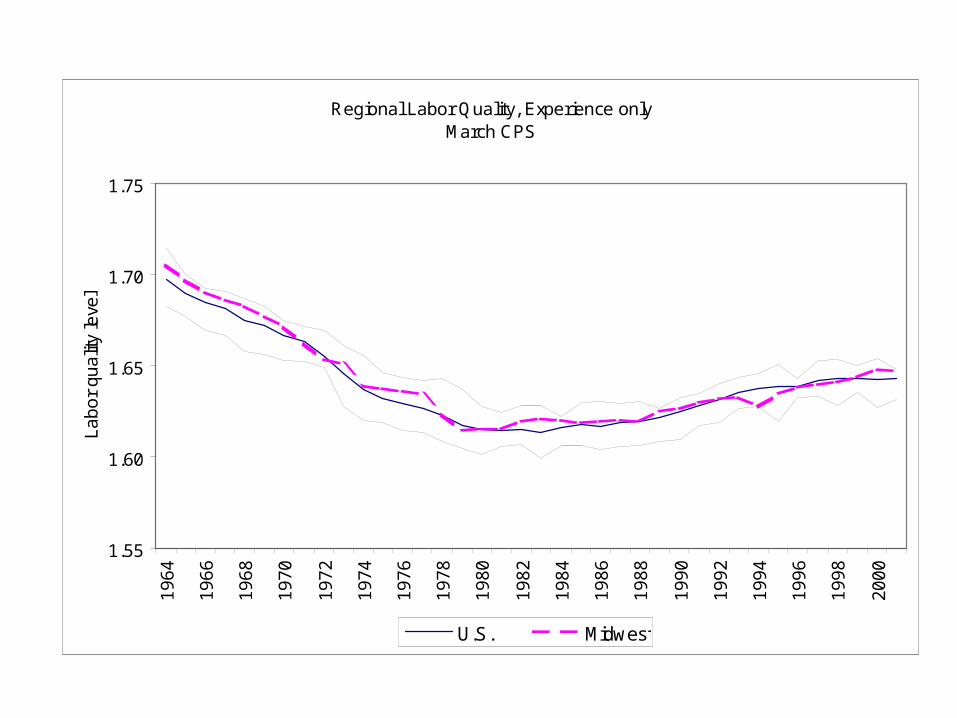
Regional Labor Quality, Experience onlyMarch CPS
1.55
1.60
1.65
1.70
1.751
96
4
19
66
19
68
19
70
19
72
19
74
19
76
19
78
19
80
19
82
19
84
19
86
19
88
19
90
19
92
19
94
19
96
19
98
20
00
La
bo
r q
ua
lity
leve
l
U.S. Midwest
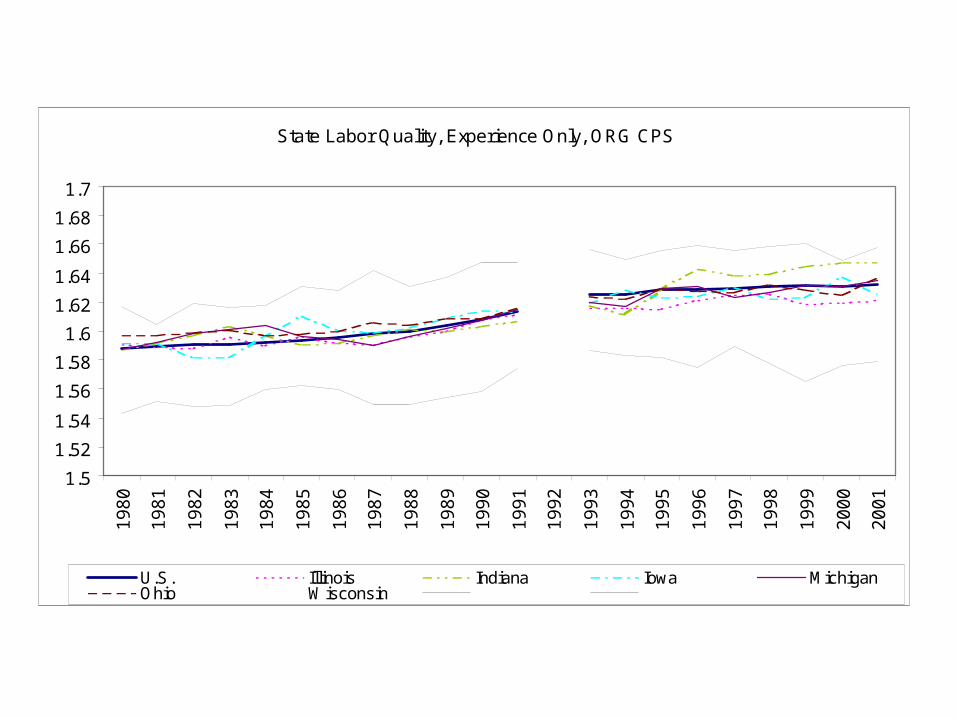
State Labor Quality, Experience Only, ORG CPS
1.5
1.52
1.54
1.56
1.58
1.6
1.62
1.64
1.66
1.68
1.7
19
80
19
81
19
82
19
83
19
84
19
85
19
86
19
87
19
88
19
89
19
90
19
91
19
92
19
93
19
94
19
95
19
96
19
97
19
98
19
99
20
00
20
01
U.S. Illinois Indiana Iowa MichiganOhio Wisconsin
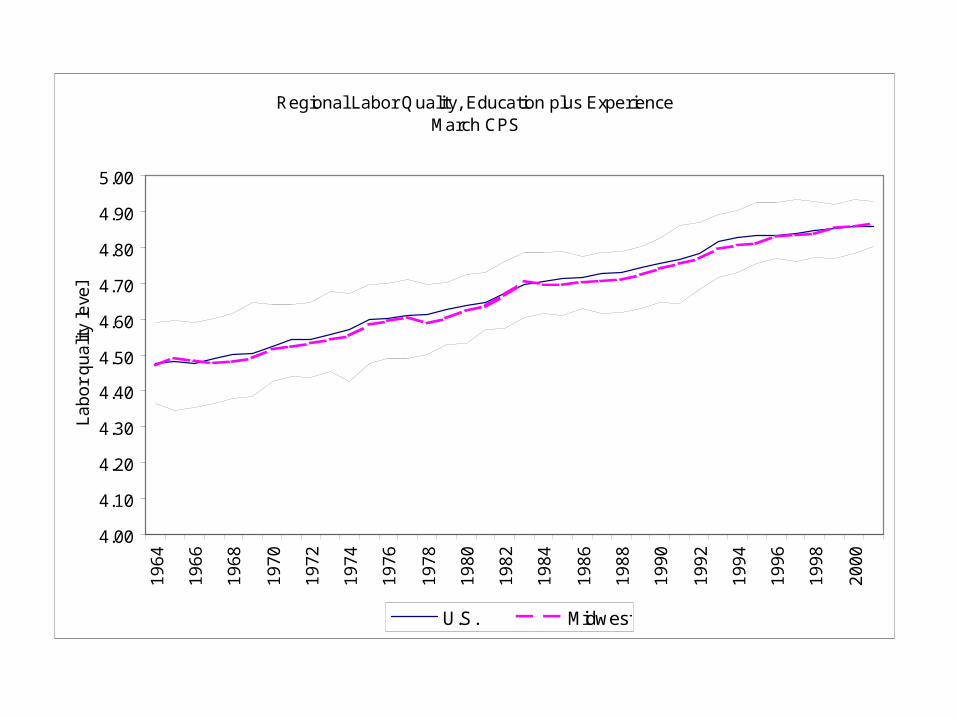
Regional Labor Quality, Education plus ExperienceMarch CPS
4.00
4.10
4.20
4.30
4.40
4.50
4.60
4.70
4.80
4.90
5.001
96
4
19
66
19
68
19
70
19
72
19
74
19
76
19
78
19
80
19
82
19
84
19
86
19
88
19
90
19
92
19
94
19
96
19
98
20
00
La
bo
r q
ua
lity
leve
l
U.S. Midwest
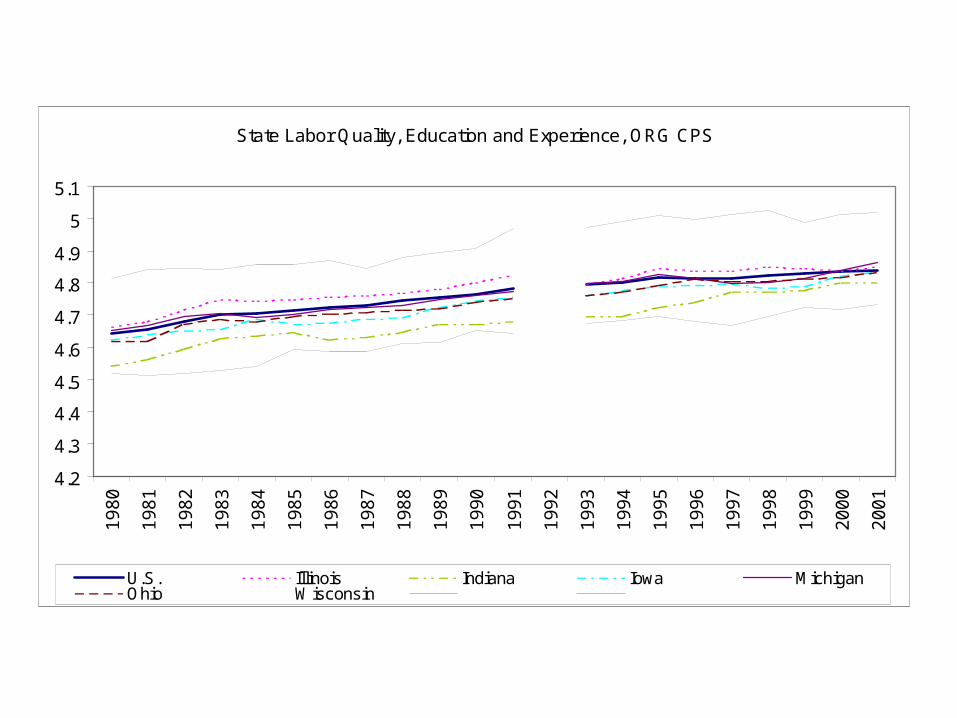
State Labor Quality, Education and Experience, ORG CPS
4.2
4.3
4.4
4.5
4.6
4.7
4.8
4.9
5
5.1
19
80
19
81
19
82
19
83
19
84
19
85
19
86
19
87
19
88
19
89
19
90
19
91
19
92
19
93
19
94
19
95
19
96
19
97
19
98
19
99
20
00
20
01
U.S. Illinois Indiana Iowa MichiganOhio Wisconsin
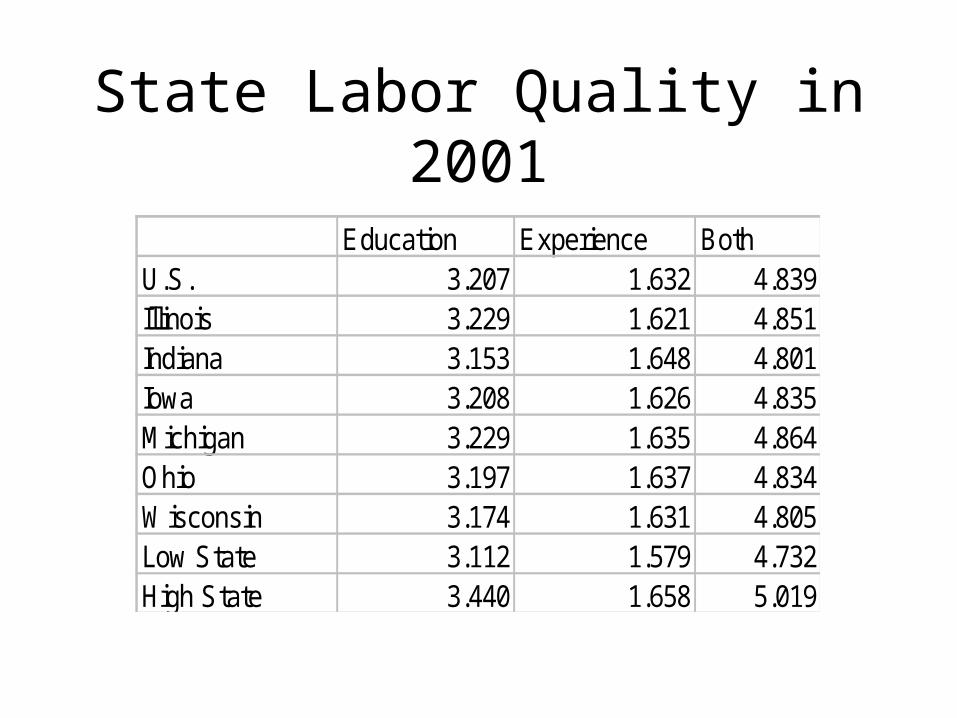
State Labor Quality in 2001
Education Experience BothU.S. 3.207 1.632 4.839Illinois 3.229 1.621 4.851Indiana 3.153 1.648 4.801Iowa 3.208 1.626 4.835Michigan 3.229 1.635 4.864Ohio 3.197 1.637 4.834Wisconsin 3.174 1.631 4.805Low State 3.112 1.579 4.732High State 3.440 1.658 5.019
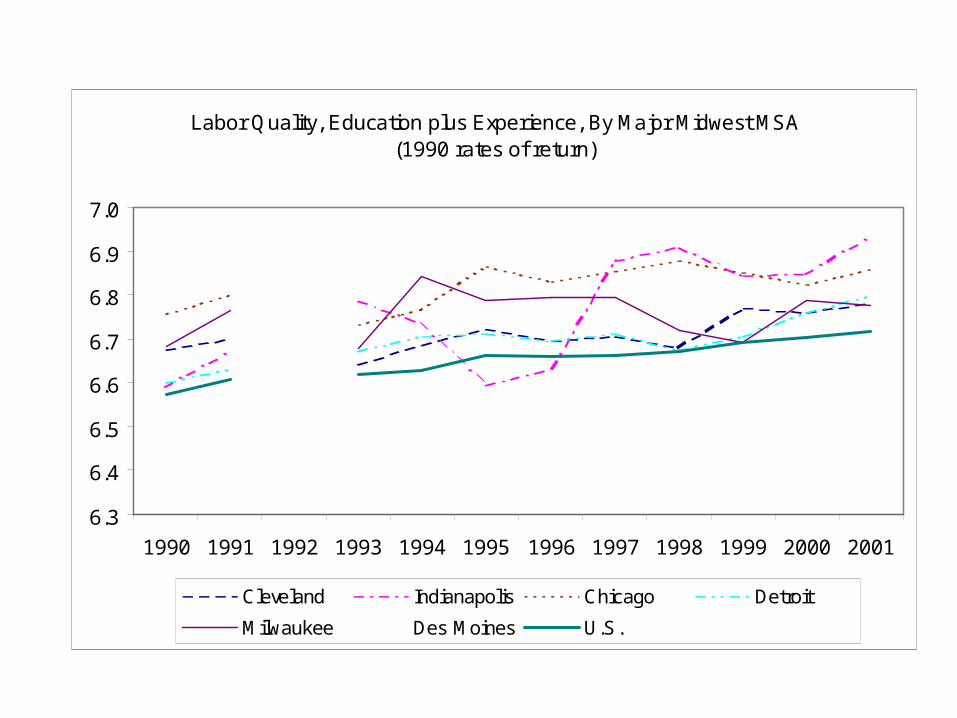
Labor Quality, Education plus Experience, By Major Midwest MSA(1990 rates of return)
6.3
6.4
6.5
6.6
6.7
6.8
6.9
7.0
1990 1991 1992 1993 1994 1995 1996 1997 1998 1999 2000 2001
Cleveland Indianapolis Chicago Detroit
Milwaukee Des Moines U.S.
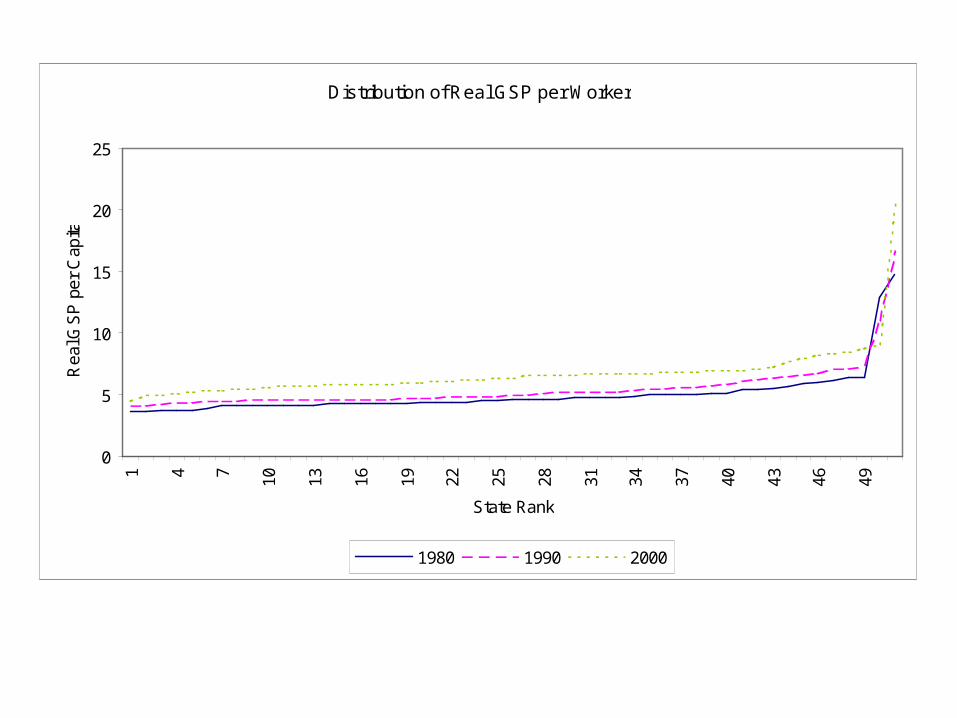
Distribution of Real GSP per Worker
0
5
10
15
20
251 4 7 10 13 16 19 22 25 28 31 34 37 40 43 46 49
State Rank
Rea
l GS
P p
er C
apita
1980 1990 2000
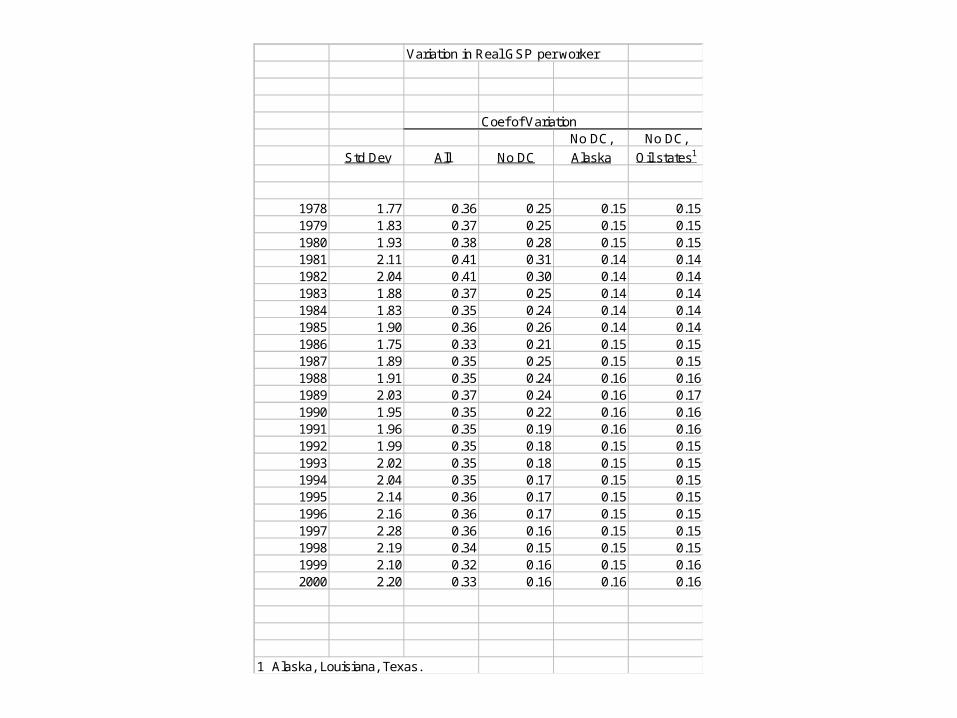
Variation in Real GSP per worker
Coef of VariationNo DC, No DC,
Std Dev All No DC Alaska Oil states1
1978 1.77 0.36 0.25 0.15 0.151979 1.83 0.37 0.25 0.15 0.151980 1.93 0.38 0.28 0.15 0.151981 2.11 0.41 0.31 0.14 0.141982 2.04 0.41 0.30 0.14 0.141983 1.88 0.37 0.25 0.14 0.141984 1.83 0.35 0.24 0.14 0.141985 1.90 0.36 0.26 0.14 0.141986 1.75 0.33 0.21 0.15 0.151987 1.89 0.35 0.25 0.15 0.151988 1.91 0.35 0.24 0.16 0.161989 2.03 0.37 0.24 0.16 0.171990 1.95 0.35 0.22 0.16 0.161991 1.96 0.35 0.19 0.16 0.161992 1.99 0.35 0.18 0.15 0.151993 2.02 0.35 0.18 0.15 0.151994 2.04 0.35 0.17 0.15 0.151995 2.14 0.36 0.17 0.15 0.151996 2.16 0.36 0.17 0.15 0.151997 2.28 0.36 0.16 0.15 0.151998 2.19 0.34 0.15 0.15 0.151999 2.10 0.32 0.16 0.15 0.162000 2.20 0.33 0.16 0.16 0.16
1 Alaska, Louisiana, Texas.
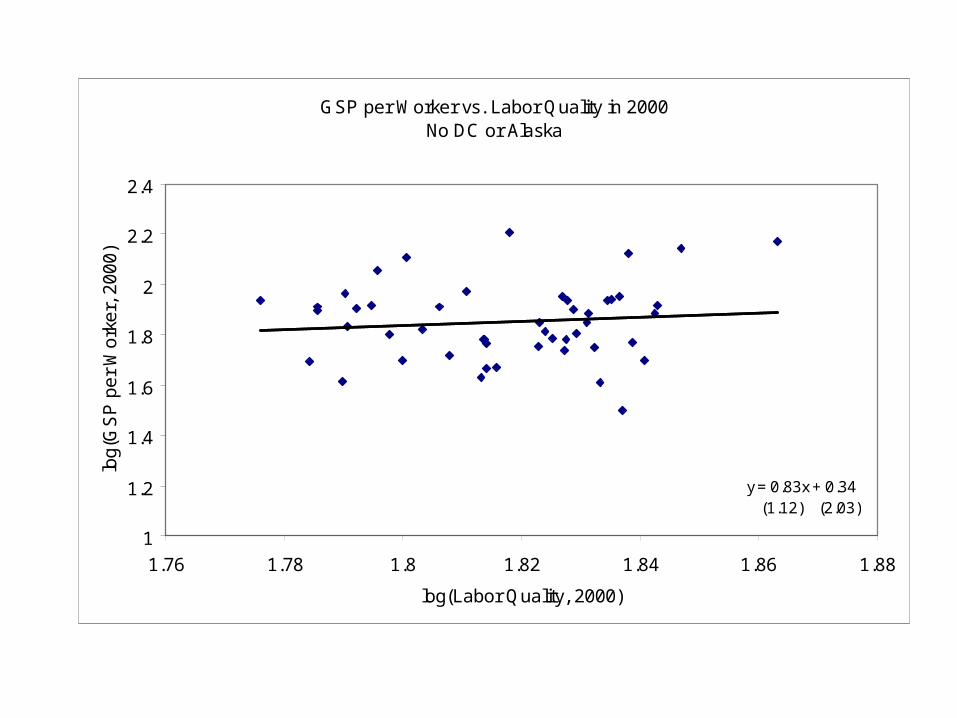
GSP per Worker vs. Labor Quality in 2000No DC or Alaska
y = 0.83x + 0.34 (1.12) (2.03)
1
1.2
1.4
1.6
1.8
2
2.2
2.4
1.76 1.78 1.8 1.82 1.84 1.86 1.88
log(Labor Quality, 2000)
log
(GS
P p
er
Wo
rke
r, 2
00
0)
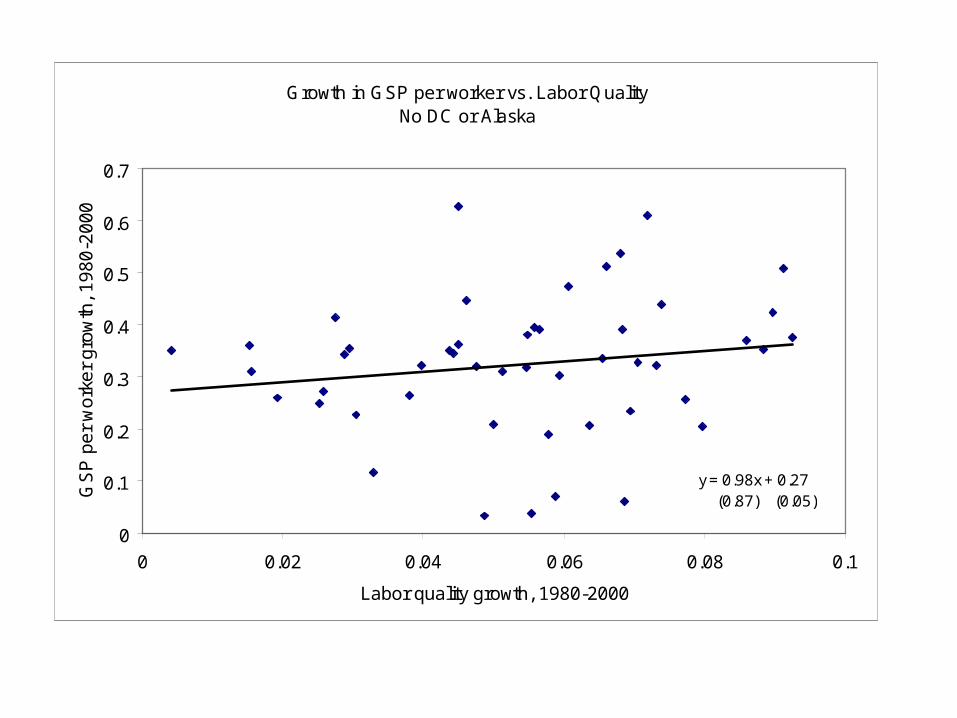
Growth in GSP per worker vs. Labor QualityNo DC or Alaska
y = 0.98x + 0.27 (0.87) (0.05)
0
0.1
0.2
0.3
0.4
0.5
0.6
0.7
0 0.02 0.04 0.06 0.08 0.1
Labor quality growth, 1980-2000
GS
P p
er
wo
rke
r g
row
th,
19
80
-20
00
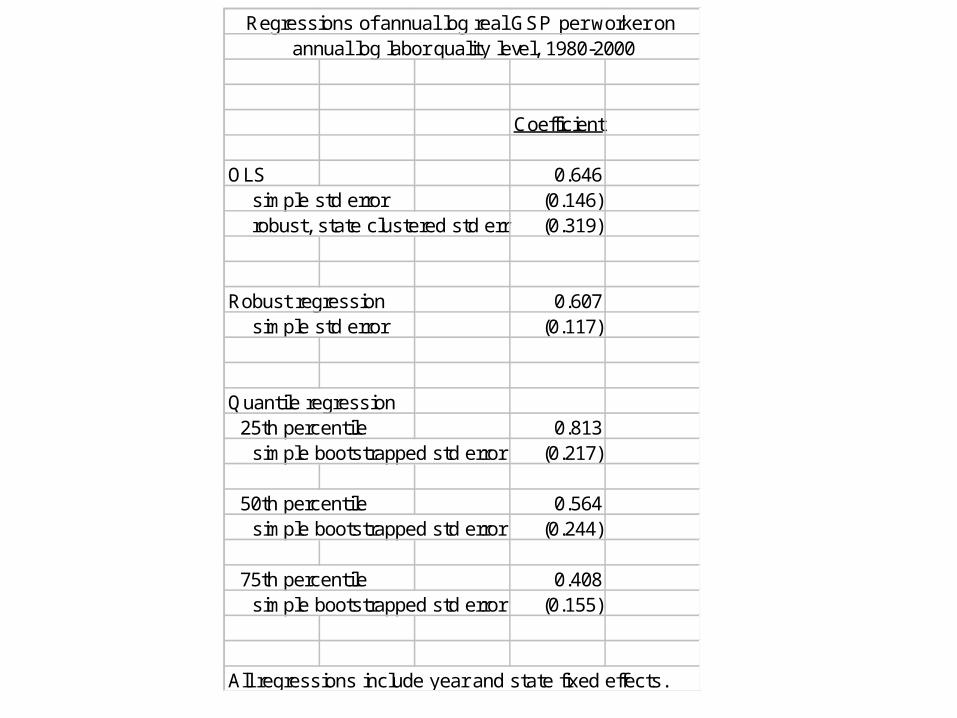
Regressions of annual log real GSP per worker on annual log labor quality level, 1980-2000
Coefficient
OLS 0.646 simple std error (0.146) robust, state clustered std err (0.319)
Robust regression 0.607 simple std error (0.117)
Quantile regression 25th percentile 0.813 simple bootstrapped std error (0.217)
50th percentile 0.564 simple bootstrapped std error (0.244)
75th percentile 0.408 simple bootstrapped std error (0.155)
All regressions include year and state fixed effects.
Summary
• Worker quality growth is slowing due to less favorable demographic trends
• Midwest as a whole very similar to the U.S.
• (Very) modest evidence of the importance of worker quality for gross state product