recent studies on nutritional factors affecting … studies on nutritional factors affecting...
TRANSCRIPT

ARIZONA AND NEW MEXICODAIRY NEWSLETTER
COOPERATIVE EXTENSIONThe University of Arizona
New Mexico State University
MAY 2007
THIS MONTH’S ARTICLE:
Recent studies on nutritional factors affecting reproductive efficiency in
U.S. dairy herds.Milo C. Wiltbank, Kent A. Weigel, Daniel Z. CaravielloDepartment of Dairy Science, 1685 Observatory Drive
University of Wisconsin-MadisonMadison WI [email protected]
(Reprinted from Proceedings of the 8th Western Dairy ManagementConference, Reno, Nevada, Marcy 7-9, 2007)

Recent studies on nutritional factors affecting reproductive efficiency in U.S. dairy herds.
Milo C. Wiltbank, Kent A. Weigel, Daniel Z. Caraviello Department of Dairy Science, 1685 Observatory Drive
University of Wisconsin-Madison Madison WI 53706 [email protected]
Introduction
Reproductive efficiency is declining on U.S. dairy herds. There are numerous factors that affect reproductive efficiency on individual farms. These include heat detection rate, heat stress, semen quality, bull fertility, AI technique, nutrition, body condition score, clinical and subclinical mastitis, cow comfort, and many other factors related to whole farm management, individual farm managers and laborers, and individual cows. This manuscript will briefly summarize 2 recent research areas. The first section of the manuscript discusses a recent study on body condition score. This study was part of a larger study that evaluated numerous factors simultaneously to determine the management factors most related to reproductive performance (Caraviello et al., 2006). This study used a machine learning technique to simultaneously evaluate numerous factors (341 different variables) that may be affecting reproductive efficiency on U.S. dairies. Interestingly, one of the top factors that was found to be closely associated with reproductive performance was the amount of bunk-space per cow in the breeding pen. The predicted percentage of cows that were pregnant by 150 days tended to increase linearly as bunk space increased from 30 to 60 cm (from 35% to 70%). Thus, cows that were overcrowded (<36 cm of bunk space/cow) had a much lower percentage of cows that were pregnant at 150 days in milk than cows with more bunk space. Another factor that was closely related to reproductive efficiency was body condition score. This part of the study will be discussed in more depth in section II below. In addition, milk production was found to be associated with reproductive efficiency in a fairly complex manner. Section III of this manuscript is based on recent research in our laboratory that has found an intriguing biological link between high feed consumption and reproductive efficiency caused by elevated metabolism of hormones. While this elevated hormone metabolism does not explain all aspects of nutritional effects on reproduction in dairy cows, it is becoming clear that hormone metabolism is a key missing link between high milk production and certain changes in reproductive efficiency such as decreased expression of estrus. Body Condition Score (BCS) and Reproductive Performance There is substantial evidence linking BCS to reproductive performance in dairy cows. Pryce et al. (2000), evaluating records from 44,674 first lactation cows, found that BCS at 1 mo after parturition had estimated genetic correlations with calving interval of -0.40 and -0.22, before and after adjusting for milk yield, respectively. They also reported that, although the change in BCS between 1 mo and 4 mo postpartum had a high genetic correlation with fertility, the average or absolute BCS for a given cow had an even stronger relationship with fertility. These authors indicated that a single BCS measured early in lactation could be used as an indirect selection criterion for fertility. Other authors have also reported a genetic relationship between BCS and fertility (Dechow et al., 2004; Pryce et al., 2001).
Western Dairy Management Conference
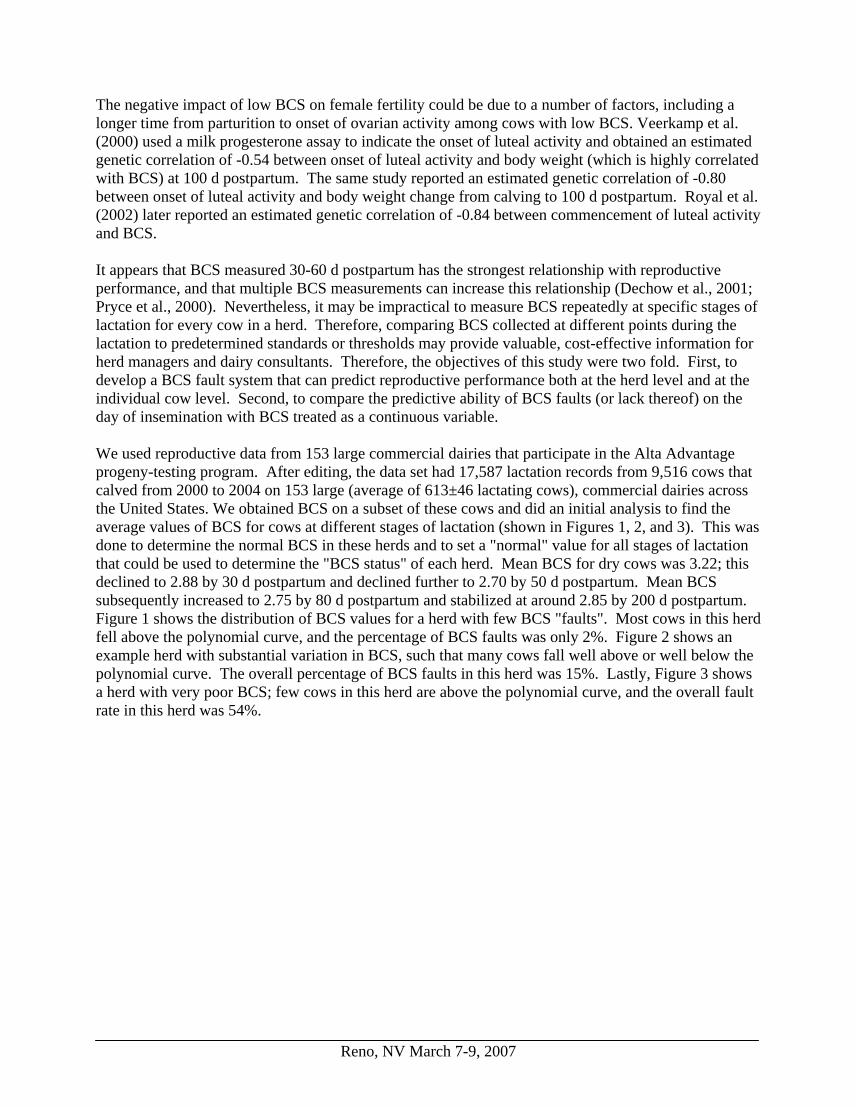
The negative impact of low BCS on female fertility could be due to a number of factors, including a longer time from parturition to onset of ovarian activity among cows with low BCS. Veerkamp et al. (2000) used a milk progesterone assay to indicate the onset of luteal activity and obtained an estimated genetic correlation of -0.54 between onset of luteal activity and body weight (which is highly correlated with BCS) at 100 d postpartum. The same study reported an estimated genetic correlation of -0.80 between onset of luteal activity and body weight change from calving to 100 d postpartum. Royal et al. (2002) later reported an estimated genetic correlation of -0.84 between commencement of luteal activity and BCS. It appears that BCS measured 30-60 d postpartum has the strongest relationship with reproductive performance, and that multiple BCS measurements can increase this relationship (Dechow et al., 2001; Pryce et al., 2000). Nevertheless, it may be impractical to measure BCS repeatedly at specific stages of lactation for every cow in a herd. Therefore, comparing BCS collected at different points during the lactation to predetermined standards or thresholds may provide valuable, cost-effective information for herd managers and dairy consultants. Therefore, the objectives of this study were two fold. First, to develop a BCS fault system that can predict reproductive performance both at the herd level and at the individual cow level. Second, to compare the predictive ability of BCS faults (or lack thereof) on the day of insemination with BCS treated as a continuous variable. We used reproductive data from 153 large commercial dairies that participate in the Alta Advantage progeny-testing program. After editing, the data set had 17,587 lactation records from 9,516 cows that calved from 2000 to 2004 on 153 large (average of 613±46 lactating cows), commercial dairies across the United States. We obtained BCS on a subset of these cows and did an initial analysis to find the average values of BCS for cows at different stages of lactation (shown in Figures 1, 2, and 3). This was done to determine the normal BCS in these herds and to set a "normal" value for all stages of lactation that could be used to determine the "BCS status" of each herd. Mean BCS for dry cows was 3.22; this declined to 2.88 by 30 d postpartum and declined further to 2.70 by 50 d postpartum. Mean BCS subsequently increased to 2.75 by 80 d postpartum and stabilized at around 2.85 by 200 d postpartum. Figure 1 shows the distribution of BCS values for a herd with few BCS "faults". Most cows in this herd fell above the polynomial curve, and the percentage of BCS faults was only 2%. Figure 2 shows an example herd with substantial variation in BCS, such that many cows fall well above or well below the polynomial curve. The overall percentage of BCS faults in this herd was 15%. Lastly, Figure 3 shows a herd with very poor BCS; few cows in this herd are above the polynomial curve, and the overall fault rate in this herd was 54%.
Reno, NV March 7-9, 2007

Mean Threshold
Figure 1. Scatter plot for an example herd with above average body condition scores (BCS). The lines indicate the calculated mean (fourth degree polynomial) of BCS at different times postpartum for all herds in the study, and the threshold developed on this study. Each box represents the BCS for an individual cow.
Threshold Mean
Figure 2. Scatter plot for an example herd with intermediate average, and tremendous variation, for body condition scores (BCS). The lines indicate the calculated mean (fourth degree polynomial) of BCS at different times postpartum for all herds in the study, and the threshold developed on this study. Each box represents the BCS for an individual cow.
Western Dairy Management Conference

Figure 3. Scatter plot for an example herd with below average body condition scores (BCS). The lines indicate the calculated mean (fourth degree polynomial) of BCS at different times postpartum for all herds in the study, and the threshold developed on this study. Each box represents the BCS for an individual cow. The herds in this study ranged from nearly 0% to more than 60% BCS faults. The relationship between percentage of BCS faults and reproductive performance was evaluated at the herd level by comparing herd BCS status with the percentage of cows pregnant by 150 d postpartum. Pregnancy status at 150 d postpartum was chosen as the dependent variable, because, as discussed above, it is a robust measure of overall herd reproductive performance. In addition to the herd level analysis, we also evaluated BCS status at the individual cow level by comparing pregnancy status at 150 d and conception rate at first service with the presence or absence of a BCS fault for an individual cow. Application of a logistic regression model at the herd level showed that the proportion of cows pregnant by 150 d postpartum decreased linearly as the percentage of BCS faults increased (Fig 4). The probability of pregnancy by 150 d postpartum was 0.80 for herds with 15% BCS faults, as compared with 0.53 for herds with >45% BCS faults.
Reno, NV March 7-9, 2007

Percentage of faults in early lactation
0.15 0.20 0.25 0.30 0.35 0.40 0.45 0.50
Pro
babi
lity
of b
eing
pre
gnan
t at 1
50 d
ays
0.50
0.55
0.60
0.65
0.70
0.75
0.80
0.85
Figure 4. Probability of pregnancy by 150 d postpartum according to percentage of BCS faults in the herd. The plot is calculated from the logistic regression using lactation number = 1.5 and maximum daily temperature = 85 ºF. Cow level evaluation of the relationship between BCS faults and probability of pregnancy by 150 d postpartum confirmed trends that were observed at the herd level. Individual cows with BCS faults had significantly (P < 0.05) lower probability of becoming pregnant by 150 d postpartum (0.61) than cows without faults (0.74). Thus, we have developed a simple system to separate herds according to BCS status determined at a single farm visit. This BCS "fault" system can be used to identify herds in which BCS problems may be the cause of poor overall reproductive performance. Alternatively, herds can be identified in which BCS faults should not be viewed as a likely cause of poor reproductive performance and therefore other areas should be examined. High feed consumption and reproductive efficiency are linked by high hormone metabolism. This section of the manuscript will not attempt to review all of the nutritional factors that can potentially alter reproductive efficiency in dairy cattle. This has been reviewed in numerous other publications and would require a complete volume for adequate review. We will focus on a critical link that has become increasingly relevant to our understanding of nutrition and reproduction. This link is very different from the link discussed above concerning BCS and reproduction. Negative energy balance and the resulting low BCS cause a delay in the time to first ovulation and thus increase the percentage of cows that are anovular (not ovulating). The increased percentage of anovular cows is not
Western Dairy Management Conference

clearly tied to milk production in most studies. However, there are other key reproductive efficiency measures that are clearly related to milk production. This review will focus on 2 key reproductive measures, efficiency of heat detection and double ovulation rate. These are chosen because of the clear relationship to milk production. We will use these measures to build a model for how reproductive efficiency can be dramatically altered by the high feed consumption associated with high milk production. These 2 measures are used to clearly demonstrate the physiological model that can explain the relationship between high feed consumption and decreased reproductive efficiency. However, this model becomes much more complicated when trying to explain a much more complex reproductive variable such as conception rate. Nevertheless, it seems likely that this model will also be important in explaining some aspects of this variable as well.
Duration of estrus. It is clear that low rates of estrous detection are reducing reproductive efficiency on commercial dairy farms. Indeed, Washburn et al., 2002 reported a decrease from 50.9% in 1985 to 41.5% in 1999 for estrous detection rates in Holstein dairy herds in Southeastern U.S.A. However, studies have reported both a negative relationship between level of milk production (Harrison et al., 1990; Harrison et al., 1989) or no relationship (Fonseca et al., 1983; VanEerdenburg et al., 2002) using visual observation twice daily to measure expression of estrus. We have recently completed a study in which we evaluated the duration of estrus in a group of lactating dairy cows using the HeatWatch system (Lopez et al., 2004). This system allowed continuous monitoring of all mounts 24 h per day and can be used to calculate the duration of estrus in individual dairy cows. Cows with milk production above the herd average (~ 40 kg/d) had shorter (P < 0.001) duration of estrus (6.2 ± 0.5 h) than cows with lower milk production (10.9 ± 0.7 h). This effect was not due to a parity effect because separate analysis of primiparous and multiparous cows showed a similar effect. Fig. 5 shows the relationship between level of milk production and duration of estrus. In order to consistently observe this strong negative relationship between level of milk production and duration of estrus, it is critical that milk production data be collected close to the time of estrus, only data from ovulations after the first postpartum ovulation be utilized (first ovulation has low expression of estrus), all ovulations be consistently monitored throughout the observation period (to avoid false estrus or missing data from ovulations), and that duration of estrus be monitored on a continuous basis with an electronic heat monitoring system.
Reno, NV March 7-9, 2007

0.0
Dur
atio
n of
est
rus
(h)
2.0
4.0
6.0
8.0
10.0
12.0
14.0
16.0
14.7n=25
9.6n=65
6.3n=94 4.8
n=735.1
n=562.8
n=37
Milk production (lbs/d)55 66 8877 99 111 122
Figure 5. Relationship between level of milk production and duration of estrus. Analysis included all single ovulations (n = 350) except first post-partum ovulations. Average milk production is for the 10 d before estrus [From Lopez et al., 2004]. As discussed below, we theorize that high milk production leads to decreased circulating estradiol concentrations producing decreased duration of estrus. Decreased estradiol could also cause increased follicular size by delaying the time to estradiol-induction of estrus, GnRH/LH surge, and ovulation in high-producing cows. Double ovulation rate. Another reproductive trait that has been directly linked to milk production is double ovulation rate (for a more complete review see (Lopez et al., 2005; Wiltbank et al., 2000). From a practical standpoint, double ovulation rate appears to be the underlying cause of increased twinning rate in lactating dairy cows, with 93% of twins being non-identical (Silva Del Rio et al., 2004). Numerous factors have been recognized as possible regulators of twinning rates, including age of dam, season, genetics, use of reproductive hormones or antibiotics, ovarian cysts, days open, and peak milk production [reviewed in Wiltbank et al., 2002]. In a large study on risk factors for twinning, Kinsel et al., 1998 concluded, "the single largest contributor (> 50%) to the recent increase in the rate of twinning is the increase in peak milk production". We performed a study in which we evaluated double ovulation rate in 240 dairy cows (Fricke et al., 1999) that had ovulation synchronized with the Ovsynch protocol. Ovulation was determined by transrectal ultrasonography at the time of the second GnRH injection and 48 h later. The mean milk production, determined 3 d before ovulation, was 40.7 ± 0.8 kg/d and cows were segregated by whether they were below or above the mean value. Double ovulation rate in cows that were above average production was 20.2% compared to 6.9% in those below average (P < 0.05). This difference was similar regardless of lactation number. Recently, we reported results of a study (Lopez et al., 2005) that evaluated naturally ovulating dairy cattle and found a similar relationship between milk production
Western Dairy Management Conference

Reno, NV March 7-9, 2007
and double ovulation rate (Fig. 6). Cows that produced less than 40 kg/d had a very low double ovulation rate, whereas, cows producting above 50 kg/d had more than a 50% double ovulation rate. It is surprising that there is such a dramatic inflection point in double ovulation rate as milk production increases above 40 kg/d, and it is still unclear what physiological changes occur as milk production increases above this critical value. This increase in double ovulation rate is likely to continue to increase twinning rate in dairy herds as milk production increases. It is also clear that this effect of milk production is most related to the level of production within the 2 wk before the cow ovulates, and not to total milk production during the entire lactation. This effect was also similar when a more extensive regression model was used for analysis, and when multiparous and primiparous cows were analyzed separately (Lopez et al., 2005). As with duration of estrus, the first postpartum ovulation differed from other ovulations with a high double ovulation rate that was unrelated to milk production.
igure 6. Relationship between incidence of multiple ovulation and milk production. Analysis included
ow does high milk production change duration of estrus or double ovulation rate?
e have synthesized a good deal of information into a model that we think helps explain some of the
3
low
is
Fall ovulations (n = 463) except first post-partum ovulations. Average milk production is for the 14 d before estrus [From Lopez et al., 2005]. H Wchanges in reproduction due to high milk production (Fig. 7). Lactating cows have greater energy requirements than non-lactating cows (for example, a cow producing 50 kg/d of milk will require 5Mcal/d of energy vs 12.5 Mcal/d for a non-lactating cow; NRC, 2001). The high feed consumption required to meet these energy requirements leads to a dramatic increase in blood flowing to the digestive tract to pick up these nutrients. All blood that flows through the digestive tract has to fthrough the liver. Therefore, there will be a very high amount of blood flowing to the liver in cows with high feed consumption (such as high producing dairy cows). This may seem trivial but the liverthe organ that rids the body of many compounds including hormones like progesterone and estrogen. Therefore, high feed consumption, through this simple pathway, will lead to a very high amount of theestrogen and progesterone in the body being metabolized (broken down) in the liver. This would cause
0.0
10.0
20.0
30.0
40.0
50.0
60.0
70.0
0(0/30)
2.5(2/98)
6.1(5/82)
25.2(27/107)
45.3(39/86)
51.6(31/60)
Mul
tiple
ovu
latio
ns (%
)
Milk Production (lbs/d)55 66 8877 99 111 122

Western Dairy Management Conference
lower estrogen and progesterone in the blood and this could cause problems with many different aspects of reproduction. For example, low estrogen would cause the animal not to come into heatbe in heat only for a very short period of time. Thus, this simple model could potentially explain some of the results described in the sections above.
or to
igure 7. Schematic of the potential physiological pathway that may produce the changes in
Practical Reproductive Management Implications:
he next section will briefly suggest some practical implications and reproductive management
ue to High Milk Production:
hat does this practically mean for a dairy farm? We used the data on duration of estrus versus milk
heat
t .
Freproduction observed in high-producing lactating dairy cows.
Tstrategies for each of these areas.
1. Decreased Duration of Estrus D Wproduction to analyze what would happen to heat detection efficiency for cows with different levels ofmilk production. In Figure 8 is shown, the probability of detecting a cow in heat with different frequency of heat detection. If a cow is producing about 70 lbs of milk per day, a 4 time per daydetection program will detect about 90% of cows that are in estrus. However, this same program (4 times/d) will only detect about 50% of cows in heat if they are producing above 100 lbs/d. This resulgets even worse if heat detection is done only twice per day or once per day. It should be noted that allof the probabilities in this analysis were based on actual ovulation by the cows (detected by ultrasound)Some producers will say that the high producing cows are not cycling but they are cycling normally but they do not detect them in heat because they have so short of a time that they are in heat. Increasing number of times that cows are checked for heat can help to solve this problem. Many producers are

Reno, NV March 7-9, 2007
using heat detection aids such as tail chalk to help find cows that are in showing heat at a time that thare not present. This can be critical because high producing cows are showing heat for only 4 hours or less in many cases. Most dairy producers in the United States are incorporating timed AI programs, such as Ovsynch, into their reproductive management programs to allow high-producing cows to be bred in a timely manner.
ey
igure 8. How the probability of heat detection changes with different frequencies of heat detection nd different levels of milk production.
tion is not normally associated with incidence of anovulation, dairy
roducers still need to design programs to treat anovular cows. Generally, 20% of dairy cows will not ows
a
on Rate (and Twinning Rate) with Increasing Milk Production:
d. Using Ovsynch does not seem to increase or decrease double ovulation with double ovulation related to milk
Fa
2. Treating Anovular Cows:
Although level of milk producpbe cycling by 70 days after calving. This percentage will increase if there are a high percentage of cwith low body condition scores (2.5 or less). These cows need to be quickly assigned to a hormonal program (and possibly nutritional program if they have low body condition score) that will start the cows cycling. An Ovsynch program alone is not the ideal treatment for anovular dairy cows. Use of CIDR or pretreatments with GnRH should be incorporated into these programs to be optimal treatments for non-cycling dairy cows.
3. Increasing Double Ovulati
From a practical standpoint, it appears that there may be little that we can do to change this tren
0.0
0.1
0.2
0.3
0.4
0.5
0.6
0.7
0.8
0.9
1.0
55 66 77 88 99 111 122
Average milk production (lb/d)
Prob
abili
ty o
f est
rous
det
ectio
n
6 h interval 12 h interval 24 h interval

Western Dairy Management Conference
production whether we look after a hormonal synchronization program or a natural estrus. Obviously,
10-14
must
s mentioned above there are many different factors that impact conception rate in lactating dairy cows farms it may be a fairly minor factor.
he effect of milk production on fertility is dramatically amplified during hotter times of the year. This
dairy cows appear to occur during the first week after breeding. We hypothesized that we ould improve reproduction just by transferring a good quality embryo at 7 days after expected time of
ed d
ates in high producing dairy cows. There are numerous intriguing ossibilities but they still lack sufficient data to allow recommendation at this time. One of the simplest
tion) but
uld
d .C. Wiltbank. 2006. Analysis of reproduct ce of lactating cows on large dairy farms
using machine learning algorithms. J. Dairy Sci. 89:4703-4722.
Dechow, C.D., G.W. Rogers, L. Klei, T.J. Lawlor, and P.M. VanRaden. 2004. Body condition scores and dairy form evaluations as indicators of days open in US Holsteins. J. Dairy Sci. 87:3534-3541.
not all double ovulations result in twins but increasing double ovulation rate will almost surely result in increased twinning rates on higher producing farms. It seems clear that the main increase occurs after cows are producing about 90 lbs/d. Thus, we must anticipate that we will have a dramatic increase in double ovulation rate in cows producing over 90 lbs/d and this will result in an increase in twinning rate in cows that conceive during this time of high milk production. We must align our management procedures to deal with this increasing twinning rate if we are increasing milk production into this range in our dairies. First, we must set a program to diagnose twins. Second, we should set up procedures to manage cows that are likely to have twin births. Twinning cows will calve earlier (d on average) and are likely to have more problems during the calving process. These twin calving cows were, on average, our highest producing cows during the previous lactation, therefore, we carefully design our calving and early lactation procedures with these twinning cows in mind. 4. Decreasing Conception Rate Due to Higher Milk Production: Aand higher milk production is just one of these factors and in manyTis because there is a greater increase in body temperature as cows increase milk production. This increase in body temperature leads to decreased reproductive success particularly death of the early embryo. From a practical viewpoint, we have tried to utilize the information that many of the problems with fertility incAI. So in a fairly large experiment we compared the conception rate in our herd when cows were breither by AI or by embryo transfer (ET). Unfortunately, ET did not improve conception rates compareto AI. Therefore, it appears that there may be multiple problems with fertility in lactating dairy cows and just transferring an embryo from a heifer does not appear to remove all of the fertility problems from the lactating cow. Many laboratories are currently experimenting with a number of changes in timed AI programs that may increase conception rprecommendations is to set up a proper time of AI, particularly during the Ovsynch program. Many producers are currently using a CoSynch program (AI at the same time as second GnRH injecwe have found that this will result in a substantial decrease in conception rates. The simple strategy of optimizing the time of AI after the second GnRH injection of Ovsynch (16 h from GnRH to AI) shoincrease number of pregnancies by ~33%. This is a substantial improvement (30% to 40%) and is probably the clearest and easiest management strategy that has been experimentally validated and can be immediately implemented to increase conception rates on dairy farms. Many other management strategies based on the physiological models developed above are still in the experimental stages.
References araviello, D.Z., K.A. Weigel, M. Craven, D. Gianola, N.B. Cook, K.V. Nordlund, P.M. Fricke, anC
M ive performan

Reno, NV March 7-9, 2007
Fonseca FA, Britt JH, McDaniel BT, Wilk JC, Rakes AH. Reproductive traits of Holsteins and JerseyEffects of age, milk yield, and clinical abnormalities on involutio
s. n of cervix and uterus, ovulation,
ricke PM, Wiltbank MC. Effect of milk production on the incidence of double ovulation in dairy cows.
rummer RR, Carroll DJ. A review of lipoprotein cholesterol metabolism: Importance to ovarian nction. J Anim Sci 1988;66:3160-3172.
arrison RO, Ford SP, Young JW, Conley AJ, Freeman AE. Increased milk production versus productive and energy status of high producing dairy cows. J Dairy Sci 1990;73:2749-2758.
arrison RO, Young JW, Freeman AE, Ford SP. Effects of lactational level on reactivation of ovarian nction, and interval from parturition to first visual oestrus and conception in high-producing Holstein
insel ML, Marsh WE, Ruegg PL, Etherington WG. Risk factors for twinning in dairy cows. J Dairy
opez H, Caraviello DZ, Satter LD, Fricke PM, Wiltbank MC. Relationship between level of milk roduction and multiple ovulations in lactating dairy cows. J Dairy Sci 2005;88:2783-2793.
opez H, Satter LD, Wiltbank MC. Relationship between level of milk production and estrous behavior f lactating dairy cows. Anim Reprod Sci 2004;81:209-223.
ryce, J.E., M.P. Coffey, and G. Simm. 2001. The relationship between body condition score and productive performance. J. Dairy Sci. 84:1508-1515.
ryce, J.E., M.P. Coffey, and S. Brotherstone. 2000. The genetic relationship between calving interval, ondition score and linear type and management traits in pedigree registered Holstein dairy cows. J.
oyal, M.D., J.E. Pryce, J.A. Woolliams, and A.P.F. Flint. 2002. The genetic relationship between
K, Sartori R, Wiltbank MC. High feed intake increases blood flow and etabolism of progesterone and estradiol-17ß in dairy cattle. J Dairy Sci 2002;85:2831-2842.
estrous cycles, detection of estrus, conception rate, and days open. J Dairy Sci 1983;66:1128-1147.
FTheriogenology 1999;52:1133-1143.
Gfu
Hre
Hfucows. Anim Prod 1989;49:23-28.
KSci 1998;81:989-993.
Lp
Lo
Pre
PcDairy Sci. 83:2664-2671.
Rcommencement of luteal activity and calving interval, body condition score, production, and linear type traits in Holstein-Friesian dairy cattle. J. Dairy Sci. 85:3071-3080.
Sangsritavong S, Combs Dm

Western Dairy Management Conference
Silva Del Rio N, Kirkpatrick BW, Fricke PM. Observed frequency of monozygotic twinning in lactating Holstein cows. J Dairy Sci 2004;87 (Suppl 1):65 [abstract].
an Eerdenburg FJCM, Karthaus D, Taverne MAM, Merics I, Szenci O. The relationship between strous behavioral score and time of ovulation in dairy cattle. J Dairy Sci 2002;58:1150-1156.
asconcelos JLM, Sangsritavong S, Tsai SJ, Wiltbank MC. Acute reduction in serum progesterone oncentrations after feed intake in dairy cows. Theriogenology 2003;60:795-807.
eerkamp R.F., J.K. Oldenbroek, H.J. Van Der Gaast, and J.H.J. Van Der Werf. 2000. Genetic orrelation between days until start of luteal activity and milk yield, energy balance, and live weights. J.
ashburn SP, Silvia WJ, Brown CH, McDaniel BT, McAllister AJ. Trends in reproductive
iltbank MC, Fricke PM, Sangritasvong S, Sartori R, Ginther OJ. Mechanisms that prevent and roduce double ovulations in dairy cattle J Dairy Sci 2000;83:2998-3007.
Ve
Vc
VcDairy Sci. 83:577-583.
Wperformance in southeastern Holstein and Jersey DHI herds. J Dairy Sci 2002;85:244-251.
Wp

HIGH COW REPORTAPRIL 2007
MILK Arizona Owner Barn# Age Milk New Mexico Owner Barn # Age Milk * Mike Pylman 35 03-02 35,770 * Providence Dairy 5374 05-05 39,220 * Stotz Dairy 21320 03-04 35,120 * Providence Dairy 5948 04-05 38,890 * Mike Pylman 20465 03-00 34,540 * Providence Dairy 5349 05-07 38,390 * Stotz Dairy 16320 06-04 33,950 S.A.S. Dairy 8156 03-11 38,100 * Stotz Dairy 15964 06-06 33,810 * Wayne Palla Dairy 10898 04-03 37,180 * Stotz Dairy 17408 05-07 33,270 * Providence Dairy 7731 02-10 36,540 * Withrow Dairy 5404 06-04 32,970 S.A.S. Dairy 8257 03-09 36,518 * Stotz Dairy 18671 04-06 32,840 * Wayne Palla Dairy 8783 06-00 36,500 * Mike Pylman 21693 03-05 32,480 S.A.S. Dairy 7170 05-00 36,241 * Stotz Dairy 20040 04-04 32,440 * Pareo Dairy 7647 06-08 35,943 FAT * Mike Pylman 35 03-02 1,451 * Pareo Dairy 4860 05-02 1,381 * Mike Pylman 20465 03-00 1,314 * Providence Dairy 343 05-11 1,378 * Shamrock Farms C963 03-06 1,290 * Providence Dairy 5613 05-00 1,376 * Stotz Dairy 16320 06-04 1,268 * Pareo Dairy 4769 05-01 1,347 * D & I Holstein 2431 02-00 1,264 * Providence Dairy 7219 03-03 1,344 * Mike Pylman 21693 03-05 1,257 * Providence Dairy 180 05-11 1,342 * Mike Pylman 20532 03-00 1,249 * Wayne Palla Dairy 10898 04-03 1,341 * Stotz Dairy 16205 06-05 1,247 * Providence Dairy 9801 06-02 1,339 * Stotz Dairy 20040 04-04 1,225 S.A.S. Dairy 8156 03-11 1,334 * Stotz Dairy 21320 03-04 1,223 * Providence Dairy 971 05-01 1,325 PROTEIN * Mike Pylman 35 03-02 1,280 S.A.S. Dairy 8156 03-11 1,191 * Mike Pylman 20465 03-00 1,174 S.A.S. Dairy 7170 05-00 1,144 * Stotz Dairy 21320 03-04 1,048 S.A.S. Dairy 8257 03-09 1,139 * Mike Pylman 21693 03-05 1,002 * Providence Dairy 5374 05-05 1,126 * Stotz Dairy 20040 04-04 978 S.A.S. Dairy 2978 04-11 1,115 * Stotz Dairy 18586 04-07 961 * Providence Dairy 5349 05-07 1,104 * Stotz Dairy 15964 06-06 958 * Providence Dairy 4812 06-07 1,091 * Rio Blanco Dairy 6307 04-08 948 * Providence Dairy 7731 02-10 1,076 * Stotz Dairy 21065 03-05 942 * Providence Dairy 5948 04-05 1,064 * Withrow Dairy 5404 06-04 938 * Milagro Dairy 9546 06-06 1,049 *all or part of lactation is 3X or 4X milking

ARIZONA - TOP 50% FOR F.C.M.b
APRIL 2007
OWNERS NAME Number of Cows MILK FAT 3.5 FCM CI * Stotz Dairy West 2,215 26,210 967 27,008 206 * Danzeisen Dairy, Inc. 1,551 24,215 897 25,011 166 * Goldman Dairy 2,274 24,333 847 24,251 152 * Stotz Dairy East 1,267 23,793 861 24,245 158 * Zimmerman Dairy 1,204 23,681 849 24,002 146 * Mike Pylman 6,613 23,703 841 23,882 197 * Red River Dairy 8,345 25,796 778 23,766 135 Parker Dairy 4,288 22,388 849 23,443 163 * Shamrock Farms 8,624 23,750 807 23,351 154 * Arizona Dairy Company 5,367 22,718 824 23,180 172 * Withrow Dairy 4,970 23,077 813 23,157 158 * Butler Dairy 602 22,684 801 22,793 165 Paul Rovey Dairy 290 21,321 812 22,382 123 Lunts Dairy 611 21,451 800 22,243 134 * Saddle Mountain 2,882 21,498 782 21,972 139 * DC Dairy, LLC 1,116 21,810 771 21,929 147 * Yettem 3,638 17,897 814 20,934 130 * Jerry Ethington 1,117 20,382 746 20,906 137 * Mountain Shadow Dairy 1,234 17,714 800 20,628 132 * Dutch View Dairy 1,725 20,462 695 20,114 183
NEW MEXICO - TOP 50% FOR F.C.M.b
APRIL 2007
OWNERS NAME Number of Cows MILK FAT 3.5 FCM DIM * Providence 2,969 25,631 909 25,823 190 * Hide Away 2,843 25,288 899 25,513 180 * SAS 1,909 25,584 876 25,268 185 * Pareo 2 1,552 25,536 876 25,247 185 * Do-Rene 2,343 24,157 874 24,618 194 * Vaz 2 2,041 23,835 869 24,398 210 * Vaz 1,442 23,787 869 24,377 203 * McCatharn 1,023 24,366 850 24,319 185 * Butterfield 2,098 24,293 851 24,304 180 * Milagro 3,494 23,538 863 24,172 185 * Caballo 3,646 23,443 843 23,807 182 * Pareo 3,324 22,792 829 23,298 188 * Tres Hermanos 476 22,142 785 22,304 189 * all or part of lactation is 3X or 4X milking b average milk and fat figure may be different from monthly herd summary; figures used are last day/month

ARIZONA AND NEW MEXICO HERD IMPROVEMENT SUMMARY FOR OFFICIAL HERDS TESTED APRIL 2007
ARIZONA NEW MEXICO
1. Number of Herds 40 26
2. Total Cows in Herd 71,484 43,073
3. Average Herd Size 1,787 1,656
4. Percent in Milk 94 86
5. Average Days in Milk 217 188
6. Average Milk – All Cows Per Day 68.4 62
7. Average Percent Fat – All Cows 3.6 3.6
8. Total Cows in Milk 66,915 15,561
9. Average Daily Milk for Milking Cows 73.0 71.7
10. Average Days in Milk 1st Breeding 85 73
11. Average Days Open 163 144
12. Average Calving Interval 14.1 13.6
13. Percent Somatic Cell – Low 83 70
14. Percent Somatic Cell – Medium 12 20
15. Percent Somatic Cell – High 5 10
16. Average Previous Days Dry 60 65
17. Percent Cows Leaving Herd 33 33
STATE AVERAGES Milk 22,532 23,007 Percent butterfat 3.57 3.61 Percent protein 2.95 3.00 Pounds butterfat 802 831
Pounds protein 646 705

Department of Animal SciencesPO Box 210038
Tucson, AZ 85721-0038
Phone: 520-626-9382Fax: 520-621-9435
Email: [email protected]
PRSRT STDU.S. POSTAGE
PAIDTUCSON, ARIZONA
PERMIT NO. 190