recent progress in electrochemical surface science with atomic … · 2017-03-07 · 2...
TRANSCRIPT
2 Electrochemistry
1 General Introduction
Kingo ITAYA & Soichiro YOSHIMOTO
Electrochemistry is important for industries concernedwith products and processes such as batteries, fuel cells,electroplating, corrosion inhibition, electro-organic syn-thesis, and sensor devices.1)Because electrode reactionstake place at solid-liquid interface where the electrode isin contact with a solution, electrochemical interface playsan important role in controlling the electron transferreaction. Understanding the nature of solid-liquid inter-face in detail not only leads to the elucidation of the elec-trode reaction mechanism but also provides informationuseful for designing new interfaces.As a fundamental basis for all electrochemical studies,electrode-electrolyte interfaces must be prepared repro-ducibly, and methods must be established to observethese interfaces accurately. It is still difficult to elucidateelectrochemical reactions on the atomic scale using poly-crystalline electrodes. Well-defined single crystal sur-faces must be exposed to solution to understand surface
structure-reactivity relationships on the atomic scale.Efforts have succeeded to produce extremely well-defined, atomically-flat surfaces of various electrodesmade of noble metals, base metals, and semiconductorswithout either oxidation or contamination in solution.2-4)
It was first realized in 1980 in the field of electrochemi-cal surface science that the adsorption-desorption reactionof hydrogen on Pt single crystal electrodes is stronglydependent on their crystallographic orientations; thisdemonstrated the importance of the nature of metal sur-face at the atomic level.5,6)Clavilier was the first to devel-op a simple and important experimental method, the so-called flame annealing and quenching method,5)to exposewell-defined electrode surfaces in aqueous electrolytesolutions without the use of ultrahigh vacuum (UHV)techniques. Nowadays, this technique has been extend-ed by Hamelin for Au,7,8)by Motoo and Furuya for Ir,9)
and by Itaya’s group for Rh and Pd.10)
Meanwhile, since the late 1980’s, in situ analyticalmethods were developed all over the world. In the earlystage, various experimental techniques, such as infraredabsorption spectroscopy (IRAS),11,12)ultra-violet (UV)-visi-
― Review ―
Recent Progress in Electrochemical Surface Science with Atomic and Molecular Levels
Shen YE,a,b Toshihiro KONDO,c Nagahiro HOSHI,d Junji INUKAI,e Soichiro YOSHIMOTO,fMasatoshi OSAWA,a and Kingo ITAYAg,h
aCatalysis Research Center, Hokkaido University (N21 W10, Kita-ku, Sapporo 001-0021, Japan)bPRESTO, Japan Science and Technology Agency (JST).cGraduate School of Humanities and Sciences, Ochanomizu University (2-1-1 Ohtsuka, Bunkyo-ku, Tokyo 112-8610,Japan)dDepartment of Applied Chemistry and Biotechnology, Graduate School of Engineering, Chiba University (1-33Yayoi-cho, Inage-ku, Chiba 263-8522, Japan)eFuel Cell Nanomaterials Center, University of Yamanashi (4 Takeda, Kofu 400-8510, Japan)fPriority Organization for Innovation and Excellence, Kumamoto University (2-39-1 Kurokami, Kumamoto 860-8555,Japan)gWPI Advanced Institute for Material Research, Tohoku University (6-6-07 Aoba, Sendai 980-8579, Japan)hDepartment of Applied Chemistry, Graduate School of Engineering, Tohoku University (6-6-07 Aoba, Sendai 980-8579, Japan)
Received October 9, 2008 ; Accepted December 12, 2008
Until the mid 1980’s, there had been only few in situ methods available for structural determination of an electrodesurface in solution at atomic and monolayer levels. Nowadays, many powerful in situ techniques, such as electro-chemical scanning tunneling microscopy (EC-STM), infrared reflection absorption spectroscopy (IRAS), surface-enhanced Raman scattering (SERS), and surface-enhanced infrared reflection absorption spectroscopy (SEIRAS),second harmonic generation (SHG), sum frequency generation (SFG), and surface X-ray scattering (SXS) have beenwidely employed to characterize the electrode surfaces under potential control with atomic and/or molecular reso-lution. The object of this review is to highlight some of the progress on in situ methods at solid-liquid interfacewith atomic and molecular levels. Several selected topics are focused on, specifically adsorbed anions on metal sur-face, electrocatalysis of the carbon oxide oxidation and oxygen reduction, and direct observation of single crystalelectrode surfaces.
Key Words : Solid-Liquid Interface, Single Crystal Electrode, Adsorption, Structure, Adlayer, Electrocatalysis, SHG,SFG, SXS, SEIRAS, STM
77,No. 1(2009) 3
ble reflectance spectroscopy, and low-energy electrondiffraction (LEED) in UHV have been applied to under-stand the electrode-electrolyte interface.13,14)In particular,electrochemical scanning tunneling microscopy (EC-STM) is now widely accepted as one of the powerfultools for generating the understanding of the structureof adsorbed layers of molecules on metal surfaces at theatomic scale in solution15-20)as well as in UHV.21,22)It can-not be overemphasized that in situ STM and AFMallowed us not only to determine the surface structure,but also to follow various electrochemical reactions, suchas the deposition and dissolution of atoms andmolecules.3,17,19)
Subsequently, quartz crystal microbalance (QCM),23-28)
and surface-enhanced Raman scattering (SERS),29)sur-face-enhanced infrared reflection absorption spec-troscopy (SEIRAS),30-32)second harmonic generation(SHG),33-36)sum frequency generation (SFG),37-44)and sur-face X-ray scattering (SXS)45-47)methods were developedfor surface structural investigations of electrochemicalprocesses taking place at electrode-electrolyte interfaceswith a monolayer level, by the combination of electro-chemistry.4)Thus, the establishment of both the prepara-tion of well-defined electrode surfaces and in situ charac-terization techniques make it possible to monitor withatomic and/or molecular levels for not only electrodeprocesses including underpotential deposition (UPD) ofmetal ions3,18,48)and specifically-adsorbed anions,3,17,18)butalso formation and characterization of self-assembledmonolayers (SAMs) of organothiols49-52)and supramolecu-larly-organized molecular adlayers through hydrogenbonding formation,53-55)donor-acceptor interaction,55-58)
and electrostatic interaction.59)
One of the goals of interfacial electrochemistry is tocontrol electrochemical reactions precisely with atomicand molecular scales.3,19,60-62)It is reasonably expectedthat the precise control of electrochemical reactions canproduce many ultra-fine and nanomaterials at atomic andmolecular scales.63-65)
In this review, a recent advance in in situ electroana-lytical methods such as SXS, IR, SHG, SFG, and STMcombined with single crystal electrochemistry is report-ed from the members of nano-interface division in ECSJ.Details are described in respective section below.
2 SXS for Gold Single-crystal Electrodes
Toshihiro KONDO
The structure of the surfaces can be investigated withSXS within the surface plane and along the surface nor-mal by controlling the direction of the scattering vectorQ, which is the difference between the incident and scat-tered X-ray wave vectors.66,67)Information within the sur-face plane is typically obtained by orienting Q almostwithin the surface plane. This corresponds to the graz-ing incidence angle geometry where the angle is typical-ly a few degrees. The measurement in this geometry isso-called the in-plane measurement and this method isso-called surface X-ray diffraction (SXRD), which is one
of the SXS methods. On the other hand, when Q isaligned entirely along the surface normal direction, infor-mation about the surface normal structure is obtained.This geometry is referred to as specular reflectivitysince the angle between the surface plane and incidentwave vector is equal to the angle between the surfaceplane and the scattered wave vector. Additional struc-tural information can be obtained by determining thescattered intensity distribution along the surface normaldirection at a fixed, finite in-plane wave vectors corre-sponding either to the bulk crystal structure or to theoverlayer structure. Such scattered intensity distribu-tion along the surface normal is so-called crystal trunca-tion rod (CTR) and then this method is so-called CTRtechnique, which is also one of the SXS methods. Thus,the combination of these methods, i.e., SXRD and CTR,allows us to obtain the three-dimensional (3D) structurewith an atomic dimension and therefore, SXS techniqueis one of the best methods to investigate the 3D interfa-cial structure at electrochemical interfaces in situ.66-71)
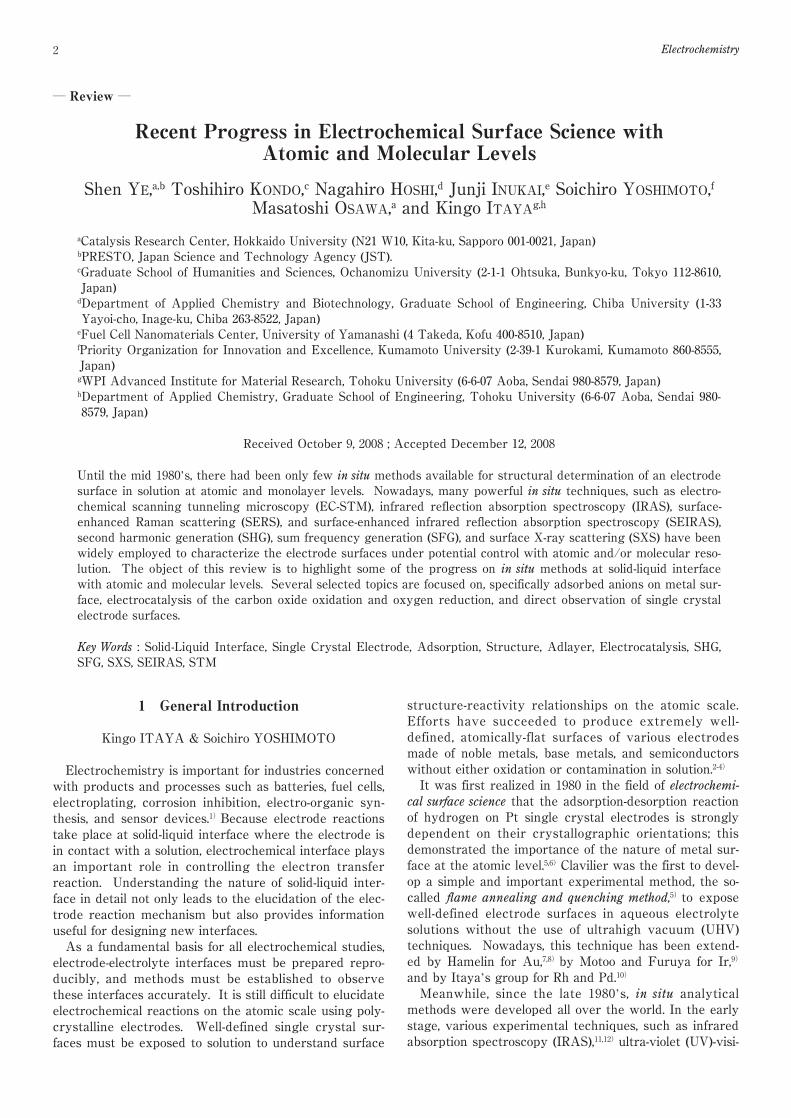
Fig. 1 (A) In-plane hexagonal structure of the Au(111)surface. The solid (open) circles correspond to atoms in thesecond (first) layer. Surface atoms in the left and right sidesof the figure are in undistorted hexagonal sites, whereas inthe center of the figure the atoms are in faulted sites. For24 surface atoms in place of 23 underlying surface atomsalong the <1,0,0> direction, the compression is 24/23 −1=4.4% and δ=√(3/2)/23=0.038. (B) In-plane diffractionpattern from the Au(111) surface. Solid circles representdiffraction from the underlying hexagonal lattice. Opensymbols originate from the (23×√3) reconstructed phasewith three rotational equivalent domains (circles, squares,and triangles). The axis, qr, is defined to be along the (1,1)direction. (C) Equal-intensity scattering contours in thevicinity of the (0,1) reflection at L=0.5 measured in 0.01 MNaCl at −0.3 V. Reprinted with permission from Ref. 45,Copyright American Physical Society (1992).
4 Electrochemistry
Many in situ structural studies at single-crystal elec-trode/electrolyte interfaces using the SXS techniquehave been carried out in the last 15 years.45,46,71-85)In thissection, we focus on the gold single-crystal electrodesbecause gold is one of the most popular electrode materi-als and the structures of the gold single-crystal electrodesurfaces at various potentials using in situ SXS techniqueincluding our results will be reviewed.As far as the structure of gold electrodes is concerned,Ocko et al. investigated for the first time the structuresof the reconstructed Au(111),45 ,46 ,71 ,72)Au(100),73)andAu(110)74)surfaces using in situ SXS. Especially, thereconstruction formation/lifting transition of the Au(111)surface was investigated in details in the electrolyte solu-tions containing various halogen anions.45,46,71,72)
Despite the underlying hexagonal symmetry of theAu(111) surface, it had been reported that the top layerof gold atoms forms a uniaxial incommensurate rectan-gular phase at the relatively negative potential by capac-ity-potential curve,86)STM,87)and ex situ LEED88)mea-surements. This phase is denoted (p×√3), where p and√3 are the repeat distances in units of the nearest-neigh-bor (NN) distance, as schematically shown in Fig. 1(A).45)
In an SXRD measurement, the (p×√3) reconstructiongives rise to additional in-plane reflections beyond theunderlying (1×1) reflections (Figs. 1(B) and 1(C)).45)
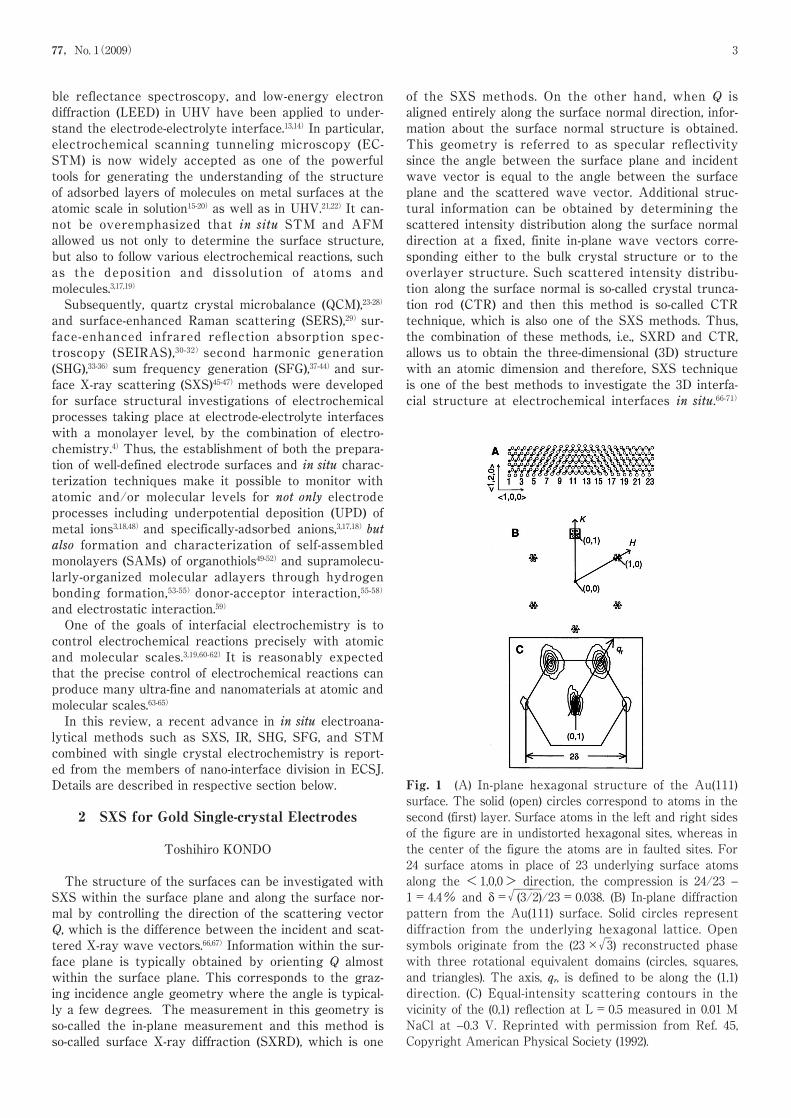
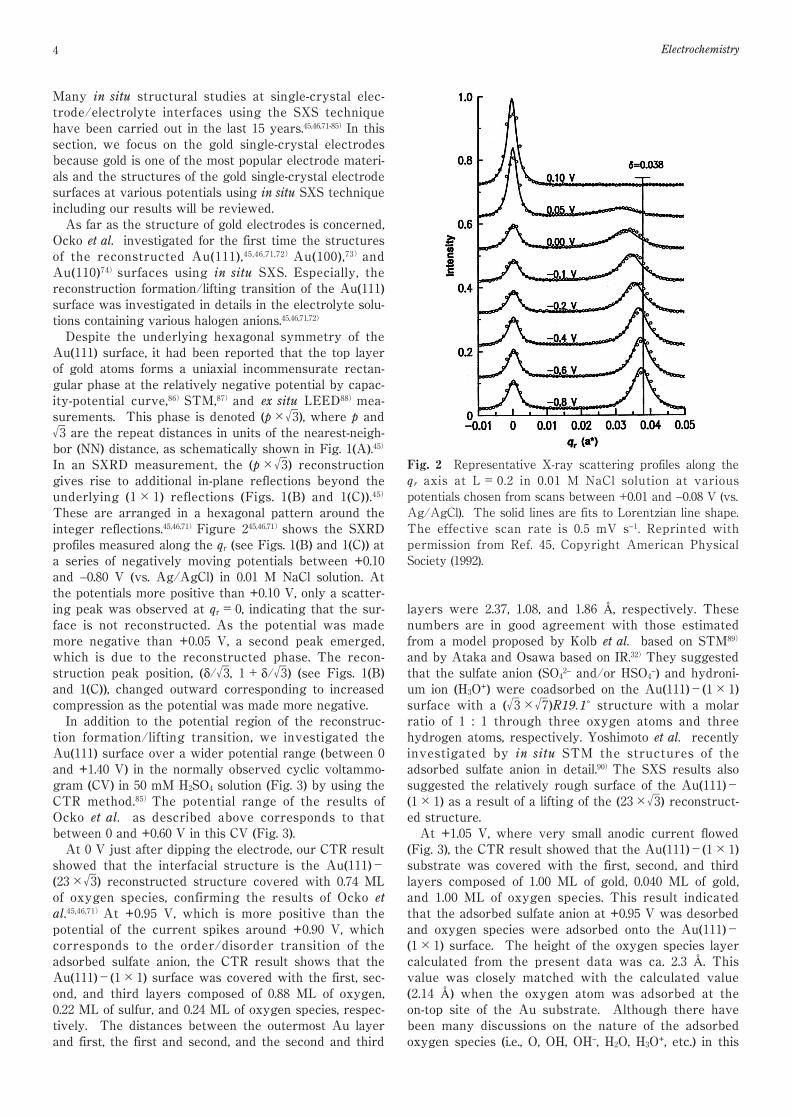
These are arranged in a hexagonal pattern around theinteger reflections.45,46,71)Figure 245,46,71)shows the SXRDprofiles measured along the qr (see Figs. 1(B) and 1(C)) ata series of negatively moving potentials between +0.10and −0.80 V (vs. Ag/AgCl) in 0.01 M NaCl solution. Atthe potentials more positive than +0.10 V, only a scatter-ing peak was observed at qr=0, indicating that the sur-face is not reconstructed. As the potential was mademore negative than +0.05 V, a second peak emerged,which is due to the reconstructed phase. The recon-struction peak position, (δ/√3, 1+δ/√3) (see Figs. 1(B)and 1(C)), changed outward corresponding to increasedcompression as the potential was made more negative.In addition to the potential region of the reconstruc-tion formation/lifting transition, we investigated theAu(111) surface over a wider potential range (between 0and +1.40 V) in the normally observed cyclic voltammo-gram (CV) in 50 mM H2SO4 solution (Fig. 3) by using theCTR method.85)The potential range of the results ofOcko et al. as described above corresponds to thatbetween 0 and +0.60 V in this CV (Fig. 3).At 0 V just after dipping the electrode, our CTR resultshowed that the interfacial structure is the Au(111)-(23×√3) reconstructed structure covered with 0.74 MLof oxygen species, confirming the results of Ocko etal.45,46,71)At +0.95 V, which is more positive than thepotential of the current spikes around +0.90 V, whichcorresponds to the order/disorder transition of theadsorbed sulfate anion, the CTR result shows that theAu(111)-(1×1) surface was covered with the first, sec-ond, and third layers composed of 0.88 ML of oxygen,0.22 ML of sulfur, and 0.24 ML of oxygen species, respec-tively. The distances between the outermost Au layerand first, the first and second, and the second and third
layers were 2.37, 1.08, and 1.86 Å, respectively. Thesenumbers are in good agreement with those estimatedfrom a model proposed by Kolb et al. based on STM89)
and by Ataka and Osawa based on IR.32)They suggestedthat the sulfate anion (SO42− and/or HSO4−) and hydroni-um ion (H3O+) were coadsorbed on the Au(111)-(1×1)surface with a (√3×√7)R19.1˚ structure with a molarratio of 1 : 1 through three oxygen atoms and threehydrogen atoms, respectively. Yoshimoto et al. recentlyinvestigated by in situ STM the structures of theadsorbed sulfate anion in detail.90)The SXS results alsosuggested the relatively rough surface of the Au(111)-(1×1) as a result of a lifting of the (23×√3) reconstruct-ed structure.At +1.05 V, where very small anodic current flowed(Fig. 3), the CTR result showed that the Au(111)-(1×1)substrate was covered with the first, second, and thirdlayers composed of 1.00 ML of gold, 0.040 ML of gold,and 1.00 ML of oxygen species. This result indicatedthat the adsorbed sulfate anion at +0.95 V was desorbedand oxygen species were adsorbed onto the Au(111)-(1×1) surface. The height of the oxygen species layercalculated from the present data was ca. 2.3 Å. Thisvalue was closely matched with the calculated value(2.14 Å) when the oxygen atom was adsorbed at theon-top site of the Au substrate. Although there havebeen many discussions on the nature of the adsorbedoxygen species (i.e., O, OH, OH−, H2O, H3O+, etc.) in this
Fig. 2 Representative X-ray scattering profiles along theqr axis at L=0.2 in 0.01 M NaCl solution at variouspotentials chosen from scans between +0.01 and −0.08 V (vs. Ag/AgCl). The solid lines are fits to Lorentzian line shape.The effective scan rate is 0.5 mV s−1. Reprinted withpermission from Ref. 45, Copyright American PhysicalSociety (1992).
77,No. 1(2009) 5
potential region, one cannot distinguish these speciesbased on the SXS results because X-ray is not scatteredby hydrogen atoms, but it can be concluded that oxygenspecies were adsorbed at the on-top site of the underly-ing Au(111)-(1×1) surface.Because SXS intensity gradually changed with time at+1.40 V, the CTR measurement was carried out at not at+1.40 V but at +1.10 V. At this potential, the CTR resultshowed that the Au(111)-(1×1) substrate was coveredwith the first, second, and third layers composed of 0.73ML of gold, 0.31 ML of gold, and 1.00 ML of oxygenspecies, respectively. Coverage of gold atoms in the firstand second layer less than 1 ML showed that gold atomscoexisted with oxygen atoms. This means gold oxide wasformed, although we cannot determine the fraction ofoxygen atoms in these oxide layers. As a result of thepenetration of oxygen atoms into the gold surface layers,the distances between the outermost layer of the goldsubstrate and first layers and between the first and sec-ond layers were 2.90 and 2.50 Å, respectively, and werelarger than the value (2.36 Å) of the bulk Au(111). Thisresult supports the model proposed by Conway et al.based on the results of conventional electrochemicalmeasurements that the two-atom thick oxide layer wasformed as a result of a turnover reaction.91,92)The totalnumber of gold atoms in these oxide layers was equiva-lent to 1.04 ML, which was exactly the same as that ofthe gold coverage of the reconstructed Au(111)-(23×√3) surface observed at 0 V. This indicates that only thegold atoms in the outermost layer are electrochemicallyoxidized in the potential cycle up to +1.40 V. This resultalso confirms that the real surface area can be calculatedfrom the charge of the current peak of the oxide reduc-
tion.93)
At +0.65 V, which is more negative than that of theoxide reduction peak (Fig. 3), after the positive-goingscan to +1.40 V, the CTR result showed that the first,second, and third layers on the Au(111)-(1×1) sub-strate were composed of 0.87 ML of oxygen, 0.22 ML ofsulfur, and 0.24 ML of oxygen species, respectively.These values matched well with those obtained at +0.95V in the positive-going scan as described above.Furthermore, all the distances between the layers werealso in good agreement with those obtained at +0.95 V.Thus, the interfacial structure at this potential is same asthat obtained at +0.95 V in the positive-going scan, indi-cating that the sulfate and H3O+ were coadsorbed with a(√3×√7)R19.1˚ structure through three oxygen atomsand three hydrogen atoms, respectively. One must note,however, that the lateral order of the adsorbates cannotbe confirmed based only on this CTR data.At 0 V after a potential cycle, the CTR result showedthat the Au(111)-(23×√3) reconstructed surface wascovered with 0 .99 ML of oxygen species, as wasobserved at 0 V before the potential cycle, as describedabove. The comparison of the structural parametersmeasured at 0 V before and after the potential cycleshowed that the distances between the outermost sub-strate and first and the first and second layers, coverageof O and Au atoms in the outermost two layers, andRMS values of the all three layers became slightly largerafter the potential cycle. These results indicate thatsmall Au clusters existed on the reconstructedAu(111)-(23×√3) surface (i.e., the surface was rough-ened). This is in good agreement with the well-knownfact that once the gold electrode surface is oxidized, oxy-gen atoms penetrate into the outermost gold layer andthe electrode surface is roughened even after the com-plete reduction of the surface oxide.84-96)
The same trends of the Au(100) electrodes were alsoreported.85)
3 Electro-catalysis on High-Index Planes
Nagahiro HOSHI
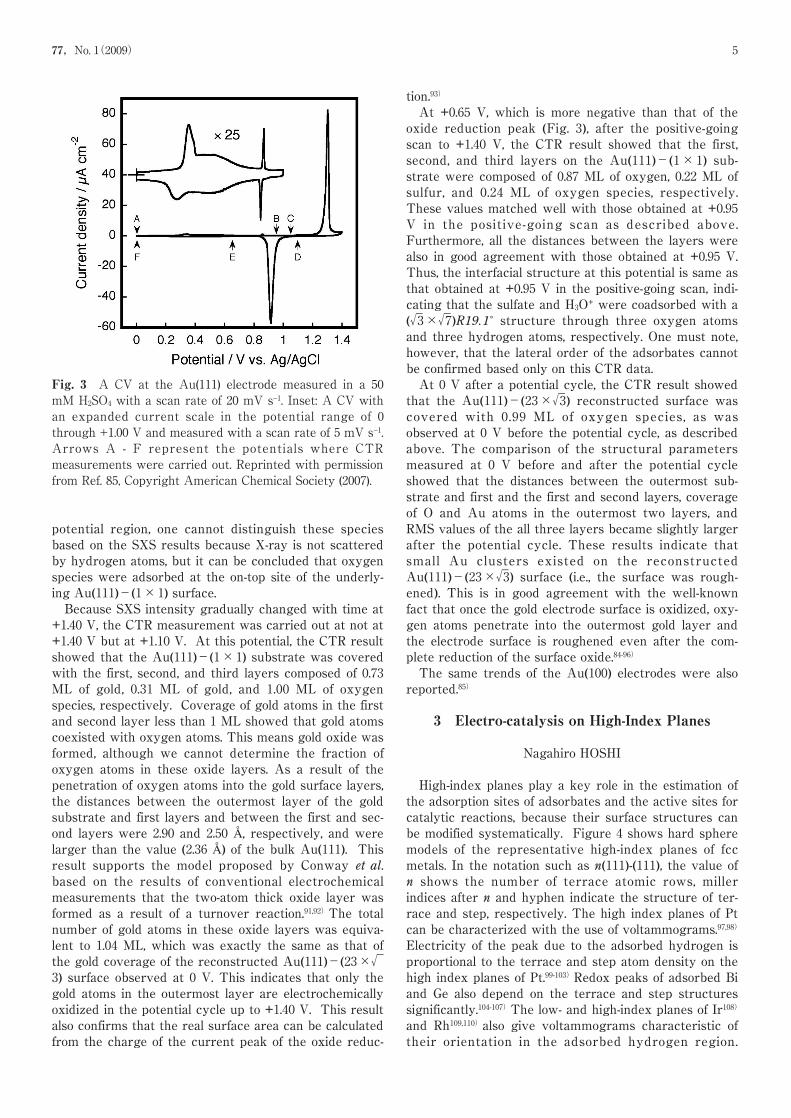
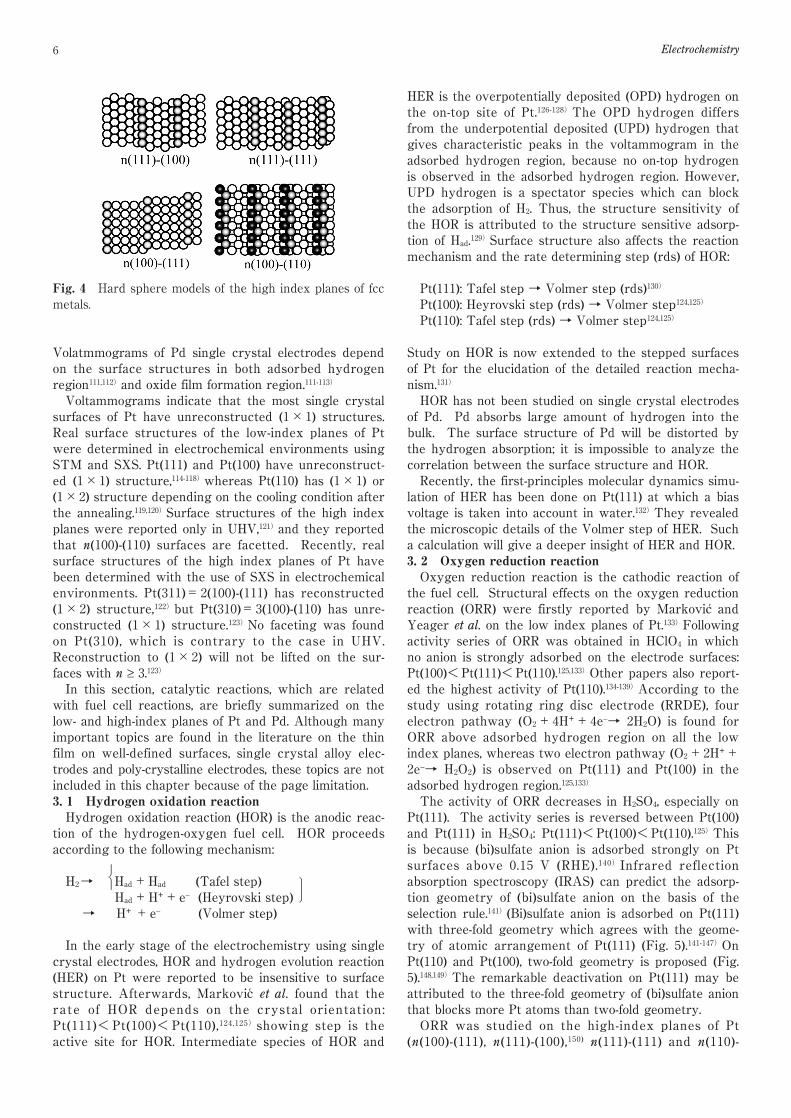
High-index planes play a key role in the estimation ofthe adsorption sites of adsorbates and the active sites forcatalytic reactions, because their surface structures canbe modified systematically. Figure 4 shows hard spheremodels of the representative high-index planes of fccmetals. In the notation such as n(111)-(111), the value ofn shows the number of terrace atomic rows, millerindices after n and hyphen indicate the structure of ter-race and step, respectively. The high index planes of Ptcan be characterized with the use of voltammograms.97,98)
Electricity of the peak due to the adsorbed hydrogen isproportional to the terrace and step atom density on thehigh index planes of Pt.99-103)Redox peaks of adsorbed Biand Ge also depend on the terrace and step structuressignificantly.104-107)The low- and high-index planes of Ir108)
and Rh109,110)also give voltammograms characteristic oftheir orientation in the adsorbed hydrogen region.
Fig. 3 A CV at the Au(111) electrode measured in a 50mM H2SO4 with a scan rate of 20 mV s−1. Inset: A CV withan expanded current scale in the potential range of 0through +1.00 V and measured with a scan rate of 5 mV s−1.Arrows A - F represent the potentials where CTRmeasurements were carried out. Reprinted with permissionfrom Ref. 85, Copyright American Chemical Society (2007).
6 Electrochemistry
Volatmmograms of Pd single crystal electrodes dependon the surface structures in both adsorbed hydrogenregion111,112)and oxide film formation region.111-113)
Voltammograms indicate that the most single crystalsurfaces of Pt have unreconstructed (1×1) structures.Real surface structures of the low-index planes of Ptwere determined in electrochemical environments usingSTM and SXS. Pt(111) and Pt(100) have unreconstruct-ed (1×1) structure,114-118)whereas Pt(110) has (1×1) or(1×2) structure depending on the cooling condition afterthe annealing.119,120)Surface structures of the high indexplanes were reported only in UHV,121)and they reportedthat n(100)-(110) surfaces are facetted. Recently, realsurface structures of the high index planes of Pt havebeen determined with the use of SXS in electrochemicalenvironments. Pt(311)=2(100)-(111) has reconstructed(1×2) structure,122)but Pt(310)=3(100)-(110) has unre-constructed (1×1) structure.123)No faceting was foundon Pt(310), which is contrary to the case in UHV.Reconstruction to (1×2) will not be lifted on the sur-faces with n ≥ 3.123)In this section, catalytic reactions, which are relatedwith fuel cell reactions, are briefly summarized on thelow- and high-index planes of Pt and Pd. Although manyimportant topics are found in the literature on the thinfilm on well-defined surfaces, single crystal alloy elec-trodes and poly-crystalline electrodes, these topics are notincluded in this chapter because of the page limitation.3. 1 Hydrogen oxidation reactionHydrogen oxidation reaction (HOR) is the anodic reac-tion of the hydrogen-oxygen fuel cell. HOR proceedsaccording to the following mechanism:
H2→ Had+Had (Tafel step) Had+H++e− (Heyrovski step)
→ H+ +e− (Volmer step)
In the early stage of the electrochemistry using singlecrystal electrodes, HOR and hydrogen evolution reaction(HER) on Pt were reported to be insensitive to surfacestructure. Afterwards, Markovic et al. found that therate of HOR depends on the crystal orientation:Pt(111)<Pt(100)<Pt(110),124 ,125)showing step is theactive site for HOR. Intermediate species of HOR and
14
1
4
HER is the overpotentially deposited (OPD) hydrogen onthe on-top site of Pt.126-128)The OPD hydrogen differsfrom the underpotential deposited (UPD) hydrogen thatgives characteristic peaks in the voltammogram in theadsorbed hydrogen region, because no on-top hydrogenis observed in the adsorbed hydrogen region. However,UPD hydrogen is a spectator species which can blockthe adsorption of H2. Thus, the structure sensitivity ofthe HOR is attributed to the structure sensitive adsorp-tion of Had.129)Surface structure also affects the reactionmechanism and the rate determining step (rds) of HOR:
Pt(111): Tafel step → Volmer step (rds)130)
Pt(100): Heyrovski step (rds) → Volmer step124,125)
Pt(110): Tafel step (rds) → Volmer step124,125)
Study on HOR is now extended to the stepped surfacesof Pt for the elucidation of the detailed reaction mecha-nism.131)
HOR has not been studied on single crystal electrodesof Pd. Pd absorbs large amount of hydrogen into thebulk. The surface structure of Pd will be distorted bythe hydrogen absorption; it is impossible to analyze thecorrelation between the surface structure and HOR.Recently, the first-principles molecular dynamics simu-
lation of HER has been done on Pt(111) at which a biasvoltage is taken into account in water.132)They revealedthe microscopic details of the Volmer step of HER. Sucha calculation will give a deeper insight of HER and HOR.3. 2 Oxygen reduction reactionOxygen reduction reaction is the cathodic reaction of
the fuel cell. Structural effects on the oxygen reductionreaction (ORR) were firstly reported by Markovic andYeager et al. on the low index planes of Pt.133)Followingactivity series of ORR was obtained in HClO4 in whichno anion is strongly adsorbed on the electrode surfaces:Pt(100)<Pt(111)<Pt(110).125,133)Other papers also report-ed the highest activity of Pt(110).134-139)According to thestudy using rotating ring disc electrode (RRDE), fourelectron pathway (O2+4H++4e−→ 2H2O) is found forORR above adsorbed hydrogen region on all the lowindex planes, whereas two electron pathway (O2+2H++2e−→ H2O2) is observed on Pt(111) and Pt(100) in theadsorbed hydrogen region.125,133)
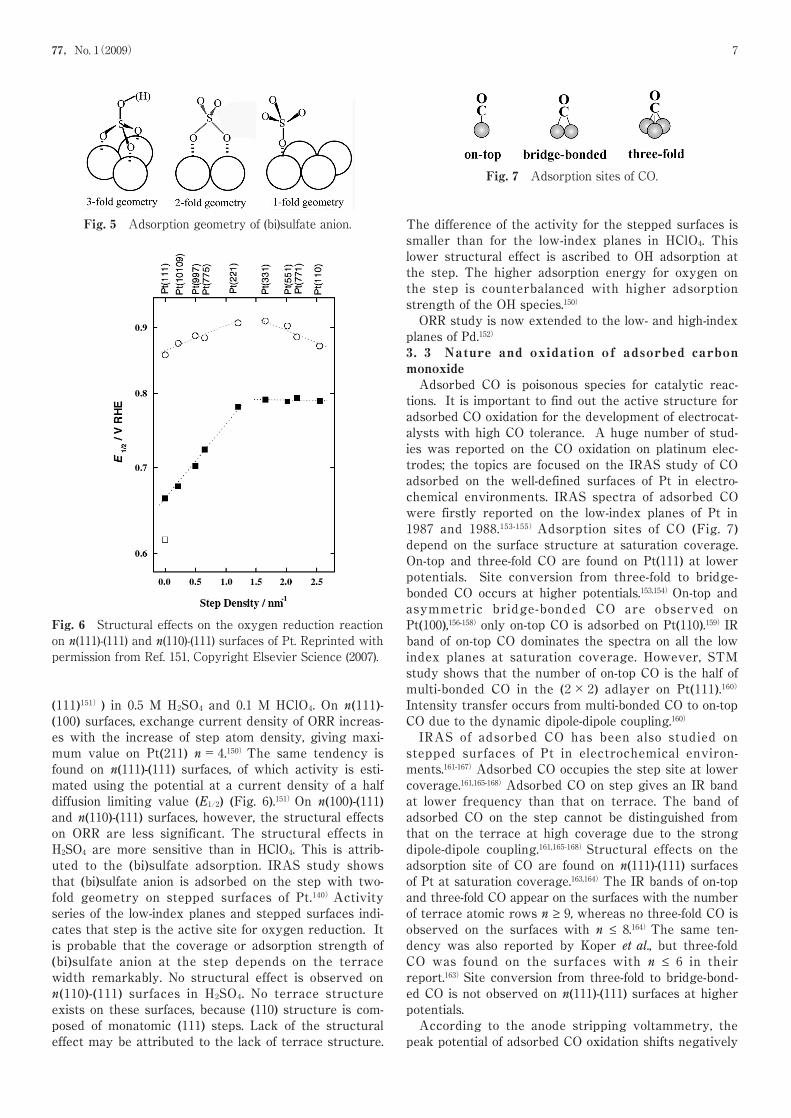
The activity of ORR decreases in H2SO4, especially onPt(111). The activity series is reversed between Pt(100)and Pt(111) in H2SO4: Pt(111)<Pt(100)<Pt(110).125)Thisis because (bi)sulfate anion is adsorbed strongly on Ptsurfaces above 0.15 V (RHE).140)Infrared reflectionabsorption spectroscopy (IRAS) can predict the adsorp-tion geometry of (bi)sulfate anion on the basis of theselection rule.141)(Bi)sulfate anion is adsorbed on Pt(111)with three-fold geometry which agrees with the geome-try of atomic arrangement of Pt(111) (Fig. 5).141-147)OnPt(110) and Pt(100), two-fold geometry is proposed (Fig.5).148,149)The remarkable deactivation on Pt(111) may beattributed to the three-fold geometry of (bi)sulfate anionthat blocks more Pt atoms than two-fold geometry.ORR was studied on the high-index planes of Pt
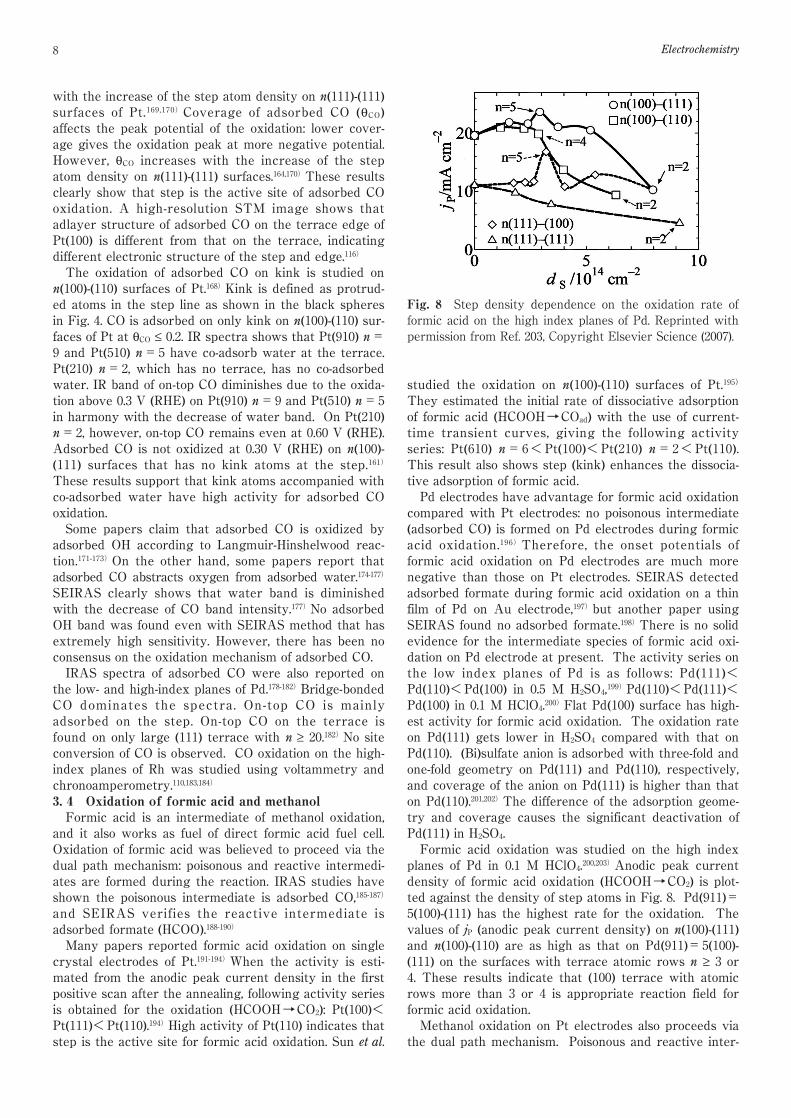
(n(100)-(111), n(111)-(100),150) n(111)-(111) and n(110)-
Fig. 4 Hard sphere models of the high index planes of fccmetals.
77,No. 1(2009) 7
(111)151)) in 0.5 M H2SO4 and 0.1 M HClO4. On n(111)-(100) surfaces, exchange current density of ORR increas-es with the increase of step atom density, giving maxi-mum value on Pt(211) n=4.150)The same tendency isfound on n(111)-(111) surfaces, of which activity is esti-mated using the potential at a current density of a halfdiffusion limiting value (E1/2) (Fig. 6).151)On n(100)-(111)and n(110)-(111) surfaces, however, the structural effectson ORR are less significant. The structural effects inH2SO4 are more sensitive than in HClO4. This is attrib-uted to the (bi)sulfate adsorption. IRAS study showsthat (bi)sulfate anion is adsorbed on the step with two-fold geometry on stepped surfaces of Pt.140)Activityseries of the low-index planes and stepped surfaces indi-cates that step is the active site for oxygen reduction. Itis probable that the coverage or adsorption strength of(bi)sulfate anion at the step depends on the terracewidth remarkably. No structural effect is observed onn(110)-(111) surfaces in H2SO4. No terrace structureexists on these surfaces, because (110) structure is com-posed of monatomic (111) steps. Lack of the structuraleffect may be attributed to the lack of terrace structure.
The difference of the activity for the stepped surfaces issmaller than for the low-index planes in HClO4. Thislower structural effect is ascribed to OH adsorption atthe step. The higher adsorption energy for oxygen onthe step is counterbalanced with higher adsorptionstrength of the OH species.150)
ORR study is now extended to the low- and high-indexplanes of Pd.152)
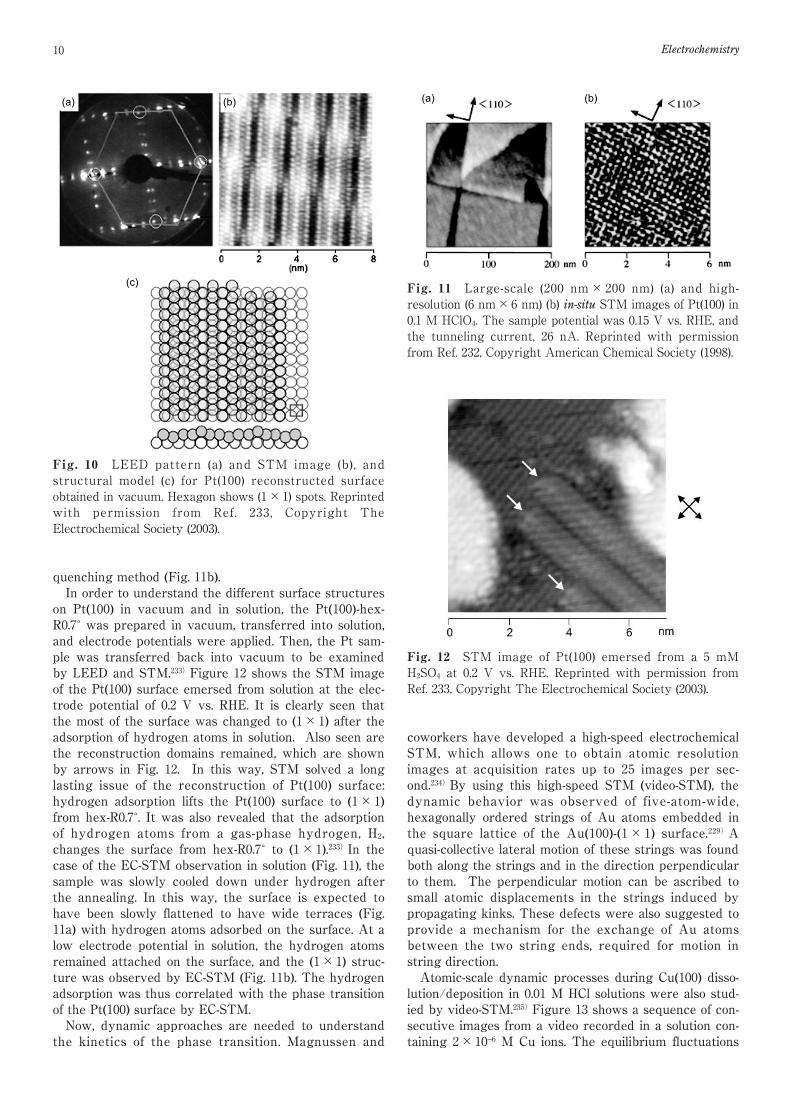
3. 3 Nature and oxidation of adsorbed carbonmonoxideAdsorbed CO is poisonous species for catalytic reac-tions. It is important to find out the active structure foradsorbed CO oxidation for the development of electrocat-alysts with high CO tolerance. A huge number of stud-ies was reported on the CO oxidation on platinum elec-trodes; the topics are focused on the IRAS study of COadsorbed on the well-defined surfaces of Pt in electro-chemical environments. IRAS spectra of adsorbed COwere firstly reported on the low-index planes of Pt in1987 and 1988.153-155)Adsorption sites of CO (Fig. 7)depend on the surface structure at saturation coverage.On-top and three-fold CO are found on Pt(111) at lowerpotentials. Site conversion from three-fold to bridge-bonded CO occurs at higher potentials.153,154)On-top andasymmetric bridge-bonded CO are observed onPt(100),156-158)only on-top CO is adsorbed on Pt(110).159)IRband of on-top CO dominates the spectra on all the lowindex planes at saturation coverage. However, STMstudy shows that the number of on-top CO is the half ofmulti-bonded CO in the (2×2) adlayer on Pt(111).160)
Intensity transfer occurs from multi-bonded CO to on-topCO due to the dynamic dipole-dipole coupling.160)
IRAS of adsorbed CO has been also studied onstepped surfaces of Pt in electrochemical environ-ments.161-167)Adsorbed CO occupies the step site at lowercoverage.161,165-168)Adsorbed CO on step gives an IR bandat lower frequency than that on terrace. The band ofadsorbed CO on the step cannot be distinguished fromthat on the terrace at high coverage due to the strongdipole-dipole coupling.161,165-168)Structural effects on theadsorption site of CO are found on n(111)-(111) surfacesof Pt at saturation coverage.163,164)The IR bands of on-topand three-fold CO appear on the surfaces with the numberof terrace atomic rows n ≥ 9, whereas no three-fold CO isobserved on the surfaces with n ≤ 8.164)The same ten-dency was also reported by Koper et al., but three-foldCO was found on the surfaces with n ≤ 6 in theirreport.163)Site conversion from three-fold to bridge-bond-ed CO is not observed on n(111)-(111) surfaces at higherpotentials.According to the anode stripping voltammetry, thepeak potential of adsorbed CO oxidation shifts negatively
Fig. 5 Adsorption geometry of (bi)sulfate anion.
Fig. 6 Structural effects on the oxygen reduction reactionon n(111)-(111) and n(110)-(111) surfaces of Pt. Reprinted withpermission from Ref. 151, Copyright Elsevier Science (2007).
Fig. 7 Adsorption sites of CO.
8 Electrochemistry
with the increase of the step atom density on n(111)-(111)surfaces of Pt.169 ,170)Coverage of adsorbed CO (θCO)affects the peak potential of the oxidation: lower cover-age gives the oxidation peak at more negative potential.However, θCO increases with the increase of the stepatom density on n(111)-(111) surfaces.164,170)These resultsclearly show that step is the active site of adsorbed COoxidation. A high-resolution STM image shows thatadlayer structure of adsorbed CO on the terrace edge ofPt(100) is different from that on the terrace, indicatingdifferent electronic structure of the step and edge.116)
The oxidation of adsorbed CO on kink is studied onn(100)-(110) surfaces of Pt.168)Kink is defined as protrud-ed atoms in the step line as shown in the black spheresin Fig. 4. CO is adsorbed on only kink on n(100)-(110) sur-faces of Pt at θCO ≤ 0.2. IR spectra shows that Pt(910) n=9 and Pt(510) n=5 have co-adsorb water at the terrace.Pt(210) n=2, which has no terrace, has no co-adsorbedwater. IR band of on-top CO diminishes due to the oxida-tion above 0.3 V (RHE) on Pt(910) n=9 and Pt(510) n=5in harmony with the decrease of water band. On Pt(210)n=2, however, on-top CO remains even at 0.60 V (RHE).Adsorbed CO is not oxidized at 0.30 V (RHE) on n(100)-(111) surfaces that has no kink atoms at the step.161)
These results support that kink atoms accompanied withco-adsorbed water have high activity for adsorbed COoxidation.Some papers claim that adsorbed CO is oxidized byadsorbed OH according to Langmuir-Hinshelwood reac-tion.171-173)On the other hand, some papers report thatadsorbed CO abstracts oxygen from adsorbed water.174-177)
SEIRAS clearly shows that water band is diminishedwith the decrease of CO band intensity.177)No adsorbedOH band was found even with SEIRAS method that hasextremely high sensitivity. However, there has been noconsensus on the oxidation mechanism of adsorbed CO.IRAS spectra of adsorbed CO were also reported onthe low- and high-index planes of Pd.178-182)Bridge-bondedCO dominates the spectra. On-top CO is mainlyadsorbed on the step. On-top CO on the terrace isfound on only large (111) terrace with n ≥ 20.182)No siteconversion of CO is observed. CO oxidation on the high-index planes of Rh was studied using voltammetry andchronoamperometry.110,183,184)
3. 4 Oxidation of formic acid and methanolFormic acid is an intermediate of methanol oxidation,and it also works as fuel of direct formic acid fuel cell.Oxidation of formic acid was believed to proceed via thedual path mechanism: poisonous and reactive intermedi-ates are formed during the reaction. IRAS studies haveshown the poisonous intermediate is adsorbed CO,185-187)
and SEIRAS verifies the reactive intermediate isadsorbed formate (HCOO).188-190)
Many papers reported formic acid oxidation on singlecrystal electrodes of Pt.191-194)When the activity is esti-mated from the anodic peak current density in the firstpositive scan after the annealing, following activity seriesis obtained for the oxidation (HCOOH→CO2): Pt(100)<Pt(111)<Pt(110).194)High activity of Pt(110) indicates thatstep is the active site for formic acid oxidation. Sun et al.
studied the oxidation on n(100)-(110) surfaces of Pt.195)
They estimated the initial rate of dissociative adsorptionof formic acid (HCOOH→COad) with the use of current-time transient curves, giving the following activityseries: Pt(610) n=6<Pt(100)<Pt(210) n=2<Pt(110).This result also shows step (kink) enhances the dissocia-tive adsorption of formic acid.Pd electrodes have advantage for formic acid oxidation
compared with Pt electrodes: no poisonous intermediate(adsorbed CO) is formed on Pd electrodes during formicacid oxidation.196)Therefore, the onset potentials offormic acid oxidation on Pd electrodes are much morenegative than those on Pt electrodes. SEIRAS detectedadsorbed formate during formic acid oxidation on a thinfilm of Pd on Au electrode,197)but another paper usingSEIRAS found no adsorbed formate.198)There is no solidevidence for the intermediate species of formic acid oxi-dation on Pd electrode at present. The activity series onthe low index planes of Pd is as follows: Pd(111)<Pd(110)<Pd(100) in 0.5 M H2SO4,199)Pd(110)<Pd(111)<Pd(100) in 0.1 M HClO4.200)Flat Pd(100) surface has high-est activity for formic acid oxidation. The oxidation rateon Pd(111) gets lower in H2SO4 compared with that onPd(110). (Bi)sulfate anion is adsorbed with three-fold andone-fold geometry on Pd(111) and Pd(110), respectively,and coverage of the anion on Pd(111) is higher than thaton Pd(110).201,202)The difference of the adsorption geome-try and coverage causes the significant deactivation ofPd(111) in H2SO4.Formic acid oxidation was studied on the high index
planes of Pd in 0.1 M HClO4.200,203)Anodic peak currentdensity of formic acid oxidation (HCOOH→CO2) is plot-ted against the density of step atoms in Fig. 8. Pd(911)=5(100)-(111) has the highest rate for the oxidation. Thevalues of jP (anodic peak current density) on n(100)-(111)and n(100)-(110) are as high as that on Pd(911)=5(100)-(111) on the surfaces with terrace atomic rows n ≥ 3 or4. These results indicate that (100) terrace with atomicrows more than 3 or 4 is appropriate reaction field forformic acid oxidation.Methanol oxidation on Pt electrodes also proceeds via
the dual path mechanism. Poisonous and reactive inter-
Fig. 8 Step density dependence on the oxidation rate offormic acid on the high index planes of Pd. Reprinted withpermission from Ref. 203, Copyright Elsevier Science (2007).

77,No. 1(2009) 9
mediate species are adsorbed CO and adsorbed formate,respectively, according to SEIRAS study.204)Adsorbedformate is also found on Pt(111) and Pt(100) using a flowcell in the conventional IRAS configuration.205)Activityseries of methanol oxidation, which is estimated by theanodic peak current density in the first positive scan, isas follows in acidic solutions (H2SO4 and HClO4):Pt(111)<Pt(100)<Pt(110).206 ,207)The current densityincreases in alkaline solution, giving the following orderin 0.1 M NaOH: Pt(100)<Pt(111)<Pt(110).208,209)Pt(110),which has step site, has high activity for methanol oxidation.Methanol oxidation on the high-index planes of Pt indicatesthat overall oxidation rate of methanol and decomposi-tion of methanol to CO are enhanced by step.210,211)
3. 5 Oxidation of glucoseGlucose-oxygen fuel cell can be applied to the batteryof cardiac pacemakers and artificial heart. Elucidation ofsurface structures enhancing glucose oxidation is impor-tant for this purpose. Mechanism of glucose oxidationwas studied on Pt electrodes using IRAS.212 -214)
Gluconolactone, carboxylic acid and CO2 were produced.Activity series of glucose oxidation, which is estimatedby the anodic peak current density in the positive scanof the voltammogram, is as follows in acidic solution:Pt(110)<Pt(100)<Pt(111).215)Pt(111) also has the highestactivity in alkaline solution: Pt(100)~Pt(100)<Pt(111).216)
The oxidation of glucose was studied on n(100)-(111) (2 ≤n ≤ 14, ∞) surfaces of Pt in 0.1 M HClO4. Anodic currentdensity due to glucose oxidation increases with theincrease of (100) terrace width.217)
One of the interesting topics is the oxidation of glucoseon chiral surfaces. Figure 9 shows hard sphere models ofchiral Pt(643) surface.218)Small domains of (111), (100) and(110) form chiral structure as shown in Fig. 9b. Pt(643)R
and Pt(531)R have higher oxidation rate for L-glucosethan D-glucose, showing enantiomeric electrochemicalresponse.218,219)Other optically active compounds such asmannose, arabinose and xylose also have strong ena-tiomeric response on chiral surfaces.220,221)Chiral alkanols,however, show weak enathiomeric response comparedwith sugars. One of the possible explanations is thatmolecules having cyclic structures are more likely tomeet the necessary geometrical conditions for the obser-vation of enantiomeric effects. It is also probable that thealdehydic carbonyl function on glucose and related mole-cules hold the key to differences in enantioselectivity.222)
High-index planes are good models of shape-controllednanoparticles that can be used for practical electro-cata-lysts. If active surface structures can be built onnanoparticles, the activity of practical electrocatalystswill be enhanced dramatically. Preparation and electro-chemistry of shape-controlled nanoparticles have beenstudied extensively since Elsayed reported the prepara-tion of cubic and tetrahedral Pt nanoparticles.223-228)
Deeper understanding of the structure and the reactionof high-index planes is important for the elucidation ofthe origin of the catalytic activity of nanoparticles.
4 EC-STM for Reaction Analysis
Junji INUKAI
EC-STM has been one of the most powerful tools tounderstand the static structures on electrodes in solu-tion.3) Recently, it is widely used to investigate variouselectrochemical reactions,20)showing even the dynamicfeatures on electrodes.18,229)Advances in the EC-STMstudies on the electrochemical reactions are described inthis section.In vacuum, the topmost surface of Pt(100) is known tobe hexagonally reconstructed, in order for the surfaceenergy to be lowered (Fig. 10).230)This reconstructedsurface is called Pt(100)-hex-R0.7˚. The reconstruction ofPt(100), as well as Au(100), was historically started to beinvestigated by the use of LEED after the sample wasemersed from solution into vacuum. After Clavilier andcoworkers reported the powerful, yet convenient methodto expose well-defined Pt surfaces in solution,5)Pt(100)surface became widely used for precise electrochemicalstudies.231)In-situ X-ray reflectivity measurements werethen carried out on a clean Pt(100) surface immersed insolution,117)and EC-STM was next applied to the Pt(100)electrode.
In situ STM revealed that the Pt(100) surfaces pre-pared by flame annealing followed by slow cooling in aH2 stream exhibit atomically flat terrace-step features ina 0 .1 M HClO4 solution.232)Atomically flat terracesextended over several hundreds of nanometers in width,and straight monatomic-height steps are positioned most-ly in the <110> direction (Fig. 11a). On an atomicallyflat terrace, atomic images of the Pt(100)-(1×1) struc-ture were obtained at a potential near the hydrogen evo-lution reaction almost perfectly: the unreconstructedPt(100) surface was exposed by the flame annealing and
Fig. 9 (a) Hard sphere models of chiral surfaces: Pt(643)S
and Pt(643)R. The (111) (gray line), (110) (white line), and (100)(black line) sites comprising the kink are indicated. Whitespheres show the kink edges. (b) Cahn-Ingold-Preloganalogy used to define the absolute stereochemistry of thekink site as either S or R. Reprinted with permission fromRef. 218, Copyright American Chemical Society (1999).
10 Electrochemistry
quenching method (Fig. 11b).In order to understand the different surface structureson Pt(100) in vacuum and in solution, the Pt(100)-hex-R0.7˚ was prepared in vacuum, transferred into solution,and electrode potentials were applied. Then, the Pt sam-ple was transferred back into vacuum to be examinedby LEED and STM.233)Figure 12 shows the STM imageof the Pt(100) surface emersed from solution at the elec-trode potential of 0.2 V vs. RHE. It is clearly seen thatthe most of the surface was changed to (1×1) after theadsorption of hydrogen atoms in solution. Also seen arethe reconstruction domains remained, which are shownby arrows in Fig. 12. In this way, STM solved a longlasting issue of the reconstruction of Pt(100) surface:hydrogen adsorption lifts the Pt(100) surface to (1×1)from hex-R0.7˚. It was also revealed that the adsorptionof hydrogen atoms from a gas-phase hydrogen, H2,changes the surface from hex-R0.7˚ to (1×1).233)In thecase of the EC-STM observation in solution (Fig. 11), thesample was slowly cooled down under hydrogen afterthe annealing. In this way, the surface is expected tohave been slowly flattened to have wide terraces (Fig.11a) with hydrogen atoms adsorbed on the surface. At alow electrode potential in solution, the hydrogen atomsremained attached on the surface, and the (1×1) struc-ture was observed by EC-STM (Fig. 11b). The hydrogenadsorption was thus correlated with the phase transitionof the Pt(100) surface by EC-STM.Now, dynamic approaches are needed to understandthe kinetics of the phase transition. Magnussen and
coworkers have developed a high-speed electrochemicalSTM, which allows one to obtain atomic resolutionimages at acquisition rates up to 25 images per sec-ond.234)By using this high-speed STM (video-STM), thedynamic behavior was observed of five-atom-wide,hexagonally ordered strings of Au atoms embedded inthe square lattice of the Au(100)-(1×1) surface.229)Aquasi-collective lateral motion of these strings was foundboth along the strings and in the direction perpendicularto them. The perpendicular motion can be ascribed tosmall atomic displacements in the strings induced bypropagating kinks. These defects were also suggested toprovide a mechanism for the exchange of Au atomsbetween the two string ends, required for motion instring direction.Atomic-scale dynamic processes during Cu(100) disso-lution/deposition in 0.01 M HCl solutions were also stud-ied by video-STM.235)Figure 13 shows a sequence of con-secutive images from a video recorded in a solution con-taining 2×10⁻⁶ M Cu ions. The equilibrium fluctuations
Fig. 10 LEED pattern (a) and STM image (b), andstructural model (c) for Pt(100) reconstructed surfaceobtained in vacuum. Hexagon shows (1×1) spots. Reprintedwith permission from Ref. 233, Copyright TheElectrochemical Society (2003).
Fig. 12 STM image of Pt(100) emersed from a 5 mMH2SO4 at 0.2 V vs. RHE. Reprinted with permission fromRef. 233, Copyright The Electrochemical Society (2003).
Fig. 11 Large-scale (200 nm×200 nm) (a) and high-resolution (6 nm×6 nm) (b) in-situ STM images of Pt(100) in0.1 M HClO4. The sample potential was 0.15 V vs. RHE, andthe tunneling current, 26 nA. Reprinted with permissionfrom Ref. 232, Copyright American Chemical Society (1998).
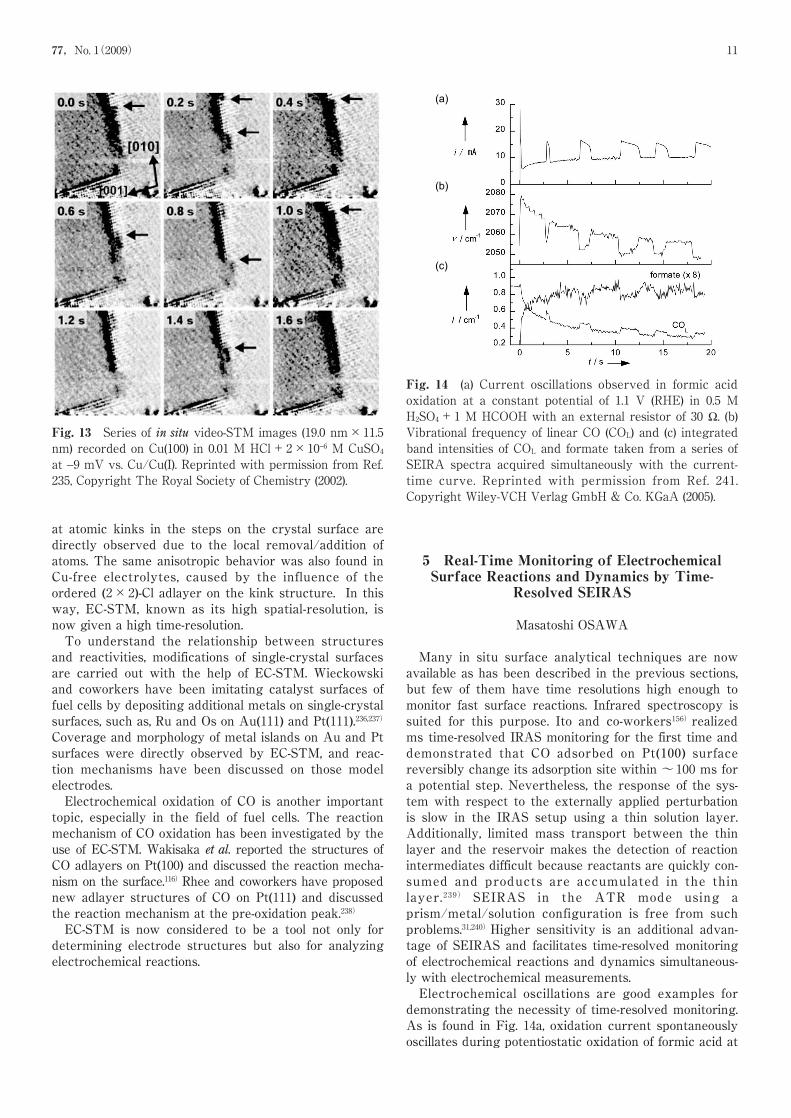
77,No. 1(2009) 11
at atomic kinks in the steps on the crystal surface aredirectly observed due to the local removal/addition ofatoms. The same anisotropic behavior was also found inCu-free electrolytes, caused by the influence of theordered (2×2)-Cl adlayer on the kink structure. In thisway, EC-STM, known as its high spatial-resolution, isnow given a high time-resolution.To understand the relationship between structuresand reactivities, modifications of single-crystal surfacesare carried out with the help of EC-STM. Wieckowskiand coworkers have been imitating catalyst surfaces offuel cells by depositing additional metals on single-crystalsurfaces, such as, Ru and Os on Au(111) and Pt(111).236,237)
Coverage and morphology of metal islands on Au and Ptsurfaces were directly observed by EC-STM, and reac-tion mechanisms have been discussed on those modelelectrodes.Electrochemical oxidation of CO is another importanttopic, especially in the field of fuel cells. The reactionmechanism of CO oxidation has been investigated by theuse of EC-STM. Wakisaka et al. reported the structures ofCO adlayers on Pt(100) and discussed the reaction mecha-nism on the surface.116)Rhee and coworkers have proposednew adlayer structures of CO on Pt(111) and discussedthe reaction mechanism at the pre-oxidation peak.238)
EC-STM is now considered to be a tool not only fordetermining electrode structures but also for analyzingelectrochemical reactions.
5 Real-Time Monitoring of ElectrochemicalSurface Reactions and Dynamics by Time-
Resolved SEIRAS
Masatoshi OSAWA
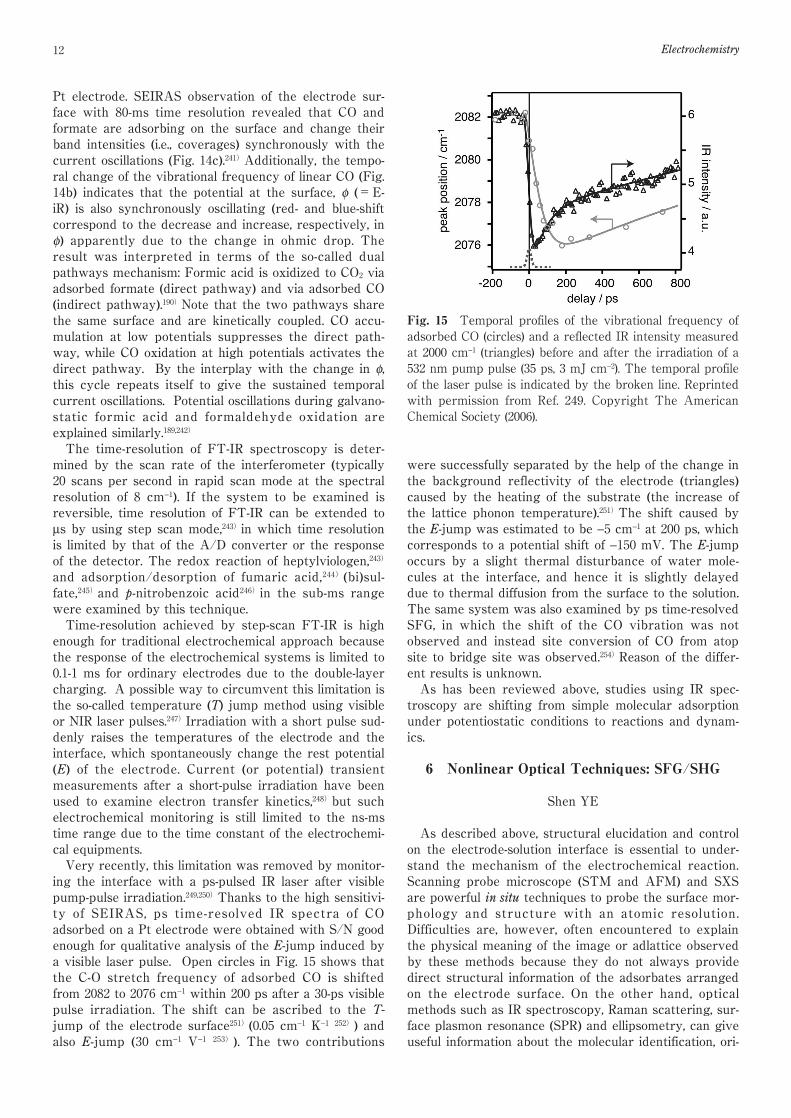
Many in situ surface analytical techniques are nowavailable as has been described in the previous sections,but few of them have time resolutions high enough tomonitor fast surface reactions. Infrared spectroscopy issuited for this purpose. Ito and co-workers156)realizedms time-resolved IRAS monitoring for the first time anddemonstrated that CO adsorbed on Pt(100) surfacereversibly change its adsorption site within ~100 ms fora potential step. Nevertheless, the response of the sys-tem with respect to the externally applied perturbationis slow in the IRAS setup using a thin solution layer.Additionally, limited mass transport between the thinlayer and the reservoir makes the detection of reactionintermediates difficult because reactants are quickly con-sumed and products are accumulated in the thinlayer.239) SEIRAS in the ATR mode using aprism/metal/solution configuration is free from suchproblems.31,240)Higher sensitivity is an additional advan-tage of SEIRAS and facilitates time-resolved monitoringof electrochemical reactions and dynamics simultaneous-ly with electrochemical measurements.Electrochemical oscillations are good examples fordemonstrating the necessity of time-resolved monitoring.As is found in Fig. 14a, oxidation current spontaneouslyoscillates during potentiostatic oxidation of formic acid at
Fig. 13 Series of in situ video-STM images (19.0 nm×11.5nm) recorded on Cu(100) in 0.01 M HCl+2×10⁻⁶ M CuSO4at −9 mV vs. Cu/Cu(I). Reprinted with permission from Ref.235, Copyright The Royal Society of Chemistry (2002).
Fig. 14 (a) Current oscillations observed in formic acidoxidation at a constant potential of 1.1 V (RHE) in 0.5 MH2SO4+1 M HCOOH with an external resistor of 30 Ω. (b)Vibrational frequency of linear CO (COL) and (c) integratedband intensities of COL and formate taken from a series ofSEIRA spectra acquired simultaneously with the current-time curve. Reprinted with permission from Ref. 241.Copyright Wiley-VCH Verlag GmbH & Co. KGaA (2005).
12 Electrochemistry
Pt electrode. SEIRAS observation of the electrode sur-face with 80-ms time resolution revealed that CO andformate are adsorbing on the surface and change theirband intensities (i.e., coverages) synchronously with thecurrent oscillations (Fig. 14c).241)Additionally, the tempo-ral change of the vibrational frequency of linear CO (Fig.14b) indicates that the potential at the surface, φ (=E-iR) is also synchronously oscillating (red- and blue-shiftcorrespond to the decrease and increase, respectively, inφ) apparently due to the change in ohmic drop. Theresult was interpreted in terms of the so-called dualpathways mechanism: Formic acid is oxidized to CO2 viaadsorbed formate (direct pathway) and via adsorbed CO(indirect pathway).190)Note that the two pathways sharethe same surface and are kinetically coupled. CO accu-mulation at low potentials suppresses the direct path-way, while CO oxidation at high potentials activates thedirect pathway. By the interplay with the change in φ,this cycle repeats itself to give the sustained temporalcurrent oscillations. Potential oscillations during galvano-static formic acid and formaldehyde oxidation areexplained similarly.189,242)
The time-resolution of FT-IR spectroscopy is deter-mined by the scan rate of the interferometer (typically20 scans per second in rapid scan mode at the spectralresolution of 8 cm−1). If the system to be examined isreversible, time resolution of FT-IR can be extended toµs by using step scan mode,243)in which time resolutionis limited by that of the A/D converter or the responseof the detector. The redox reaction of heptylviologen,243)
and adsorption/desorption of fumaric acid,244)(bi)sul-fate,245)and p-nitrobenzoic acid246)in the sub-ms rangewere examined by this technique.Time-resolution achieved by step-scan FT-IR is highenough for traditional electrochemical approach becausethe response of the electrochemical systems is limited to0.1-1 ms for ordinary electrodes due to the double-layercharging. A possible way to circumvent this limitation isthe so-called temperature (T) jump method using visibleor NIR laser pulses.247)Irradiation with a short pulse sud-denly raises the temperatures of the electrode and theinterface, which spontaneously change the rest potential(E) of the electrode. Current (or potential) transientmeasurements after a short-pulse irradiation have beenused to examine electron transfer kinetics,248)but suchelectrochemical monitoring is still limited to the ns-mstime range due to the time constant of the electrochemi-cal equipments.Very recently, this limitation was removed by monitor-ing the interface with a ps-pulsed IR laser after visiblepump-pulse irradiation.249,250)Thanks to the high sensitivi-ty of SEIRAS, ps time-resolved IR spectra of COadsorbed on a Pt electrode were obtained with S/N goodenough for qualitative analysis of the E-jump induced bya visible laser pulse. Open circles in Fig. 15 shows thatthe C-O stretch frequency of adsorbed CO is shiftedfrom 2082 to 2076 cm−1 within 200 ps after a 30-ps visiblepulse irradiation. The shift can be ascribed to the T-jump of the electrode surface251)(0.05 cm−1 K−1 252)) andalso E-jump (30 cm−1 V−1 253)). The two contributions
were successfully separated by the help of the change inthe background reflectivity of the electrode (triangles)caused by the heating of the substrate (the increase ofthe lattice phonon temperature).251)The shift caused bythe E-jump was estimated to be −5 cm−1 at 200 ps, whichcorresponds to a potential shift of −150 mV. The E-jumpoccurs by a slight thermal disturbance of water mole-cules at the interface, and hence it is slightly delayeddue to thermal diffusion from the surface to the solution.The same system was also examined by ps time-resolvedSFG, in which the shift of the CO vibration was notobserved and instead site conversion of CO from atopsite to bridge site was observed.254)Reason of the differ-ent results is unknown.As has been reviewed above, studies using IR spec-
troscopy are shifting from simple molecular adsorptionunder potentiostatic conditions to reactions and dynam-ics.
6 Nonlinear Optical Techniques: SFG/SHG
Shen YE
As described above, structural elucidation and controlon the electrode-solution interface is essential to under-stand the mechanism of the electrochemical reaction.Scanning probe microscope (STM and AFM) and SXSare powerful in situ techniques to probe the surface mor-phology and structure with an atomic resolution.Difficulties are, however, often encountered to explainthe physical meaning of the image or adlattice observedby these methods because they do not always providedirect structural information of the adsorbates arrangedon the electrode surface. On the other hand, opticalmethods such as IR spectroscopy, Raman scattering, sur-face plasmon resonance (SPR) and ellipsometry, can giveuseful information about the molecular identification, ori-
Fig. 15 Temporal profiles of the vibrational frequency ofadsorbed CO (circles) and a reflected IR intensity measuredat 2000 cm−1 (triangles) before and after the irradiation of a532 nm pump pulse (35 ps, 3 mJ cm−2). The temporal profileof the laser pulse is indicated by the broken line. Reprintedwith permission from Ref. 249. Copyright The AmericanChemical Society (2006).
77,No. 1(2009) 13
entation and conformation on the electrode surfaces.Most of these optical techniques are, however, not intrin-sically surface-specific, and hence hard to distinguish thecontribution from the electrode surface and electrolytesolution. SERS29)and SEIRAS31)have been used todetect the surface species but difficulties in samplepreparation and quantitative spectral analysis limit their
application.As 2nd-order nonlinear optical technique, sum frequen-
cy generation (SFG)255)and second harmonic generation(SHG)255)are attracting much attention in electrochemi-cal science due to their high surface selectivity, sensitivi-ty, and versatile applicability and can provide molecularand electronic structure information on the electrodesurface with a sensitivity of sub-monolayer level.34-42)
The source of SFG is the non-linear polarization P(2),induced by two laser beams at frequency ω1 and ω2,where χ(2) is the 2nd-order susceptibility as a 3rd-rank ten-sor consisting of 27 (33) elements.255)The tensor elementχijk represents Cartesian component i (i= x, y, z) of thesusceptibility induced by Cartesian components j and k(j, k= x, y, z) of the electric field, respectively. Since thefield here is the total field applied (Eω1+Eω2), it is easy toknow by expanding the above-mentioned equation thatP(2) radiation contains components oscillating at double(2ω1, 2ω2), sum (ω1+ω2), difference frequencies (ω1-ω2)of the two applied fields. The oscillating polarizationswill emit lights at diverse frequencies with intensitiesproportional to the square of each P(2). This is the originfor the 2nd-order nonlinear optical process such as SFGand SHG where SHG can be regarded as a special caseof SFG when ω1=ω2. Since χ(2) is invariant in a cen-trosymmetric material but changes its sign by the inver-sion operation, χ(2) must be zero in the bulk medium withinversion symmetry under the electric dipole approxima-tion. Therefore, P(2) radiation will occur only in non-cen-trosymmetric materials and at surface or interfacewhere the bulk symmetry is broken, SFG and SHG canbe used to probe the interfacial properties of the cen-trosymmetric materials.Due to its experimental simplicity, SHG system hasbeen applied in study of the electronic and geometricstructures on the electrode surface by fixing ω in visibleor near IR region34,35)since 1980s while SFG system hasbeen developed quickly with the progress in the lasertechnology in recent years.41)Usually, SFG is used asvibration spectroscopy where ω1 is fixed in visible, near-IR or UV region (ωvis) while ω2 is tunable in IR region(ωIR). As ωIR is equal to local vibration level on the sur-face, χ(2) is resonantly enhanced and a peak is observedin the SFG spectrum. By measuring a SFG spectrum asa function of wIR, the vibrational modes of the moleculesat the surface / interface can be probed with differentpolarization combination of SFG, visible and IR. SFG sig-nal can be further enhanced when ωvis and/or ωSFG arealso resonant with existing surface states. Details aboutthe theory, experimental system and application for
these nonlinear optical techniques have been describedelsewhere.41,258-261)
Since SHG is sensitive to surface symmetry of metalsubstrate, it has been successfully employed to studyUPD of metal, anion adsorption and surface reconstruc-tion on single crystal electrode surface.34,35)Figure 16shows polar plots of in situ SHG rotational anisotropymeasurement on Au(111) electrode in 0.01 M HClO4 solu-tion before (left) and after (right) the surface reconstruc-tion for three different polarization conditions.33)In thepositive potential region (left), the SHG anisotropy pat-terns exhibit the three-fold rotational axis for all polariza-tions as expected for Au(111) surface with C3v symme-try, indicating a well-defined (1×1) structure there. Inthe negative potential region (right), however, the SHGanisotropy is clearly different from that of C3v symmetry.Detailed analysis shows the presence of a new Cv sym-metry on the Au(111) surface, corresponding to a (√3×23) structure. The reversible transition from C3v to Cvrotational symmetry from the SHG-anisotropy patternswith electrode potential is attributed to the lifting andformation of reconstruction on Au(111) surface.33)The insitu SHG measurements also confirmed that anionadsorption can easily lead to the reconstruction on theAu(111) surface (also see Figs. 1~3 in the presentreview).33)
On the other hand, SFG spectroscopy is widely usedto investigate the structure, symmetry, and ordering ofthe molecules on the interface which is hard to beobtained by the conventional vibration spectroscopy.37-42)
Fig. 16 Polar plots of SHG intensity vs. azimuthal angle (φ)of Au(111) electrode in the positive (left) and negative (right)potential regions (pzc = 0.27 V vs. SCE), and for p/p, p/s,and s/s polarization of incident ω- and emitted 2ω-beams.Electrolyte 0.01 M HClO4. Reprinted with permission fromRef. 33, Copyright Elsevier Science (1992).
ΣΣ χijk Ej Ek= χijk:EEj,ki
P =(2)(2) (2)
14 Electrochemistry
One of the most successful examples for SFG applicationis elucidation for structure of water molecules on theinterface.262,263)Although many theoretical studies aboutthe structural properties of water molecules on variousinterfaces have been carried out, the experimental inves-tigations on the structure of water have been mainlydone in vapor or bulk aqueous media due to a lack ofeffective experimental probes.264)Shen and co-workersfirstly reported the SFG spectra of the water on theair/water and solid/water interfaces.262,263)A sharp peakwas observed at 3680 cm−1 at water/air interface orfused quartz surface modified by an octadecyltrichlorosi-lane (OTS) monolayer, indicating the existence of watermolecules without hydrogen bonding. In addition to thefree OH group, a broad OH stretching bands of the inter-facial water molecules can be also found around 3200cm−1 closely resemble that of a hexagonal ice surface inair, confirming that interfacial water molecules arealigned in a well-ordered structure as a result of thehydrophobic effect. Since the pioneer work, many experi-mental as well as theoretical researches have been car-ried out on various water interfaces and largely promoteour understanding on the interfacial water structuresand properties.38,42,265,266)
In addition to the surface selectivity, SFG spec-troscopy shows several unique features in comparisonwith IR and Raman spectroscopy. As an example, Fig.17 shows in situ SFG study for reconstruction process offatty acid bilayer, which is a model system for biomem-brane, on solid surface in solution.256,257,267,268)Since bilayerstructure has a centrosymmetry which is SFG-inactive,and hence an asymmetric bilayer system are preparedby successively depositing deuterated (D) layer and reg-
ular fatty acid (H) layer (i.e., DH or HD bilayer) to makeit SFG-active. Figure 17a exhibits in situ time-resolvedSFG spectra in the C-H stretching region for a DH bilay-er in a 0.3 mM NaHCO3 containing 0.2 mM Cd2+. Twointense peaks around 2875 and 2940 cm−1 soon aftersetup, which can be assigned to symmetric and Fermi-resonance C-H stretching modes of the terminal CH3group in the H layer while no peak from CH2 groups canbe observed. Since CH2 groups become SFG-inactive ifthe alkyl chains of the fatty acid molecules align in anall-trans conformation, this result implies that a well-ordered H layer was constructed here. It is interesting tonote that these two SFG peaks became weaker with theimmersion process in the solution (Fig. 17a). After 5hr. immersion, the peak intensities decreased to ca. onethird of its original values, suggesting that the structureof the top layer (H) of the DH bilayer significantlychanged during the immersion process in the solution.In order to understand the reason for the structuralchange, SFG experiment was carried out for the DHbilayer in the same solution but without Cd2+ (Fig. 17b).In this case, in addition to the strong peaks from CH3groups, one may see some weak CH2 bands around 2850and 2920 cm−1 after bilayer preparation, which may berelated to a slightly higher density of gauche defects inthe bilayer when Cd2+ is not included in solution, theSFG spectrum is generally similar to that in Fig. 17a-(i).It is mostly important issue to note that the intensities ofthe SFG peaks from CH3 group are almost constant afterlong term immersion in the solution (Fig. 17b) which iscompletely different from those observed in a solutionwith Cd2+. This feature can be attributed to a structuralchange on the surface of the fatty acid bilayer inducedby the metal cation Cd2+. Due to the strong electrostaticinteraction between the carboxylate group with Cd2+,part of the topmost-layer molecules are flipped over tothe top of the bilayer gradually forming a new bilayerstructure.267)This process will decrease the symmetry ofthe original DH bilayer and therefore, SFG signals
Fig. 17 In situ SFG spectra of LB bilayer of deuterated (D)and regular (H) stearic acid on a fused quartz surface in 0.3mM NaHCO3 with (a) 0.2 mM Cd2+ and (b) 0 mM Cd2+ forvarious immersion times. The polarization combination is s-SFG, s-Vis, p-IR (ssp). Reprinted with permission from Ref.267, Copyright American Chemical Society (2004).
Fig. 18 In situ sum-frequency generation (SFG) spectra ofthe tri-ruthenium complex SAM on gold electrode surfacein 0.1 M HClO4 in the frequency region of the νas(OCO)vibration at +0.3 V and +0.9 V (vs. SCE), respectively. EachSFG spectrum is co-added over 100 s. Reprinted withpermission from Ref. 269, Copyright Wiley-VCH VerlagGmbH & Co. KGaA. (2005).
77,No. 1(2009) 15
decreases with immersion (Fig. 17a). Absence of thesechanges in the SFG spectra in a solution without Cd2+
confirms the influence of the metal cation in solution(Fig. 17b). These structural changes on the surface offatty acid bilayer can be only sensitively detected by insitu SFG measurement in comparison with other conven-tion spectroscopy methods such as IR and Raman.SFG spectroscopy has been applied as an effectivemethod to study the structure on the electrode and solu-tion interface from early stage of SFG development. Theconventional in situ IR measurement has a number ofdisadvantages in electrochemical environment.41)First, asthe species interested exist both in solution and on elec-trode surface, it is hard to completely distinguish theircontribution to IR spectra due to the low surface selec-tivity of the method; Second, all in situ IR spectra on theelectrochemical interface are differential spectra whichalways need a reference spectrum recorded on differentpotential or under different conditions. It is almostimpossible to get absolute structural information fromthe IR spectra if one does not know the exact structuralinformation in the reference spectra. In fact, such kindof information is not available for most cases on theinterface between electrode and solution. Shape andintensity of IR spectra can heavily affected by selectionof reference spectrum and explanation will greatlychange if the explanation for the reference spectrum ischanged. Third, it is hard to investigate the fast reactiondynamics on the electrode surface using FTIR spectrom-eter due to its time resolution but will be easier for SFGspectroscopy using ultra-short laser pulses.254)In theseaspects, SFG demonstrates its advantage to the IR spec-tra due its unique feature of nonlinear optical spec-troscopy.SFG measurement directly provides an absolute vibra-tion spectrum since it does not require a reference spec-trum (one needs to measure a standard spectrum in SFGmeasurement to normalize beam overlap and spectralprofile but it has different meaning with reference spec-trum for in situ IR measurement). Sasaki and his co-workers investigated a self-assembled monolayer (SAM)of an oxo-centered tri-ruthenium cluster [Ru3(µ3-O) (µ-CH3COO)6(CO)(L1)(L2)] (L1=[(NC5H4)CH2NHC(O) (CH2)10S-]2,L2=4-methylpyridine) on gold electrode surface by insitu IR measurement.269)The in situ IR characterizationgives valuable information for CO ligand the cluster dur-ing the potential-dependent ligand exchange reactionwhere the IR frequency and peak shape for CO-ligandlargely change with potential and it is easy to distinguishthe contribution from sample and reference spectra.However, the analysis is facing a difficulty to understandthe potential dependence of six acetate groups in thecluster. The symmetric and asymmetric OCO stretchingmodes change with oxidation states of central Ru ions inquite complicated way. It is almost impossible to sepa-rate the spectral contribution from sample and referenceIR spectra in comparison with CO ligand. Thus, in situSFG measurements were carried out to determine theabsolute spectra for the acetate group in the SAM.Figure. 18 shows SFG spectra (1700~1500 cm−1) for one-
electron redox process between [(RuII-CO)RuIIIRuIII]0
(+0.3 V) and [(RuIII-CO)RuIIIRuIII]+1 (+0.9 V). The SFGspectrum of the νas(OCO) at +0.3 V gives two peaks at1615 and 1573 cm−1. As the potential is stepped to +0.9 V,the peak at 1615 cm−1 decreases to nearly half intensityand the peak at 1573 cm−1 almost disappears. Based onthe spectral changes here, we can quantitatively explainthe in situ IR spectra namely one of νas(OCO) modesbecomes weaker and another one disappears after one-electron oxidation at +0.9 V.269)
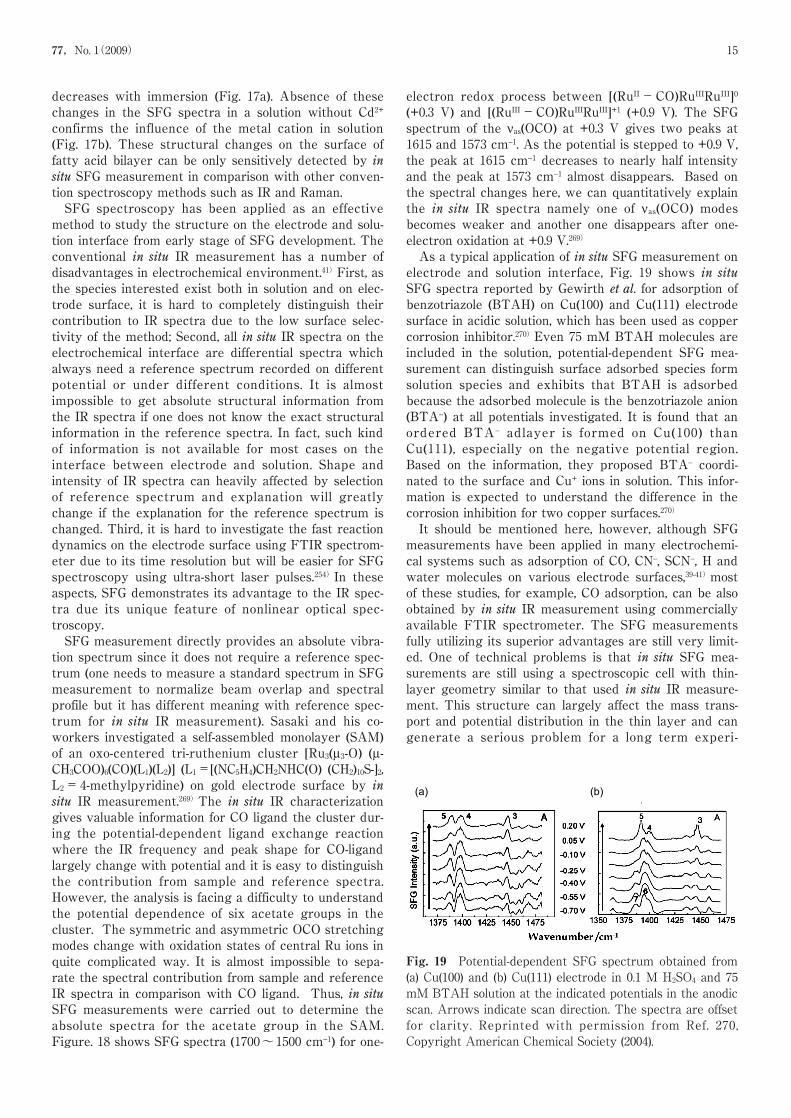
As a typical application of in situ SFG measurement onelectrode and solution interface, Fig. 19 shows in situSFG spectra reported by Gewirth et al. for adsorption ofbenzotriazole (BTAH) on Cu(100) and Cu(111) electrodesurface in acidic solution, which has been used as coppercorrosion inhibitor.270)Even 75 mM BTAH molecules areincluded in the solution, potential-dependent SFG mea-surement can distinguish surface adsorbed species formsolution species and exhibits that BTAH is adsorbedbecause the adsorbed molecule is the benzotriazole anion(BTA−) at all potentials investigated. It is found that anordered BTA− adlayer is formed on Cu(100) thanCu(111), especially on the negative potential region.Based on the information, they proposed BTA− coordi-nated to the surface and Cu+ ions in solution. This infor-mation is expected to understand the difference in thecorrosion inhibition for two copper surfaces.270)
It should be mentioned here, however, although SFGmeasurements have been applied in many electrochemi-cal systems such as adsorption of CO, CN−, SCN−, H andwater molecules on various electrode surfaces,39-41)mostof these studies, for example, CO adsorption, can be alsoobtained by in situ IR measurement using commerciallyavailable FTIR spectrometer. The SFG measurementsfully utilizing its superior advantages are still very limit-ed. One of technical problems is that in situ SFG mea-surements are still using a spectroscopic cell with thin-layer geometry similar to that used in situ IR measure-ment. This structure can largely affect the mass trans-port and potential distribution in the thin layer and cangenerate a serious problem for a long term experi-
Fig. 19 Potential-dependent SFG spectrum obtained from(a) Cu(100) and (b) Cu(111) electrode in 0.1 M H2SO4 and 75mM BTAH solution at the indicated potentials in the anodicscan. Arrows indicate scan direction. The spectra are offsetfor clarity. Reprinted with permission from Ref. 270,Copyright American Chemical Society (2004).
16 Electrochemistry
ment.271-273)On the other hand, the thin-layer structure ofelectrolyte solution can strongly absorb IR light and willmake a difficulty to study the structure of the watermolecules on the electrode surface.274)Total internalreflection mode with Kretschmann geometry may be onepromising way to overcome the problem.Although many issues need to be improved, webelieve that SFG and SHG techniques will provide usvaluable structural information on the electrode surfacewhich is impossible to be obtained by conventional spec-troscopy methods.
7 Summary & OutlookIn this review, we summarized recent advances in in
situ surface characterization techniques combined withsingle crystal electrochemistry. The understanding ofelectrolyte-electrode interface at atomic and/or molecu-lar level has made considerable progress by the use ofthose in situ techniques in the past decade, and theresults have provided many knowledge for various elec-trode reaction processes and new surface design. In thenear future, for example, to precisely understand variouselectrode reaction processes in room temperature ionicliquids (RTILs) which are promising electrolyte for thecontrol of various electrochemical reaction on electrodesurfaces275)at atomic and/or molecular level, in situ tech-niques will provide us new information. Surface electro-chemistry using single crystal electrodes will play animportant role in the understanding of electrochemicalreaction process.
AcknowledgementThis work is partly supported by Grant-in-Aid fromthe Ministry of Education, Culture, Sports, Science, andTechnology, Japan.
References1)A. J. Bard and R. M. Crooks, Langmuir, 22, 10297(2006), and see articles published in the same specialissue on Electrochemistry from pp. 10299-10875.
2)G. Jerkiewicz, Solid-Liquid Electrochemical Interfaces(ACS Symposium Series 656), G. Jerkiewicz, (Eds. M. P.Soriaga, K. Uosaki, and A. Wieckowski), AmericanChemical Society, Washington DC, p. 1 (1997).
3)K. Itaya, Prog. Surf. Sci., 58, 121 (1998).4)A. Wieckowski, Interfacial Electrochemistry, MarcelDekker, Inc, New York (1999).
5)J. Clavilier, R. Faure, G. Guinet, and R. Durand, J.Electroanal. Chem., 107, 205 (1980).
6)J. Clavilier, J. Electroanal. Chem., 107, 205 (1980).7)A. Hamelin, Modern Aspects of Electrochemistry, (Eds. B.E. Conway, R. E. White and J.O’M. Bockris,) No.16,Plenum Press, New York, Chap. 1 (1985).
8)A. Hamelin, J. Electroanal. Chem., 407, 1 (1996).9)S. Motoo and N. Furuya, J. Electroanal. Chem., 167, 309(1984).
10)K. Sashikata, N. Furuya, and K. Itaya, J. Vac. Sci.Technol. B, 9, 457 (1991).
11)R. J. Nichols, Adsorption of molecules at metal electrodes,(Eds. J. Lipkowski and P. N. Ross), VCH, New York, p.347 (1992).
12)T. Iwasita and F. C. Nart, Prog. Surf. Sci., 55, 271(1997).
13)H. D. Abruña, Modern Techniques for In-Situ InterfaceCharacterization in Electrochemical Interfaces, VCH,New York (1991).
14)J. Lipkowski and P. N. Ross, Structure of ElectrifiedInterfaces, VCH, New York (1993).
15)K. Itaya and E. Tomita, Surf. Sci., 201, L507 (1988).16)D. M. Kolb, Prog. Surf. Sci., 51, 109 (1996).17)A. A. Gewirth and B. K. Niece, Chem. Rev., 97, 1129(1997).
18)O. M. Magnussen, Chem. Rev., 102, 679 (2002).19)K. Itaya, Electrochemistry, 74, 19 (2006).20)D. Wang and L.-J. Wan, J. Phys. Chem. C, 111, 16109(2007).
21)S. Chiang, Chem. Rev., 97, 1083 (1997).22)S. De Feyter and F. C. De Schryver, Chem. Soc. Rev.,32, 139 (2003).
23)M. Hepel, K. Kanige, and S. Bruckenstein, J.Electroanal. Chem., 266, 409 (1989).
24)A. J. Kelly and N. Oyama, J. Phys. Chem., 95, 9579(1991).
25)K. Shimazu and H. Kita, J. Electroanal. Chem., 341, 361(1992).
26)K. Shimazu, I. Yagi, Y. Sato, and K. Uosaki, Langmuir,8, 1385 (1992).
27)T. Tatsuma, S. Kikuyama, and N. Oyama, J. Phys.Chem., 97, 12067 (1993).
28)H. Uchida, N. Ikeda, and M. Watanabe, J. Electroanal.Chem., 424, 5 (1997).
29)Z. Q. Tian, B. Ren, J. Li, and Z. Yang, Chem. Commun.,2007, 3514.
30)K. Ataka, T. Yotsuyanagi, and M. Osawa, J. Phys.Chem., 100, 10664 (1996).
31)M. Osawa, Bull. Chem. Soc. Jpn., 70, 2861(1997).32)K. Ataka and M. Osawa, Langmuir, 14, 951 (1998).33)B. Pettinger, J. Lipkowski, S. Mirwald, and A.Friedrich, J. Electroanal. Chem., 329, 289 (1992).
34)G. L. Richmond, J. M. Robinson, and V. L. Shannon,Prog. Surf. Sci., 28, 1 (1988).
35)R. M. Corn and D. A. Higgins, Chem. Rev., 94, 107(1994).
36)I. Yagi, J. M. Lantz, S. Nakabayashi, R. M. Corn, andK. Uosaki, J. Electroanal. Chem., 401, 95 (1996).
37)P. Miranda and Y. R. Shen, J. Phys. Chem. B, 103, 3292(1999).
38)G. L. Richmond, Chem. Rev., 102, 2693 (2002).39)C. D. Bain, J. Chem. Soc. Faraday Trans., 91, 1281(1995).
40)A. Tadjeddine and A. Peremans, Spectroscopy forSurface Science, (Eds. R. J. H. Clark and R. E. Hester),Wiley & Sons Ltd, Chichester, UK, p. 159 (1998).
41)S. Ye and K. Uosaki, Encyclopedia of Electrochemistry,(Ed. A. J. Bard), Vol. 10, Wiley-VCH, Weinheim, p. 513(2007).
42)Y. R. Shen and V. Ostroverkhov, Chem. Rev., 106, 1140(2006).
43)Z. D. Schultz, S. K. Shaw, and A. A. Gewirth, J. Am.Chem. Soc., 127, 15916 (2005).
44)S. Baldelli, Acc. Chem. Res., 41, 421 (2008).45)J. Wang, B. M. Ocko, A. J. Davenport, and H. S. Isaacs,
Phys. Rev. B, 46, 10321 (1992).46)J. Wang, A. J. Davenport, H. S. Isaacs, and B. M. Ocko,
77,No. 1(2009) 17
Science, 255, 1416 (1992).47)B. M. Ocko, G. M. Watson, and J. Wang, J. Phys. Chem.,98, 897 (1994).
48)E. Herrero, L. J. Buller, and H. D. Abruña, Chem. Rev.,101, 1897 (2001).
49)A. Ulman, Introduction to Ultrathin Organic Films,Academic Press, Boston (1991).
50)A. Ulman, Chem. Rev., 96, 1533 (1996).51)G. E. Poirier, Chem. Rev., 97, 1117 (1997).52)J. C. Love, L. A. Estroff, J. K. Kriebel, R. G. Nuzzo, andG. M. Whitesides, Chem. Rev., 105, 1103 (2005).
53)S. Yoshimoto, Bull. Chem. Soc. Jpn., 79, 1167 (2006).54)S. Yoshimoto and K. Itaya, J. Porphyrins
Phthalocyanines, 11, 313 (2007).55)S. Yoshimoto and K. Itaya, Bottom-up Nanofabrication:
Supramolecules, Self-Assemblies, and Organized Films,(Eds. K. Ariga and H. S. Nalwa), American ScientificPublishers, California, Chap. 71 (2008).
56)S. Yoshimoto, S. Sugawara, and K. Itaya,Electrochemistry, 74, 175 (2006).
57)S. Yoshimoto, E. Tsutsumi, R. Narita, K. Fujiwara, M.Murata, Y. Murata, K. Komatsu, O. Ito, and K. Itaya, J.Am. Chem. Soc., 129, 4366 (2007).
58)S. Yoshimoto, Y. Honda, O. Ito, and K. Itaya, J. Am.Chem. Soc., 130, 1085 (2008).
59)S. Yoshimoto and T. Sawaguchi, J. Am. Chem. Soc.,130, 15944 (2008).
60)K. Kaji, S.-L.Yau, and K. Itaya, J. Appl. Phys., 78, 5727(1995).
61)H. Yao, S.-L. Yau, and K. Itaya, Appl. Phys. Lett., 68,1473 (1996).
62)J. Inukai, K. Ito, and K. Itaya, Electrochemistry, 67, 1126(1999).
63)J. E. Anthony, Angew. Chem. Int. Ed., 47, 452 (2008).64)H. Schwertfeger, A. A. Fokin, and P. R. Schreiner,
Angew. Chem. Int. Ed., 47, 1022 (2008).65)B. Ulgut and H. D. Abruña, Chem. Rev., 108, 2721(2008) and references therein.
66)R. Feidenhans'l, Surf. Sci. Rep., 10, 105 (1989).67)I. K. Robinson and D. J. Tweet, Rep. Prog. Phys., 55, 599(1992).
68)M. F. Toney and O. R. Melroy, ElectrochemicalInterface: Modern Techniques for In Situ InterfacialCharacterization, (Ed. H. D. Abruña), VCH Publishers,Inc., New York, Chap. 2 (1991).
69)M. F. Toney and J. McBreen, Interface , TheElectrochemical Society, Spring, Vol. 2, pp. 22-31(1993).
70)M. F. Toney, Synchrotron Techniques in InterfacialElectrochemistry, NATO ASI Series , (Eds. C. A.Melendres and A. Tadjeddine), Kluwer Academic,Boston (1994).
71)B. M. Ocko and J. Wang, Synchrotron Techniques inInterfacial Electrochemistry, NATO ASI Series, (Eds. C.A. Melendres and A. Tadjeddine), Kluwer Academic,Boston (1994).
72)J. Wang, G. M. Watson, and B. M. Ocko, Physica A, 200,679 (1993).
73)B. M. Ocko, J. Wang, A. Davenport, and H. Isaacs,Phys. Rev. Lett., 65, 1466 (1990).
74)B. M. Ocko, G. Helgesen, B. Schardt, J. Wang, and A.Hamelin, Phys. Rev. Lett., 69, 3350 (1992).
75)M. F. Toney, J. G. Gordon, M. G. Sammant, G. L.
Borges, D. G. Wiesler, D. Yee, and L. B. Sorensen,Langmuir, 7, 796 (1991).
76)M. F. Toney, J. G. Gordon, M. G. Sammant, G. L.Borges, O. R. Melroy, D. Yee, and L. B. Sorensen, Phys.Rev. B, 45, 9362 (1992).
77)G. Scherb, A. Kazimirov, J. Zegenhagen, T. Schultz, R.Feidenhans'l, and B. O. Fimland, Appl. Phys. Lett., 71,2990 (1997).
78)C. Aruta, F. Ricci, G. Balestrino, S. Lavanga, P. G.Medaglia, P. Orgiani, A. Tebano, and J. Zegenhagen,Phys. Rev. B, 65, 195408 (2002).
79)A. H. Ayyad, J. Stettner, and O. M. Mugnussen, Phys.Rev. Lett., 94, 066106 (2005).
80)K. Krug, J. Stettner, and O. M. Magnussen, Phys. Rev.Lett., 96, 246101 (2006).
81)M. Takahasi, Y. Hayashi, J. Mizuki, K. Tamura, T.Kondo, H. Naohara, and K. Uosaki, Surf. Sci., 461, 213(2000).
82)K. Uosaki, S. Ye, T. Kondo, and H. Naohara, Thin SolidFilms: Preparation, Characterization, Applications, (Eds.M. P. Soriaga, J. Stickney, L. A. Bottomley, and Y.-G.Kim), Kluwer Academic/Plenum Publishers, NewYork, pp. 17-35 (2002).
83)T. Kondo, J. Morita, M. Okamura, T. Saito, and K.Uosaki, J. Electroanal. Chem., 532, 201 (2002).
84)T. Kondo, K. Tamura, M. Takahasi, J. Mizuki, and K.Uosaki, Electrochim. Acta, 47, 3075 (2002).
85)T. Kondo, J. Morita, K. Hanaoka, S. Takakusagi, K.Tamura, M. Takahasi, J. Mizuki, and K. Uosaki, J.Phys. Chem. C, 111, 13197 (2007).
86)A. Hamelin, J. Electroanal. Chem., 142, 229 (1992).87)X. Gao, A. Hamelin, and M. J. Weaver, J. Chem. Phys.,95, 6993 (1991).
88)M. S. Zei, G. Lehmpfuhl, and D. M. Kolb, Surf. Sci., 221,23 (1989).
89)A. Cuesta, M. Kleinert, and D. M. Kolb, Phys. Chem.Chem. Phys., 2, 5684 (2000).
90)K. Sato, S. Yoshimoto, J. Inukai, and K. Itaya,Electrochem. Commun., 8, 725 (2006).
91)A. Angerstein-Kozlowska, B. E. Conway, A. Hamelin,and L. Stoicoviciu, Electrochim. Acta, 31, 1051 (1986).
92)A. Angerstein-Kozlowska, B. E. Conway, A. Hamelin,and L. Stoicoviciu, J. Electroanal. Chem., 228, 429(1987).
93)R. Woods, Electroanalytical Chemistry: A Series ofAdvances, (Ed. A. J. Bard), Marcel Dekker, New York(1988).
94)C. M. Vitus and A. J. Davenport, J. Electrochem. Soc.,141, 1291 (1994).
95)D. M. Kolb, Prof. Surf. Sci., 51, 109 (1996).96)K. M. Robinson, I. K. Robinson, and W. E. O'Grady,
Surf. Sci., 262, 387 (1992).97)S. Motoo and N. Furuya, Ber. Bunsenges. Chem. Phys.,91, 457 (1987).
98)N. Furuya and S. Koide, Surf. Sci., 220, 18 (1989).99)N. M. Markovic, N. S. Marinkovic, and R. R. Azic, J.
Electroanal. Chem., 241, 309 (1988).100)J. Clavilier, K. El Achi, and A. Rodes, J. Electroanal.
Chem. 272, 253 (1989).101)A. Rodes, K. El Achi, M. A. Zamakhchari, and J.
Clavilier, J. Electroanal. Chem., 284, 245 (1990).102)P. N. Ross, J. Chim. Phys., 88, 1353 (1991).103)J. M. Feliu, A. Rodes, J. M. Orts, and J. Clavilier, Polish
18 Electrochemistry
J. Phys. Chem., 68, 1575 (1994).104)J. M. Feliu, A. Fernindez-Vega, A. Aldaz, and J.
Clavilier, J. Electroanal. Chem., 256, 149 (1988).105)J. Clavilier, J. M. Feliu, and A. Aldaz, J. Electroanal.
Chem., 243, 419 (1988).106)G. Gomez, M. J. Llorca, J. M. Feliu, and A. Aldaz, J.
Electroanal. Chem., 340, 349 (1992).107)P. Rodrlguez, E. Herrero, J. Solla-Gullon, F. J. Vidal-
Iglesias, A. Aldaz, and J. M. Feliu, Electrochim. Acta,50, 4308 (2005).
108)N. Furuya and S. Koide, Surf. Sci., 226, 221 (1990).109)M. Wasberg, M. Hourani, and A. Wieckowski, J.
Electroanal. Chem., 278, 425 (1990).110)T. H. M. Housmans, J. M. Feliu, and M. T. M. Koper, J.
Electroanal. Chem., 572, 79 (2004).111)N. Hoshi, K. Kagaya, and Y. Hori, J. Electroanal. Chem.,
485, 55 (2000).112)N. Hoshi, M. Kuroda, and Y. Hori, J. Electroanal. Chem.,
521, 155 (2002).113)K. Sashikata, Y. Matsui, K. Itaya, and M. P. Soriaga, J.
Phys. Chem., 100, 20027 (1996).114)S. Tanaka, S.-L. Yau, and K. Itaya, J. Electroanal.
Chem., 396, 125 (1995).115)C. M. Vitus, S.-C. Chang, B. C. Schardt, and M. J.
Weaver, J. Phys. Chem., 95, 7559 (1991).116)M. Wakisaka, T. Ohkanda, T. Yoneyama, H. Uchida,
and M. Watanabe, Chem. Commun., 2005, 2710.117)I. M. Tidswell, N. M. Markovic, and P. N. Ross, J.
Electroanal. Chem., 376, 119 (1994).118)I. M. Tidswell, N. M. Markovic, and P. N. Ross, Phys.
Rev. Lett., 71, 1601 (1993).119)C. A. Lucas, N. M. Markovic, and P. N. Ross, Phys. Rev.
Lett., 77, 4922 (1996).120)N. M. Markovic, B. N. Grgur, C. A. Lucas, and P. N.
Ross, Surf. Sci., 384, L805 (1997).121)D. W. Blakely and G. A. Somorjai, Surf. Sci., 65, 419
(1977).122)A. Nakahara, M. Nakamura, K. Sumitani, O. Sakata,
and N. Hoshi, Langmuir, 23, 10879 (2007).123)N. Hoshi, A. Nakahara, M. Nakamura, K. Sumitani,
and O. Sakata, Electrochim. Acta, 53, 6070 (2008).124)N. M. Markovic, B. N. Grugur, and P. N. Ross, J. Phys.
Chem., 101, 5405 (1997).125)N. M. Markovic and P. N. Ross, Surf. Sci. Rep., 45, 117
(2002).126)R. J. Nichols and A. Bewick, J. Electroanal. Chem., 243,
445 (1988).127)K. Kunimatsu, H. Uchida, M. Osawa, and M.
Watanabe, J. Electroanal. Chem., 587, 299 (2006).128)K. Kunimatsu, T. Senzaki, G. Samjeske, M. Tsushima,
and M. Osawa, Electrochim. Acta, 52, 5715 (2007).129)D. Strmcnik, D. Tripkovic, D. van der Vliet, V.
Stamenkovic, and N. M. Markovic , Electrochem.Commun., 10, 1602 (2008).
130)R. F. Mann, J. C. Amphlett, B. A. Peppley, and C. P.Thurgood, J. Power Sources, 163, 679 (2007).
131)N. Hoshi, M. Nakamura, Y. Asaumi, and K. Mikita, tobe submitted to Electrochem. Commun.
132)M. Otani, I. Hamada, O. Sugino, Y. Morikawa, Y.Okamoto, and T. Ikeshoji, J. Phys. Soc. Jpn., 77, 024872(2008).
133)N. M. Markovic, R. R. Az ic , B. D. Cahan, and E.Yeager, J. Electroanal. Chem., 377, 249 (1994).
134)N. M. Markovic, H. A. Gasteiger, and P. N. Ross, J.Phys. Chem., 99, 3411 (1995).
135)N. M. Markovic , H. Gasteiger, and P. N. Ross, J.Electrochem. Soc., 144, 1591 (1997).
136)B. N. Grgur, N. M. Markovic, and P. N. Ross, Can. J.Chem., 75, 1465 (1997).
137)F. El Kadiri, R. Faure, and R. Durand, J. Electroanal.Chem., 301, 177 (1991).
138)H. Kita, H.-W. Lei, and Y. Gao, J. Electroanal. Chem.,379, 407 (1994).
139)M. D. Macia, J. M. Campina, E. Herrero, and J. M.Feliu, J. Electroanal. Chem., 564, 141 (2004).
140)N. Hoshi, A. Sakurada, S. Nakamura, S. Teruya, O.Koga, and Y. Hori, J. Phys. Chem. B, 106, 1985 (2002).
141)P. W. Faguy, N. M. Markovic, R. R Azic, C. A. Fierro,and E. Yeager, J. Electroanal. Chem., 289, 245 (1990).
142)R. J. Nichols, Adsorption of Molecules at Metal Electrodes,(Eds. J. L. Lipkowski, and P. N. Ross, Jr.), VCH, NewYork, Chap. 7 (1991).
143)Y. Sawatari, J. Inukai, and M. Ito, J. Electron Spectrosc.,64/65, 515 (1993).
144)F. C. Nart, T. Iwasita, and M. Weber, Electrochim.Acta, 39, 961 (1994).
145)S. Thomas, Y.-E. Sung, H. S. Kim, and A. Wieckowski,J. Phys. Chem., 100, 11726 (1996).
146)P. W. Faguy, N. S. Marinkovic , and R. R. Az ic ,Langmuir, 12, 243 (1996).
147)P. W. Faguy, N. S. Marinkovic, and R. R. Az ic, J.Electroanal. Chem., 407, 209 (1996).
148)F. C. Nart, T. Iwasita, and M. Weber, Electrochim.Acta, 39, 2093 (1994).
149)T. Iwasita, F. C. Nart, A. Rodes, E. Pastor, and M.Weber, Electrochim. Acta, 40, 53 (1995).
150)M. D. Macia, J. M. Campina, E. Herrero, and J. M.Feliu, J. Electroanal. Chem., 564, 141 (2004).
151)A. Kuzume, E. Herrero, and J. M. Feliu, J. Electroanal.Chem., 599, 333 (2007).
152)N. Hoshi, M. Nakamura, S. Kondo, and N. Maki, to besubmitted to Electrochem. Commun.
153)F. Kitamura, M. Takeda, M. Takahashi, and M. Ito,Chem. Phys. Lett., 142, 318 (1987).
154)L.-W.-H. Leung, A. Wieckowski, and M. J. Weaver, J.Phys. Chem., 92, 6985 (1988).
155)N. Furuya, S. Motoo, and K. Kunimatsu, J. Electroanal.Chem., 239, 347 (1988).
156)F. Kitamura, M. Takahashi, and M. Ito, J. Phys. Chem.,92, 3320 (1988).
157)S. Watanabe, Y. Kinomoto, F. Kitamura, M. Takahashi,and M. Ito, J. Electron. Spectrsc. Rel. Phenom., 54/55,1205 (1990).
158)S.-C. Chung and M. J. Weaver, J. Phys. Chem., 94, 5095(1990).
159)S.-C. Chung and M. J. Weaver, Surf. Sci., 230, 222(1990).
160)I. Villegas and M. J. Weaver, J. Chem. Phys., 101, 1648(1994).
161)S. Watanabe, J. Inukai, and M. Ito, Surf. Sci., 293, 1(1993).
162)A. Rodes, R. Gómez, J. M. Feliu, and M. J. Weaver,Langmuir, 16, 811 (2000).
163)N. P. Lebedeva, A. Rodes, J. M. Feliu, M. T. M. Koper,and R. A. van Santen, J. Phys. Chem. B, 106, 12938(2002).
77,No. 1(2009) 19
164)N. Hoshi, M. Tanizaki, O. Koga, and Y. Hori, Chem.Phys. Lett., 336, 13 (2001).
165)C. S. Kim and C. Korzeniewski, Anal. Chem., 69, 2349(1997).
166)C. S. Kim, W. J. Tornquist, and C. Korzeniewski, J.Phys. Chem., 97, 6484 (1993).
167)C. S. Kim, C. Korzeniewski, and W. J. Tornquist, J.Chem. Phys., 100, 628 (1994).
168)K. Mikita, M. Nakamura, and N. Hoshi, Langmuir, 23,9092 (2007).
169)N. P. Lebedeva, M. T. M. Koper, E. Herrero, J. M.Feliu, and R. A. van Santen, J. Electroanal. Chem., 487,37 (2000).
170)N. Hoshi, Hyomen, 43, 8 (2005).171)S. Gilman, J. Phys. Chem., 68, 70 (1964).172)R. Parsons and T. van der Noot, J. Electroanal. Chem.,
257, 9 (1988).173)M. T. M. Koper, A. P. J. Jansen, R. A. van Santen, J. J.
Lukkien, and P. A. J. Hilbers, J. Chem. Phys., 109, 6051(1998).
174)T. Biegler, Aus. J. Chem., 26, 2571 (1973).175)E. Hererro, K. Franaszuczuk, and A. Wieckowski, J.
Phys. Chem., 98, 5074 (1994).176)H. Shiroishi, Y. Ayato, K. Kunimatsu, and T. Okada, J.
Electroanal. Chem., 581, 132 (2005).177)K. Kunimatsu, T. Sato, H. Uchida, and M. Watanabe,
Langmuir, 24, 3590 (2008).178)K. Yoshioka, F. Kitamura, M. Takeda, M. Takahashi,
and M. Ito, Surf. Sci., 227, 90 (1990).179)S. Zou, R. Gómez, and M. J. Weaver, J. Electroanal.
Chem., 474, 155 (1999).180)S. Zou, R. Gómez, and M. J. Weaver, Langmuir, 15,
2931 (1999).181)S. Zou, R. Gómez, and M. J. Weaver, Surf. Sci., 399, 270
(1998).182)N. Hoshi, O. Koga, Y. Hori, and T. Ogawa, J.
Electroanal. Chem., 587, 79 (2006).183)T. H. M. Housmans and M. T. M. Koper, J. Electroanal.
Chem., 575, 39 (2005).184)T. H. M. Housmans, and M. T. M. Koper, Electrochem.
Commun., 7, 581 (2005).185)B. Beden, A. Bewick, and C. Lamy, J. Electroanal.
Chem., 148, 147 (1983).186)K. Kunimatsu, J. Electroanal. Chem., 213, 149 (1986).187)S. G. Sun and J. Clavilier, J. Electroanal. Chem., 240, 147
(1988).188)A. Miki, S. Ye, and M. Osawa, Chem. Commun., 2002,
1500.189)G. Samjeské , A. Miki, S. Ye, A. Yamakata, Y.
Mukouyama, H. Okamoto, and M. Osawa, J. Phys.Chem. B, 109, 23509 (2005).
190)G. Samjeské, A. Miki, S. Ye, and M. Osawa, J. Phys.Chem. B, 110, 16559 (2006).
191)R. R. Adz ic, A. V. Tripkovic, and W. E. O’Grady,Nature, 296, 137 (1982).
192)S. Motoo and N. Furuya, J. Electroanal. Chem., 184, 303(1985).
193)S. G. Sun and J. Clavilier, J. Electroanal. Chem., 199, 471(1986).
194)C. Lamy and J. M. Légar, J. Chim. Phys., 88, 1649(1991).
195)S. G. Sun, Y. Lin, N. H. Li, and J. Q. Mu, J. Electroanal.Chem., 370, 273 (1994).
196)K. Nishimura, K. Kunimatsu, K. Machida, and M.Enyo, J. Electroanal. Chem., 260, 181 (1989).
197)S. Pronkin, M. Hara, and T. Wandlowski, Russian J.Electrochem., 42, 1177 (2006).
198)H. Miyake, T. Okada, G. Samjeské, and M. Osawa,Phys. Chem. Chem. Phys., 10, 3662 (2008).
199)M. Baldauf and D, M. Kolb, J. Phys. Chem., 100, 11375(1996).
200)N. Hoshi, K. Kida, M. Nakamura, M. Nakada, and K.Osada, J. Phys. Chem. B, 110, 12480 (2006).
201)N. Hoshi, M. Kuroda, O. Koga, and Y. Hori, J. Phys.Chem. B, 106, 9107 (2002).
202)N. Hoshi, M. Kuroda, T. Ogawa, O. Koga, and Y. Hori,Langmuir, 20, 5066 (2004).
203)N. Hoshi, M. Nakamura, and K. Kida, Electrochem.Commun., 9, 279 (2007).
204)Y. X. Chen, A. Miki, S. Ye, and M. Osawa, J. Am.Chem. Soc., 125, 3680 (2003).
205)M. Nakamura, K. Shibutani, and N. Hoshi,ChemPhysChem., 8, 1846 (2007).
206)J. Clavilier, C. Lamy, and J. M. Leger, J. Electroanal.Chem., 125, 249 (1982).
207)E. Herrero, K. Franaszczuk, and A. Wieckowski, J.Phys. Chem., 98, 5074 (1994).
208)C. Lamy and J. M. Legar, J. Electroanal. Chem., 135,321 (1982).
209)A. V. Tripkovic, K. Dj. Popovic, J. D. Momcilovic, andD. M. Drazic, J. Electroanal. Chem., 418, 9 (1996).
210)S. G. Sun and J. Clavilier, J. Electroanal. Chem., 236, 95(1987).
211)T. H. M. Housmans and M. T. M. Koper, J. Phys.Chem., 107, 8557 (2003).
212)I. T. Bae, X. Xing, C. C. Liu, and E. Yeager, J.Electroanal. Chem., 284, 335 (1990).
213)I. T. Bae, E. Yeager, X. Xing, and C. C. Liu, J.Electroanal. Chem., 309, 131 (1991).
214)B. Beden, F. Largeaud K. B. Kokoh, and C. Lamy,Electrochim. Acta, 41, 701 (1996).
215)K. Dj. Popovic, N. M. Markovic, A. V. Tripkovic, andR. R Azic, J. Electroanal. Chem., 295, 79 (1990).
216)K. Dj. Popovic, N. M. Markovic, A. V. Tripkovic, andR. R Azic, J. Electroanal. Chem., 313, 181 (1990).
217)M. J. Llorca, J. M. Feliu, A. Aldaz, J. Clavilier and A.Rodes, J. Electroanal. Chem., 316, 175 (1991).
218)A. Ahmadi, G. Attard, J. M. Feliu, and A. Rodes,Langmuir, 15, 2420 (1999).
219)G. A. Attard, A. Ahmadi, J. M. Feliu, A. Rodes, E.Herrero, S. Blais, and G. Jerkiewicz, J. Phys. Chem. B,103, 1381(1999).
220)G. A. Attard, J. Phys. Chem. B, 105, 3158 (2001).221)G. A. Attard, C. Harris, E. Herrero, and J. M. Feliu,
Faraday Discuss., 121, 253 (2002).222)O. A. Hazzazi1, G. A. Attard, and P. B. Wells, J. Mol.
Cat. A, 216, 247 (2004).223)T. S. Ahmadi, Z. L. Wang, T. C. Green, A. Henglein,
and M. A. El-Sayed, Science, 272, 1924, (1996).224)T. Teranishi, R. Kurita, and M. Miyake, J. Inorg.
Organometallic Polymers, 10, 145 (2000).225)M. Yamada, S. Kon, and M. Miyake, Chem. Lett., 34,
1050 (2005).226)N. Tian, Z. Y. Zou, S. G. Sun, Y. Ding, and Z. L. Wan,
Science, 316, 732 (2007).227)M. Inaba, M Ando, A. Hatanaka, A. Nomoto, K.
20 Electrochemistry
Matsuzawa, A. Tasaka, T. Kinumoto, Y. Iriyama, andZ. Ogumi, Electrochim. Acta, 52, 1632 (2006).
228)J. Solla-Gullon, P. Rodriguez, E. Herrero, A. Aldaz, andJ. M. Feliu, Phys. Chem. Chem. Phys., 10, 1359 (2008).
229)M. Labayen, C. Ramirez, W. Schattke, and O. M.Magnussen, Nature Mater., 2, 783 (2003).
230)M. A. van Hove, R. J. Koestmer, P. C. Stair, J. P.Biberian, L. L. Kesmodel, I. Bartos, and G. A. Somorjai,Surf. Sci., 103, 189 (1981).
231)J. Clavilier, A. Rodes, K. El. Achi, and M. A.Zamakhchari, J. Chim. Phys., 88, 1291 (1991).
232)K. Sashikata, T. Sugata, M. Sugimasa, and K. Itaya,Langmuir, 14, 2896 (1998).
233)M. Wakisaka, M. Sugimasa, J. Inukai, and K. Itaya, J.Electrochem. Soc., 150, E81 (2003).
234)O. M. Magnussen, L. Zitzler, B. Gleich, M. R. Vogt, andR. J. Behm, Electrochim. Acta, 46, 3725 (2001).
235)O. M. Magnussen, W. Polewska, L. Zitzler, and R. J.Behm, Faraday Discuss., 121, 43 (2002).
236)S. Strbac, C. M. Johnston, G. Q. Lu, A. Crown, and A.Wieckowski, Surf. Sci. 573, 80 (2004).
237)S. Strbac, C. M. Johnston, and A. Wieckowski, RussianJ. Electrochem., 42, 1244 (2006).
238)C. Jung, B. Ku, J. Kim, and C. K. Rhee, Chem.Commun., 2006, 2191.
239)A. Miki, S. Ye, T. Senzaki, and M. Osawa, J.Electroanal. Chem., 563, 23 (2004).
240)M. Osawa, Diffraction and Spectroscopic Methods inElectrochemistry (Advances in Electrochemical Scienceand Engineering, Vol. 9) (Eds. R. C. Alkire, D. M. Kolb,J. Lipkowski, and P. H. Ross), Wiley-VCH, Weinhiem,Chap 8 (2006).
241)G. Samjeské and M. Osawa, Angew. Chem. Int. Ed., 44,5694 (2005).
242)G. Samjeské, A. Miki, and M. Osawa, J. Phys. Chem. C,111, 15074 (2007).
243)M. Osawa, K. Yoshii, K. Ataka, and T. Yotsuyanagi,Langmuir, 10, 640 (1994).
244)H. Noda, K. Ataka, L.-J. Wan, and M. Osawa, Surf. Sci.,427-428, 190 (1999).
245)A. Rodes, J. M. Orts, J. M. Rerez, J. M. Feliu, and A.Aldaz, Electrochem. Commun., 5, 56 (2003).
246)H. Noda, L.-J. Wan, and M. Osawa, Phys. Chem. Chem.Phys., 3, 3336 (2001).
247)J. F. Smalley, C. V. Krishnan, M. Goldman, S. W.Feldberg, and I. Ruzic, J. Electroanal. Chem., 248, 255(1988).
248)J. F. Smalley, H. O. Finklea, C. E. D. Chidsey, M. R.Linford, S. E. Creager, J. P. Ferraris, K. Chalfant, T.Zawodzinsk, S. W. Feldberg, and M. D. Newton, J. Am.Chem. Soc., 125, 2004 (2003).
249)A. Yamakata, T. Uchida, J. Kubota, and M. Osawa, J.
Phys. Chem. B, 110, 6423 (2006).250)A. Yamakata and M. Osawa, Electrochemistry, 76, 208
(2008) [in Japanese].251)T. A. Germer, J. C. Stephenson, E. J. Heilweil, and R.
R. Cavanagh, J. Chem. Phys., 98, 9986 (1993).252)E. Schweizer, B. N. J. Persson, M. Tushaus, D. Hoge,
and A. M. Bradshaw, Surf. Sci., 213, 49 (1989).253)K. Kunimatsu, W. G. Golden, H. Seki, and M. R.
Philpott, Langmuir, 1, 245 (1985).254)H. Noguchi, T. Okada, and K. Uosaki, J. Phys. Chem. B,
110, 15055 (2006).255)Y. R. Shen, The Principles of Nonlinear Optics, John
Wiley & Sons, Inc., New York, (1984).256)J. Holman, P. B. Davies, T. Nishida, S. Ye, and D. J.
Neivandt, J. Phys. Chem. B, 109, 18723 (2005).257)T. Nishida, M. Johnson, J. Holman, M. Osawa, P. B.
Davies, and S. Ye, Phys. Rev. Lett., 96, 77402 (2006).258)A. Wada, K. Domen, and C. Hirose, Bunkou Kenkyuu,
47, 190 (1999) [in Japanese].259)S. Ye and M. Osawa, Hyomenkagaku, 24, 740 (2003) [in
Japanese].260)S. Ye, Bunseki, 500 (2006) [in Japanese].261)S. Ye, Bunseki, 632 (2006) [in Japanese].262)Q. Du, E. Freysz and Y. R. Shen, Science, 264, 826
(1994).263)Q. Du, E. Freysz, and Y. R. Shen, Phys. Rev. Lett., 72,
238 (1994).264)D. Eisenberg and W. Kauzmann, The Structure and
Properties of Water, Oxford University Press, London,(1969).
265)Faraday Discussion 141: Water-From InterFaces to theBulk, from p. 1-487 (2009).
266)A. Morita and J. T. Hynes, J. Phys. Chem. B, 106, 673(2002).
267)S. Ye, H. Noda, T. Nishida, S. Morita, and M. Osawa,Langmuir, 20, 357 (2004).
268)S. Ye, H. Noda, S. Morita, K. Uosaki, and M. Osawa,Langmuir, 19, 2238 (2003).
269)W. Zhou, S. Ye, M. Abe, T. Nishida, K. Uosaki, M.Osawa, and Y. Sasaki, Chem.-Eur. J., 11, 5040 (2005).
270)Z. Schultz, M. Biggin, J. White, and A. A. Gewirth,Anal. Chem., 76, 604 (2004).
271)S. Baldelli, N. Markovic, P. Ross, Y. R. Shen, and G.Somorjai, J. Phys. Chem. B, 103, 8920 (1999).
272)F. Dederichs, K. A. Friedrich, and W. Daum, J. Phys.Chem. B, 104, 6626 (2000).
273)G. Q. Lu, A. Lagutchev, D. D. Dlott, and A.Wieckowski, Surf. Sci., 585, 3 (2005).
274)K. A. Friedrich, W. Daum, F. Dederichs, and W.Akemann, Z. Phys. Chem., 217, 527 (2003).
275)H. Ohno and K. Fukumoto, Electrochemistry, 76, 16(2008).