recent downturn in emerging economies and macroeconomic
TRANSCRIPT

DESA Working Paper No. 137ST/ESA/2014/DWP/137
October 2014
Recent Downturn in Emerging Economies and Macroeconomic Implications for Sustainable Development: A case of India
D e p a r t m e n t o f E c o n o m i c & S o c i a l A f f a i r s
N R Bhanumurthy* Professor, National Institute of Public Finance and Policy, New Delhi, India
* An earlier version of the paper was presented at an Expert Group Meeting on “Macroeconomic Challenges to De-velopment Policies Post-2015: Lessons from Recent Country Experiences”, organised by UN-DESA, 5-6 December, 2013, New York. I would like to thank Diana Alarcon, Ingo Pitterle and other researchers at Development Policy and Analysis Division of UN-DESA for their comments. Thanks also to Ms Swayamsiddha Panda for her research assistance.
ABSTRACT
The paper discusses the progress of Indian economy and its policies since the broad-based structural reforms initiated in 1991 with a special focus on the recent downturn following the global financial crisis. The paper is structured into two parts: first part discusses the major economic and social achievements of India since 1991, it identi-fies the causes of the recent downturn, and the policy responses to revive the economy. In the second part, the paper outlines the major challenges India is facing and the policies and reforms that need to be implement to achieve sustainable development.
JEL Classification: E60, E65, F62, O53
Keywords: Economic reforms, Global Financial Crisis, Sustainable Development, Emerging Economies, India.
CONTENTS
I Introduction . . . . . . . . . . . . . . . . . . . . . . . . . . . . . . . . . . . . . . . . . . . . . . . . . . . . . . . . . . . . . . 1
2 Major economic and social achievements of India in the last two decades . . . . . . . . . . . . 1
Global financial crisis and Indian economy . . . . . . . . . . . . . . . . . . . . . . . . . . . . . . . . . . . . . . 4
Current economic situation . . . . . . . . . . . . . . . . . . . . . . . . . . . . . . . . . . . . . . . . . . . . . . . . . . 6
Why this deceleration in industrial growth? . . . . . . . . . . . . . . . . . . . . . . . . . . . . . . . . . . . . . 6
Services growth . . . . . . . . . . . . . . . . . . . . . . . . . . . . . . . . . . . . . . . . . . . . . . . . . . . . . . . . . . . 7
Inflation . . . . . . . . . . . . . . . . . . . . . . . . . . . . . . . . . . . . . . . . . . . . . . . . . . . . . . . . . . . . . . . . . . 7
Money and interest rates . . . . . . . . . . . . . . . . . . . . . . . . . . . . . . . . . . . . . . . . . . . . . . . . . . . . 9
Public finances . . . . . . . . . . . . . . . . . . . . . . . . . . . . . . . . . . . . . . . . . . . . . . . . . . . . . . . . . . . . 9
External conditions . . . . . . . . . . . . . . . . . . . . . . . . . . . . . . . . . . . . . . . . . . . . . . . . . . . . . . . . . 10
3 Major issues that could hinder the medium to long term growth in India . . . . . . . . . . . . . . 11
Financial access and financial inclusion . . . . . . . . . . . . . . . . . . . . . . . . . . . . . . . . . . . . . . . . . 12
Fiscal discipline and subsidy management . . . . . . . . . . . . . . . . . . . . . . . . . . . . . . . . . . . . . . 13
Efficiency of public expenditures and its management . . . . . . . . . . . . . . . . . . . . . . . . . . . . 14
Risks from external sector . . . . . . . . . . . . . . . . . . . . . . . . . . . . . . . . . . . . . . . . . . . . . . . . . . . 16
Growth and inclusion . . . . . . . . . . . . . . . . . . . . . . . . . . . . . . . . . . . . . . . . . . . . . . . . . . . . . . . 16
Growth and sustainable development . . . . . . . . . . . . . . . . . . . . . . . . . . . . . . . . . . . . . . . . . . 17
4 Conclusion . . . . . . . . . . . . . . . . . . . . . . . . . . . . . . . . . . . . . . . . . . . . . . . . . . . . . . . . . . . . . . . 18
Notes . . . . . . . . . . . . . . . . . . . . . . . . . . . . . . . . . . . . . . . . . . . . . . . . . . . . . . . . . . . . . . . . . . . 20
References . . . . . . . . . . . . . . . . . . . . . . . . . . . . . . . . . . . . . . . . . . . . . . . . . . . . . . . . . . . . . . . 22
UN/DESA Working Papers are preliminary documents circulated in a limited number of copies and posted on the DESA website at http://www.un.org/en/development/desa/papers/ to stimulate discussion and critical comment. The views and opinions expressed herein are those of the author and do not necessarily reflect those of the United Nations Secretariat. The designations and terminology employed may not conform to United Nations practice and do not imply the expression of any opinion whatsoever on the part of the Organization.
Typesetter: Nancy Settecasi
UNITED NATIONS
Department of Economic and Social Affairs
UN Secretariat, 405 East 42nd Street
New York, N .Y . 10017, USA
e-mail: undesa@un .org
http://www .un .org/en/development/desa/papers/

1 IntroductionThe global financial crisis of 2008 has questioned the existing macroeconomic frameworks and the way global macro economy works. The crisis has brought down the growth rates of countries, with some de-veloped countries entering into recession. It has in-creased volatility and led to return of protectionist policies even among the major highly globalized economies. At the same time, the response to miti-gate the adverse impact of the crisis was also huge and almost all of the countries adapted a set of macro-economic policies that stimulate aggregate demand, following the standard Keynesian framework. The developed countries implemented and coordinated a stimulus packages of unprecedented value–nearly 1.7 per cent of World GDP–and the Group of 20 (G-20), which India is a member of, was formed.
Following the stimulus packages, sharp recovery was expected and there were discussions on the shape of the recovery path. Indeed, the fiscal stimulus packag-es not only contained the slowdown but also helped in modest recovery in most of the G-20 countries–especially the emerging countries such as China and India1. However, the extent and the timing of the recovery among the countries varied because the speed and extent of transmission mechanism of policy initiatives were different with some nations recovering faster while others taking longer time to move away from the recession. This has resulted in tensions among the G-20 countries as they work through the process of arriving at a coordinated exit from stimulus policies. The recovery process is bereft of the coordination that this group displayed during the onset of crisis (see Akyuz, 2013 and G-20 To-ronto Communique). Further, the spillover effects of developed nations’ exit policies on emerging markets, such as India, were severe and have created imbalanc-es on the external accounts2. For instance, in the case of India, the exchange rate has depreciated sharply by 25 per cent while the current account deficit (CAD) has hit 6 per cent in one quarter of 2013.
With this background, an attempt has been made here to understand the impact of the crisis, and the
policies that are needed to achieve the longer term goal of sustainable development in India. The paper is divided in two parts. In the first part it discusses, in brief, the major economic and social achieve-ments of India since the country’s major structural reforms in 1991, the major drivers of the most recent slowdown in the economy, and the macroeconomic policy responses the country adopted in order to contain the economic slowdown. In the second part, the paper discusses some of the major challenges India is facing in the path towards achieving sus-tainable development and the relevant policies and reforms that India needs to implement to achieve such development.
2 Major economic and social achievements of India in the last two decadesThe year 1991 is a turning point in India’s economic paradigm when country undertook a major policy shift through structural adjustment programs as well as stabilization program.3 These reforms were undertaken following the twin crisis that India faced both on fiscal as well as on external accounts. Fur-ther, as Tendulkar & Bhavani (2012) argue, certain domestic and international events forced India to undertake systemic reforms in 1991.4 Policy reforms were undertaken across the major sectors, namely fi-nancial, trade, industrial, etc, and which opened up the economy for foreign participation in the form of foreign capital and technology. While the stabiliza-tion policies have helped India overcome the short term crisis in the external account, the structural policies helped India improve the growth poten-tial and productivity. This is reflected in the GDP growth rates, which increased substantially since the middle of 1990s (see Table-1)5. Despite the in-stability in the political economy in the second half of 1990s, the reforms did continue. This led to the assumption that the economic reforms which started in 1991 are irreversible and will continue. The two decades since 1991 have witnessed historically high economic growth rates (with an average of over 7
2 DESA WORKING PAPER NO. 137
per cent until the onset of global crisis in 2008) and a structural shift upwards in all the macroeconom-ic indicators (especially in savings and investment rates). The last two decades also saw India emerge in the global scene through its acquisition of interna-tional companies.
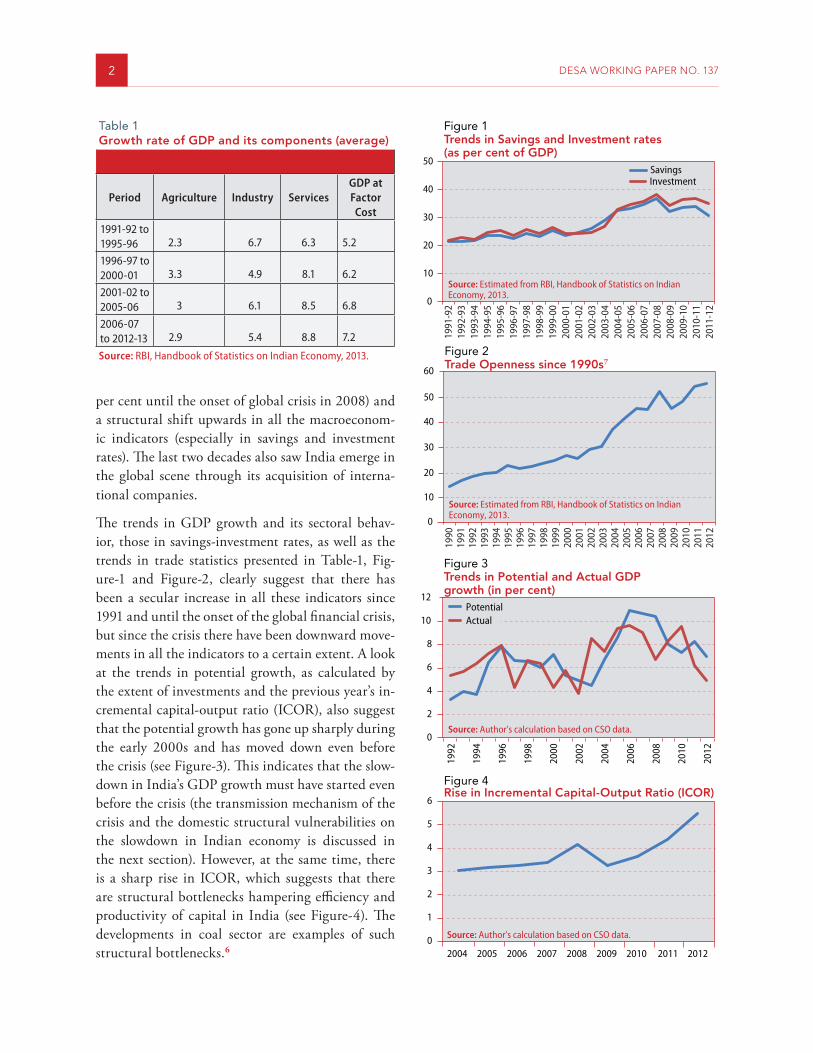
The trends in GDP growth and its sectoral behav-ior, those in savings-investment rates, as well as the trends in trade statistics presented in Table-1, Fig-ure-1 and Figure-2, clearly suggest that there has been a secular increase in all these indicators since 1991 and until the onset of the global financial crisis, but since the crisis there have been downward move-ments in all the indicators to a certain extent. A look at the trends in potential growth, as calculated by the extent of investments and the previous year’s in-cremental capital-output ratio (ICOR), also suggest that the potential growth has gone up sharply during the early 2000s and has moved down even before the crisis (see Figure-3). This indicates that the slow-down in India’s GDP growth must have started even before the crisis (the transmission mechanism of the crisis and the domestic structural vulnerabilities on the slowdown in Indian economy is discussed in the next section). However, at the same time, there is a sharp rise in ICOR, which suggests that there are structural bottlenecks hampering efficiency and productivity of capital in India (see Figure-4). The developments in coal sector are examples of such structural bottlenecks.6
Table 1Growth rate of GDP and its components (average)
Period Agriculture Industry ServicesGDP at Factor
Cost1991-92 to 1995-96 2.3 6.7 6.3 5.2
1996-97 to 2000-01 3.3 4.9 8.1 6.2
2001-02 to 2005-06 3 6.1 8.5 6.8
2006-07 to 2012-13 2.9 5.4 8.8 7.2
Source: RBI, Handbook of Statistics on Indian Economy, 2013.
Figure 1Trends in Savings and Investment rates (as per cent of GDP)
Source: Estimated from RBI, Handbook of Statistics on Indian Economy, 2013.
0
10
20
30
40
50SavingsInvestment
1991
-92
1992
-93
1993
-94
1994
-95
1995
-96
1996
-97
1997
-98
1998
-99
1999
-00
2000
-01
2001
-02
2002
-03
2003
-04
2004
-05
2005
-06
2006
-07
2007
-08
2008
-09
2009
-10
2010
-11
2011
-12
Figure 2Trade Openness since 1990s7
Source: Estimated from RBI, Handbook of Statistics on Indian Economy, 2013.
0
10
20
30
40
50
60
1990
1991
1992
1993
1994
1995
1996
1997
1998
1999
2000
2001
2002
2003
2004
2005
2006
2007
2008
2009
2010
2011
2012
Figure 3Trends in Potential and Actual GDP growth (in per cent)
Source: Author’s calculation based on CSO data.
Figure 4Rise in Incremental Capital-Output Ratio (ICOR)
Source: Author’s calculation based on CSO data.
0
2
4
6
8
10
12
1992
1994
1996
1998
2000
2002
2004
2006
2008
2010
2012
PotentialActual
0
1
2
3
4
5
6
2004 2005 2006 2007 2008 2009 2010 2011 2012

RECENT DOWNTURN IN EMERGING ECONOMIES AND MACROECONOMIC IMPLICATIONS FOR SUSTAINABLE DEVELOPMENT: A CASE OF INDIA 3
Other than the higher growth and the improvements in major macroeconomic variables, two significant areas in which India has made major improvement are financial sector and fiscal reforms. As noted in Figure-5, which presents the trend in credit-GDP ratio, there is a clear upwards structural shift in this ratio since the beginning of the year 1999-2000, in-dicating that the financial sector reforms did help in its development.
On the fiscal policy side, the effort to bring down the fiscal deficits to 3 per cent of GDP with revenue deficit to zero, consistent with Medium Term Fis-cal Plan (MTFP) (both through increasing tax and non-tax (disinvestments) revenues as well as through reduction in government expenditures), was almost successful. On the revenue side, the introduction of Tax Information Network (TIN) increased the
revenue buoyancy and the disinvestment policy in-creased the overall revenue (elasticity with respect to non-agriculture GDP) buoyancy to over 1.5 percent until 2007-08. On the expenditure side, India was almost close to achieving revenue neutrality (reve-nue deficit to zero) by 2007-08. These factors have brought down the fiscal deficit from 8 per cent in 2003-04 to 4 per cent in 2007-08, which is a signif-icant achievement (see Figure-6). The positive out-come of this is felt in the savings rate, which touched over 36 per cent in 2007-08, largely due to positive public sector savings, and which, in turn, pushed the investment rate to historical high of over 38 per cent through crowding-in impact on the private invest-ments-both resulting in higher GDP growth until 2007-08. However, global crisis as well as the general elections in 2009 dented this trend and led to loose
Figure 5Trends in Credit-GDP ratio (in percentage)
0
10
20
30
40
50
60
1978
-79
1979
-80
1980
-81
1981
-82
1982
-83
1983
-84
1984
-85
1985
-86
1986
-87
1987
-88
1988
-89
1989
-90
1990
-91
1991
-92
1992
-93
1993
-94
1994
-95
1995
-96
1996
-97
1997
-98
1998
-99
1999
-00
2000
-01
2001
-02
2002
-03
2003
-04
2004
-05
2005
-06
2006
-07
2007
-08
2008
-09
2009
-10
2010
-11
2011
-12
2012
-13
Source: Reserve Bank of India.
Figure 6Fiscal Deficits and Private Capital Formation (as % of GDP)
Source: Estimated from RBI’s Database on Indian Economy.
0
5
10
15
20
25
30
35
1991
-92
1992
-93
1993
-94
1994
-95
1995
-96
1996
-97
1997
-98
1998
-99
1999
-00
2000
-01
2001
-02
2002
-03
2003
-04
2004
-05
2005
-06
2006
-07
2007
-08
2008
-09
2009
-10
2010
-11
2011
-12
Fiscal Deficit
Revenue DeficitCapital Expenditure
Private Capital Formation

4 DESA WORKING PAPER NO. 137
fiscal and monetary policies, which led to a sharp rise in fiscal deficits to near 10 per cent in 2009-10. This appears to have crowded-out private investments and resulted in decline in GDP growth8.
However, there are some areas that are neglected in the process of reforms, which could have resulted in divergences across the sectors and regions. Although 1991 reforms were termed as ‘systemic, continuing, and wide-ranging’9, they did not cover the agricul-tural sector, focusing more on the growth oriented policies in sectors such as manufacturing, services, external and financial. The Agriculture continued to host more than half of the labour force and lack of any reforms resulted in sharp reduction in the pro-ductivity in this sector. The other area that was ne-glected is the infrastructure (physical), which, even after two decades of reforms, faces large constraints. As this sector has strong forward linkages and can enhance aggregate demand, the delay in these in-vestments will only hamper the long term potential growth. Within infrastructure, energy (electricity) poses major constraints on growth and development (see endnote-4).
The 1991 reforms barely focused on the human development because their focus was on removing structural bottlenecks for growth. Also they were based on the assumption that only pro-market re-forms causing increase in GDP growth could auto-matically improve social development. This is despite India having nearly half of the population below the poverty line (see table-2) and with all the social in-dicators showing disappointing picture. After more
than a decade of reforms, India did achieve higher growth but such growth was termed by many as ‘job-less growth’ as the revival in growth did not coincide with revival in employment and there was only 8 per cent drop in poverty rate per cent(see table-2). This brought the issue of ‘growth with inclusion’ to the core of the public policy and led to large inclusive growth policies since 2004 (the 11th Plan (2007-2012) specifically discusses inclusive development). The result of such focused policy on social develop-ment can be seen in the poverty rate that declined by 15.3 per cent between 2004-05 and 2011-12. This reduction in poverty numbers is despite the global crisis and also despite the fall in GDP growth from 9.3 per cent in 2010-11 to 6.2 per cent in 2011-12. The inclusive development programs that have been undertaken in the past ten years in India include, Mahatma Gandhi National Rural Employment Guarantee Scheme (MGNREGS), Indira Awaas Yo-jana (IAY for rural housing), Pradhan Mantri Gram Sadak Yojana (PMGSY for rural road connectivity), Jawaharlal Nehru National Urban Renewal Mission (JNNURM for urban infrastructure), National Rural Health Mission (NRHM), National Rural Livelihood Mission (NRLM for rural poverty al-leviation), and National Social Assistance Program (NSAP for old age pension scheme). In addition to all these existing schemes, the Government has recently enacted National Food Security Act to pro-vide subsidised food to two-thirds of the population. In terms of unemployment, the decline in demand for MGNREGS jobs could suggest a significant re-duction in unemployment rates atleast in rural areas.
a. Global financial crisis and Indian economy
The developments in the global financial markets since 2008 have indeed had a significant adverse impact on India’s economic performance. This was largely due to increasing integration of India’s manufacturing and service sectors with the inter-national economy since 1991 reforms. Hence, the global recession was a natural source of decline in the Indian economic growth because of the fall in export of goods and services, and the fall in foreign
Table 2 Official Poverty Ratio (per cent) as estimated by Tendulkar Poverty Line
Year Rural Urban Total
1993-94 50.1 31.8 45.3
2004-05 41.8 25.7 37.2
2011-12 25.7 13.7 21.9
Source: Press Note on Poverty Estimates, 2011-12, Planning Commission, 22nd July, 2013.

RECENT DOWNTURN IN EMERGING ECONOMIES AND MACROECONOMIC IMPLICATIONS FOR SUSTAINABLE DEVELOPMENT: A CASE OF INDIA 5
capital inflows. However, the slowdown in India’s growth must have started much before the collapse of Lehman Brothers’ in September 2008 (see Bha-numurthy & Kumawat, 2009). This slowdown was attributed to the presence of sharp cyclical behaviour in India’s growth movement due to productivity and capacity constraints, particularly in the industrial growth (this view was later supported by Rakshit, 2009 and by Mukherjee, 2009). Another source of deceleration in the GDP growth cycle is the deceler-ation of exports growth cycle, which moved down to single digit (of 5.3 per cent) in 2008-09 after regis-tering above 15 per cent annual average growth since 2002-03 (see Figure-7).
Similar to developed economies, many measures have been taken domestically, through both fiscal and monetary measures, to stimulate the economy. Three fiscal stimulus packages have been introduced in addition to the large fiscal expansionary meas-ures that were taken in the 2008-09 Union Budget (termed as Pre-Election Budget) such as farm loan waivers, Sixth Pay Commission award and other measures10. On the monetary policy side, domestic policy interest rates were brought down sharply to ease the credit and liquidity tightness.
Here it is necessary to understand the transmission mechanism of global financial crisis on Indian econ-omy11. Specifically, presence of growth cycles in the Indian economy; the impact of global commodity price shocks; how much growth drop could be at-tributed to global financial crisis; and the impact of
fiscal12 and monetary13 stimulus measures. Bhanu-murthy & Kumawat (2009) show that both global commodity price shocks and global financial crisis together has led to a percentage point reduction in the GDP growth in 2008-09 while the policy stimulus measures have helped revive the growth by about half a percentage in the same year. However, the decline in growth due to domestic cyclical factor is higher than the combined impact of commodity price shocks and global financial crisis.
But the impact of policy stimulus measures was higher in 2009-10 and 2010-11 as it led to the recov-ery in GDP growth to 8.6 per cent and 9.3 per cent, respectively, by enhancing effective demand. How-ever, as some of the fiscal measures that are taken in Union Budget 2008-09 and in the post-September 2008 stimulus packages are irreversible in nature, sustained high fiscal deficits have imposed strains on overall macroeconomic stability.
There are other effects of crisis other than adverse growth effects, which is more serious for the eco-nomic development. It is the impact of the crisis on employment and poverty. It is well-known that, in India, in the recent period, the fall in poverty head-count is sharper compared to the pre-1991 period. This is largely due to the sharp upward shift in the overall growth process in the reform period, which has shifted from an average growth of less than 4 per cent (popularly known as Hindu rate of growth) to 5-6 per cent growth in the reform period. Further, in the five year period before the crisis, the average
Figure 7Cycles in Export Growth
Source: Author’s calculation.
0
5
10
15
20
25
30
35
40
1990
1991
1992
1993
1994
1995
1996
1997
1998
1999
2000
2001
2002
2003
2004
2005
2006
2007
2008
2009
2010
2011
2012
Export GrowthCycle

6 DESA WORKING PAPER NO. 137
growth has gone above 8 per cent. Yet, there are ar-guments that this growth was not pro-poor and it has resulted in increasing inequality and, hence, drop in poverty headcount is not as much as it intended to be. Although this is a valid argument, but in the ab-sence of high growth, India could have fared worse than it had performed right now in both economic and social indicator. As discussed earlier, following the high growth in the pre-crisis period, India could introduce many inclusive development programs, which acted as automatic stabilizers when the cri-sis actually hit the economy. Continuation of such development programs will help in ensuring rapid reduction in poverty in India in the near future. In terms of employment, the recent growth process has been criticized for ‘informalising’ the labour market and the segment of the labour force with very less social security coverage got badly affected due to the crisis (SEWA survey, 2009).
b. Current economic situationAt present, the Indian economy faces downside risks in most of the macroeconomic variables. These risks appear to have been contributed by domestic factors and equally by the international trends. Starting with stubborn high inflationary situation, high and unsustainable twin deficits (current account deficit to over 6 per cent in the first quarter of 2013-14 and fiscal deficit over 5.5 per cent in 2012-13), not so robust recovery in the United States and the Euro zone area, increasing banking sector risk in terms of non-performing assets (NPAs), not so conducive atmosphere for disinvestment process14, and the governance issues, the business confidence on India appears to be quite low. This is more so when the economy has registered below 5 per cent growth for last two consecutive years.
Growth slowdown is also broad-based with the deceleration happening across the sub-sectors. The sharper deceleration is witnessed in industrial sector followed by service sector. Within the industrial sec-tor many sub-sectors show negative growth. Mining sector, which has a strong forward linkage with the core sector growth15, continues to show negative
growth since 2011-12 (see table-3). Sharp decelera-tion is also visible in sub-sectors such as construction and manufacturing.
c. Why this deceleration in industrial growth?
As we note in table-3, the industrial growth deceler-ation is broad-based as all the major sub-sectors have shown some decline with sharp deceleration in min-ing sector as well as in capital goods growth. This deceleration is larger even compared to the Crisis period of 2008-09. What caused such low growth in Industry in the recent period?
The deceleration in industrial growth could be due to deceleration in export demand (following slowdown in the advanced countries growth since 2008-09) and also due to some domestic structural policy issues that holding the private investments. While the recovery in advanced economies is not robust, the domestic policies continue to be hostile for private investments. In addition to this, the tight monetary policy adopted by the Central Bank to contain inflationary expectations seems to delay the recovery. There are other ambiguous domestic struc-tural issues related to land, environmental, labour, infrastructure, and tax policies that are delaying the recovery. However, recent recovery in the export demand and certain institutional initiatives such
Table 3Growth in Components of Industrial Production (Per cent)
YearMining &
Quarrying Manufacturing Electricity General2005-06 2.3 10.3 5.2 8.6
2006-07 5.2 15 7.2 12.9
2007-08 4.6 18.4 6.4 15.6
2008-09 2.6 2.5 2.8 2.5
2009-10 7.9 4.9 6.1 5.3
2010-11 5.2 8.9 5.5 8.2
2011-12 -1.9 3 8.2 2.9
2012-13 -2.3 1.3 4 1.1
Source: Central Statistical Office.

RECENT DOWNTURN IN EMERGING ECONOMIES AND MACROECONOMIC IMPLICATIONS FOR SUSTAINABLE DEVELOPMENT: A CASE OF INDIA 7
as Cabinet Committee on Investments (CCI) and Project Management System that resulted in clear-ance of various long pending projects should help in industrial recovery.
d. Services GrowthWith a contribution of 67 per cent to overall GDP, services constitute the largest sector of the economy. Further, this is the sector which has registered a consistently high growth for a long period of time. Even during the global crisis period, the sector had registered a growth of 9.4 per cent. However, since 2010-11 the growth in this sector has also shown some deceleration.
A look at the sub-sectors (Table-4) shows that while financial services group (including insurance, real estate and business services) continue to register ro-bust growth, growth has declined in both construc-tion and community services. While construction growth coincides with the interest rate movements, the deceleration in community services largely coin-cides with the fiscal policy. As the external demand conditions and exchange rate are among the main determinants of service sector growth, any recovery in the global growth could result in the recovery of the sector. Recent performance by the Information
Technology Enabled Services (ITES) sector indi-cates that there could be strong growth in the sector, which could help in the recovery of the overall econ-omy in the coming quarters.
The determinants of services sector growth include global growth, tourist arrivals, export & import cargo at ports, passengers at airports, domestic non-service sector growth, and the extent of mer-chandise exports, among others. Out of these, some show positive trends such as the indicators in tourist arrivals, which have increased due to exchange rate depreciation, and passengers at airports, which ap-pear to have boosted services sector demand. Cargo and global growth, however, do not share similar optimism on services demand.
e. Inflation Similar to many emerging market economies, India has been struggling with inflation , which is higher than the accepted level of 4.5 per cent in terms of WPI, while it continues to be close to 10.0 per cent in the case of CPI inflation (see Figure-8). After al-most a continuous decline for more than a year, the headline inflation started rising since middle of 2013. This trend is now reflected in the CPI (retail market) prices and consequently the CPI-based inflation has
Table 4Growth Rates in the Services Sector
Year Services Construction
Trade, Hotel, Transport and
Communications
Finance, Insurance, Real Estate &
Business Services Community, Social & Personal Services
2004-05 9.1 16.3 9.7 8.7 4.9
2005-06 11.2 12.8 12.1 12.6 7.1
2006-07 10.1 10.3 11.6 13.9 2.8
2007-08 10.3 10.8 10.9 11.9 6.9
2008-09 9.4 5.3 7.5 12 12.5
2009-10 10 6.7 10.4 9.7 11.7
2010-11 9.8 10.2 12.3 10.1 4.3
2011-12 7.9 5.6 7 11.7 6
2012-13 (R) 6.8 1.1 5.1 10.9 5.3
2013-14 (A) 6.9 1.7 3.5 11.2 7.4
Source: Reserve Bank of India.
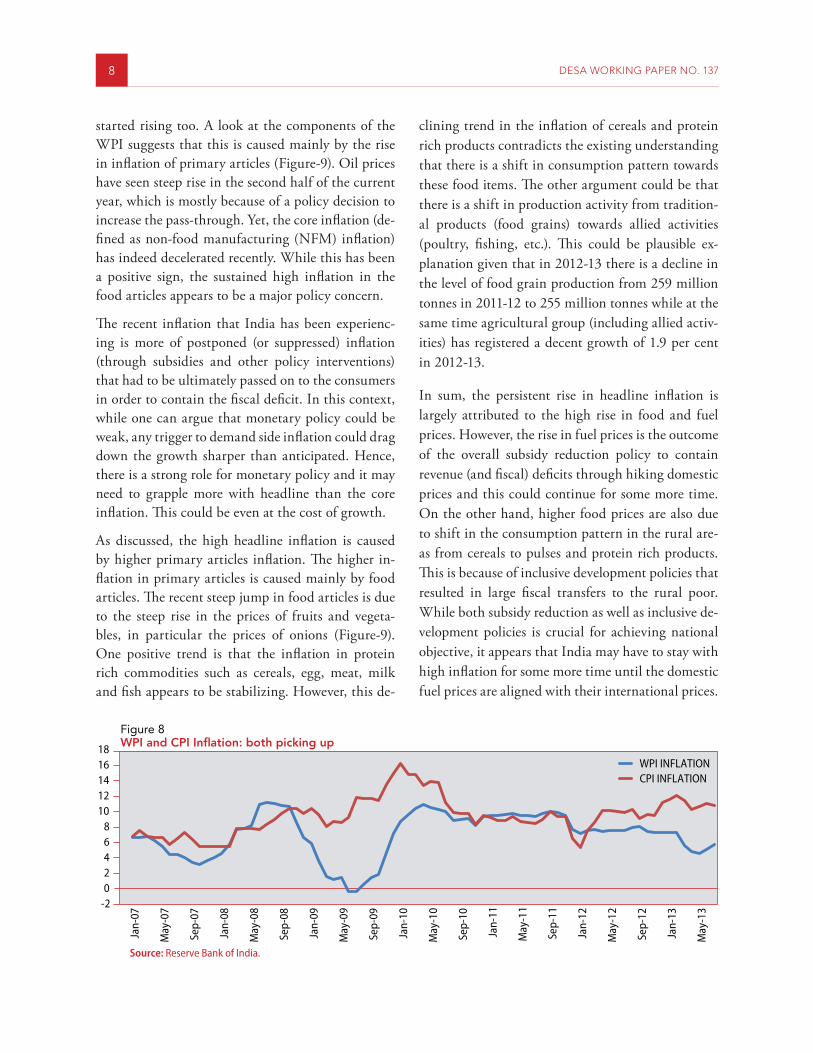
8 DESA WORKING PAPER NO. 137
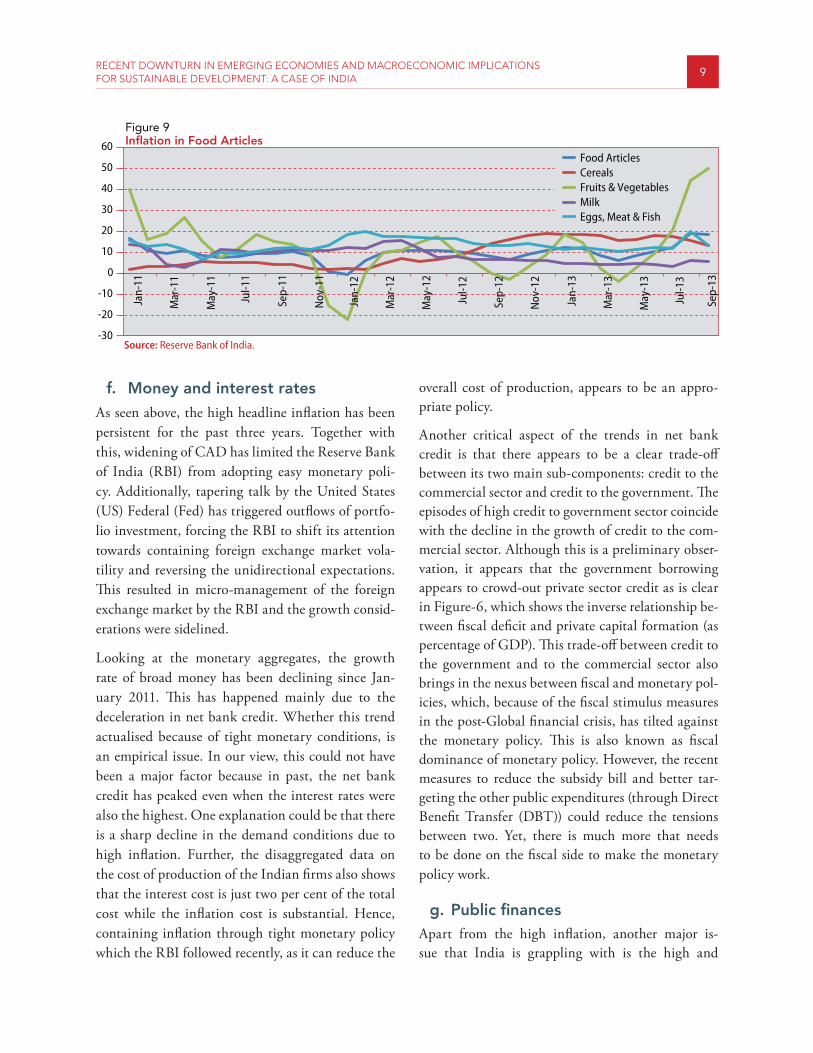
started rising too. A look at the components of the WPI suggests that this is caused mainly by the rise in inflation of primary articles (Figure-9). Oil prices have seen steep rise in the second half of the current year, which is mostly because of a policy decision to increase the pass-through. Yet, the core inflation (de-fined as non-food manufacturing (NFM) inflation) has indeed decelerated recently. While this has been a positive sign, the sustained high inflation in the food articles appears to be a major policy concern.
The recent inflation that India has been experienc-ing is more of postponed (or suppressed) inflation (through subsidies and other policy interventions) that had to be ultimately passed on to the consumers in order to contain the fiscal deficit. In this context, while one can argue that monetary policy could be weak, any trigger to demand side inflation could drag down the growth sharper than anticipated. Hence, there is a strong role for monetary policy and it may need to grapple more with headline than the core inflation. This could be even at the cost of growth.
As discussed, the high headline inflation is caused by higher primary articles inflation. The higher in-flation in primary articles is caused mainly by food articles. The recent steep jump in food articles is due to the steep rise in the prices of fruits and vegeta-bles, in particular the prices of onions (Figure-9). One positive trend is that the inflation in protein rich commodities such as cereals, egg, meat, milk and fish appears to be stabilizing. However, this de-
clining trend in the inflation of cereals and protein rich products contradicts the existing understanding that there is a shift in consumption pattern towards these food items. The other argument could be that there is a shift in production activity from tradition-al products (food grains) towards allied activities (poultry, fishing, etc.). This could be plausible ex-planation given that in 2012-13 there is a decline in the level of food grain production from 259 million tonnes in 2011-12 to 255 million tonnes while at the same time agricultural group (including allied activ-ities) has registered a decent growth of 1.9 per cent in 2012-13.
In sum, the persistent rise in headline inflation is largely attributed to the high rise in food and fuel prices. However, the rise in fuel prices is the outcome of the overall subsidy reduction policy to contain revenue (and fiscal) deficits through hiking domestic prices and this could continue for some more time. On the other hand, higher food prices are also due to shift in the consumption pattern in the rural are-as from cereals to pulses and protein rich products. This is because of inclusive development policies that resulted in large fiscal transfers to the rural poor. While both subsidy reduction as well as inclusive de-velopment policies is crucial for achieving national objective, it appears that India may have to stay with high inflation for some more time until the domestic fuel prices are aligned with their international prices.
Figure 8WPI and CPI Inflation: both picking up
Source: Reserve Bank of India.
-202468
1012141618
Jan-
07
May
-07
Sep-
07
Jan-
08
May
-08
Sep-
08
Jan-
09
May
-09
Sep-
09
Jan-
10
May
-10
Sep-
10
Jan-
11
May
-11
Sep-
11
Jan-
12
May
-12
Sep-
12
Jan-
13
May
-13
WPI INFLATIONCPI INFLATION
RECENT DOWNTURN IN EMERGING ECONOMIES AND MACROECONOMIC IMPLICATIONS FOR SUSTAINABLE DEVELOPMENT: A CASE OF INDIA 9
f. Money and interest ratesAs seen above, the high headline inflation has been persistent for the past three years. Together with this, widening of CAD has limited the Reserve Bank of India (RBI) from adopting easy monetary poli-cy. Additionally, tapering talk by the United States (US) Federal (Fed) has triggered outflows of portfo-lio investment, forcing the RBI to shift its attention towards containing foreign exchange market vola-tility and reversing the unidirectional expectations. This resulted in micro-management of the foreign exchange market by the RBI and the growth consid-erations were sidelined.
Looking at the monetary aggregates, the growth rate of broad money has been declining since Jan-uary 2011. This has happened mainly due to the deceleration in net bank credit. Whether this trend actualised because of tight monetary conditions, is an empirical issue. In our view, this could not have been a major factor because in past, the net bank credit has peaked even when the interest rates were also the highest. One explanation could be that there is a sharp decline in the demand conditions due to high inflation. Further, the disaggregated data on the cost of production of the Indian firms also shows that the interest cost is just two per cent of the total cost while the inflation cost is substantial. Hence, containing inflation through tight monetary policy which the RBI followed recently, as it can reduce the
overall cost of production, appears to be an appro-priate policy.
Another critical aspect of the trends in net bank credit is that there appears to be a clear trade-off between its two main sub-components: credit to the commercial sector and credit to the government. The episodes of high credit to government sector coincide with the decline in the growth of credit to the com-mercial sector. Although this is a preliminary obser-vation, it appears that the government borrowing appears to crowd-out private sector credit as is clear in Figure-6, which shows the inverse relationship be-tween fiscal deficit and private capital formation (as percentage of GDP). This trade-off between credit to the government and to the commercial sector also brings in the nexus between fiscal and monetary pol-icies, which, because of the fiscal stimulus measures in the post-Global financial crisis, has tilted against the monetary policy. This is also known as fiscal dominance of monetary policy. However, the recent measures to reduce the subsidy bill and better tar-geting the other public expenditures (through Direct Benefit Transfer (DBT)) could reduce the tensions between two. Yet, there is much more that needs to be done on the fiscal side to make the monetary policy work.
g. Public financesApart from the high inflation, another major is-sue that India is grappling with is the high and
Figure 9Inflation in Food Articles
Source: Reserve Bank of India.-30
-20
-10
0
10
20
30
40
50
60Ja
n-11
Mar
-11
May
-11
Jul-1
1
Sep-
11
Nov
-11
Jan-
12
Mar
-12
May
-12
Jul-1
2
Sep-
12
Nov
-12
Jan-
13
Mar
-13
May
-13
Jul-1
3
Sep-
13
Food ArticlesCerealsFruits & VegetablesMilkEggs, Meat & Fish

1 0 DESA WORKING PAPER NO. 137
unsustainable combined fiscal deficit (both in the Centre and the States). Since 2008-09, due to var-ious policy measures included in the pre-election Budget, and some fiscal stimulus measures, it ap-pears that there is a substantial rise in the structural part of the fiscal deficit as many of these measures, such as loan weaver scheme, were of ‘irreversible’ in nature. The combined fiscal deficit is still above 8 per cent (see Figure-6). The 13th Finance Commission did come out with the new fiscal consolidation road map consistent with the reasonably high economic growth. However, due to various constraints within and outside the Indian economy, the government could not stick to those targets.
In the recent period, there have been some efforts, such as the reduction of subsidy on the petroleum products and the fertlizers, which could help bring down the fiscal deficit. However, there are some concerns regarding achieving the revised target set by the Kelkar Committee (2012) of bringing down the fiscal deficit to 3.9 per cent by year 2014-1516. Even if the government, as promised to the credit rating agencies, succeeds in achieving this target, the concern is that it will be through reduction in capital expenditure rather than the revenue expend-iture. This could have much more adverse impact on growth because such adjustments can affect growth in the short term, through reduction in demand, as well as in the medium term, through crowding-out of private investments. This is because the revenue expenditure multiplier is much smaller compared to the capital expenditure multiplier (see Bose & Bhanumurthy, 2013). And with higher fiscal deficit, due to higher revenue expenditures, there would be upward pressure on interest rates, thus, discourag-ing private investments. In the Figure-6 the trends in private capital formation appears to be a mirror image of the trends in fiscal deficit. This is because of the fact that the rise in fiscal deficit is largely due to the rise in revenue deficit while, at the same time, there is a decline in the captial expenditure (as a proportion of GDP). Hence, in our view, any poli-cy that tries to reduce fiscal deficit should also keep the sub-target of reducing revenue deficit. In other
words, quality of expenditures is crucial in reviving the growth in the economy. Otherwise, it could raise issues such as debt sustainability, fiscal-monetary tensions, inflationary expectations, etc.
h. External ConditionsIn the absence of external demand (which is a crucial determinant), India’s exports (merchandise) growth continues to be subdued and has even registered a negative growth for the first quarter of 2013-14. However, there has been some recovery since sec-ond quarter of the current fiscal year and this can be attributed to two factors: surprise recovery in the European Union (EU) region and in Japan, and the sharp depreciation of Rupee to certain extent. Going forward, robust recovery in the long run seems to be difficult once both the US and the EU start unwind-ing the quantitative easing in 2014.
The more worrying trend for India’s recovery is the trend in imports rather than in the exports. At aggregate level, imports growth is, as in the case of exports, largely slowing down (for the period April-November 2013, the import growth is 5.4 per cent lower compared to same period in 2012). But the disaggregated data shows a disturbing trend. Over a period of time, the share of gold and oil im-ports in total imports have increased while the share of other (intermediate) goods imports has dropped from close to 70 per cent in 2001 to 55 per cent of total imports in 2012-13.
If one looks at the imported items as a share of total GDP, one may note a sharp rise in the crude oil and gold shares. Gold import share has risen from close to 1 per cent in 2001 to over 3 per cent by 2012, while crude oil imports have gone up quite sharply to 9 per cent. One silver lining in this trend is that higher crude oil imports is due to the establishment of internationally competitive oil refining industry in India, which led to a sharp rise in the processed oil exports−this consists of roughly 20 per cent of total crude oil imports.17 On the other hand, the decline in the share of intermediate goods imports reflects the stagnancy in the capacity building activities in

RECENT DOWNTURN IN EMERGING ECONOMIES AND MACROECONOMIC IMPLICATIONS FOR SUSTAINABLE DEVELOPMENT: A CASE OF INDIA 11
the industrial sector in India, which might have re-duced the potential output.
The divergent trends in exports and imports have re-sulted in widening of current account deficit to -4.8 per cent in 2012-13 and further to -6.3 per cent in the first quarter of 2013-14 (see Figure-10). While this is alarmingly higher than the sustainable level, this sharp rise in CAD was due to increase in the gold import demand not just for consumption but as a financial asset. This is also reflected in the National Accounts where the ‘valuables’ increased sharply by 93 per cent in first quarter compared to the same period in 2012-13, and is one of the major reasons for the sharp depreciation of rupee by almost 15 per cent in July-August 2013. The government has taken many measures, such as increasing the import duty on gold and also some measures by the RBI to reduce the speculation on gold. These measures ap-pear to have contained the CAD significantly, which has narrowed to a little over 2 per cent for the year 2013-14.
Despite these measures, the CAD could still be a cause of concern in the current year, more so when there is no recovery in growth. Empirical analysis suggests that there is a trade-off between GDP growth and CAD. In other words, CAD could widen if there is a rise in the potential growth in the econ-omy as a growing economy needs higher imports. However, if CAD is increasing in a situation where no recovery in the growth means that there is higher current consumption than investment, primarily by
the government sector, and to a smaller extent, by the household sector. In other words, an expansion-ary fiscal policy that has no significant impact on growth appears to be a huge leakage that is resulting in widening of CAD, which is unsustainable.
Overall, the stimulus measures initiated in the post-Crisis period indeed helped in the recovery of the growth for two consecutive years. However, this appears to be short-lived and has brought some structural risks both in domestic as well as external balances. For the year 2013-14, the growth estimates are below 5 per cent, the lowest even compared to the growth in the crisis year, and this slow growth is also accompanied by high inflation, above the toler-able level of 4.5 per cent to 5 per cent defined by the Central Bank. While the risks are partially attribut-ed to the fragile growth recovery in the developed nations, domestic policies that resulted in higher fis-cal deficit, sectoral policies in crucial sectors like en-ergy (coal) and declining public investments on in-frastructure could be other significant factors. While some of these policies have led to higher inflation, they created capacity constraints as well as sharp fall in productivity in the industrial sector.
However, some measures were initiated aiming at achieving inclusive development goals and (only MGNREGS worked well as counter cyclical meas-ure) restrained sharp fall in effective demand during crisis. While the developed nations beginning to exit the stimulus policies (such as tapering of quantitative easing by the US) and increase risks in the domestic financial markets, there are some domestic struc-tural issues that could magnify such risks and pose challenge to India in balancing growth and inclusive development in the medium to long term. Some of these issues are discussed in the next section.
3 Major issues that could hinder the medium to long term growth in IndiaIndia has achieved a lot through certain sustained macroeconomic policies since 1991 despite some major external shocks such as the Asian crisis, the
Figure 10Current Account Deficit (as per cent of GDP)
Source: Reserve Bank of India.
-6-5-4-3-2-10123
1999
-00
2000
-01
2001
-02
2002
-03
2003
-04
2004
-05
2005
-06
2006
-07
2007
-08
2008
-09
2009
-10
2010
-11
2011
-12
2012
-13

12 DESA WORKING PAPER NO. 137
Dotcom bubble burst and the recent global econom-ic crisis. There is a definite and positive structural shift in the growth path as well as improvement in some of the social indicators such as poverty and un-employment. However, the growth benefits and its distribution appear to be skewed as the decrease in poverty is not proportionate to the increase in eco-nomic growth (low poverty elasticity). This has also led to the rise in regional divergences which in turn resulted in large displacement of people. In other words, the growth that India has achieved appears to be not really inclusive and also not sustainable. Just to address this issue, the 12th Five Year Plan (2012-13 to 2016-17) envisages a “Faster, Sustainable and More Inclusive Growth” (Planning Commission, 2012). While there is a need for large resources in order to achieve the objectives of the Plan, the delay in achieving those objectives only escalated the costs substantially over the years18.
Against this background, there are six major issues that are important to, which the Government not focussing much, achieve the overall socio-economic objective of the 12th Plan. Each issue is discussed in this section.
a. Financial access and financial inclusion
One of the sectors that have developed substantially in the post-1991 period is the financial sector. Prior to the reforms, this sector was closed to foreign par-ticipation and was characterized by little domestic private participation. Banking sector was completely controlled by the public sector undertakings. Hence, the whole sector was lagging in terms of reach and efficiency, in comparison with the other smaller Asian economies. The access to finance was limited, due to high transaction costs and due to the physical distance. Before 1991, population per bank branch was 65,000 and the nominal interest rates varied between 16 per cent to 18 per cent.
The opening of the financial sector for both domestic and foreign participation seems to have led to the development of the sector in terms of size (sharp rise in the credit/GDP ratio as discussed earlier) and
also brought down the transaction costs significant-ly. We have also seen such positive impacts in the trends in savings and investments. Here, we may argue that the high growth that India has achieved during the 2003-2008 is more of a savings-led (by the house-hold and the public sector) which resulted in higher investments. This is because, during the high investment-growth period of 2003-08 we also saw sustained rise in the policy interest rates (apart from other monetary tightening measures). Hence, it is sheer availability of credit, following the expansion of the formal financial sector, which could have pro-vided growth impetus. In other words, it is the credit channel of monetary transmission mechanism, rather than the interest rate channel, which have helped in achieving the high growth with moderate inflation.
Now, if India has to sustain the medium and long term growth, it needs to focus on the financial sec-tor again. We need to understand how far financial sector has supported the growth activities. Bhavani & Bhanumurthy (2012) attempted to examine this issue of the extent of financial sector contribution to the overall growth process with a unique analytical framework. In other words, an attempt has been made to ascertain the extent of financial access pure-ly from macro-growth perspective.
The analysis until the pre-Crisis period shows that the financial resource gap19 (productive resourc-es which have not been financed by the formal
Table 5Financial Resource Gap in India: Segments and Sectors
Agriculture Industry Services Total
Unorganised 51.61 76.3 91.16 67.53
Organised 0.00 0.00 0.00 0.00
Total Economy 49.00 22.00 41.00 38.53
Source: Bhavani & Bhanumurthy (2012), “Financial Access in Post-Reform India” Oxford University Press
Notes: Financial resource gap is computed based on National Sample Survey (NSS) unit level data for the unorganised segment of the industry and service sectors and RBI data for the agriculture.
RECENT DOWNTURN IN EMERGING ECONOMIES AND MACROECONOMIC IMPLICATIONS FOR SUSTAINABLE DEVELOPMENT: A CASE OF INDIA 13
financial sector) for all India is at 38.5 per cent (see table-5). In other words, the existing financial sector is supporting only 61.5 per cent of the needs of the productive sectors. This informs that there is a lot more that needs to be done in the financial sector in order to improve the access. A deeper look into the table shows some more interesting findings. At the sectoral level, given that the industry has a large or-ganised component, it has less financial resource gap compared to the other two sectors. Most interesting is the overall unorganised sector, where the resource gap is largest at 68 per cent. Given that India has a large unorganised segment with proportionately higher employees, financial sector has a long way to go to finance their production needs.
b. Fiscal discipline and subsidy management
Because of the global financial crisis and the fiscal stimulus measures that India has adopted, the fiscal deficits have become unmanageable and the situation heralds that of the early 1990s. During the recent financial crisis period, India adopted a large number of fiscal and monetary measures. While the mone-tary measures (such as sharp reduction in the policy interest rates) were reversible, some fiscal measures that were adopted around the crisis period largely as a counter-cyclical measure, appear to be irreversible. The policies, such as the 6th Pay Commission award, farm loan waiver, employment guarantee schemes, etc., could not be reversed and, hence, led to devi-ations from the medium term fiscal consolidation road map suggested by the 13th Finance Commis-sion20. This has also led to tensions between fiscal and monetary policies and have led to fiscal domi-nance of the monetary policy making it ineffective in achieving two of its main objectives−price stability and ensuring credit availability to the needy sectors.
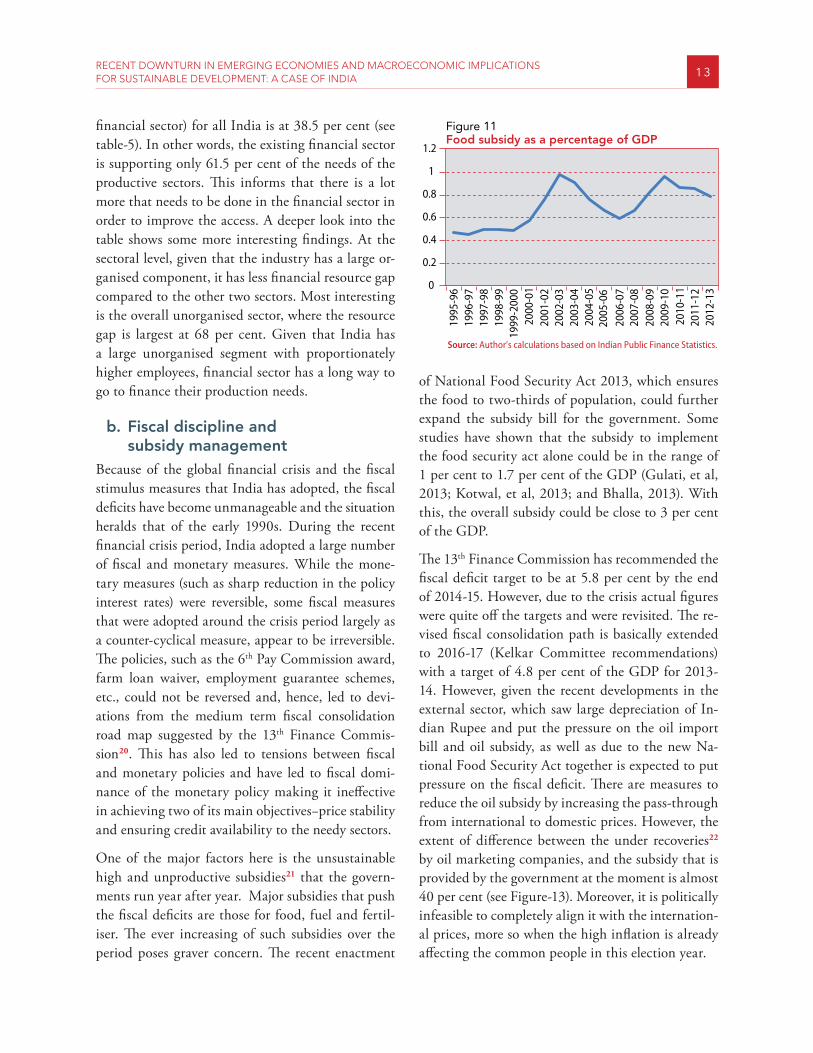
One of the major factors here is the unsustainable high and unproductive subsidies21 that the govern-ments run year after year. Major subsidies that push the fiscal deficits are those for food, fuel and fertil-iser. The ever increasing of such subsidies over the period poses graver concern. The recent enactment
of National Food Security Act 2013, which ensures the food to two-thirds of population, could further expand the subsidy bill for the government. Some studies have shown that the subsidy to implement the food security act alone could be in the range of 1 per cent to 1.7 per cent of the GDP (Gulati, et al, 2013; Kotwal, et al, 2013; and Bhalla, 2013). With this, the overall subsidy could be close to 3 per cent of the GDP.
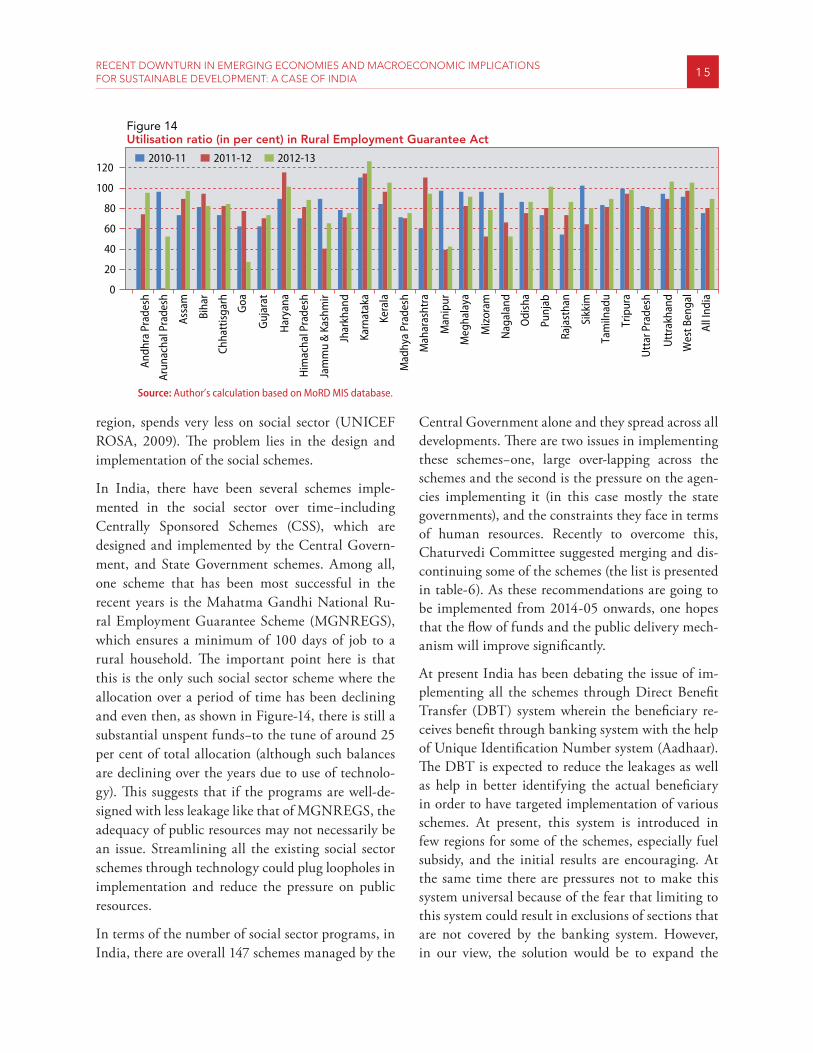
The 13th Finance Commission has recommended the fiscal deficit target to be at 5.8 per cent by the end of 2014-15. However, due to the crisis actual figures were quite off the targets and were revisited. The re-vised fiscal consolidation path is basically extended to 2016-17 (Kelkar Committee recommendations) with a target of 4.8 per cent of the GDP for 2013-14. However, given the recent developments in the external sector, which saw large depreciation of In-dian Rupee and put the pressure on the oil import bill and oil subsidy, as well as due to the new Na-tional Food Security Act together is expected to put pressure on the fiscal deficit. There are measures to reduce the oil subsidy by increasing the pass-through from international to domestic prices. However, the extent of difference between the under recoveries22 by oil marketing companies, and the subsidy that is provided by the government at the moment is almost 40 per cent (see Figure-13). Moreover, it is politically infeasible to completely align it with the internation-al prices, more so when the high inflation is already affecting the common people in this election year.
Figure 11Food subsidy as a percentage of GDP
Source: Author’s calculations based on Indian Public Finance Statistics.
0
0.2
0.4
0.6
0.8
1
1.2
1995
-96
1996
-97
1997
-98
1998
-99
1999
-200
020
00-0
120
01-0
220
02-0
320
03-0
420
04-0
520
05-0
620
06-0
720
07-0
820
08-0
920
09-1
020
10-1
120
11-1
220
12-1
3
14 DESA WORKING PAPER NO. 137
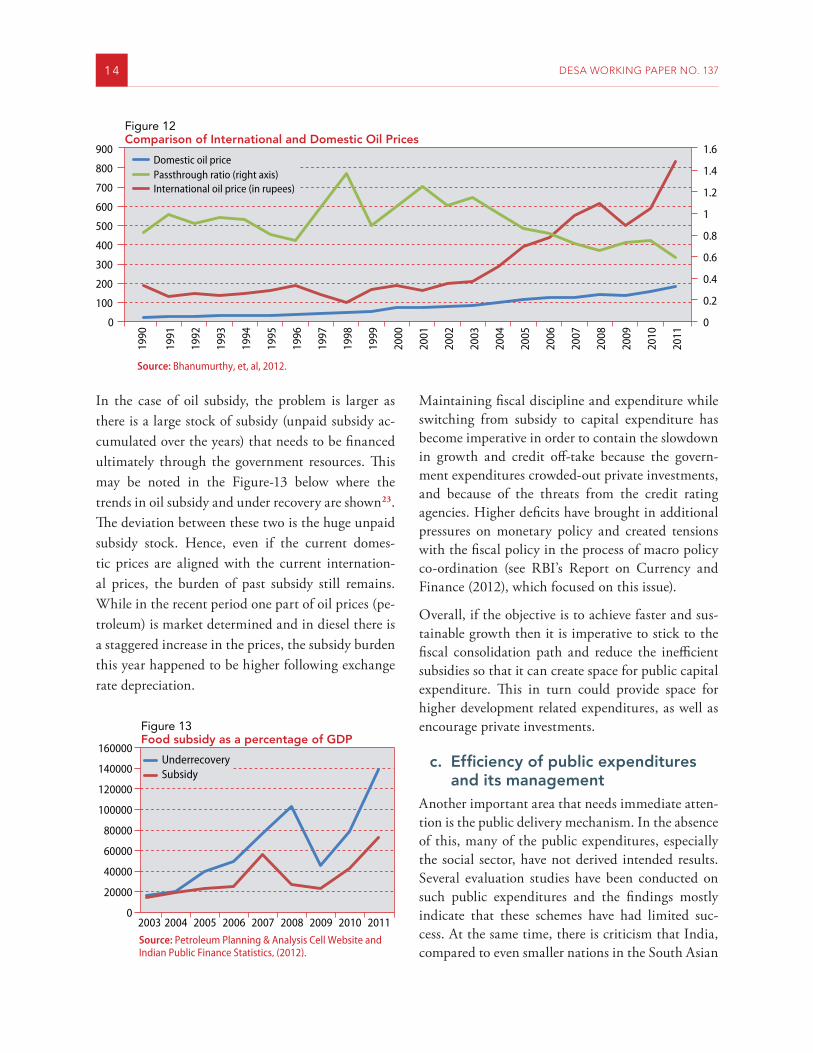
In the case of oil subsidy, the problem is larger as there is a large stock of subsidy (unpaid subsidy ac-cumulated over the years) that needs to be financed ultimately through the government resources. This may be noted in the Figure-13 below where the trends in oil subsidy and under recovery are shown23. The deviation between these two is the huge unpaid subsidy stock. Hence, even if the current domes-tic prices are aligned with the current internation-al prices, the burden of past subsidy still remains. While in the recent period one part of oil prices (pe-troleum) is market determined and in diesel there is a staggered increase in the prices, the subsidy burden this year happened to be higher following exchange rate depreciation.
Maintaining fiscal discipline and expenditure while switching from subsidy to capital expenditure has become imperative in order to contain the slowdown in growth and credit off-take because the govern-ment expenditures crowded-out private investments, and because of the threats from the credit rating agencies. Higher deficits have brought in additional pressures on monetary policy and created tensions with the fiscal policy in the process of macro policy co-ordination (see RBI’s Report on Currency and Finance (2012), which focused on this issue).
Overall, if the objective is to achieve faster and sus-tainable growth then it is imperative to stick to the fiscal consolidation path and reduce the inefficient subsidies so that it can create space for public capital expenditure. This in turn could provide space for higher development related expenditures, as well as encourage private investments.
c. Efficiency of public expenditures and its management
Another important area that needs immediate atten-tion is the public delivery mechanism. In the absence of this, many of the public expenditures, especially the social sector, have not derived intended results. Several evaluation studies have been conducted on such public expenditures and the findings mostly indicate that these schemes have had limited suc-cess. At the same time, there is criticism that India, compared to even smaller nations in the South Asian
Figure 12Comparison of International and Domestic Oil Prices
Source: Bhanumurthy, et, al, 2012.
0
0.2
0.4
0.6
0.8
1
1.2
1.4
1.6
0
100
200
300
400
500
600
700
800
90019
90
1991
1992
1993
1994
1995
1996
1997
1998
1999
2000
2001
2002
2003
2004
2005
2006
2007
2008
2009
2010
2011
Domestic oil price
International oil price (in rupees)Passthrough ratio (right axis)
Figure 13Food subsidy as a percentage of GDP
Source: Petroleum Planning & Analysis Cell Website and Indian Public Finance Statistics, (2012).
0
20000
40000
60000
80000
100000
120000
140000
160000
2003 2004 2005 2006 2007 2008 2009 2010 2011
UnderrecoverySubsidy
RECENT DOWNTURN IN EMERGING ECONOMIES AND MACROECONOMIC IMPLICATIONS FOR SUSTAINABLE DEVELOPMENT: A CASE OF INDIA 15
region, spends very less on social sector (UNICEF ROSA, 2009). The problem lies in the design and implementation of the social schemes.
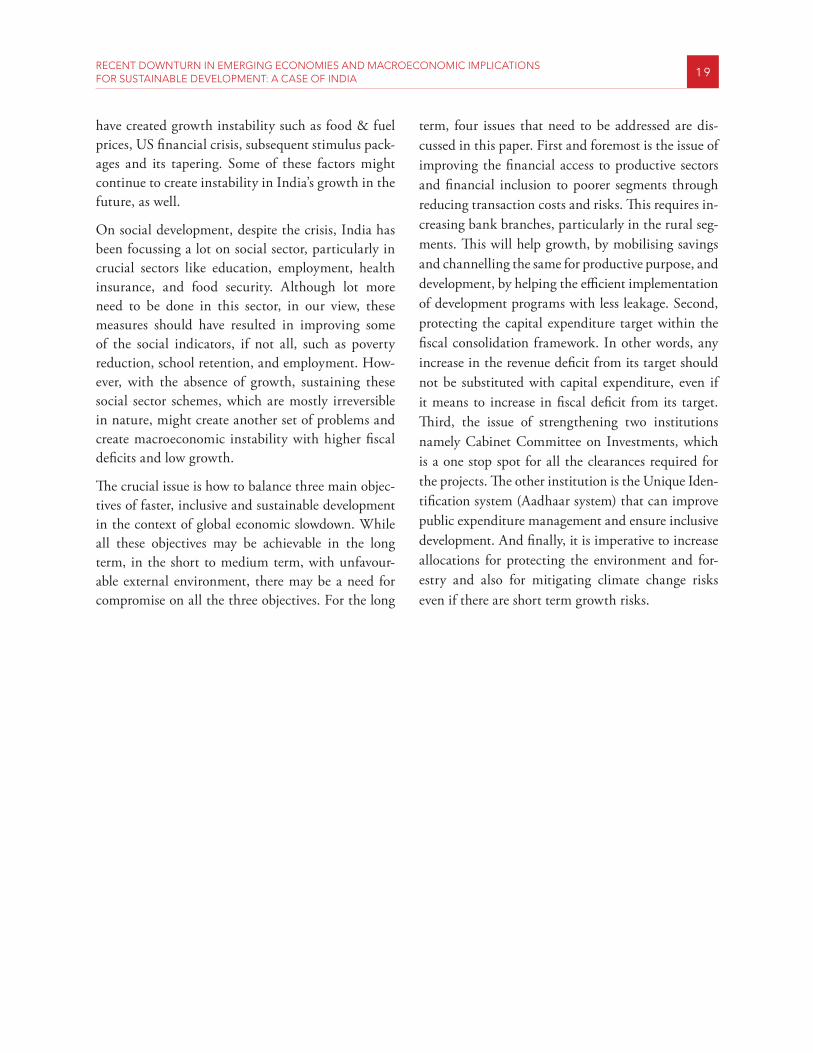
In India, there have been several schemes imple-mented in the social sector over time−including Centrally Sponsored Schemes (CSS), which are designed and implemented by the Central Govern-ment, and State Government schemes. Among all, one scheme that has been most successful in the recent years is the Mahatma Gandhi National Ru-ral Employment Guarantee Scheme (MGNREGS), which ensures a minimum of 100 days of job to a rural household. The important point here is that this is the only such social sector scheme where the allocation over a period of time has been declining and even then, as shown in Figure-14, there is still a substantial unspent funds−to the tune of around 25 per cent of total allocation (although such balances are declining over the years due to use of technolo-gy). This suggests that if the programs are well-de-signed with less leakage like that of MGNREGS, the adequacy of public resources may not necessarily be an issue. Streamlining all the existing social sector schemes through technology could plug loopholes in implementation and reduce the pressure on public resources.
In terms of the number of social sector programs, in India, there are overall 147 schemes managed by the
Central Government alone and they spread across all developments. There are two issues in implementing these schemes−one, large over-lapping across the schemes and the second is the pressure on the agen-cies implementing it (in this case mostly the state governments), and the constraints they face in terms of human resources. Recently to overcome this, Chaturvedi Committee suggested merging and dis-continuing some of the schemes (the list is presented in table-6). As these recommendations are going to be implemented from 2014-05 onwards, one hopes that the flow of funds and the public delivery mech-anism will improve significantly.
At present India has been debating the issue of im-plementing all the schemes through Direct Benefit Transfer (DBT) system wherein the beneficiary re-ceives benefit through banking system with the help of Unique Identification Number system (Aadhaar). The DBT is expected to reduce the leakages as well as help in better identifying the actual beneficiary in order to have targeted implementation of various schemes. At present, this system is introduced in few regions for some of the schemes, especially fuel subsidy, and the initial results are encouraging. At the same time there are pressures not to make this system universal because of the fear that limiting to this system could result in exclusions of sections that are not covered by the banking system. However, in our view, the solution would be to expand the
Figure 14Utilisation ratio (in per cent) in Rural Employment Guarantee Act
Source: Author’s calculation based on MoRD MIS database.
0
20
40
60
80
100
120
Andh
ra P
rade
sh
Arun
acha
l Pra
desh
Assa
m
Biha
r
Chha
ttis
garh
Goa
Guj
arat
Har
yana
Him
acha
l Pra
desh
Jam
mu
& K
ashm
ir
Jhar
khan
d
Karn
atak
a
Kera
la
Mad
hya
Prad
esh
Mah
aras
htra
Man
ipur
Meg
hala
ya
Miz
oram
Nag
alan
d
Odi
sha
Punj
ab
Raja
stha
n
Sikk
im
Tam
ilnad
u
Trip
ura
Utt
ar P
rade
sh
Utt
rakh
and
Wes
t Ben
gal
All I
ndia
2010-11 2011-12 2012-13

16 DESA WORKING PAPER NO. 137
banking system rather than going back to old public delivery system, which time and again has proved to be inefficient. In other words, financial access be-comes crucial not only to expand growth, but also to enhance efficiency in the public delivery mechanism.
d. Risks from external sectorDevelopments in the global economy in the post-Crisis period show that the recovery in most of the developed and emerging markets could take more time than desired. Moreover, some of the econ-omies are seem to be adopting protectionist policies. In such circumstances, the risks on countries such as India are that it may not be able to come back to the pre-Crisis growth path that has averaged close to 9 per cent. In other words, even with domesti-cally strong growth oriented policies, the post-crisis growth could be potentially less, at around 7 per cent at least in the medium term, due to external sector vulnerability. There are other short term risks that
India faces in terms of capital flows. Recent depreci-ation of Rupee in the aftermath of US Fed statement on tapering quantitative easing only suggests that short term risks are huge and need to be guarded. Many measures have been taken by the Government and the Central Bank (such as increasing import tariffs on gold, increasing overseas borrowing win-dow for banks, and some flexibility to traders in rebooking cancelled forward exchange contracts) to contain such risks and appear to be working well as the recent figures on current account deficit show a sharp decline−from over 5 per cent of GDP in the first quarter to around 1.2 per cent in the second quarter of 2013-14. However, once the tapering be-gins later some time in 2014, the impacts have to be ultimately absorbed by emerging market economies such as India.
e. Growth and InclusionIn the post-1991 period, as discussed earlier, many of the policies were intended to increase growth through the introduction of stabilisation policies and structural adjustment programs such as liberal-isation of industrial licensing, full convertibility on current account, exchange rate liberalisation, etc. At that point of time, the general understanding was that by increasing growth, one can mobilise more resources for developmental activities. However, as it turned out, while the growth did occur (with an average annual growth of 7.7 per cent in the last ten years despite the global economic slowdown), it was also accompanied by higher divergences across the sectors, segments, as well as regions. Many have argued that the outcome of the reforms was ‘job-less growth’ as the reforms increasingly helped the service sector growth, which has low employment elasticity with respect to output24, while completely neglecting the commodity producing sectors such as agriculture and industry. The post-1991 reforms have even led to a decline in the public investments and have led to capacity constraints in both the sectors. This has brought the issue of growth versus distribu-tion (or inclusion) to the core of public policy.
Table 6Proposed Consolidation of Centrally Sponsored Schemes
Schemes in departments
No. of existing schemes
Recommended by Chaturvedi
Committee
Agriculture & Co-operation 13 6
Animal husbandry, diary and fisheries 15 3
Environment & Forest 8 4
Health and Family Welfare 11 5
Home affairs 4 1
School education and literacy 17 6
Labour and employment 13 2
Minority affairs 4 1
Rural development 6 4
Social justice and empowerment 13 5
Others 43 23
Total 147 60
Source: Planning Commission.

RECENT DOWNTURN IN EMERGING ECONOMIES AND MACROECONOMIC IMPLICATIONS FOR SUSTAINABLE DEVELOPMENT: A CASE OF INDIA 17
Since the 11th plan (2007-08 to 2011-12), there have been efforts to address the issue of inclusive develop-ment and several measures have been taken, such as employment guarantee scheme, rural infrastructure development programs, rural housing, rural connec-tivity, social security (pension) scheme for unorgan-ised workers and recently, the food security scheme. While some of the schemes are necessary, others seem rather populist, and with no understanding of the implications of such schemes on the fiscal and macroeconomic stability (see Tendulkar & Bhavani, 2012). More important is that the shift from (or neglect of) growth oriented policies (such as public investments in agriculture and infrastructure), and the reforms to populist social sector schemes and transfer payments & subsidies, that seems to have resulted in worsening the balance between growth and fiscal deficit. These measures alone resulted in increasing the share of revenue expenditure by 8 per cent in the total government expenditure, thus pushing both revenue deficit and fiscal deficit sig-nificantly. Elsewhere, we have argued that higher growth target with inclusive development objective that increases revenue deficit (through increase in transfer payments and subsidies), and at the same time imposing strict fiscal consolidation targets are internally inconsistent, because running higher revenue deficit while sticking to fiscal consolidation targets only results in decline in public capital ex-penditure. In such circumstances, one could end up with negative revenue expenditure multipliers (see Bose & Bhanumurthy, 2013).
How to balance both growth and inclusion? One way is to target slightly lower growth in the 12th Plan than what Planning Commission has targeted (8.2 per cent by the end of 12th Plan) that will create space for social sector expenditures. Another option is to relax the fiscal consolidation target while at the same time achieving the capital expenditure target of 6 per cent of the GDP (both central and state togeth-er) by the end of 2016-17. Even in this case, based on a dynamic structural analysis, one may have to bear a slightly higher level of inflation.
f. Growth and sustainable development
India’s 12th Plan aims at achieving a higher growth, which is at the same time sustainable that ensures protection of environment and at the same time adapt to the climate change risks. In the past, the is-sue of sustainable development was largely discussed at the international level and sought international cooperation. It was perceived that developed coun-tries are the main contributors of global warming and environmental degradation and rest of the world argued that these developed countries need to take larger responsibility in mitigating such damages. India, while continuing to engage actively in the in-ternational discourses, also needed to take necessary measures because it is one of the faster growing econ-omies but, at the same time, faces a large threat from environmental degradation. To tackle the problem of environment degradation, India has prepared a ‘Na-tional Action Plan for Climate Change’ (NAPCC) whose objective is to ‘establish an effective, coopera-tive and equitable global approach based on the prin-ciple of common but differentiated responsibilities and respective capabilities, enshrined in the United Nations Framework Convention on Climate Change (UNFCCC)’25.
Under its action plan, there are eight missions that focus on different aspects of the ecology that ensure sustainable and green growth. They are: National Solar Mission, National Mission for Enhanced En-ergy Efficiency, National Mission on Sustainable Habitat, National Water Mission, National Mission for Sustaining the Himalayan Ecosystem, Nation-al Mission for a Green India, National Mission for Sustainable Agriculture, and National Mission on Strategic Knowledge for Climate Change.
In addition to this action plan, there are other initi-atives that government has already taken in the area of environmental accounting and governance. It has already worked out a framework for integrating green accounting in the conventional System of National Accounts (SNA)26. The government has made a vol-untary commitment to reduce the emissions intensity of GDP by 20-25 per cent of 2005 levels by 2020. As

18 DESA WORKING PAPER NO. 137
part of the National Environmental Policy-2006, it was mandatory to get the environmental clearance for all the industrial projects. It also engages the concepts of ‘green buildings’ and ‘green rural de-velopment’, although adoption of these concepts is not compulsory yet. As the larger responsibility of protecting the environment and the forests lies with the sub-national level, some incentive mechanism has
also been developed by the 13th Finance Commission for the sub-national governments that are conserv-ing forests as part of achieving ‘inclusive and green growth promoting fiscal federalism’27.
The implication of the above discussion is that In-dia has taken various measures towards achieving sustainable development. However, as the 12th Plan suggests, implementation of all the intended policies need large resources. But the allocations at the mo-ment are very meagre due to lack of viable project proposals and lack of enough sensitivity towards the sustainable issues at the level of the sub-nation-al governments28. While increasing such resource allocations will ensure long term sustainable devel-opment, this might put pressure on fiscal deficits and the growth in the short run, this will ensure the achievement of long term goal of sustainable devel-opment. What needs to be done is to adopt what the 13th Finance Commission suggests-the ‘expansion-ary fiscal consolidation’ strategy of reducing subsi-dies that are unproductive as well as unsustainable and at the same time increasing the developmental capital expenditures. In the medium term, similar to the inclusive development, as discussed in previous section, sustainable development strategy may com-promise growth to some extent29. However, such strategy would ensure long term goal of achieving green growth.
4 ConclusionAt present, India is facing problems due to both do-mestic as well as external factors. Domestic factors are largely due to the running of high fiscal deficits along with lack of serious economic reforms that has reduced investors’ (both domestic and foreign) con-fidence on the country’s long term growth prospects. Although, off-late there were few reform measures that are taken up, such as land acquisition, Cabi-net Committee on Investments (CCI), etc., there are several crucial policies that are still pending. In addition, ambiguities in sectoral policies particular-ly in crucial sectors such as power, coal, and other infrastructure sectors have affected the investment climate. In addition, there are external factors that
Principles guiding the National Action Plan for Climate Change
1. Protecting the poor and vulnerable sections of society through an inclusive and sustaina-ble development strategy, sensitive to climate change.
2. Achieving national growth objectives through a qualitative change in direction that enhanc-es ecological sustainability, leading to further mitigation of greenhouse gas emissions.
3. Devising efficient and cost-effective strategies for end use Demand Side Management.
4. Deploying appropriate technologies for both adaptation and mitigation of greenhouse gases e-missions extensively as well as at an accelerated pace.
5. Engineering new and innovative forms of mar-ket, regulatory and voluntary mechanisms to promote sustainable development.
6. Effecting implementation of programmes through unique linkages, including with civil society and local government institutions and through public-private partnership.
7. Welcoming international cooperation for re-search, development, sharing and transfer of technologies enabled by additional funding and a global IPR regime that facilitates tech-nology transfer to developing countries under the UNFCCC.
Source: Prime Minister’s Council on Climate Change, Government of India. http://pmindia.gov.in/climate_change_english.pdf.
RECENT DOWNTURN IN EMERGING ECONOMIES AND MACROECONOMIC IMPLICATIONS FOR SUSTAINABLE DEVELOPMENT: A CASE OF INDIA 19
have created growth instability such as food & fuel prices, US financial crisis, subsequent stimulus pack-ages and its tapering. Some of these factors might continue to create instability in India’s growth in the future, as well.
On social development, despite the crisis, India has been focussing a lot on social sector, particularly in crucial sectors like education, employment, health insurance, and food security. Although lot more need to be done in this sector, in our view, these measures should have resulted in improving some of the social indicators, if not all, such as poverty reduction, school retention, and employment. How-ever, with the absence of growth, sustaining these social sector schemes, which are mostly irreversible in nature, might create another set of problems and create macroeconomic instability with higher fiscal deficits and low growth.
The crucial issue is how to balance three main objec-tives of faster, inclusive and sustainable development in the context of global economic slowdown. While all these objectives may be achievable in the long term, in the short to medium term, with unfavour-able external environment, there may be a need for compromise on all the three objectives. For the long
term, four issues that need to be addressed are dis-cussed in this paper. First and foremost is the issue of improving the financial access to productive sectors and financial inclusion to poorer segments through reducing transaction costs and risks. This requires in-creasing bank branches, particularly in the rural seg-ments. This will help growth, by mobilising savings and channelling the same for productive purpose, and development, by helping the efficient implementation of development programs with less leakage. Second, protecting the capital expenditure target within the fiscal consolidation framework. In other words, any increase in the revenue deficit from its target should not be substituted with capital expenditure, even if it means to increase in fiscal deficit from its target. Third, the issue of strengthening two institutions namely Cabinet Committee on Investments, which is a one stop spot for all the clearances required for the projects. The other institution is the Unique Iden-tification system (Aadhaar system) that can improve public expenditure management and ensure inclusive development. And finally, it is imperative to increase allocations for protecting the environment and for-estry and also for mitigating climate change risks even if there are short term growth risks.

2 0 DESA WORKING PAPER NO. 137
Notes
1 See Mundle et al, 2011.
2 For instance, tapering talk by the United States in May 2013 led to sharp outflow of capital from emerging mar-kets, including India, and also led to sharp depreciation of currencies. This makes the exit policy coordination dif-ficult among G-20 nations, although there is a need for much larger co-ordination (see Akyuz, 2013).
3 The major policy reforms which were introduced in India during the early 1990s included macroeconomic stabiliza-tion policies through exchange rate devaluation, disman-tling license permit raj, deregulation of production, invest-ment and prices, liberalization of foreign trade and full current account convertibility, tax reforms, disinvestment policies, financial sector reforms through introduction of both domestic and foreign private participation, etc.
4 Tendulkar & Bhavani (2012) argue that the collapse of USSR that resulted in loss of faith on central economic planning, success of China’s ‘socialist market economy’, two parliamentary elections in succession that put pres-sure on fiscal, and success of hesitant and partial reforms of 1980s has forced the new government in June 1991 to go for holistic reforms. They also argue that bailout packages provided by IMF and the World Bank to overcome debt default by India around 1991 also subtly forced the country towards systemic reforms.
5 Many studies have shown that there was a definite structur-al shift in the growth in the first half of 1990s (see Balakr-ishnan & Parameswaran (2007); Dholakia (2007) and oth-ers for the debate).
6 The Comptroller and Auditor General of India (CAG) is currently probing the irregularities in coal block allocations to private companies since 1993 as the CAG feels that the allocations were made in an inefficient manner and result-ed in substantial loss to government’s exchequer. Recently the Government indicated to the Supreme Court that it is in the process of cancelling 41 coal block allocations. All this led to the stalling of overall production and forcing the electricity companies to import coal from countries like In-donesia, which is creating imbalances in external account. Recent data shows that the coal imports in the first half of 2013-14 valued at US$7.8 billion and for the whole of 2012-13 it was at US$15.5 billion. At the same time, the Cabinet Committee on Investment (CCI) has also cleared some new and some stalled power projects, which might put additional demand on coal and further worsen the ex-ternal account.
7 Trade openness is defined as exports plus imports as a ratio to GDP.
8 This issue is discussed in an earlier study, which analysed the impact of external shocks on economic growth and the main findings are highlighted in the next section (Bhanu-murthy & Kumawat, 2009).
9 See Tendulkar & Bhavani (2012).
10 The impact of farm loan waiver, broadening the scope of MGNREGS, the Sixth Pay Commission award to central public sector employees, and the additional provision for food and fertilizer subsidies has increased the fiscal deficit of the Central Government from 2.6% in 2007-08 to 6.1% in 2008-09.
11 This is attempted in Bhanumurthy & Kumawat (2009).
12 Three stimulus packages were introduced between De-cember 2008 and February 2009. The stimulus measures include additional development expenditure of Rs 20,000 crore (about US$4 billions), across the board cut in excise duty by 4%, incentives for labour intensive industries such as textile, handlooms, gems & jewellery, interest subsidy for exporters, and reduction in the service tax by 2%. These three packages were estimated to increase the fiscal deficit by 1.8% in 2008-09.
13 The Repo Rate was reduced by 425 basis points, Reverse Repo rate reduced by 275 basis points, and Cash Reserve Ratio was reduced by 400 basis points.
14 It is a sort of privatisation where the loss-making public sector enterprises are sold to reduce the fiscal deficit con-sistent with the fiscal consolidation target. As per the 13th Finance Commission recommendations, the proceeds from the disinvestments is targeted at 1% of GDP.
15 Core sector in India include coal, crude oil, natural gas, refinery products, fertilizers, steel, cement and electricity.
16 See the “Report of the Committee on Roadmap for Fiscal Consolidation:2012”, http://finmin.nic.in/reports/Kelkar_Committee_Report.pdf.
17 As per the International Energy Agency (IEA) predictions, India would be largest refined petroleum product exporter in Asia by 2014.
18 Such trends were seen in the 11th Plan where the infrastruc-ture investment target was fixed at US$ 500 billion while the actual expenditure was negligible. At present in the 12th Plan the same infrastructure target has been revised to US$ 1 trillion.
19 Financial resource gap is defined as –100x [ 1 – {finances availed from formal financial system/ productive invest-ment}]. The financial resource gap ranges between zero and 100, which indicate full financial inclusion and exclusion, respectively.

RECENT DOWNTURN IN EMERGING ECONOMIES AND MACROECONOMIC IMPLICATIONS FOR SUSTAINABLE DEVELOPMENT: A CASE OF INDIA 2 1
20 India constitutes Pay Commission every ten years to revise the salaries of Central Government employees, which is a reference to the State Government as well as employees in public sector enterprises. Similarly, Government appoints Finance Commission every five years to determine the formula for sharing the tax revenues between Centre and States.
21 Many studies in India have shown that subsidies are poor-ly targeted. For instance, Fan, et.al (2007) argue that “Agricultural input and output subsidies have proved to be unproductive, financially unsustainable, environmentally unfriendly in recent years, and contributed to increased in-equality among rural Indian states”, (available from http://www.ifpri.org/publication/investment-subsidies-and-pro-poor-growth-rural-india).
22 Under recoveries is the gap between the local administered fuel prices and what would have been the price if the same fuel were imported. Oil subsidy bill shown in the Govern-ment books are just a portion of this under recoveries de-clared by the oil marketing companies.
23 Here under recovery is the actual loss that the oil compa-nies face due to under-pricing while the subsidy is just a
portion of the under recovery provided through the gov-ernment budgets.
24 Between 2004-05 and 2009-10, employment elasticity with respect to output in industrial sector is 0.34% while the same in services sector is 0.14% (Papola & Sahu (2012))
25 Government of India (2008), “National Action Plan for Climate Change”, available from http://moef.nic.in/mod-ules/about-the-ministry/CCD/NAP_E.pdf.
26 Government of India (2013), “Green National Accounts in India: A Framework”, March. http://mospi.nic.in/mospi_new/upload/Green_National_Accouts_in_India_1may13.pdf.
27 Chapter-3 of Thirteenth Finance Commission Report, Government of India.
28 At present the allocation of the Ministry of Environment and Forests is just 0.012% of GDP. (Page-202 of 12th Plan Document.)
29 Nearly 122 big industrial project proposals worth US$ 150 – 200 billion are stalled for long time pending environmen-tal clearances.

2 2 DESA WORKING PAPER NO. 137
ReferencesAkyuz Yilmaz (2013), “Crisis Mismanagement in the
US and Europe: Impact on Developing countries and Longer-term Consequences”, paper presented in Expert Group Meeting organized by UN-DESA, New York, 5-6, December.
Balakrishnan, P. and Parameswaran, M. (2007a), “Understanding Economic Growth in India: A Prerequisite”, Economic and Political Weekly, vol. 42(27−28), pp. 2915−2922.
Bhalla, Surjit (2013), “Manmonia’s FSB: 3 per cent of GDP”, Financial Express, 6th July.
Bhanumurthy, NR, Surajit Das and Sukanya Bose (2012), “Oil price shock, pass-through policy and its impact on the Indian Economy”, NIPFP Working Paper-99, March 2012
Bhanumurthy NR and Lokendra Kumwat (2009); “Crisis and India’s macroeconomic outlook”, Review of Market Integration, Vol.1, No.2, May-August, 2009, Sage.
Bhavani TA and NR Bhanumurthy (2012), Financial Access in the Post-Reform India, 2012, Oxford University Press.
Bose, Sukanya and NR Bhanumurthy (2013), “Fiscal Multipliers for India”, NIPFP Working Paper-125, September, 2013
Dholakia, R. H. (2007), “Understanding Indian Eco-nomic Growth: Some Observations”, Economic and Political Weekly, vol. 42(34), pp 3509−11.
Fan, Shenggen; Ashok Gulati and Sukhadeo Thorat (2007): “Investment, Subsidies, and Pro-Poor Growth in Rural India”, IFPRI Discussion Pa-per-00716, September.
Gulati, Ashok; Jyoti Gujral and T Nanda Kumar (2013); “National Food Security Bill: Challenges and Options”, Discussion Paper-2, CACP, Government of India.
Kotwal, Ashok, Milind Murugkar and Bharat Ramaswami( 2013): “Correct costs of the Food Security Bill”, Financial Express, 17th August.
Mukherjee, C (2009), “Recent trends in Indian GDP and its Components: An Exploratory Analysis”, Economic and Political Weekly, October 10, Vol.XLIV, pp.13-15
Mundle, Sudipto; M Govinda Rao and N R Bhanumur-thy (2011): “Stimulus, Recovery and Exit Policy: G20 Experience and Indian Strategy”, Economic and Political Weekly, 16th July, 2011, Pp.85-94.
Papola, TS and PP Sahu (2012): “Growth and Structure of Employment in India: Long-Term and Post-Re-form Performance and the Emerging Challenge” mimeo, ISID, New Delhi.
Rakshit, M (2009), “India amidst the Global Crisis”, Economic and Political Weekly, March 28, Vol.XLIV, pp.94-106.
Tendulkar, Suresh and TA Bhavani (2012) “Understand-ing Reforms: Post-1991 India”, Oxford University Press, second edition.