recent developments in global crude oil and natural gas markets by dr. kenneth medlock of rice...
TRANSCRIPT

Recent Developments in Global Crude Oil and Natural Gas Markets
Kenneth B Medlock III, PhD James A Baker III and Susan G Baker Fellow in Energy and Resource Economics, and
Senior Director, Center for Energy Studies Rice University’s Baker Institute
January 22, 2015
Before we begin, a word about forecasting…
2

Oil Markets and the “Expected” Price of Oil • Long term price projections are rarely accurate, and appear adaptive. • “The best cure for high prices is high prices”
– Producers respond by sinking more capital into upstream endeavors.
– Consumers respond by investing in efficiency.
Source: EIA • The point? The value is in the exercise!

The last decade has brought significant change in global oil and gas markets, and hence influenced
developments in regional energy markets, international energy trade and geopolitics.
Activity in the US has been a primary driver, and North America more generally has become a very different actor in global energy markets, with the
potential to alter geopolitical relationships.
We have also seen the price of oil rise and fall in unprecedented extremes. In order to understand
where oil price might go, or at least what the drivers of change are, it is useful to look back.
4

Explaining Oil Price for the Last 30 Years
5

Demand Pull Sets the Stage:
Global Total Primary Energy Requirement (TPER)
6

Total Primary Energy Requirement • Baker Institute CES forecast of TPER by fuel, 1992-2040
7

Oil Demand • Baker Institute CES forecast of petroleum demand by country, 1992-2040
- Demand will continue to grow, driven largely by very populous developing economies such as China and India.
8
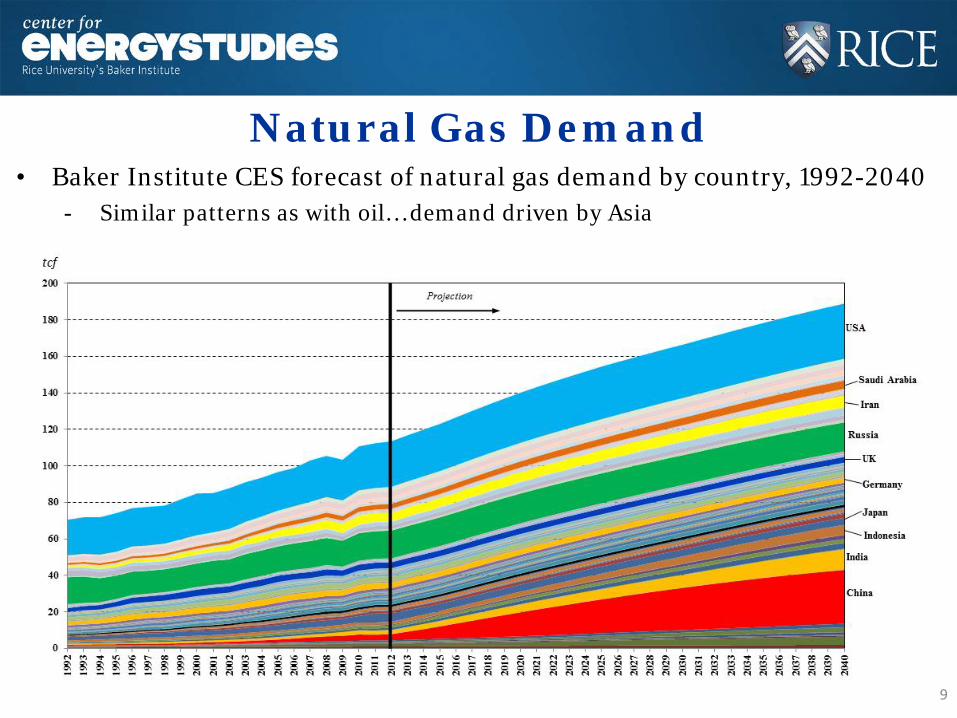
Natural Gas Demand • Baker Institute CES forecast of natural gas demand by country, 1992-2040
- Similar patterns as with oil… demand driven by Asia
9

Coal Demand • Baker Institute CES forecast of coal demand by country, 1992-2040
- Infrastructure in China has been developed around coal… will China switch away, or upgrade environmental controls?
10
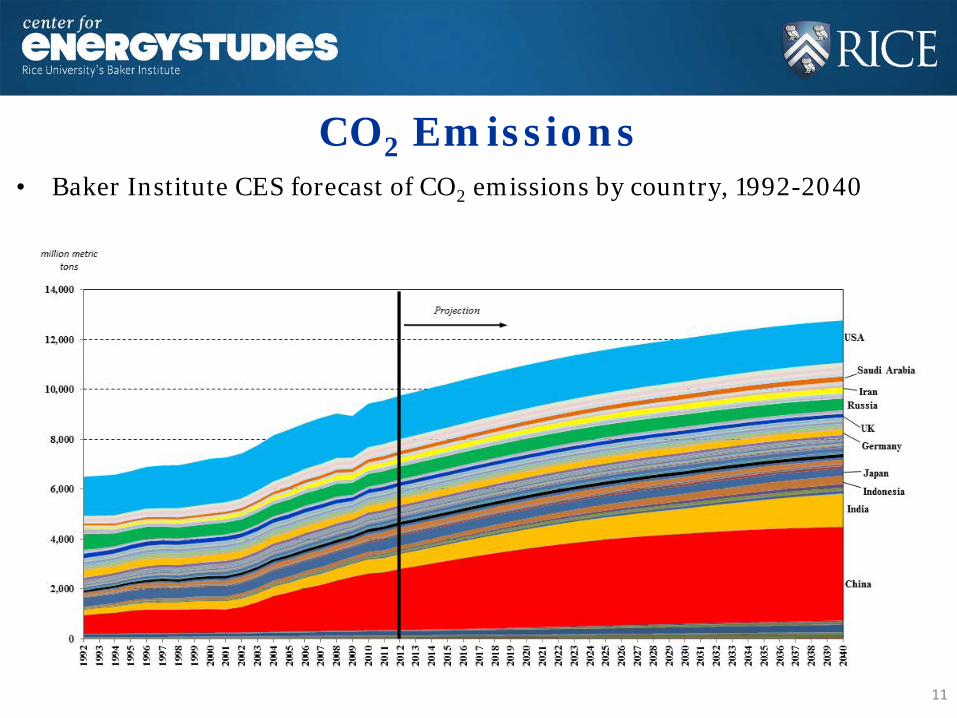
CO2 Emissions • Baker Institute CES forecast of CO2 emissions by country, 1992-2040
11

Supply growth is an important story
12

North America as a Microcosm
13

Rewind to 2003 – LNG is coming to North America

Then, shale happened in the US and Canada…

… we quickly realized shale resources are everywhere*
Major North American Shale Plays (~1,930 tcf)
European, Latin American, African and Pacific Shale Plays
(~4,670 tcf)
*Over 6,600 tcf of shale according to ARI report, 2011

North American Shale Resources • Shale oil and gas resources are largely east of the Rockies.
Source: Gallery of World Hydrocarbon Endowment & Shale Gas Resources, http://alfin2300.blogspot.com/2012/03/gallery-of-world-hydrocarbon-endowment.html

Geology AND market structure yields the recipe for success… and a massive
competitive advantage • Geology is a necessary condition for vibrant and successful
upstream activity… • … but it is NOT sufficient! • A host of above ground factors must be aligned for commercial
success to be realized. • Once in play, commercial success builds on itself because it
encourages entrepreneurial activity, and creates an environment that is attractive to capital inflows.
• Thus, a variety of regulatory and market institutions must be in place if North America is to reach its full potential in terms of energy security and economic well-being. 18

The sufficient conditions… • Upstream firms negotiate directly with landowners for access to mineral rights. • A market in which liquid pricing locations, or hubs, exist and are easily accessed
due to liberalized transportation services being unbundled from pipeline ownership. • A well-developed pipeline network that can accommodate new production volumes. • A market in which interstate pipeline development is relatively seamless due to a
well-established governing body – the Federal Energy Regulatory Commission (FERC) – and a comparatively straightforward regulatory approval process.
• A market in which demand pull is sufficient, and can materialize with minimal regulatory impediment thus allowing new supplies to compete for market share.
• A market where a well-developed service sector exists that can facilitate fast-paced drilling activity and provide rapid response to demands in the field.
• A competitive service sector that strives to lower costs and advance technologies in order to gain a commercial advantage.
• A rig fleet that is capable of responding to upstream demands without constraint. • A deep set of upstream actors – the independent producer – that can behave as the
“entrepreneur” thereby facilitating a flow of capital into the field toward smaller scale, riskier ventures than those typically engaged by vertically integrated majors. 19

Will it Last? Shale Well Performance
20
• Well-specific EURs can vary within a shale play substantially - Ultimately, profitability matters, as there is little debate about resource scale - Some wells are profitable at $2.65/mcf, others need $8.10… median is $4.85.
EUR 2.83 bcf 1.51 bcf 0.93 bcf
A Long Term Shale Opportunity
21
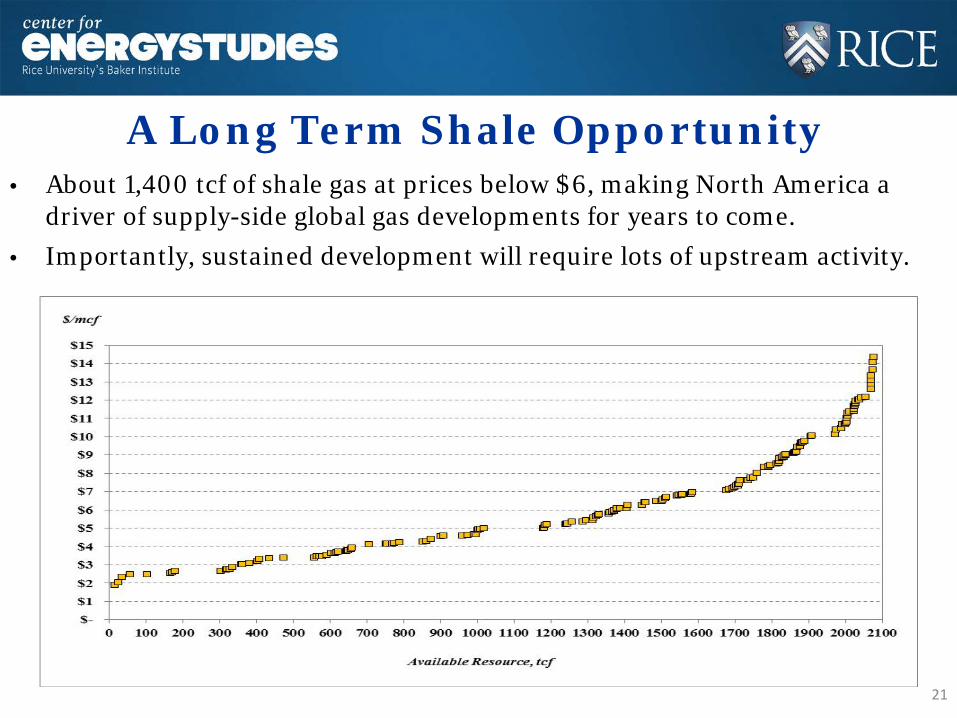
• About 1,400 tcf of shale gas at prices below $6, making North America a driver of supply-side global gas developments for years to come.
• Importantly, sustained development will require lots of upstream activity.

US Oil Production Surge • The last 5 years higher price has aided a resurgence in US oil production,
from both unconventional reservoirs and old fields. The last 2 years have seen 2 of the 3 largest annual increases ever in a single country!
• Shale is at the center of the US experience.
Source: EIA

Oil Market Developments (US) • Resource potential is distributed widely.
- LTO production is the driver of trends in the US. North Dakota (Bakken), Texas (Permian, Eagleford), Ohio (Utica), Pennsylvania (Marcellus), Colorado (Niobrara), Louisiana (Tuscaloosa Marine), Oklahoma (Mississippi Lime), California (Monterrey). o Not all shales are created equal. Each faces different geology, different
environmental factors (such as water availability), and different economics.
o Bakken and Eagleford currently accounts for most US LTO production.
o Strong activity emerging in Permian.
o LTO production is challenging the current legal frameworks on US oil exports.
o Oil imports are down.
o The US now is a net exporter of petroleum products, aided by cheap natural gas and lower domestic demand.
o The export ban may present a demand constraint, especially with uncertainty looming on the law. Policy certainty is key.
23

The Global Oil Market…
24

Global Oil Supply • History is peppered with change, but production has continued to grow for
the last 50 years, with dips being driven by declining demand.
25 Source: BP

Global Oil Supply (cont.) • Natural declines in some provinces
are being realized, in some case due to under investment.
- Norway: 650 thous b/d
- UK: 700 thous b/d
- Mexico: 300 thous b/d
- Venezuela: 600 thous b/d
• But strife is an ongoing threat. The current situation in Iraq could exacerbate a trend of crude oil production disruptions since 2008.
- Syria: 350 thous b/d
- Libya: 840 thous b/d
- Algeria: 400 thous b/d
- Sudan: 340 thous b/d
- Iran: 900 thous b/d
- Iraq: 3.1 million b/d 26 Source: BP
2.7
mil
lion
b/d
2.
3 m
illi
on b
/d

Other Factors…
27

Price versus Cost • The oil price and the cost of development tend to move together.
Source: EIA, BEA

The US Dollar • The value of the dollar seems to be important.
– Pre-2001 correlation = 0.08 – Post-2001 correlation = -0.82
Source: FRED, EIA

Study Results A Multivariate Analysis
30

1987m1-2013m1 1987m1-2000m1 2000m1-2013m1 1998m7-2008m7 “Flow” Market 1 CHNdδ ∆ 39.95 11.87 28.08 19.27
2 OthNonOECDdδ ∆ 39.86 4.95 34.90 25.88
9 1ˆ qδ
−∆ -16.05 -7.35 -8.70 -5.84
Net “Flow” 63.76 9.48 54.28 39.30 “Stock” Market
3 Dδ ∆ 20.29 4.68 15.61 21.17
7 , 1
ˆOECDIδ
−∆ -41.66 -13.02 -28.63 -4.87
8 OPECδ ∆ 5.63 3.54 2.09 2.51
Net “Stock” -15.74 -4.80 -10.94 18.82 Other
5δ ε∆ 3.30 -1.88 5.18 7.40
4 cδ ∆ 20.58 0.03 20.55 21.52
i idummyδ --- --- --- 25.48
Net “Other” 23.88 -1.85 25.73 54.39 Predicted Change 71.91 2.83 69.08 112.51 Actual Change 71.94 -1.75 73.69 116.01

Going Forward…
32

What about OPEC? Was the Saudi decision rational?
Dominant firm theory says, “Yes!”
Discuss…
33

Issues affecting US Crude Production…
34

Drivers of a US crude oil discount • Capacity constraints matter. • The margin of substitution is critical to future discounts. • It will be determined by
o current refinery configurations, o the cost and pace of investments in new processing capabilities, o the abundance of domestic light sweet crude oil, and o the ability to trade.
• Current refinery configurations define the opportunity set for crude sales in the short run.
• New investments in processing capabilities, even though they may lead to minimal processing, could be attractive, but o Will policy change going forward? o How certain is the light sweet production outlook? o What is the market for condensates versus crudes internationally? o A CLASSIC INVESTMENT UNDER UNCERTAINTY PARADIGM!

How deep a discount? • Focusing on imports, we first displace similar crudes then move into
heavier ones. As we go deeper, the discount will grow. Pushing into the API 25-30 range will push large discounts, but this is not sustainable.
US Crude Oil Imports by Gravity
Source: US Energy Information Administration

A No Cost Call Option for Refiners? • Refinery X is built to process heavy sour crude from Venezuela and Mexico.
Heavy sour crude is discounted relative to light sweet crude in the international market. So, Refinery X has a choice. It can o (a) import and refine heavy sour, or it can o (b) buy and refine domestic light sweet.
• It only chooses (b), if the LTO price (the substitute) is competitive. This path only occurs if there is no other option for the crude – either through refinery investment or exports. So, the short and long run may be very different.
• The abundance of domestic light sweet crude oil will determine how much investment in new capacity, or trade (or both) is needed. The options, in terms of cost, are not equal, nor are the costs borne the same.
• Notice, Refiner X, through policy, holds what amounts to a call option on domestic crude. If the price of domestic crude rises, perhaps due to exports being allowed, the domestic refiner will choose (a) as that is the least cost path. In other words, it will not exercise the call on domestic crude.
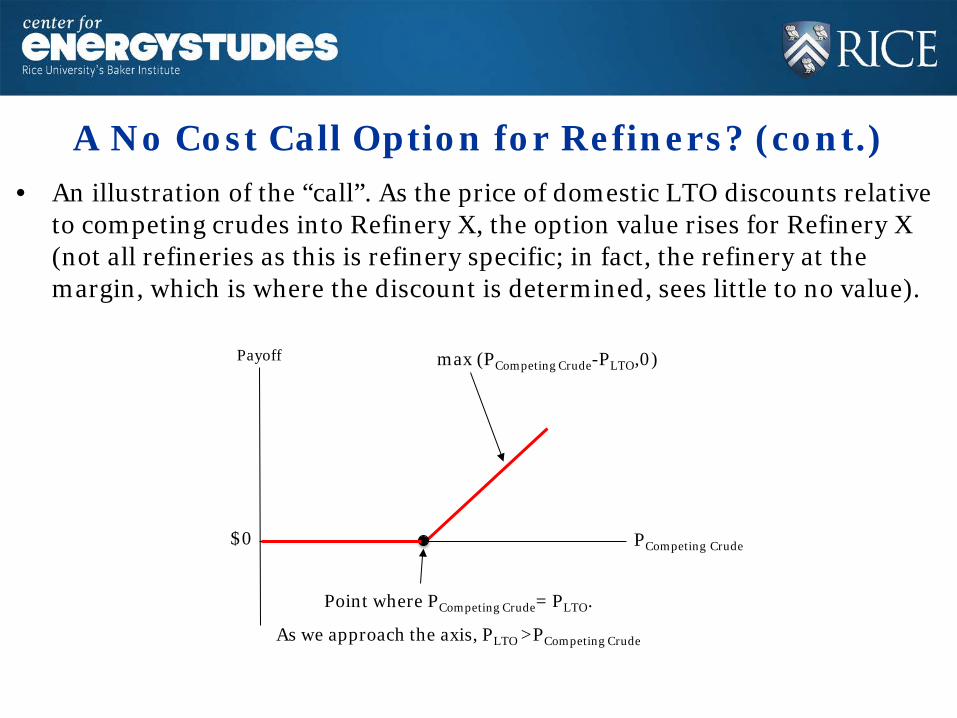
A No Cost Call Option for Refiners? (cont.) • An illustration of the “call”. As the price of domestic LTO discounts relative
to competing crudes into Refinery X, the option value rises for Refinery X (not all refineries as this is refinery specific; in fact, the refinery at the margin, which is where the discount is determined, sees little to no value).
Payoff
PCompeting Crude
max (PCompeting Crude-PLTO,0)
Point where PCompeting Crude= PLTO.
As we approach the axis, PLTO >PCompeting Crude
$0

How deep a discount?
• The price of Brent crude oil matters. But, so does the competitive margin…
LTO should be north of this…