recent advances and validation of gic modelling in … · • getting the size and timing of gic...
TRANSCRIPT

© NERC All rights reserved
Recent advances and validation of GIC modelling in the UK
Gemma Richardson, Ciaran Beggan, Alan Thomson

© NERC All rights reserved
Modelling GIC
Models of geomagnetically induced currents (GIC) require:• Input geomagnetic field• Electric field calculation (including ground
conductivity model)• Estimation of GICs in the network
We have recently been upgrading our network and trying to validate each step in the process

© NERC All rights reserved
Input geomagnetic field• How does distance from
observatory affects GIC estimates?
• Use Spherical Elementary Current Systems (SECS) to interpolate magnetic field
• Compare with using data from individual observatories across the whole grid

© NERC All rights reserved
• Results shown for October 2003 storm
• Observatories within the network, or on the same geomagnetic latitude within 400km gave estimates within 25% on average with correlation >0.8
• More distant observatories become less reliable, for example experiencing max GIC at different times
Input geomagnetic field

© NERC All rights reserved
Electric field calculationMeasurements• We have electric field measurements at the three
UK observatories• 10Hz• Probes ~100m apart in NS and EW directions

© NERC All rights reserved
Electric field calculation
Model• Thin-sheet model• The conductivity model of top 3km based
on UK lithologies and bathymetry• 10km grid

© NERC All rights reserved
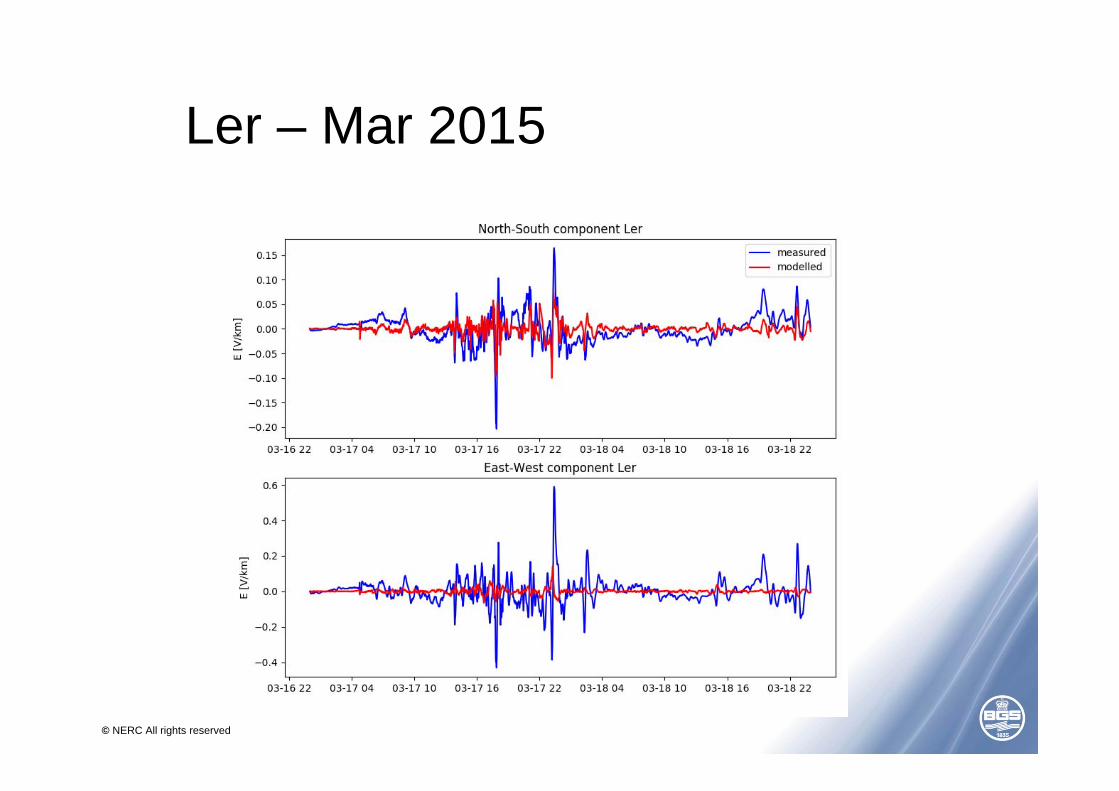
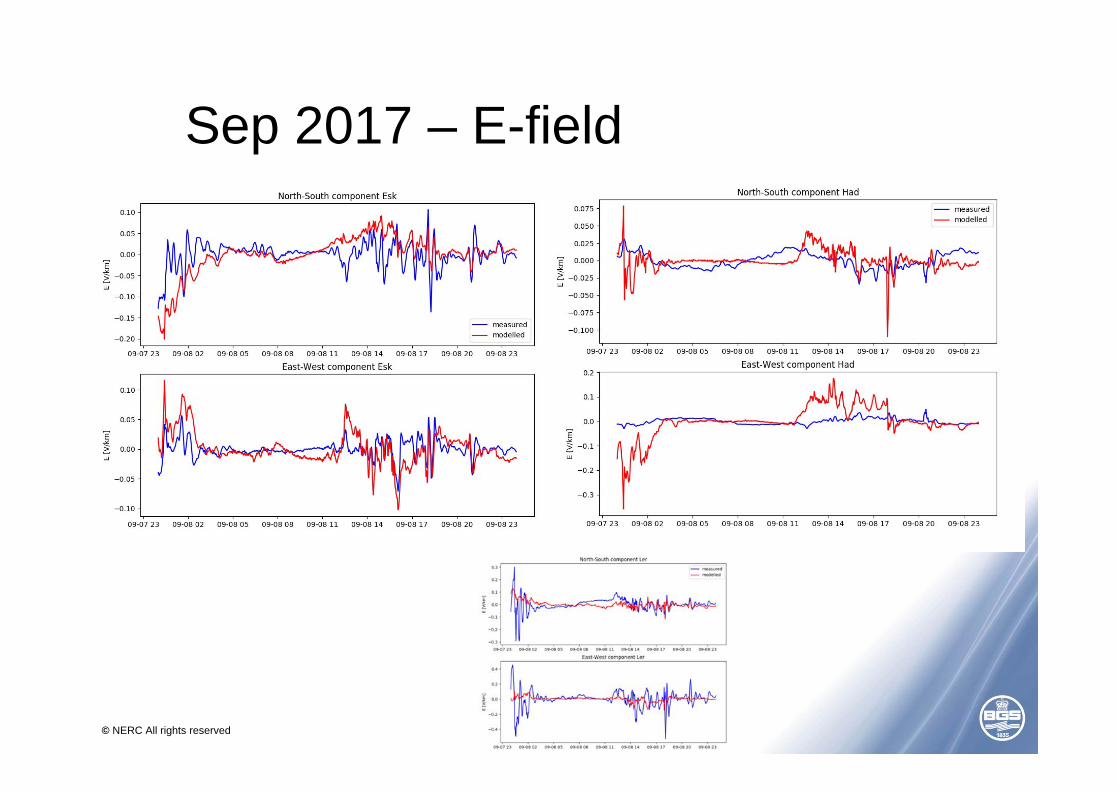
Electric field• Measured (blue) and modelled (red) E at 1 minute resolution
Correlation NS : 0.43EW : 0.43
Correlation NS : 0.04EW : 0.29

© NERC All rights reserved
Electric field
• We need to account for local effects better, e.g. galvanic distortion, tidal signals, local conductivity etc. (see poster 5 – Baillie et al.)
• More storms will help• During the SWIGS project (see Poster 4 – Thomson
et al.) we will measure E-fields at more sites in the UK so we can also test the model away from the observatories

© NERC All rights reserved
GIC calculation• Horton et al 2012 (IEEE Transactions on power delivery, 27)
provides a test grid and calculated GIC for a uniform electric field
• Mix of transformer types, single and parallel connections and blocking devices

© NERC All rights reserved
Comparison• Despite some differences in the method we get results which are
consistent with the Horton paperHorton et al.
(2012)BGS
North East North EastSub1 0.00 0.00 0.00 0.00Sub2 115.63 -189.29 114.25 -189.77Sub3 139.85 -109.49 137.87 -109.79Sub4 19.98 -124.58 19.22 -124.63Sub5 -279.08 -65.46 -280.55 -63.94Sub6 -57.29 354.52 -53.24 353.99Sub7 0.00 0.00 0.00 0.00Sub8 60.90 134.30 62.45 134.14
The root‐mean‐square differences is 2.3 A for the North direction and 0.7 A for the East direction
Per transformer we the difference was <1A per phase for all but 3 transformers and they were all <2A

© NERC All rights reserved
Power network upgrade
• Network upgrade using data from the 2016 Electricity Ten Year Statement
• Better representation of substation nodes
• Better inclusion of parallel lines
© NERC All rights reserved
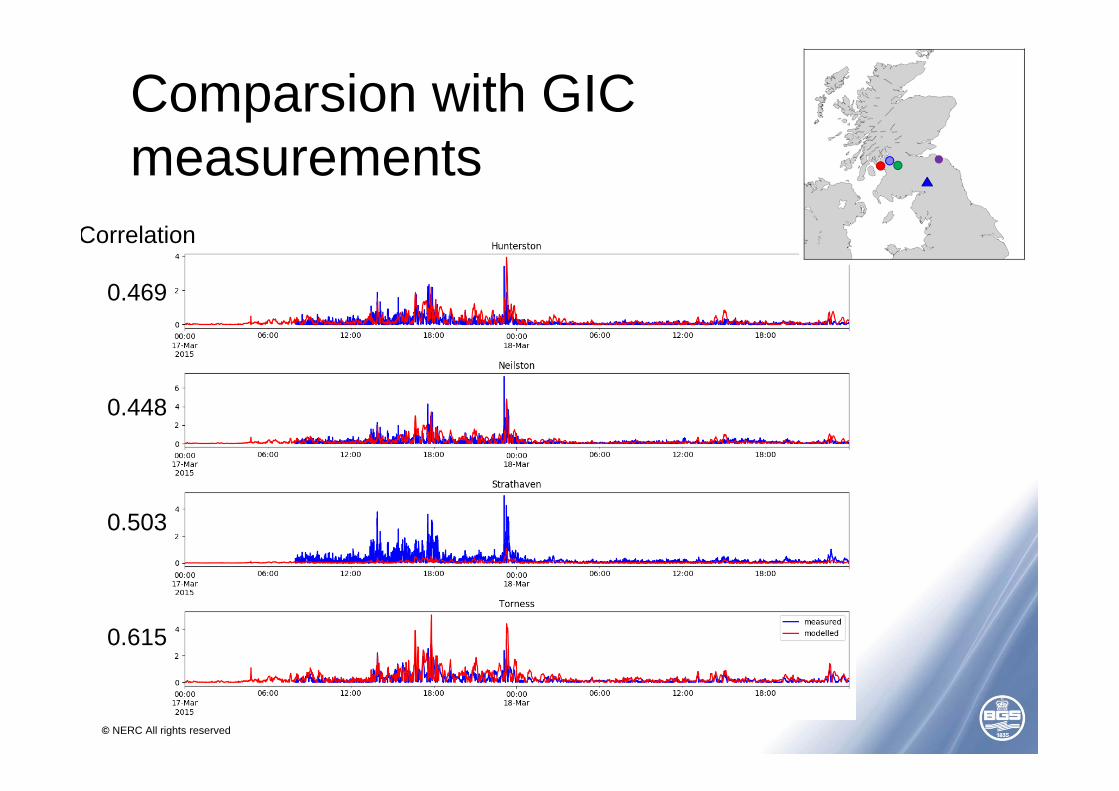
Comparsion with GIC measurements
Correlation
0.469
0.448
0.503
0.615

© NERC All rights reserved
Summary• Electric field
• on a broad scale we capture the storm • need to account for local effects better to truly compare
the model and measured data• Future work will help with validation across the UK
• Validated GIC calculation• Full GIC calculation
• Getting the size and timing of GIC largely correct although these are relatively small GIC measurements
• SWIGS project will really help with validation – providing more measurements of both E and GIC

© NERC All rights reserved
© NERC All rights reserved
Ler – Mar 2015

© NERC All rights reserved
Had - unfiltered
• 0.1406
• 0.0314
© NERC All rights reserved
Sep 2017 – E-field

© NERC All rights reserved
Sep 2017 - GICcorrelation HUNT 0.5343286546782464correlation NEIL 0.1842394052155707correlation STRA 0.438831398654849correlation TORN 0.4891124941799598

© NERC All rights reserved
Mar2015 resampled to 1min means

© NERC All rights reserved