recall index q1 2016 - stericycleexpertsolutions.com · recall index, q1 2016 pork food &...
TRANSCRIPT
RECALL INDEX 2016Q1
stericycleexpertsolutions.comCopyright © 2016 Stericycle. All rights reserved.
2
Recall Index, Q1 2016
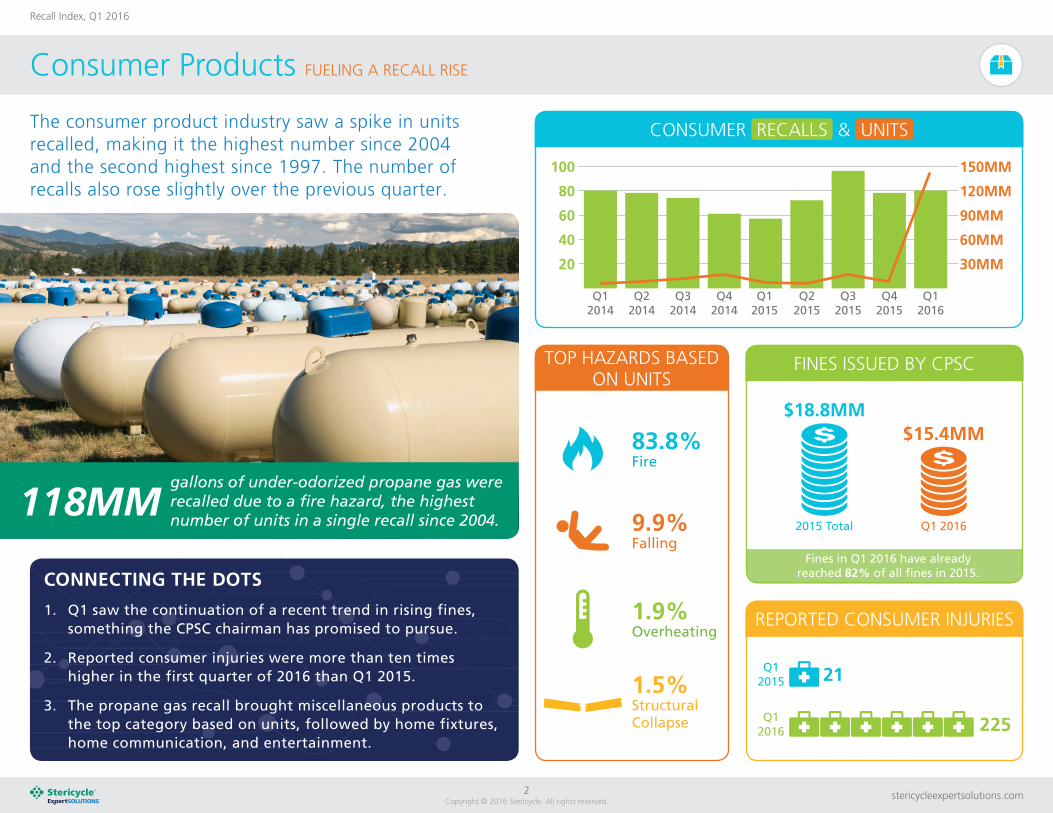
Fines in Q1 2016 have already reached 82% of all fines in 2015.
Consumer Products FUELING A RECALL RISE
The consumer product industry saw a spike in units recalled, making it the highest number since 2004 and the second highest since 1997. The number of recalls also rose slightly over the previous quarter.
CONNECTING THE DOTS
1. Q1 saw the continuation of a recent trend in rising fines, something the CPSC chairman has promised to pursue.
2. Reported consumer injuries were more than ten times higher in the first quarter of 2016 than Q1 2015.
3. The propane gas recall brought miscellaneous products to the top category based on units, followed by home fixtures, home communication, and entertainment.
TOP HAZARDS BASED ON UNITS
150MM
120MM
90MM
60MM
30MM
Q12014
Q22014
Q32014
Q42014
Q12015
Q22015
Q32015
Q42015
Q12016
CONSUMER RECALLS & UNITS
100
80
60
40
20
REPORTED CONSUMER INJURIES
83.8%Fire
9.9%Falling
1.9%Overheating
1.5%Structural Collapse
21Q12015
225Q12016
FINES ISSUED BY CPSC
118MMgallons of under-odorized propane gas were recalled due to a fire hazard, the highest number of units in a single recall since 2004. 2015 Total Q1 2016
$18.8MM$15.4MM

stericycleexpertsolutions.comCopyright © 2016 Stericycle. All rights reserved.
3
Recall Index, Q1 2016
Automotive EQUIPMENT RECALLS INFLATE
NHTSA recalls are down 27% in Q1, while recalled units are up 122%. This represents the third most recalled units in a single quarter.
CONNECTING THE DOTS
1. Due largely to airbag recalls, recalled equipment units have increased to the second highest level in the past four years.
2. The second and third most recalled auto units were seat belts for potential damage during collision and hood locks for failure to latch.
3. Five companies accounted for 72% of recalled VINs.
NHTSA RECALL PRODUCT TYPE BY UNIT PERCENTAGE
5MM airbag units were recalled by an additional airbag supplier, impacting multiple manufacturers.
AUTO RECALL CATEGORIES BASED ON VINS
30025020015010050
60MM50MM40MM30MM20MM10MM
Q12014
Q22014
Q32014
Q42014
Q12015
Q22015
Q32015
Q42015
Q12016
NHTSA RECALLS & UNITS
0.7%Child Seat
51.6%Equipment
47.5%Automobile
0.2%Tire
TOP CAUSES FOR AUTO RECALLS BY QUARTERQ2
2014
Airbags
Q42014
Airbags
Q12015
Airbags
Q22015
Airbags
Q32015
Airbags
Q12016
Airbags
Q32014
ElectricalSystem
Q42015
Visibility
Latches/Locks/Linkages
Seat Belts
Service Brakes, Hydraulic
Other
58.0%Airbags
12.8%
9.8%6.1%
13.3%

stericycleexpertsolutions.comCopyright © 2016 Stericycle. All rights reserved.
4
Recall Index, Q1 2016
Pharmaceuticals MISLABELING MISHAPS
While the number of recalls issued in Q1 2016 remained consistent with the historical average, the number of units affected dropped substantially – to the second lowest quarter in the last decade.
CONNECTING THE DOTS
1. More than half of recalled units were Class III – a change from recent years, when more hazardous Class II recalls were typically the highest percentage.
2. The average recall size in Q1 was 55,000 units, which is a major decline from the historical average of 150,000.
3. In a continued downward trend, only five companies experienced more than one recall in Q1 2016.
OF PHARMACEUTICAL RECALLS WERE NATIONWIDE
53% of recalled units were due to mislabeling.
AVERAGE NUMBER OF UNITS PER RECALL
100
75
50
25
60MM
45MM
30MM
15MM
Q12014
Q22014
Q32014
Q42014
Q12015
Q22015
Q32015
Q42015
Q12016
PHARMACEUTICAL RECALLS & UNITS
77%
OF ALL Q1 2016 UNITS WERE THE RESULT OF A SINGLE RECALL43.6%
THIS RECALL TOTALED 1.4MM UNITS DUE TO MISLABELING
Q1 2016
55,169
2015
177,070
2014 345,291

stericycleexpertsolutions.comCopyright © 2016 Stericycle. All rights reserved.
5
Recall Index, Q1 2016
Medical Device MECHANICAL MALFUNCTION
Both recalled units and number of recalls declined in Q1 2016 to the lowest level since 2013. In fact, these measures dropped roughly 30% from the quarterly average over the last two years.
CONNECTING THE DOTS
1. Less risky Class II situations made up 98% of recalls, but still declined from the 2015 quarterly average.
2. In Q1, no med device company experienced more than ten recalls – a decline from the historical trend of 20 or more in a quarter.
3. The two largest recalls made up more than half of the total recalled units, both due to machine failure.
3/4of the largest recalls reported in Q1 were due to machine failure, making it the top cause of recalled units.
350
280
210
140
70
100MM
80MM
60MM
40MM
20MM
Q12014
Q22014
Q32014
Q42014
Q12015
Q22015
Q32015
Q42015
Q12016
MED DEVICE RECALLS & UNITS
TOP MED DEVICE RECALL CAUSES BASED ON UNITS
CLASS II UNITS RECALLED BY QUARTER
OF MED DEVICE RECALLS WERE NATIONWIDE
58%
62.6%MachineFailure
10.2%Quality
Issue
9.9%Sterility
Issue
7.1%Calibration
Error
3.9%Software
Q1 2016
9.6MM
Q4 2015
47.1MM
Q3 2015 69.6MM

stericycleexpertsolutions.comCopyright © 2016 Stericycle. All rights reserved.
6
Recall Index, Q1 2016
Pork
Food & Beverage RECIPE FOR CONCERN
After major food recalls in 2015, including the cumin spice recall that had a ripple effect across the industry, both the number of recalls and the number of reported units affected dropped substantially in Q1.
CONNECTING THE DOTS
1. Foreign materials became the top cause for FDA food unit recalls in Q1. In 2015, the leading cause was undeclared allergens.
2. The same categories continue to experience the greatest impact from recalls: prepared foods, baked goods, and fruits and vegetables.
3. Beef was the top recalled USDA product, making up nearly 68% of total pounds recalled in Q1.
IMPACT OF A SINGLE PRODUCE RECALL
Due to a 6 month listeria outbreak
49% of FDA food units were recalled due to foreign materials, including glass, metal, and plastic.
200 50.0MM
150 37.5MM
100 25.0MM
50 12.5MM
Q12014
Q22014
Q32014
Q42014
Q12015
Q22015
Q32015
Q42015
Q12016
24StatesAffected
6BrandsAffected
19ReportedIllnesses
TOP USDA CATEGORIES BASED ON POUNDS
67.6%
28.6%
3.8%
Beef
Chicken
TOP FDA FOOD
CATEGORY BASED ON
UNITS
27.5%Prepared
Foods
25.2%BakedGoods
13.1%Vegetables
12.1%Beverages
FDA FOOD RECALLS & UNITS

7Copyright © 2016 Stericycle. All rights reserved.
stericycleexpertsolutions.com
A Class I recall, according to the FDA, is a situation in which there is a reasonable probability that the product will cause serious adverse health consequences or death. A Class II recall is a situation in which the product could cause temporary or medically reversible adverse health consequences or where the probability of serious adverse health conse-quences is remote. The FDA defines a Class III recall as a situation in which the product is not likely to cause adverse health consequences.
Stericycle ExpertSOLUTIONS & the Recall Index Explained
Stericycle ExpertSOLUTIONS helps partners minimize risk to the public and to their company brand by executing and planning for product recalls efficiently, effectively, and compliantly. Each quarter, we analyze cumulative recall data across six product categories. This helps our partners navigate the regulatory environment and identify trends.
How the Stericycle Recall Index is Compiled
The Stericycle Recall Index gathers and tracks cumulative data from the four primary federal agencies that oversee recalls in the United States: the Consumer Product Safety Commission (CPSC), the Food and Drug Administration (FDA), the Food Safety and Inspection Service (FSIS) of the United States Department of Agriculture (USDA), and the National Highway Traffic Safety Administration (NHTSA).
FDA Data
To track trends in food, pharmaceutical, and medical device recalls, the Stericycle Recall Index uses information publicly available in news releases posted on the FDA website. For additional insight into recalls governed by the FDA, Stericycle collects and analyzes data from the agency’s weekly enforcement reports, which provide additional details including recall class, quantity of units affected, and number of reported incidents.
CPSC Data
For further insight into consumer product recall trends, Stericycle analyzes data from CPSC recall announcements. When compiling statistics and analyzing trends for consumer product recalls, the Stericycle Recall Index uses standard product categories and hazards recognized by the CPSC.
USDA Data
For additional insight into food recall trends involving meat, poultry, and egg products, the Stericycle Recall Index collects and analyzes data from recall announcements posted on the USDA’s FSIS website. Statistics and trends are compiled using standard product categories, classifications, and reasons for recalls as recognized by the USDA.
NHTSA Data
To understand trends in the automotive industry, the Stericycle Recall Index analyzes data from NHTSA reports on recalls of autos, child seats, equipment, and tires.
Terminology
Announced recalls represent those recalls documented in news releases published on agency websites. Enforced recalls refer to those recalls documented in weekly FDA enforcement reports that are summarized based on the FDA assigned Event ID. Their documentation can lag behind announced recalls by weeks or even months because the recall process may take time to complete.