rebgv stats package, january 2015 stats package, january 2015...sales of detached properties in...
TRANSCRIPT

News Release FOR IMMEDIATE RELEASE: Home buyers remain active despite reduced selection VANCOUVER, B.C. – February 3, 2015 – The first month of 2015 saw home sale activity above historical norms, while the number of homes listed for sale trended below typical levels. The Real Estate Board of Greater Vancouver (REBGV) reports that residential property sales in Greater Vancouver reached 1,913 on the Multiple Listing Service® (MLS®) in January 2015. This represents an 8.7 per cent increase compared to the 1,760 sales recorded in January 2014, and a 9.6 per cent decline compared to the 2,116 sales in December 2014. Last month’s sales were 14.9 per cent above the 10-year sales average for the month. “While demand remains steady, we’re seeing fewer homes for sale at the moment,” Ray Harris, REBGV president, said. "This is creating greater competition amongst buyers, particularly in the detached home market. The number of detached homes listed for sale today is the second lowest we’ve seen in four years.” New listings for detached, attached and apartment properties in Metro Vancouver1 totalled 4,737 in January. This represents an 11.4 per cent decline compared to the 5,345 new listings reported in January 2014. Last month’s new listing count was 1.2 per cent higher than the region’s 10-year new listing average for the month. The total number of properties currently listed for sale on the REBGV MLS® is 10,811, a 14.2 per cent decline compared to January 2014 and a 4.8 per cent increase compared to December 2014. The MLS® Home Price Index composite benchmark price for all residential properties in Metro Vancouver is currently $641,60022. This represents a 5.5 per cent increase compared to January 2014. With the sales-to-active-listings ratio at 17.7 per cent, the region remains in balanced market territory. “The Bank of Canada’s recent announcement to lower its benchmark interest rate is an important one for home buyers, sellers and owners to note,” Harris said. “A reduced rate could allow you to pay down your mortgage a little faster, save some money on your monthly payments, or change the amount you qualify for. It’s important that you do your homework and understand how these announcements impact your situation.” Sales of detached properties in January 2015 reached 781, an increase of 7.3 per cent from the 728 detached sales recorded in January 2014, and a 44.1 per cent increase from the 542 units sold in January 2013. The benchmark price for a detached property in Metro Vancouver increased 8.4 per cent from January 2014 to $1,010,000. Sales of apartment properties reached 809 in January 2015, an increase of 7.4 per cent compared to the 753 sales in January 2014, and an increase of 40.5 per cent compared to the 576 sales in January 2013. The benchmark price of an apartment property increased 2.5 per cent from January 2014 to $382,800.

Attached property sales in January 2015 totalled 323, an increase of 15.8 per cent compared to the 279 sales in January 2014, and a 38.6 per cent increase from the 233 attached properties sold in January 2013. The benchmark price of an attached unit increased 4.3 per cent between January 2014 and 2015 to $479,600.
Editor’s Notes:
1.) Areas covered by Real Estate Board of Greater Vancouver include: Whistler, Sunshine Coast, Squamish, West Vancouver, North Vancouver, Vancouver, Burnaby, New Westminster, Richmond, Port Moody, Port Coquitlam, Coquitlam, New Westminster, Pitt Meadows, Maple Ridge, and South Delta.
2.) The national MLS® Home Price Index (MLS® HPI) operations group underwent an annual review of the model in January. This led to the following changes:
• Neighbourhoods where home sales over the past three years totaled 12 or less have been removed from the model. Neighbourhoods where sales have increased to 20 or more over the past three years have been added. Historical MLS® HPI data has been recalculated to reflect these changes.
• The benchmark property descriptions have been updated to reflect current buying trends.
Background: MLS® HPI benchmark prices represent the value of a ‘typical’ property within a market. When the HPI was developed in 2011, a composite description was created for every neighbourhood and property type based on MLS® sales data for that specific area. What people typically purchase can change over time due to changes in affordability and buyer preferences. Therefore, it’s necessary for these descriptions to be occasionally updated.
The MLS® HPI methodology has been updated to reflect these changes and is available at http://homepriceindex.ca/hpi_tool_en.html
-30-
The real estate industry is a key economic driver in British Columbia. In 2014, in the Real Estate Board of Greater Vancouver area, a total of 33,116 homes sold on the MLS® generating $2.136 billion in economic activity and an estimated 16,227 jobs .The total dollar value of
residential sales transacted through the MLS® system in Metro Vancouver totalled $27.3 billion in 2014. The Real Estate Board of Greater
Vancouver is an association representing more than 11,500 REALTORS® and their companies. The Board provides a variety of member
services, including the Multiple Listing Service®. For more information on real estate, statistics, and buying or selling a home, contact a local
REALTOR® or visit www.rebgv.org.
For more information contact:
Craig Munn Manager, Communication Real Estate Board of Greater Vancouver 604.730.3146 [email protected]

Property Type AreaBenchmark
PricePrice Index
1 Month Change %
3 Month Change %
6 Month Change %
1 Year Change %
3 Year Change %
5 Year Change %
Residential / Composite Lower Mainland $569,300 160.5 0.2% 0.2% 1.3% 4.5% 5.2% 11.5%
Greater Vancouver $641,600 167.9 0.2% 0.5% 1.9% 5.5% 6.1% 14.1%
Bowen Island $580,700 125.9 -1.5% -1.3% -2.3% 3.1% 3.1% -4.7%
Burnaby East $588,700 162.5 -1.4% -1.7% -1.5% 3.4% 5.8% 10.3%
Burnaby North $539,700 162.2 -0.6% 0.0% 0.1% 4.9% 5.1% 11.2%
Burnaby South $603,500 170.6 -0.3% 0.8% 2.2% 4.8% 6.8% 16.1%
Coquitlam $541,500 160.2 0.9% 0.6% 3.4% 5.7% 10.9% 13.4%
Ladner $560,800 156.0 0.1% 0.5% 2.8% 7.7% 5.5% 11.9%
Maple Ridge $397,800 134.4 0.4% 1.1% 1.7% 3.7% 1.9% 0.4%
New Westminster $380,800 162.2 0.2% -0.8% 0.5% 3.1% 5.5% 9.8%
North Vancouver $697,600 157.4 0.6% 1.2% 2.9% 7.0% 9.0% 13.6%
Pitt Meadows $403,100 147.5 0.8% 1.6% 2.1% 2.1% 8.5% 6.9%
Port Coquitlam $414,300 146.8 -0.6% -0.1% 1.7% 3.2% 3.2% 2.6%
Port Moody $547,500 151.4 0.4% 0.5% 2.2% 7.2% 12.8% 10.1%
Richmond $599,800 173.8 0.3% 0.7% 1.0% 5.3% 1.5% 13.3%
Squamish $414,300 135.0 -0.5% -1.2% 1.7% 6.6% 12.2% 7.8%
Sunshine Coast $353,100 123.7 0.2% -0.6% -0.9% 4.7% -1.8% -6.9%
Tsawwassen $625,100 156.6 -1.4% 0.1% 1.9% 6.4% 7.6% 13.9%
Vancouver East $665,100 194.8 0.7% 1.4% 2.9% 7.6% 12.7% 24.6%
Vancouver West $869,300 183.2 0.1% 0.2% 2.2% 5.9% 6.9% 19.0%
West Vancouver $1,725,800 185.2 3.1% 2.4% 1.0% 8.1% 13.8% 31.8%
Whistler $480,300 111.6 -1.9% -1.8% 2.5% 3.4% 5.4% -4.8%
Single Family Detached Lower Mainland $812,700 172.6 0.3% 0.7% 2.0% 6.7% 7.9% 21.1%
Greater Vancouver $1,010,000 186.3 0.5% 1.3% 2.8% 8.4% 8.4% 26.0%
Bowen Island $580,700 125.9 -1.5% -1.3% -2.3% 3.1% 3.1% -4.7%
Burnaby East $769,600 172.1 -2.3% -3.2% -2.8% 3.4% 5.6% 16.1%
Burnaby North $1,004,700 194.3 0.1% 1.1% 2.2% 8.5% 10.3% 30.4%
Burnaby South $1,049,500 200.9 -0.4% 0.0% 2.6% 7.8% 11.0% 36.7%
Coquitlam $778,100 172.4 0.9% 1.5% 3.6% 7.4% 14.5% 22.2%
Ladner $658,900 159.0 0.1% 1.2% 4.2% 10.1% 7.9% 14.4%
Maple Ridge $480,500 136.9 0.6% 0.9% 1.6% 5.6% 4.3% 3.3%
New Westminster $677,200 168.0 -2.7% -3.5% -2.0% 3.0% 2.4% 14.1%
North Vancouver $1,047,800 166.8 0.3% 0.5% 3.5% 10.2% 11.1% 21.2%
Pitt Meadows $526,000 148.3 0.7% 0.3% 2.0% 6.6% 5.0% 6.1%
Port Coquitlam $588,200 156.9 0.5% 0.4% 2.4% 4.6% 7.9% 11.2%
Port Moody $922,700 170.4 0.7% 1.7% 2.7% 7.2% 16.4% 21.9%
Richmond $1,031,100 206.8 0.4% 2.1% 3.8% 10.3% 3.1% 29.3%
Squamish $543,700 144.5 0.0% -0.6% -0.5% 7.5% 5.7% 13.3%
Sunshine Coast $350,800 122.9 0.0% -0.8% -0.9% 4.5% -2.3% -7.5%
Tsawwassen $760,300 163.7 -1.6% 0.5% 2.6% 7.8% 10.8% 19.5%
Vancouver East $974,500 215.4 0.5% 2.2% 4.7% 12.2% 18.4% 40.7%
Vancouver West $2,351,300 241.4 1.0% 1.9% 3.3% 9.6% 8.9% 42.3%
West Vancouver $2,060,600 195.9 2.8% 2.0% 0.8% 8.4% 15.1% 37.9%
Whistler $943,500 130.6 -1.4% 0.7% -1.1% 3.9% 5.4% 4.6%
HOW TO READ THE TABLE:
• Benchmark Price: Estimated sale price of a benchmark property. Benchmarks represent a typical property within each market.
• Price Index: Index numbers estimate the percentage change in price on typical and constant quality properties over time. All figures are based on past sales.
• x Month/Year Change %: Percentage change of index over a period of x month(s)/year(s) *
In January 2005, the indexes are set to 100.
Townhome properties are similar to Attached properties, a category that was used in the previous MLSLink HPI, but do not included duplexes.
The above info is deemed reliable, but is not guaranteed. All dollar amounts in CDN.
January 2015*
* MLS®, Multiple Listing Service®, and all related graphics are trademarks of The Canadian Real Estate Association 1 of 12

Property Type AreaBenchmark
PricePrice Index
1 Month Change %
3 Month Change %
6 Month Change %
1 Year Change %
3 Year Change %
5 Year Change %
January 2015*
Townhouse Lower Mainland $399,200 144.5 0.1% -0.8% 0.1% 2.0% 1.6% 3.9%
Greater Vancouver $479,600 155.0 0.2% -0.4% 1.0% 4.3% 4.7% 8.5%
Burnaby East $426,900 153.1 -0.2% -0.3% -0.4% 1.3% 4.0% 6.2%
Burnaby North $405,700 151.3 -0.6% -1.2% -1.8% 2.2% -2.2% 6.1%
Burnaby South $418,900 150.3 -2.1% 1.3% -1.8% 2.7% -0.5% 5.2%
Coquitlam $394,100 144.8 -1.2% -2.2% 2.6% 4.2% 5.5% 4.1%
Ladner $463,900 153.7 1.3% -0.5% 0.8% 4.7% 3.4% 9.0%
Maple Ridge $281,000 136.5 0.7% 3.2% 5.4% 6.1% 2.1% -0.4%
New Westminster $415,000 155.9 -0.1% -1.0% 0.1% 4.8% 9.4% 12.9%
North Vancouver $606,700 145.2 0.6% -0.7% 0.8% 3.9% 3.0% 6.2%
Pitt Meadows $346,900 150.1 4.7% 5.5% 6.5% 7.1% 11.4% 8.5%
Port Coquitlam $376,800 142.9 -0.3% -2.3% 0.1% -0.3% 0.7% -0.3%
Port Moody $426,400 144.1 -0.9% -1.3% 3.0% 7.9% 7.5% 4.4%
Richmond $519,700 168.0 0.8% 0.5% 0.8% 3.6% 3.6% 12.7%
Squamish $345,500 125.4 -3.9% -4.6% -3.0% -0.9% 29.0% 0.9%
Tsawwassen $449,000 148.4 1.5% 0.2% 1.6% 5.2% -2.0% 6.2%
Vancouver East $545,100 179.7 2.9% -0.6% 3.6% 5.2% 9.1% 16.3%
Vancouver West $758,600 171.6 0.4% -1.2% 0.0% 10.2% 13.5% 18.0%
Whistler $474,200 126.8 -3.4% -3.1% -2.2% -0.3% 16.9% 8.2%
Apartment Lower Mainland $345,400 150.8 -0.1% -0.1% 0.6% 1.9% 2.5% 2.0%
Greater Vancouver $382,800 153.9 0.0% 0.1% 1.1% 2.5% 3.7% 4.0%
Burnaby East $412,600 156.6 -1.7% -0.4% -0.3% 4.6% 14.6% 2.6%
Burnaby North $344,500 145.6 -1.3% -0.7% -1.4% 2.9% 4.3% 0.6%
Burnaby South $397,000 159.4 0.1% 1.3% 2.7% 2.9% 6.1% 7.6%
Coquitlam $264,900 145.8 1.7% 0.1% 3.6% 2.5% 5.8% 2.3%
Ladner $309,300 146.6 -1.4% -1.5% -0.5% 1.9% -0.5% 5.4%
Maple Ridge $165,100 119.2 -1.3% -0.2% -3.2% -10.0% -10.0% -11.8%
New Westminster $282,400 160.8 1.5% 0.2% 1.5% 2.7% 6.2% 7.8%
North Vancouver $363,200 147.8 1.1% 3.1% 2.8% 3.1% 7.1% 5.5%
Pitt Meadows $245,500 145.1 -1.4% 0.5% -0.4% -4.9% 13.2% 8.0%
Port Coquitlam $230,400 136.6 -2.6% 1.5% 2.5% 4.6% -0.9% -6.2%
Port Moody $337,200 140.5 1.0% 0.6% 0.4% 5.6% 11.7% 3.5%
Richmond $343,600 145.1 -0.2% -1.2% -3.0% -0.5% -3.1% -3.7%
Squamish $263,900 127.1 3.7% 1.4% 23.4% 18.6% 14.9% 4.0%
Tsawwassen $319,000 134.5 -1.5% -1.5% -1.2% 1.1% -1.9% -3.3%
Vancouver East $316,300 174.5 0.3% 1.0% 0.5% 2.6% 6.9% 7.9%
Vancouver West $497,100 160.9 -0.6% -0.7% 1.7% 3.1% 4.5% 7.5%
West Vancouver $641,700 140.2 3.9% 4.6% 2.1% 8.6% 6.4% 4.5%
Whistler $253,200 83.0 1.1% -1.2% 21.0% 18.9% 7.8% -26.3%
HOW TO READ THE TABLE:
• Benchmark Price: Estimated sale price of a benchmark property. Benchmarks represent a typical property within each market.
• Price Index: Index numbers estimate the percentage change in price on typical and constant quality properties over time. All figures are based on past sales.
• x Month/Year Change %: Percentage change of index over a period of x month(s)/year(s)
In January 2005, the indexes are set to 100. *
Townhome properties are similar to attached properties, a category that was used in the previous MLSLink HPI, but do not included duplexes.
Lower Mainland includes areas serviced by both Real Estate Board of Greater Vancouver & Fraser Valley Real Estate Board.
The above info is deemed reliable, but is not guaranteed. All dollar amounts in CDN.
* MLS®, Multiple Listing Service®, and all related graphics are trademarks of The Canadian Real Estate Association 2 of 12
C:\D
ATA
\Mon
thE
nd\H
pi\e
xpor
t\hi_
res\
gv-h
pi2.
tifG
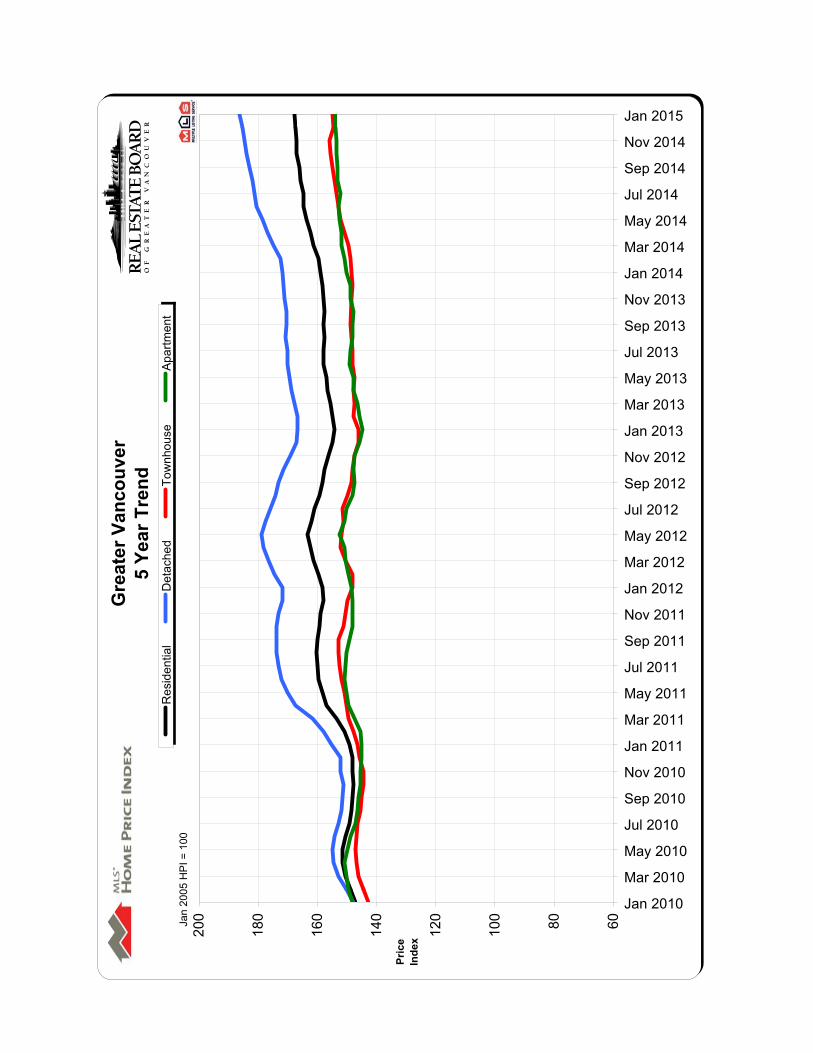
reat
er V
anco
uver
5
Year
Tre
nd
6080100
120
140
160
180
200
Jan 2010
Mar 2010
May 2010
Jul 2010
Sep 2010
Nov 2010
Jan 2011
Mar 2011
May 2011
Jul 2011
Sep 2011
Nov 2011
Jan 2012
Mar 2012
May 2012
Jul 2012
Sep 2012
Nov 2012
Jan 2013
Mar 2013
May 2013
Jul 2013
Sep 2013
Nov 2013
Jan 2014
Mar 2014
May 2014
Jul 2014
Sep 2014
Nov 2014
Jan 2015
Pric
e In
dex
Res
iden
tial
Det
ache
dTo
wnh
ouse
Apa
rtmen
tJa
n 20
05 H
PI =
100

122
2015
MLS
® S
ALE
S Fa
cts
Burnaby
Coquitlam
Delta - South
Islands - Gulf
Maple Ridge/Pitt Meadows
New Westminster
North Vancouver
Port Coquitlam
Port Moody/Belcarra
Richmond
Squamish
Sunshine Coast
Vancouver East
Vancouver West
West Vancouver/Howe SoundWhistler/Pemberton
Detached
8655
312
7916
6822
11118
935
95100
477
781
Attached
5328
30
219
2223
766
93
2136
418
323
Apartment
104
5311
022
5857
2013
102
114
95230
722
809
Detached
$1,075,400
$801,000
$785,000
n/a
$475,000
n/a
$1,210,000
$587,550
n/a
$1,090,000
n/a
$358,500
$1,081,000
$2,450,050
$2,050,000
n/a
Attached
$430,000
$387,450
n/a
n/a
$299,899
n/a
$679,000
$397,750
n/a
$549,000
n/a
n/a
$607,000
$750,900
n/a
n/a
n/a
Apartment
$359,000
$265,000
n/a
n/a
$215,500
$275,950
$392,000
$241,700
n/a
$339,500
n/a
n/a
$330,000
$498,000
n/a
$269,500
Detached
104
7032
185
1264
2416
107
1446
9899
5110
833
Attached
5037
90
256
2819
977
172
3043
514
371
Apartment
111
5914
029
5259
2315
115
65
132
270
913
912
Detached
$1,146,429
$850,000
$708,900
n/a
$501,250
n/a
$1,350,000
$599,000
n/a
$1,050,000
n/a
$373,134
$1,034,044
$2,657,500
$2,133,800
n/a
Attached
$539,250
$474,900
n/a
n/a
$304,900
n/a
$734,250
n/a
n/a
$541,800
n/a
n/a
$725,500
$899,900
n/a
n/a
n/a
Apartment
$362,500
$314,800
n/a
n/a
$244,000
$278,000
$351,500
$232,250
n/a
$343,500
n/a
n/a
$317,450
$467,500
n/a
n/a
Detached
6171
293
5717
5322
9114
1428
80117
449
728
Attached
4123
00
1610
1915
1061
74
2929
312
279
Apartment
106
4510
025
4748
1417
8910
562
244
1219
753
Detached
$980,000
$742,500
$753,500
n/a
$491,000
n/a
$1,142,500
$593,500
n/a
$988,000
n/a
$366,500
$920,000
$2,380,000
$1,796,500
n/a
Attached
$450,000
$449,950
n/a
n/a
n/a
n/a
n/a
n/a
n/a
$548,000
n/a
n/a
$665,000
$825,000
n/a
n/a
n/a
Apartment
$380,400
$309,496
n/a
n/a
$240,000
$304,250
$378,000
n/a
n/a
$349,000
n/a
n/a
$316,500
$475,000
n/a
n/a
Detached
8655
312
7916
6822
11118
935
95100
477
781
Attached
5328
30
219
2223
766
93
2136
418
323
Apartment
104
5311
022
5857
2013
102
114
95230
722
809
Detached
$1,075,400
$801,000
$785,000
n/a
$475,000
n/a
$1,210,000
$587,550
n/a
$1,090,000
n/a
$358,500
$1,081,000
$2,450,050
$2,050,000
n/a
Attached
$430,000
$387,450
n/a
n/a
$299,899
n/a
$679,000
$397,750
n/a
$549,000
n/a
n/a
$607,000
$750,900
n/a
n/a
n/a
Apartment
$359,000
$265,000
n/a
n/a
$215,500
$275,950
$392,000
$241,700
n/a
$339,500
n/a
n/a
$330,000
$498,000
n/a
$269,500
Detached
6171
293
5717
5322
9114
1428
80117
449
728
Attached
4123
00
1610
1915
1061
74
2929
312
279
Apartment
106
4510
025
4748
1417
8910
562
244
1219
753
Detached
$980,000
$742,500
$753,500
n/a
$491,000
n/a
$1,142,500
$593,500
n/a
$988,000
n/a
$366,500
$920,000
$2,380,000
$1,796,500
n/a
Attached
$450,000
$449,950
n/a
n/a
n/a
n/a
n/a
n/a
n/a
$548,000
n/a
n/a
$665,000
$825,000
n/a
n/a
n/a
Apartment
$380,400
$309,496
n/a
n/a
$240,000
$304,250
$378,000
n/a
n/a
$349,000
n/a
n/a
$316,500
$475,000
n/a
n/a
Not
e: M
edia
n Se
lling
Pric
es a
re n
ot re
port
ed fo
r are
as w
ith le
ss th
an 2
0 sa
les
or f
or th
e G
ulf I
slan
ds
Num
ber
ofSa
les
Janu
ary
2015
Num
ber
ofSa
les
Med
ian
Selli
ngPr
ice
Num
ber
ofSa
les
Med
ian
Selli
ngPr
ice
Num
ber
ofSa
les
Med
ian
Selli
ngPr
ice
Dec
embe
r20
14
Janu
ary
2014
Jan.
-Ja
n. 2
015
Jan.
-Ja
n. 2
014
Med
ian
Selli
ngPr
ice
Num
ber
ofSa
les
Med
ian
Selli
ngPr
ice
Janu
ary
2015
Year-to-date
Year-to-date

122
2015
MLS
® L
ISTI
NG
S Fa
cts
Burnaby
Coquitlam
Delta - South
Islands - Gulf
Maple Ridge/Pitt Meadows
New Westminster
North Vancouver
Port Coquitlam
Port Moody/Belcarra
Richmond
Squamish
Sunshine Coast
Vancouver East
Vancouver West
West Vancouver/Howe SoundWhistler/Pemberton
Detached
188
147
647
148
25151
4732
273
2081
168
278
192
101,831
Attached
9354
91
8021
6321
11135
197
3997
916
675
Apartment
288
147
350
54180
152
7432
326
188
230
621
3828
2,231
Detached
46%
37%
48%
29%
53%
64%
45%
47%
34%
43%
45%
43%
57%
36%
24%
70%
Attached
57%
52%
33%
0%26%
43%
35%
110%
64%
49%
47%
43%
54%
37%
44%
113%
n/a
Apartment
36%
36%
31%
n/a
41%
32%
38%
27%
41%
31%
61%
50%
41%
37%
18%
79%
Detached
5064
272
6514
4520
12122
922
71100
4822
693
Attached
3423
10
205
2315
963
1311
1839
713
294
Apartment
9467
130
2073
6216
10127
33
134
227
1240
901
Detached
208%
109%
119%
50%
131%
86%
142%
120%
133%
88%
156%
209%
138%
99%
106%
45%
Attached
147%
161%
900%
n/a
125%
120%
122%
127%
100%
122%
131%
18%
167%
110%
71%
108%
n/a
Apartment
118%
88%
108%
n/a
145%
71%
95%
144%
150%
91%
200%
167%
99%
119%
75%
33%
Detached
212
166
957
164
39151
5330
344
57107
182
407
190
222,226
Attached
103
579
095
1255
3324
146
159
80112
1231
793
Apartment
255
186
320
71140
196
7840
278
198
222
721
3941
2,326
Detached
29%
43%
31%
43%
35%
44%
35%
42%
30%
33%
25%
26%
44%
29%
23%
41%
Attached
40%
40%
0%n/a
17%
83%
35%
45%
42%
42%
47%
44%
36%
26%
25%
39%
n/a
Apartment
42%
24%
31%
n/a
35%
34%
24%
18%
43%
32%
53%
63%
28%
34%
31%
46%
Detached
188
147
647
148
25151
4732
273
2081
168
278
192
101,831
Attached
9354
91
8021
6321
11135
197
3997
916
675
Apartment
288
147
350
54180
152
7432
326
188
230
621
3828
2,231
Detached
46%
37%
48%
29%
53%
64%
45%
47%
34%
43%
45%
43%
57%
36%
24%
70%
Attached
57%
52%
33%
0%26%
43%
35%
110%
64%
49%
47%
43%
54%
37%
44%
113%
n/a
Apartment
36%
36%
31%
n/a
41%
32%
38%
27%
41%
31%
61%
50%
41%
37%
18%
79%
Detached
212
166
957
164
39151
5330
344
57107
182
407
190
222,226
Attached
103
579
095
1255
3324
146
159
80112
1231
793
Apartment
255
186
320
71140
196
7840
278
198
222
721
3941
2,326
Detached
29%
43%
31%
43%
35%
44%
35%
42%
30%
33%
25%
26%
44%
29%
23%
41%
Attached
40%
40%
0%n/a
17%
83%
35%
45%
42%
42%
47%
44%
36%
26%
25%
39%
n/a
Apartment
42%
24%
31%
n/a
35%
34%
24%
18%
43%
32%
53%
63%
28%
34%
31%
46%
* Yea
r-to
-dat
e lis
tings
repr
esen
t a c
umul
ativ
e to
tal o
f lis
tings
rath
er th
an to
tal a
ctiv
e lis
tings
.
% S
ales
to
List
ings
Num
ber
ofLi
stin
gs
% S
ales
to
List
ings
Dec
embe
r20
14
Janu
ary
2014
Jan.
-Ja
n. 2
015
Jan.
-Ja
n. 2
014
% S
ales
to
List
ings
Num
ber
ofLi
stin
gs
% S
ales
to
List
ings
Num
ber
ofLi
stin
gs
Janu
ary
2015
Num
ber
ofLi
stin
gs
% S
ales
to
List
ings
Num
ber
ofLi
stin
gs
Janu
ary
2015
Year-to-date*
Year-to-date*

Listing & Sales Activity Summary
Listings Sales1 2 3 Col. 2 & 3 5 6 7 Col. 6 & 7 9 10 Col. 9 & 10
Jan Dec Jan Percentage Jan Dec Jan Percentage Nov 2013 - Nov 2014 - Percentage2014 2014 2015 Variance 2014 2014 2015 Variance Jan 2014 Jan 2015 Variance
BURNABY % % %DETACHED 212 50 188 276.0 61 104 86 -17.3 226 276 22.1ATTACHED 103 34 93 173.5 41 50 53 6.0 146 164 12.3APARTMENTS 255 94 288 206.4 106 111 104 -6.3 348 343 -1.4
COQUITLAMDETACHED 166 64 147 129.7 71 70 55 -21.4 220 231 5.0ATTACHED 57 23 54 134.8 23 37 28 -24.3 89 104 16.9APARTMENTS 186 67 147 119.4 45 59 53 -10.2 161 168 4.3
DELTADETACHED 95 27 64 137.0 29 32 31 -3.1 85 112 31.8ATTACHED 9 1 9 800.0 0 9 3 -66.7 13 18 38.5APARTMENTS 32 13 35 169.2 10 14 11 -21.4 23 36 56.5
MAPLE RIDGE/PITT MEADOWSDETACHED 164 65 148 127.7 57 85 79 -7.1 204 286 40.2ATTACHED 95 20 80 300.0 16 25 21 -16.0 84 83 -1.2APARTMENTS 71 20 54 170.0 25 29 22 -24.1 113 88 -22.1
NORTH VANCOUVERDETACHED 151 45 151 235.6 53 64 68 6.3 194 206 6.2ATTACHED 55 23 63 173.9 19 28 22 -21.4 62 89 43.5APARTMENTS 196 62 152 145.2 48 59 57 -3.4 194 192 -1.0
NEW WESTMINSTERDETACHED 39 14 25 78.6 17 12 16 33.3 51 52 2.0ATTACHED 12 5 21 320.0 10 6 9 50.0 26 28 7.7APARTMENTS 140 73 180 146.6 47 52 58 11.5 148 178 20.3
PORT MOODY/BELCARRADETACHED 30 12 32 166.7 9 16 11 -31.3 44 44 0.0ATTACHED 24 9 11 22.2 10 9 7 -22.2 44 33 -25.0APARTMENTS 40 10 32 220.0 17 15 13 -13.3 55 42 -23.6
PORT COQUITLAMDETACHED 53 20 47 135.0 22 24 22 -8.3 76 74 -2.6ATTACHED 33 15 21 40.0 15 19 23 21.1 51 76 49.0APARTMENTS 78 16 74 362.5 14 23 20 -13.0 60 79 31.7
RICHMONDDETACHED 344 122 273 123.8 114 107 118 10.3 312 354 13.5ATTACHED 146 63 135 114.3 61 77 66 -14.3 185 216 16.8APARTMENTS 278 127 326 156.7 89 115 102 -11.3 304 343 12.8
SUNSHINE COASTDETACHED 107 22 81 268.2 28 46 35 -23.9 78 119 52.6ATTACHED 9 11 7 -36.4 4 2 3 50.0 12 10 -16.7APARTMENTS 8 3 8 166.7 5 5 4 -20.0 14 14 0.0
SQUAMISHDETACHED 57 9 20 122.2 14 14 9 -35.7 30 41 36.7ATTACHED 15 13 19 46.2 7 17 9 -47.1 36 44 22.2APARTMENTS 19 3 18 500.0 10 6 11 83.3 17 24 41.2
VANCOUVER EASTDETACHED 182 71 168 136.6 80 98 95 -3.1 306 315 2.9ATTACHED 80 18 39 116.7 29 30 21 -30.0 107 96 -10.3APARTMENTS 222 134 230 71.6 62 132 95 -28.0 271 344 26.9
VANCOUVER WESTDETACHED 407 100 278 178.0 117 99 100 1.0 368 316 -14.1ATTACHED 112 39 97 148.7 29 43 36 -16.3 119 122 2.5APARTMENTS 721 227 621 173.6 244 270 230 -14.8 782 832 6.4
WHISTLER/PEMBERTONDETACHED 22 22 10 -54.5 9 10 7 -30.0 42 27 -35.7ATTACHED 31 13 16 23.1 12 14 18 28.6 57 51 -10.5APARTMENTS 41 40 28 -30.0 19 13 22 69.2 50 63 26.0
WEST VANCOUVER/HOWE SOUNDDETACHED 190 48 192 300.0 44 51 47 -7.8 173 163 -5.8ATTACHED 12 7 9 28.6 3 5 4 -20.0 15 12 -20.0APARTMENTS 39 12 38 216.7 12 9 7 -22.2 32 27 -15.6
GRAND TOTALSDETACHED 2219 691 1824 164.0 725 832 779 -6.4 2409 2616 8.6ATTACHED 793 294 674 129.3 279 371 323 -12.9 1046 1146 9.6APARTMENTS 2326 901 2231 147.6 753 912 809 -11.3 2572 2773 7.8

Res
iden
tial A
vera
ge S
ale
Pric
es -
Jan
uary
197
7 to
Jan
uary
201
5
0
200
400
600
800
1000
1200
1400
1600
1977
1978
1979
1980
1981
1982
1983
1984
1985
1986
1987
1988
1989
1990
1991
1992
1993
1994
1995
1996
1997
1998
1999
2000
2001
2002
2003
2004
2005
2006
2007
2008
2009
2010
2011
2012
2013
2014
2015
DE
TAC
HE
DC
ON
DO
MIN
IUM
A
TTA
CH
ED
AP
AR
TME
NTS
IN T
HO
US
AN
DS
($)
NO
TE:
From
197
7 - 1
984
cond
omin
ium
ave
rage
s w
ere
not s
epar
ated
into
atta
ched
& a
partm
ent.
$566
,893
$468
,872
$1,3
03,2
56