reasons why: emerging market debt - aberdeen asset · reasons why: emerging market debt june 2017 1...
TRANSCRIPT
Reasons why series – Page 1 of 5
Reasons why: Emerging market debtJune 2017
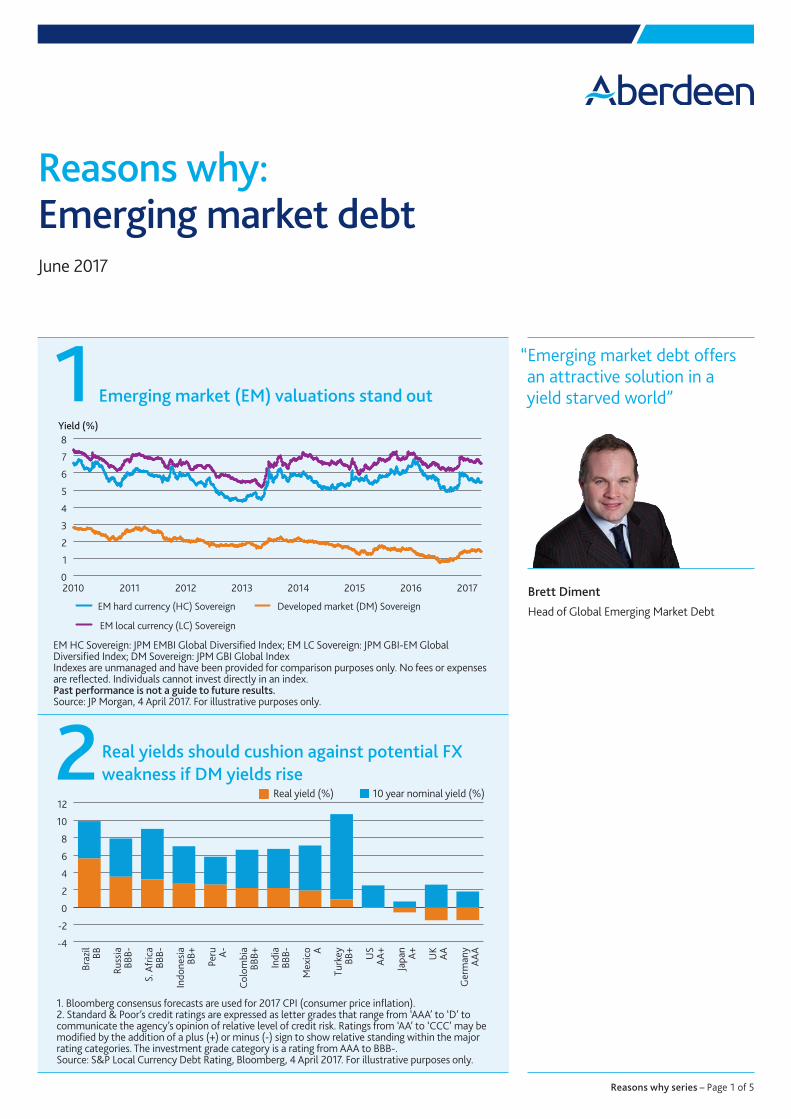
Emerging market (EM) valuations stand out 1
2
Brett DimentHead of Global Emerging Market Debt
“Emerging market debt offers an attractive solution in a yield starved world”
1. Bloomberg consensus forecasts are used for 2017 CPI (consumer price inflation). 2. Standard & Poor’s credit ratings are expressed as letter grades that range from ‘AAA’ to ‘D’ to communicate the agency’s opinion of relative level of credit risk. Ratings from ‘AA’ to ‘CCC’ may be modified by the addition of a plus (+) or minus (-) sign to show relative standing within the major rating categories. The investment grade category is a rating from AAA to BBB-. Source: S&P Local Currency Debt Rating, Bloomberg, 4 April 2017. For illustrative purposes only.
Real yields should cushion against potential FX weakness if DM yields rise
Yield (%)
EM hard currency (HC) Sovereign Developed market (DM) Sovereign
EM local currency (LC) Sovereign
0
1
2
3
4
5
6
7
8
20172016201520142013201220112010
EM HC Sovereign: JPM EMBI Global Diversified Index; EM LC Sovereign: JPM GBI-EM Global Diversified Index; DM Sovereign: JPM GBI Global Index Indexes are unmanaged and have been provided for comparison purposes only. No fees or expenses are reflected. Individuals cannot invest directly in an index. Past performance is not a guide to future results. Source: JP Morgan, 4 April 2017. For illustrative purposes only.
-4
-2
0
2
4
6
8
10
12
Ger
man
yAA
A
UK
AA
Japa
nA+U
SAA
+
Turk
eyBB
+
Mex
ico A
Indi
a B
BB-
Colo
mbi
aBB
B+
Peru A-
Indo
nesi
aBB
+
S. A
fric
aBB
B-
Russ
iaBB
B-
Braz
ilBB
10 year nominal bond yield (%) Real yield (%)
Real yield (%) 10 year nominal yield (%)

4Emerging market resources
• Combined emerging market debt and equity expertise
• Local presence, with over 80 EM investment professionals worldwide
• Over US$90bn in EM assets, with US$11bn in EMD
• Over 80 countries and 1,000 companies researched
Source: Aberdeen Asset Management, 31 March 2017.
Exceptional depth and breadth
Reasons why series – Page 2 of 5
Our investment process• We focus on the entire EM debt universe
to maximise the return potential and minimise risk.
• We conduct comprehensive country research, set in the context of global economic developments, which forms the foundation of our investment process.
• We look at factors such as:• Key macroeconomic variables• The political environment• Fiscal and monetary policy
developments and major risk.• This is coupled with analysis of technical
market indicators such as:• The nature of instruments• Relative value• Liquidity• Demand and supply imbalances.
Budapest
SingaporeJakarta
Hong KongBangkok
London
São Paulo
Kuala Lumpur
Sydney
There has been an improvement in EM currency valuations 3
70
75
80
85
90
95
100
105
Jan 16Jan 13Jan 10Jan 07Jan 04Jan 01Jan 98Jan 95
Average real effective exchange rate in EM (ex-China, 2010=100)
Past performance is not a guide to future results. For illustrative purposes only. Source: Citigroup, BIS (Bank for International Settlements), 31 December 2016. GDP weighted index of 14 emerging market countries. Note: EMFX (emerging market foreign exchange rate)
• The correction in EM currencies is similar to the correction seen during the Asia crisis when EM currencies generally changed from fixed to floating exchange rates
5China is of far greater importance for commodities than the US• China is the world’s largest consumer for many commodities, and its consumption dwarves that of the USA.
Copper Coal Aluminium
China 50%US 8%Rest of world 42%
China 50%US 10%Rest of world 40%
Nickel Iron ore Zinc
Source: BP Statistical Review, World Steel Association, China Customs, Bloomberg, January 2017.
China 48%US 9%Rest of world 43%
China 47%US 2%Rest of world 51%
China 47%US 7%Rest of world 46%
China 54%US 9%Rest of world 37%

Reasons why series – Page 3 of 5
The investment team
Asian Fixed IncomeEMD Sovereign
Kevin Daly (28) (L)Viktor Szabó (16) (L)Andrew Stanners (16) (L)Anthony Simond (8) (L)Patty Cao (5) (L)Imre Tajti (14) (B)
Kenneth Akintewe (16) (S)Leong Lin Jing (7) (S)Edmund Goh (7) (KL)Lee Jin Yang (5) (S)Pongtharin Sapayanon (14) (BK)Suhardi Tanujaya (22) (J)
Thomas Drissner (14) (S)Jeremy Teng (10) (S)Carol Yuan (10) (SY)Henry Loh (3) (S)Mohammad Hasif (6) (KL)Tai Li-Yian (3) (KL)Wendy Tjandra (18) (J)
Max Wolman (17) (L)Paul Lukaszewski (16) (L)Kathy Collins (9) (L)Samuel Bevan (5) (L)Henrique Morato (3) (L)Chalermrat Panjawatanakul (3) (BK)
Adam McCabe (16) (S)Head of Asian Fixed Income
Edwin Gutierrez (21) (L)Head of EMD Sovereign
Siddharth Dahiya (11) (L)Head of EMD Corporate
EMD Corporate
Sovereign Corporate
Brett Diment (25) (L)Head of Global EMD
Specialised Resources
Portfolio AnalystsNeil Clayton (12) (L)May Hoang (8) (L)
QuantEcho Yang (9) (S)
Yulong Wang (1) (L)
DealersAndrew Ng (10) (S)
Abel Koh (5) (S)Russell Beer (15) (L)
Restructuring & Insolvency
Cecely Hugh (10) (L)
Product SpecialistsKaren Bater (32) (P)
Helen Winter (20) (L)
Experienced, stable team with a broad range of specialist skillsGlobal interaction:
• Team-based, formal weekly portfolio review and six-weekly strategy meetings
• Regular meetings with EM equity, global macro and US fixed income teams(-) denotes years industry experience. L= London, B = Budapest, S = Singapore, KL = Kuala Lumpur, BK = Bangkok, J = Jakarta, SY = Sydney Source: Aberdeen Asset Management, 31 March 2017.
Key features and benefits• Established, well-resourced, stable team with deep experience
• Recognised emerging markets specialist in both debt and equity
• Long established network across emerging market countries
• Exploiting opportunities through extensive research in both mainstream and frontier emerging markets
• Size ensures investment flexibility
39dedicated EM
debt investment professionals
Over 80 countries covered
in depth
Over 300 companies actively
covered
Over 50country visits every
year
ESGanalysis on all issuers
covered

Reasons why series – Page 4 of 5
Research tripsWe undertake on-the-ground proprietary research to assess the underlying creditworthiness of the companies in which we invest. We always meet the management of the companies we invest in and keep in regular contact, which helps us build good long term relationships and gives us access to the company even in times of stress. Meeting management and making site visits also gives us a better idea of the drivers of the business and helps us understand their corporate culture. Some of the research trips we have done recently include the destinations below.
Peru – Lima
Russia – MoscowBrazil – Rio de Janeiro Turkey – Istanbul
India – Delhi
Chile – Santiago
Nigeria – Lagos
Indonesia – Jakarta
Thailand – Bangkok
Bangladesh – Dhaka
Hungary – Budapest China – Shanghai
Malaysia – Kuala Lumpur
Argentina – Buenos Aires
Azerbaijan - Baku
China – Shenzhen

Reasons why series – Page 5 of 5
Bloomberg data are for illustrative purposes only. No assumptions regarding future performance should be made. Important information: This document is not an advertisement and does not constitute or form part of any offer or solicitation to issue, sell, subscribe or purchase any investment nor shall it or the fact of its distribution form the basis of or be relied on in connection with, any contract for the same. The contents in this document are for information, illustration or discussion purposes only and should not be construed as a recommendation to buy or sell any investment product and do not purport to represent or warrant the outcome of any investment product, strategy program or product. Reference to individual companies or any securities or funds is purely for the purpose of illustration only and is not and should not be construed as a recommendation to buy or sell, or advice in relation to investment, legal or tax matters.Any research or analysis used to derive, or in relation to, the above information has been procured by Aberdeen Asset Management Asia Limited (“Aberdeen Asia”) for its own use, without taking into account the investment objectives, financial situation or particular needs of any specific investor, and may have been acted on for Aberdeen Asia’s own purpose.Aberdeen Asia does not warrant the accuracy, adequacy or completeness of the information herein and expressly disclaims liability for any errors or omissions. The information is given on a general basis without obligation and on the understanding that any person acting upon or in reliance on it, does so entirely at his or her own risk. Past performance is not indicative of future performance. Any projections or other forward-looking statements regarding future events or performance of countries, markets or companies are not necessarily indicative of, and may differ from, actual events or results. Aberdeen Asia reserves the right to make changes and corrections to the information, including any opinions or forecasts expressed herein at any time, without notice. No reliance may be placed for any purpose on the information and opinions contained in this document or their accuracy or completeness.This document may not be reproduced in any form without the express permission of Aberdeen Asia and to the extent it is passed on, care must be taken to ensure that this reproduction is in a form that accurately reflects the information presented here.Aberdeen Asset Management Asia Limited, Registration Number 199105448E.SG-140617-34384-1