realistic or utopian? coordinating transit and land use to achieve equitable transit-oriented...
TRANSCRIPT
ECONorthwest)'3231-'7�����*-2%2')�����40%22-2+
Ian Carlton November 18, 2016
Realistic or Utopian? Coordinating Transit and Land Use to Achieve
Equitable Transit-Oriented Development
MAPCRAFT.io
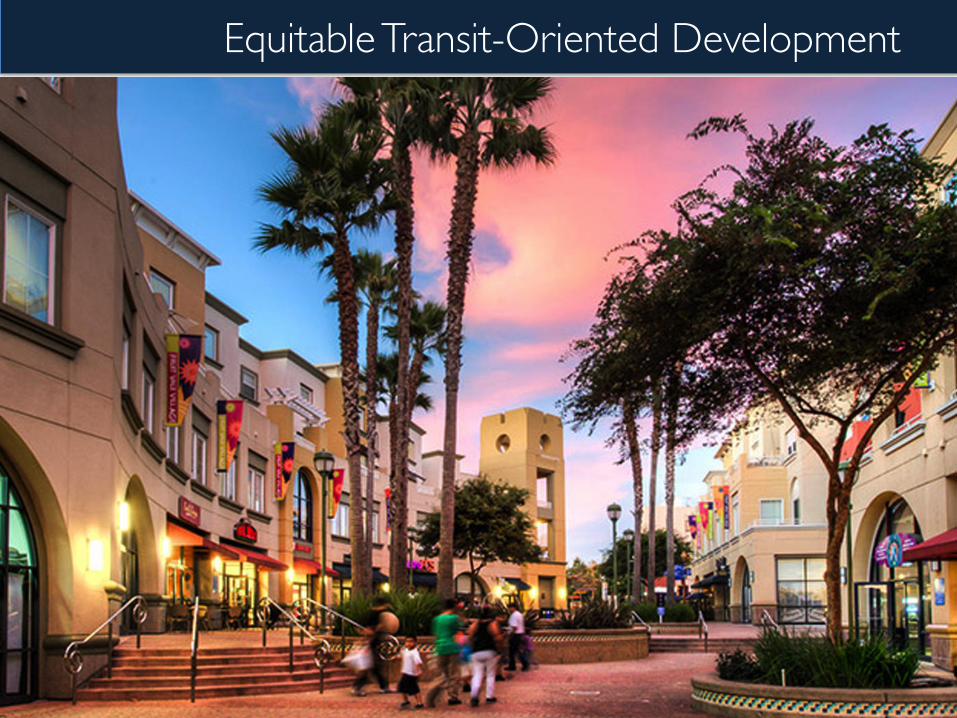
Equitable Transit-Oriented Development

Today’s messages
1. Market does not deliver TOD where we want it, let alone complicated E-‐TOD
2. Ineffec?ve to deliver E-‐TOD within our predominant market-‐based system
3. Could modified/new real estate development ins?tu?ons deliver E-‐TOD?
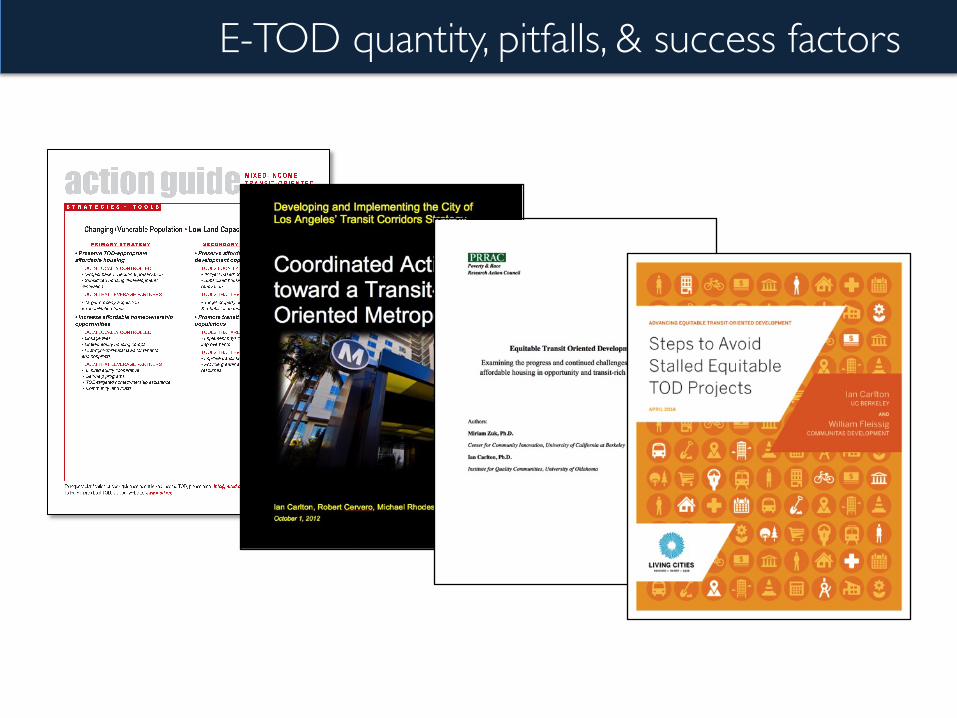
E-TOD quantity, pitfalls, & success factors
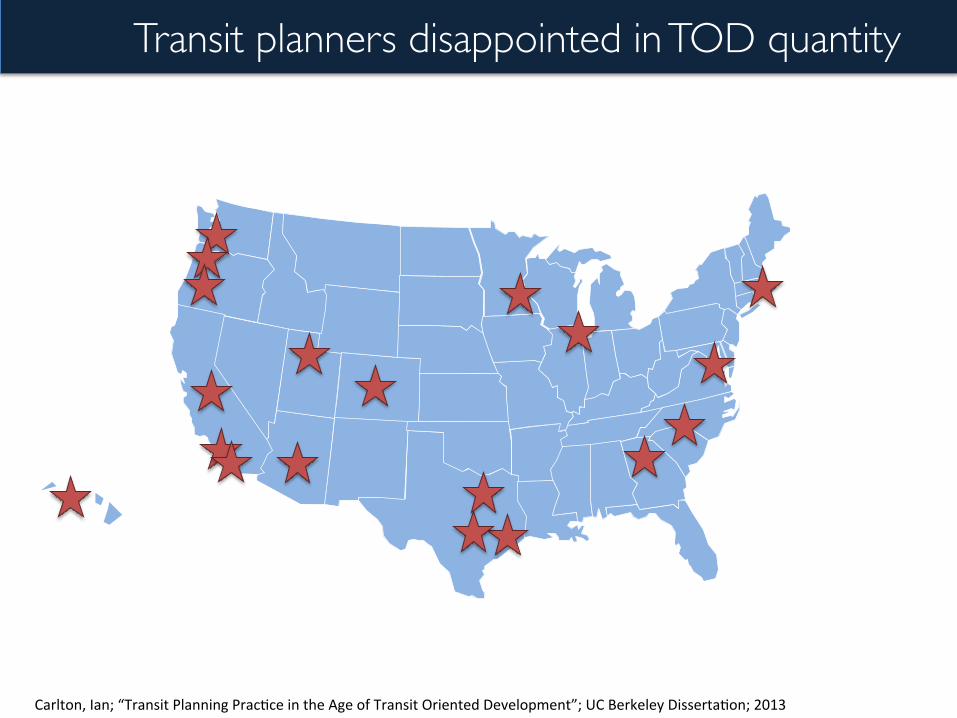
Transit planners disappointed in TOD quantity
Carlton, Ian; “Transit Planning Prac?ce in the Age of Transit Oriented Development”; UC Berkeley Disserta?on; 2013
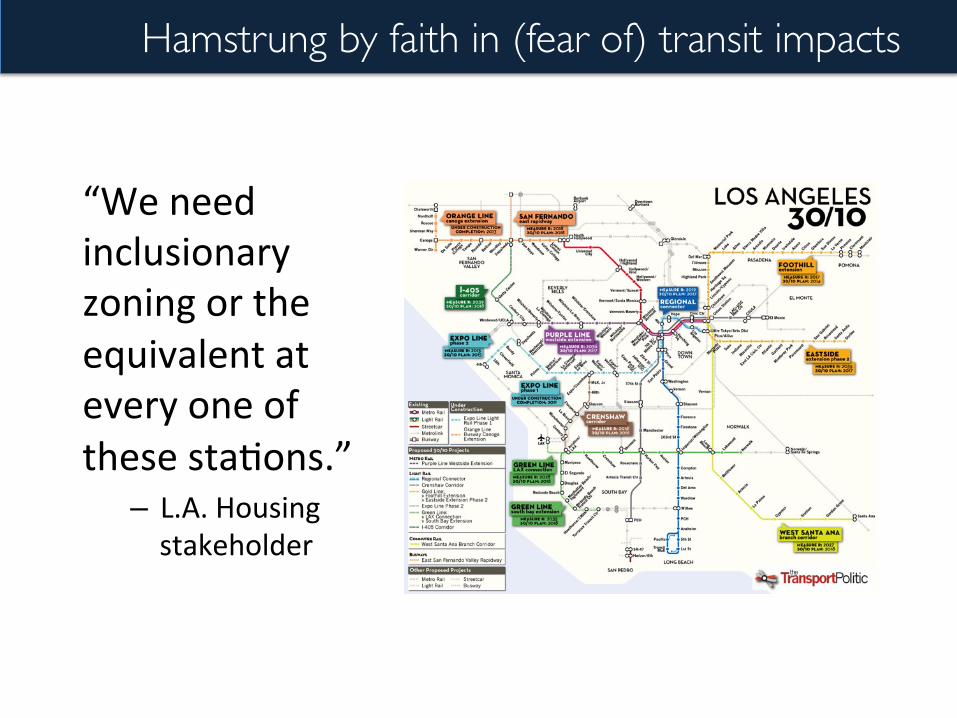
Hamstrung by faith in (fear of) transit impacts
“We need inclusionary zoning or the equivalent at every one of these sta?ons.” – L.A. Housing stakeholder

Proximity to transit sta4ons can impact prices and land values
– e.g., Chatman et al., 2012; Duncan, 2011; Rodriguez and Mojica, 2009; Hess and Almeida, 2007; Cervero and Duncan, 2002; Strand and Vågnes, 2001; Lewis-‐Workman and Brod, 1997; Cervero and Landis, 1997; Benjamin and Sirmans, 1996; Bajic, 1983
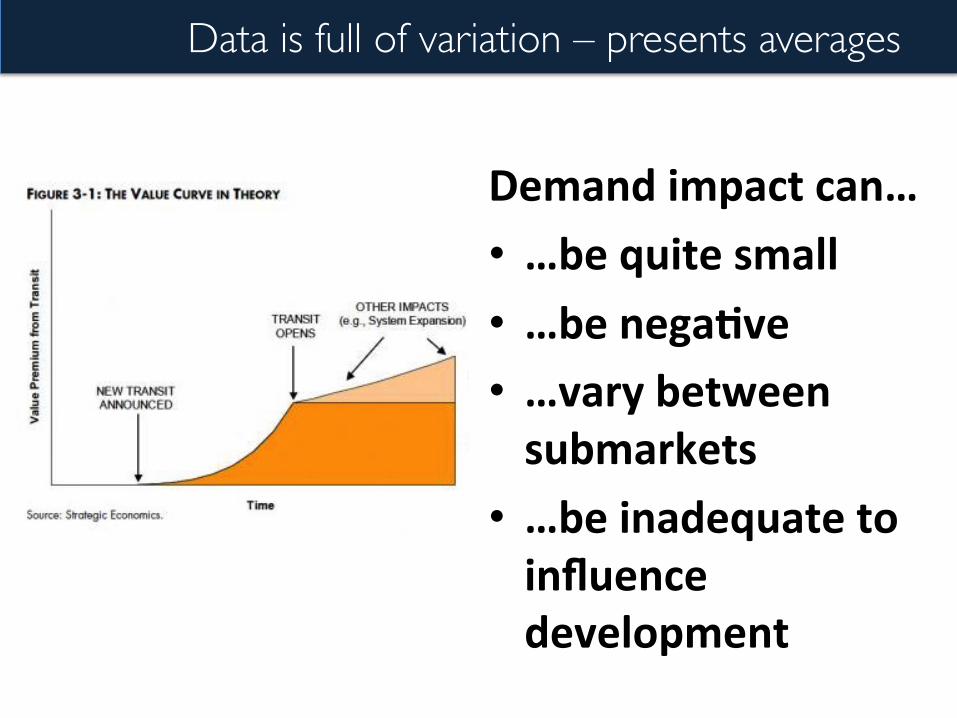
Data is full of variation – presents averages
Demand impact can… • …be quite small • …be nega4ve • …vary between submarkets • …be inadequate to influence development
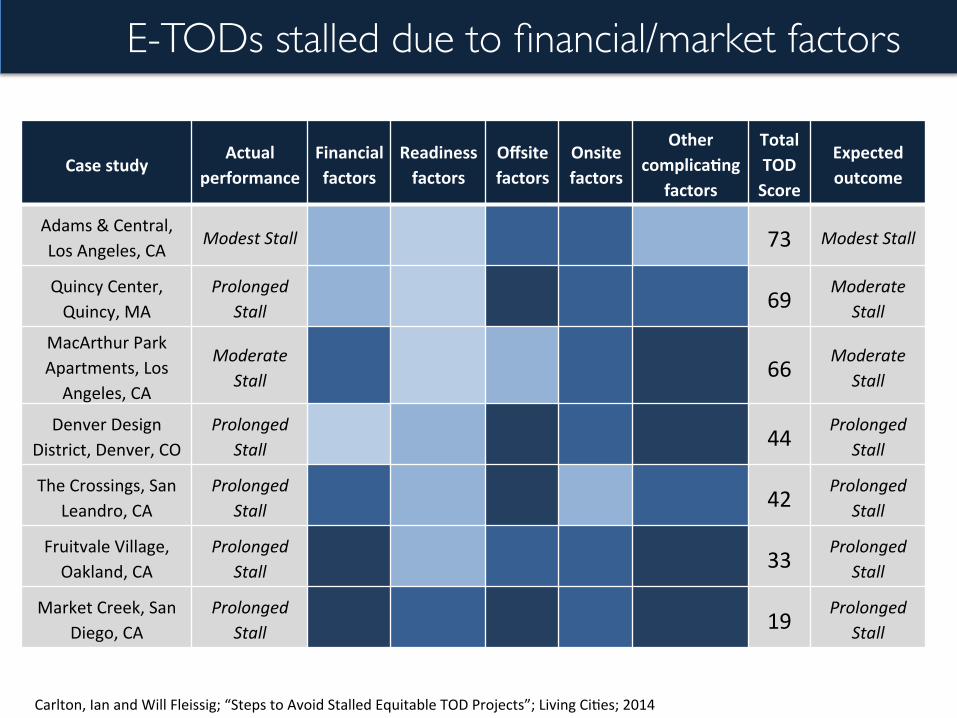
E-TODs stalled due to financial/market factors
Case study Actual performance
Financial factors
Readiness factors
Offsite factors
Onsite factors
Other complica4ng
factors
Total TOD Score
Expected outcome
Adams & Central, Los Angeles, CA Modest Stall 73 Modest Stall
Quincy Center, Quincy, MA
Prolonged Stall 69
Moderate Stall
MacArthur Park Apartments, Los Angeles, CA
Moderate Stall 66
Moderate Stall
Denver Design District, Denver, CO
Prolonged Stall 44
Prolonged Stall
The Crossings, San Leandro, CA
Prolonged Stall 42
Prolonged Stall
Fruitvale Village, Oakland, CA
Prolonged Stall 33
Prolonged Stall
Market Creek, San Diego, CA
Prolonged Stall 19
Prolonged Stall
Carlton, Ian and Will Fleissig; “Steps to Avoid Stalled Equitable TOD Projects”; Living Ci?es; 2014

Markets matter to E-TOD success
Avalon Bay’s project in Walnut Creek, CA includes 20% affordable housing, public parks, ground floor retail, structured parking. The development relied on TIF proceeds and a complex site procurement contract with the Bay Area Rapid Transit District.
McCormack Baron Salazar’s project at MacArthur Park in Los Angeles, CA includes 90 affordable apartments, ground floor retail, and commuter parking stalls for transit patrons. The development relied on 10 different financial sources, including several that par?ally funded the construc?on of retail space that was not supported by market rents.
Image source: Avalon Bay, MBS

Hamstrung by erroneous view of real estate
“If we could just get the locals to zone TODs right, the developers would make a killing and pour into our market.” – Minneapolis transit planning stakeholder

“In our work we were repeatedly struck by the extreme lack of communica4on and mutual understanding between transit planners and private-‐sector real estate interests. […] Research into the tools and decision-‐making processes within the real estate market would provide a valuable resource for planners.”
– Knight and Trygg, 1977 p. 207

Understanding the Economics of Development
Public Policy
Market
Capital
Land Development Can Occur
Rent and Construc?on Cost Fixed
Waterfall Capital is mobile
Highest and Best Use

Net Cash Flow Distributions (“Waterfall”)
Internal Rate of Return %
8
12
15
18
Ini?al Return Tranche
Second Return Tranche
Third Return Tranche
Underwri?ng Target
100%
60%
25%
40%
75%
Investor Developer

Residual Land Value
RLV = Developer Maximum Land Budget Given a set of capital, construc?on, opera?ng costs, and revenue assump?ons
$

-‐$300
-‐$200
-‐$100
$0
$100
$200
$300
$400
$500
$600
$2.50 $3.00 $3.50 $4.00 Rent per Square Foot
Residual Land Values
Stacked Flats
Residential Tower
Tower
4 over 1
Stacked Flat
4 over 1 (podium)
Residual Land Value by Construc?on Prototype
RLV = $ per gross square foot of land

Housing Development Feasibility
Stacked flatsDoesn't pencilInsufficient data
Financially feasible building typesif the land value is $0
4 over 1Stacked flatsDoesn't pencilInsufficient data
Financially feasible building typesif the land value is $0
Residential tower4 over 1Stacked flatsDoesn't pencilInsufficient data
Financially feasible building typesif the land value is $0
Stacked Flats
4 over 1 (podium)
Residential Tower

-‐$300
-‐$200
-‐$100
$0
$100
$200
$300
$400
$500
$600
$2.50 $3.00 $3.50 $4.00 Rent per Square Foot
Residual Land Value
Stacked Flats
Residential Tower
Tower
4 over 1
Stacked Flat
4 over 1 (podium)
Residual Land Value by Construc?on Prototype
RLV = $ per gross square foot of land

What about E-TOD?
Stacked flatsDoesn't pencilInsufficient data
Financially feasible building typesif the land value is $0
4 over 1Stacked flatsDoesn't pencilInsufficient data
Financially feasible building typesif the land value is $0
Residential tower4 over 1Stacked flatsDoesn't pencilInsufficient data
Financially feasible building typesif the land value is $0
Stacked Flats
4 over 1 (podium)
Residential Tower
-‐$300
-‐$200
-‐$100
$0
$100
$200
$300
$400
$500
$600
$2.50 $3.00 $3.50 $4.00 Rent per Square Foot
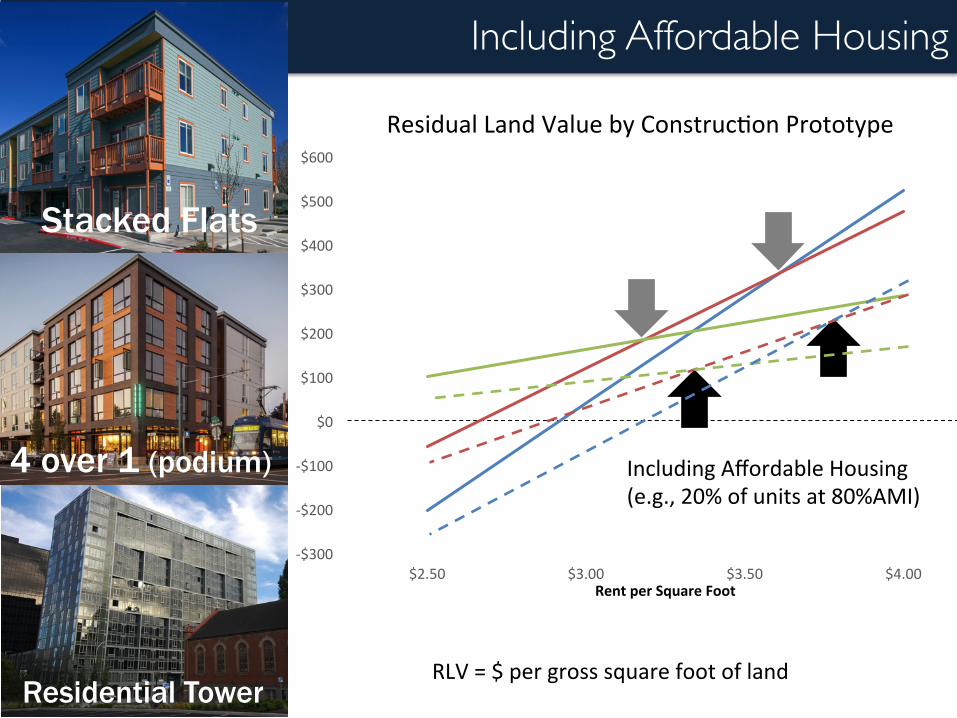
Including Affordable Housing
Stacked Flats
Residential Tower
4 over 1 (podium)
Residual Land Value by Construc?on Prototype
RLV = $ per gross square foot of land
Including Affordable Housing (e.g., 20% of units at 80%AMI)
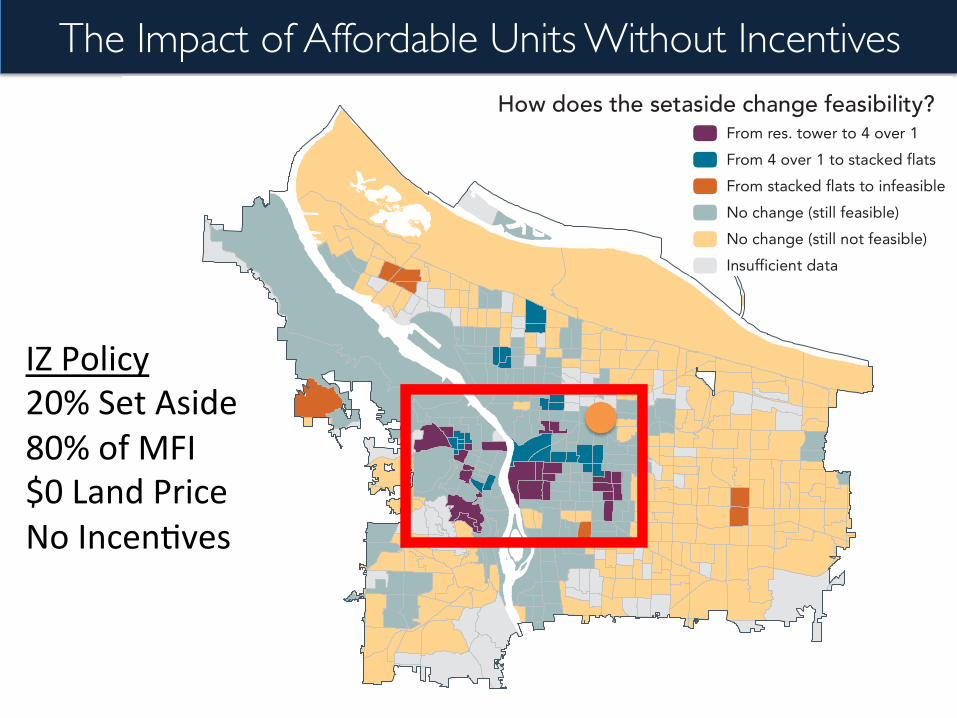
The Impact of Affordable Units Without Incentives
From res. tower to 4 over 1From 4 over 1 to stacked flatsFrom stacked flats to infeasibleNo change (still feasible)No change (still not feasible)Insufficient data
How does the setaside change feasibility?
IZ Policy 20% Set Aside 80% of MFI $0 Land Price No Incen?ves

-‐$300
-‐$200
-‐$100
$0
$100
$200
$300
$400
$500
$600
$2.50 $3.00 $3.50 $4.00 Rent per Square Foot
Lower Residual Land Values
Stacked Flats
Residential Tower
4 over 1 (podium)
Residual Land Value by Construc?on Prototype
RLV = $ per gross square foot of land

Offsetting Financial Incentives
The Economics of Inclusionary Development | 25
Section III: Optimizing the Effectiveness of Incentives for Inclusionary Development
Incentives are required to accompany IZ in most settings to ensure the desired development and avoid adverse effects in the market. They key question is: what type and mix of incentives makes most sense? The answer is that it depends on local market (and submarket) conditions and development product type, as summarized in Section I. The value of incentives will also need to reflect the costs (in lost economic value) of the affordability set aside and income targeting goals, as discussed in Section II.
Local communities have four primary incentives available to encourage multifamily development, any and all of which can complement an inclusionary zoning program. These incentives are detailed in the table at right.
To understand how developers would respond to incentives given a particular construction type (stacked flat, four over one, and residential tower) and local market conditions (rent/purchase price, construction costs, land prices, etc.), we used building prototypes and pro formas to standardize the financial analysis. To aid in conducting sensitivity analysis, we used computer algorithms to run many pro forma permutations.
Incentive Description Examples
Direct development subsidies
One-time funds that defray construction related costs
Land write downs, grants, low- or no-interest loans
Tax abatements or other operating
subsidies
Regular payments or operating cost reductions
Property tax abatements are the most common form of operating subsidy
Reduced parking requirements
Allow developers to provide fewer parking stalls than would otherwise be required
Exempt affordable units from parking requirements
Density bonuses Allow developers to build larger buildings than otherwise allowed
Increase allowable height or floor area ratio in exchange for the provision of affordable units
Optimizing the Effectiveness of Incentives for Inclusionary Development
Direct Subsidies
Opera?ng Subsidies
Reduced Parking
Density Bonus
Cost-‐oriented
Revenue-‐oriented
Construc4on -‐oriented
Opera4ons -‐oriented
$’s “Costless” Policy-‐based

Equitable Transit-Oriented Development

Real estate development as institution
“Ins4tu4ons are the humanly devised constraints that structure poli4cal, economic and social interac4on. […] Together with the standard constraints of economics they define the choice set and therefore determine transac4on and produc4on costs and hence the profitability and feasibility of engaging in economic ac4vity.”
– Douglas North “Ins?tu?ons” 1991
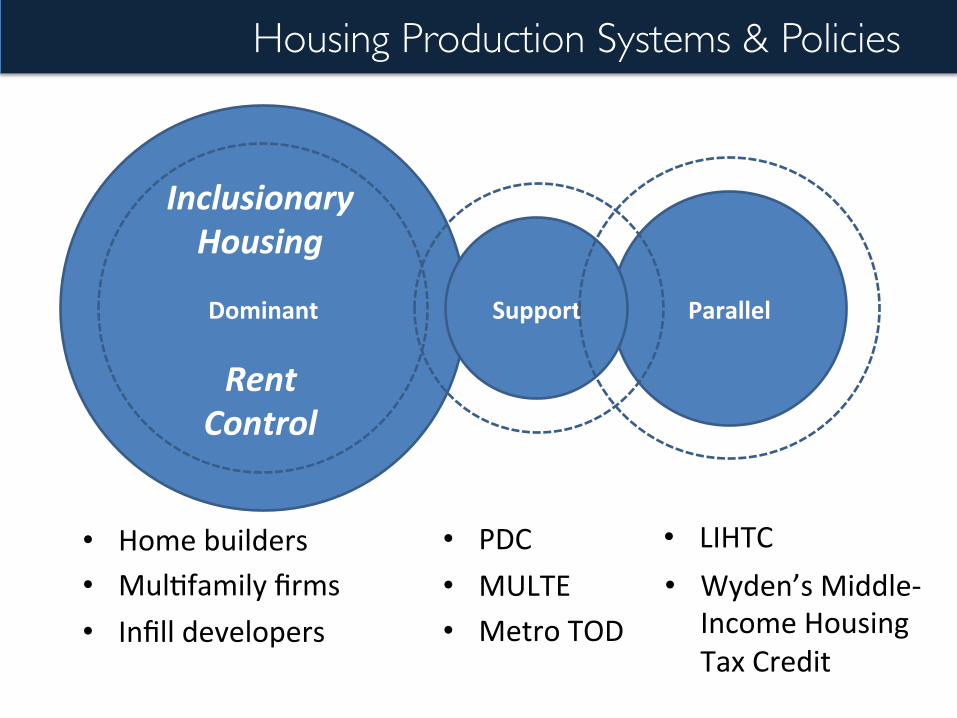
Parallel
Housing Production Systems & Policies
Dominant Support
• Home builders • Mul?family firms • Infill developers
• PDC • MULTE • Metro TOD
• LIHTC
Inclusionary Housing
Rent Control
• Wyden’s Middle-‐Income Housing Tax Credit
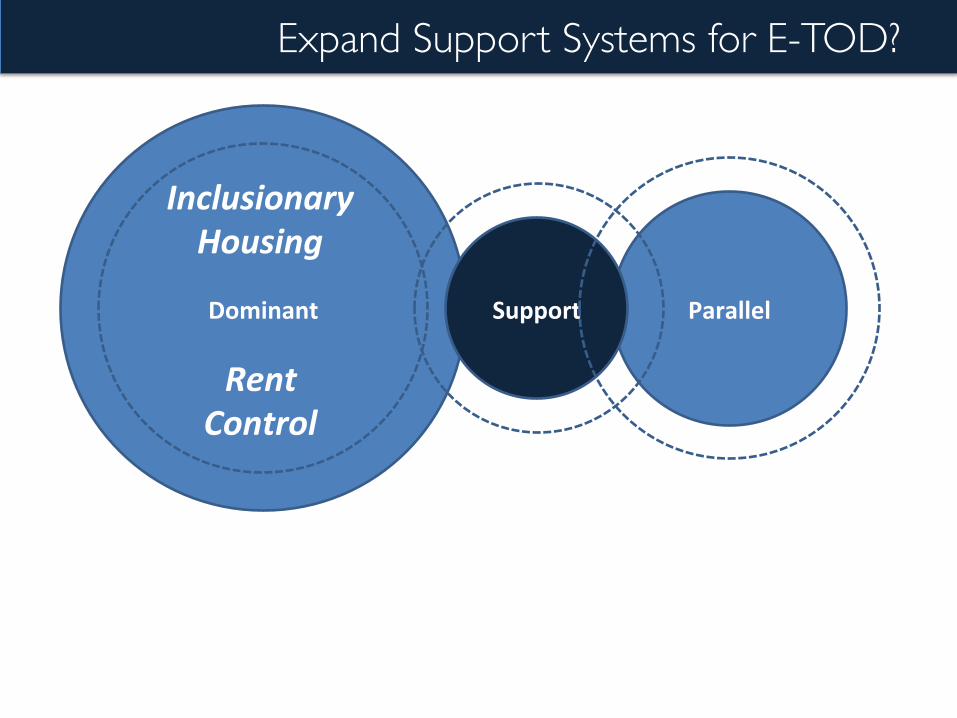
Parallel
Expand Support Systems for E-TOD?
Dominant Support
Inclusionary Housing
Rent Control

Prioritize E-TOD in Measure 26-179?
Beyond transporta?on and land use coordina?on already incorporated into other policies… How will funding from the housing bond be targeted to efficient loca?ons?
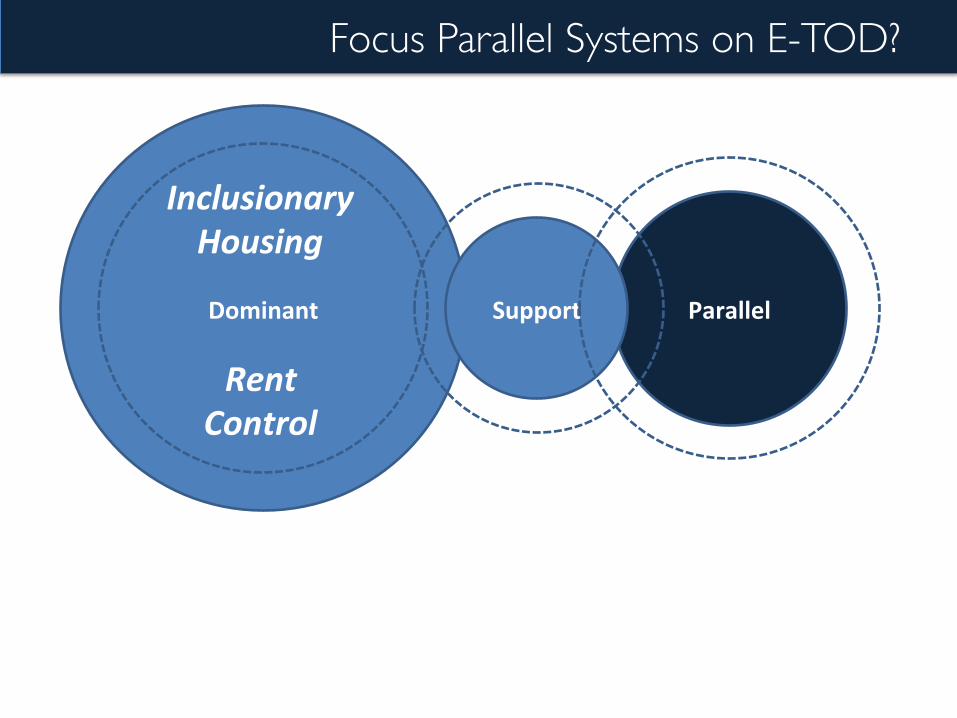
Parallel
Focus Parallel Systems on E-TOD?
Dominant Support
Inclusionary Housing
Rent Control
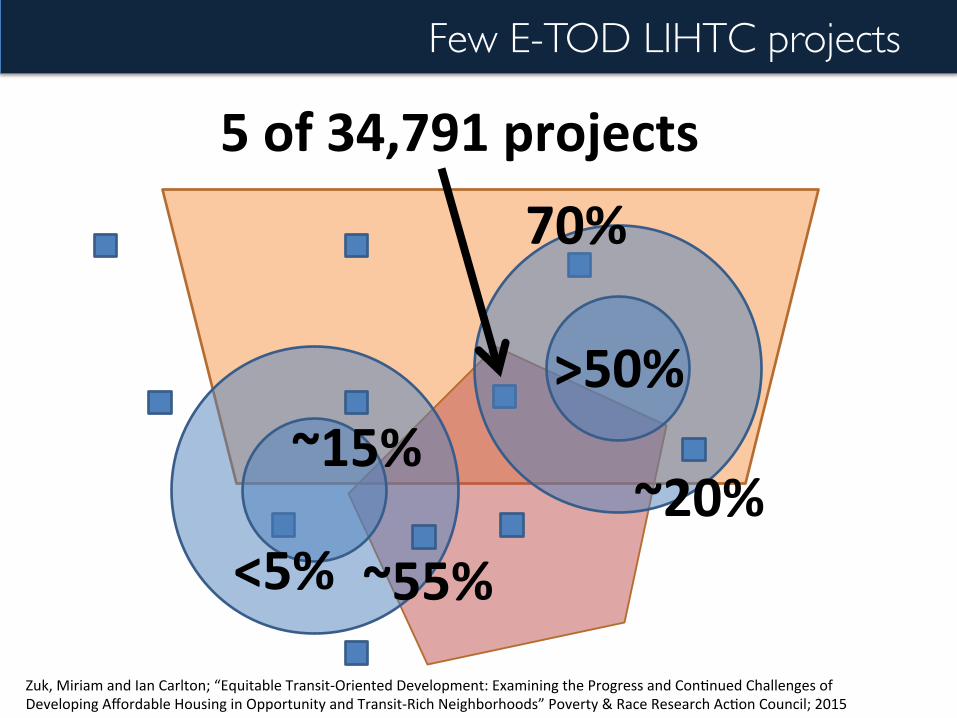
Few E-TOD LIHTC projects
<5%
>50% ~15%
~20% ~55%
70%
5 of 34,791 projects
Zuk, Miriam and Ian Carlton; “Equitable Transit-‐Oriented Development: Examining the Progress and Con?nued Challenges of Developing Affordable Housing in Opportunity and Transit-‐Rich Neighborhoods” Poverty & Race Research Ac?on Council; 2015

Prioritize E-TOD in parallel systems?
States can modify thresholds, set-‐asides, and weights in their LIHTC QAPs to encourage E-‐TOD projects, which has effec?vely influenced loca?on choices.*
* Ellen et al. “Effect of QAP Incen?ves on the Loca?on of LIHTC Proper?es” 2015
Nedwick et al “How Can the Low Income Housing Tax Credit Program Most Effec?vely be Used to Provide Affordable Rental Housing near Transit?“ 2014

Parallel
Create New Parallel System Focused on E-TOD?
Dominant Support
Inclusionary Housing
Rent Control

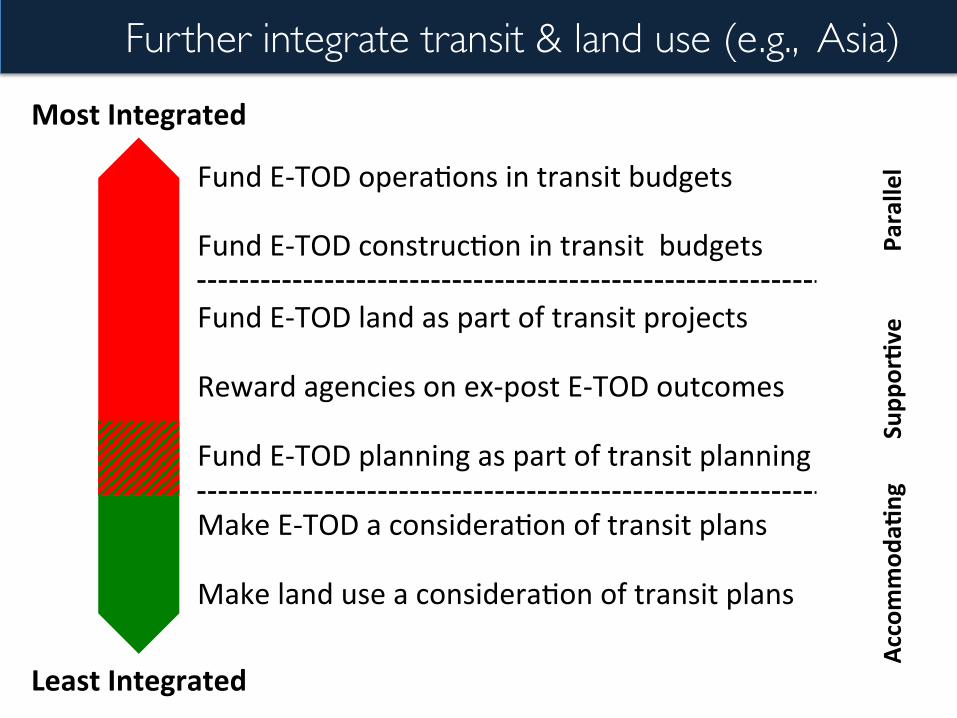
Further integrate transit & land use (e.g., Asia)?
• Fund E-‐TOD opera?ons in transit budgets
• Fund E-‐TOD construc?on in transit budgets
• Fund E-‐TOD land as part of transit projects
• Reward agencies on ex-‐post E-‐TOD outcomes
• Fund E-‐TOD planning as part of transit planning
• Make E-‐TOD a considera?on of transit plans
• Make land use a considera?on of transit plans
Least Integrated
Most Integrated
Accommod
a4ng
Supp
or4v
e Pa
rallel

2
4
1
3
System Alignment Sta4on loca4on Sta4on layout
Transit planners’ E-TOD consideration helpful?
Carlton, Ian; “Transit Planning Prac?ce in the Age of Transit Oriented Development”; UC Berkeley Disserta?on; 2013

Further integrate transit & land use (e.g., Asia)
• Fund E-‐TOD opera?ons in transit budgets
• Fund E-‐TOD construc?on in transit budgets
• Fund E-‐TOD land as part of transit projects
• Reward agencies on ex-‐post E-‐TOD outcomes
• Fund E-‐TOD planning as part of transit planning
• Make E-‐TOD a considera?on of transit plans
• Make land use a considera?on of transit plans
Least Integrated
Most Integrated
Accommod
a4ng
Supp
or4v
e Pa
rallel

FTA project evaluations contemplate E-TOD
Economic Development Score – “Future Land Use”
Transit Suppor?ve Plans and Policies
Growth Management
Transit Suppor?ve Corridor Policies
Suppor?ve Zoning
Tools to Implement Plans and Policies
Performance and Impact of Plans and
Policies
Cases of Development
Sta?on Area Development Proposals
Adaptability of Sta?on Land
Corridor Economic Environment
Affordable Housing
Need and Supply
Adopted Tools and Strategies
Evidence of Developer Ac?vity
Support for Very/Extremely Low Income
Further integrate transit & land use (e.g., Asia)
• Fund E-‐TOD opera?ons in transit budgets
• Fund E-‐TOD construc?on in transit budgets
• Fund E-‐TOD land as part of transit projects
• Reward agencies on ex-‐post E-‐TOD outcomes
• Fund E-‐TOD planning as part of transit planning
• Make E-‐TOD a considera?on of transit plans
• Make land use a considera?on of transit plans
Least Integrated
Most Integrated
Accommod
a4ng
Supp
or4v
e Pa
rallel
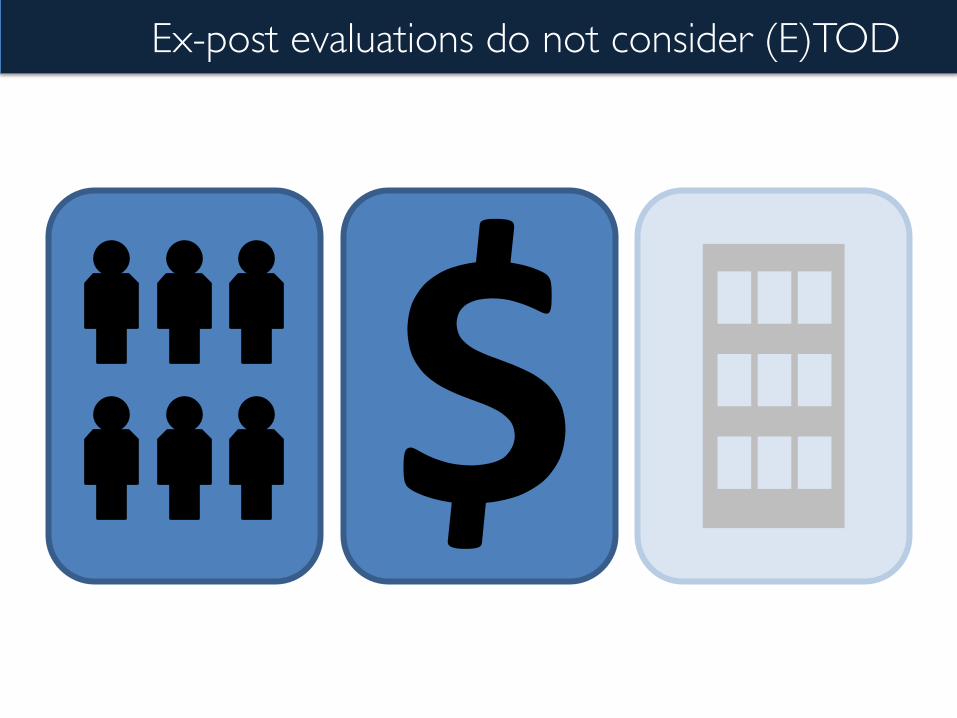
Ex-post evaluations do not consider (E)TOD
$
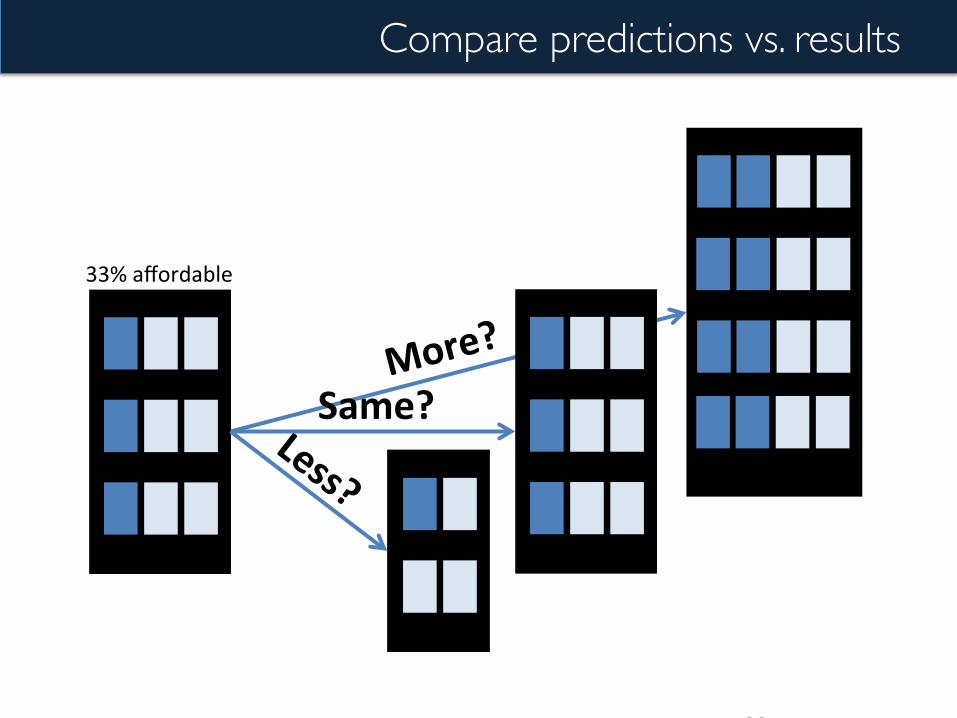
Compare predictions vs. results
39
More?
Same?
33% affordable

Further integrate transit & land use (e.g., Asia)?
• Fund E-‐TOD opera?ons in transit budgets
• Fund E-‐TOD construc?on in transit budgets
• Fund E-‐TOD land as part of transit projects
• Reward agencies on ex-‐post E-‐TOD outcomes
• Fund E-‐TOD planning as part of transit planning
• Make E-‐TOD a considera?on of transit plans
• Make land use a considera?on of transit plans
Least Integrated
Most Integrated
Accommod
a4ng
Supp
or4v
e Pa
rallel
Today’s messages
1. Market does not deliver TOD where we want it, let alone complicated E-‐TOD
2. Ineffec?ve to deliver E-‐TOD within our predominant market-‐based system
3. Could modified/new real estate development ins?tu?ons deliver E-‐TOD?

PortlandEugene Seattle Boise
Email: [email protected] Phone: 503.200.5082
MAPCRAFT.io Made in Portland & San Francisco