realisation of territory-based interaction techniques for
TRANSCRIPT
- 1 -
Internship Thesis
Realisation of Territory-Based Interaction Techniques
for Supporting Tabletop Collaboration
Stefan Habelski Computational Visualistics
Otto-von-Guericke-Universität Magdeburg mailto: [email protected]
December 13th, 2004
Supervised by:
Dr. Sheelagh Carpendale, Stacey D. Scott, Henry Sonnet

- 2 -

- 3 -
Acknowledgments This research project would not have been finished if I had not the help of some people. First, I would like to thank Sheelagh Carpendale, my supervisor in Calgary, and Henry Sonnet, my supervisor in Magdeburg, for giving me the opportunity to do my internship in Canada in a great lab with great people. Special thanks to Stacey, Mike B., Russel, Gregor and Ed who helped me a lot with this project and have given me a fantastic time in Canada.

- 4 -

- 5 -
Content
1 Introduction 7 1.1 Motivation, Problems and Goals 7 1.2 Chapter Structure 9
2 Systems for Collaborative Work 11
2.1 ConnecTables 11 2.2 Interactive Wall Map 12 2.3 The Virtual Round Table 13 2.4 i-Land: An interactive Landscape for Creativity and Innovation 14 2.5 The SmartBoard DViT Hardware 16 2.6 Interaction Possibilities 16 2.7 Problems with the SmartBoart DViT and possible Solutions 17 2.8 System under way 21 2.9 System Compromise 22
3 The Software for Collaborative Work on the SmartBoard DViT
Interactive Whiteboard System 24 3.1 Basic Project 24 3.2 Beginning Stage 25 3.3 Stage I 27 3.4 Stage II 32
4 Implementation Details 35
4.1 General Problems 35 4.2 The OpenGL Select Buffer 35 4.3 The Shrinking Interface Object Algorithm 37 4.4 Shrinking of a Selected Pile - Algorithm 40 4.5 The Tossing Algorithm 43
5 Conclusion and Future Work 46
5.1 Conclusion 46 5.2 Future Work 47

- 6 -

- 7 -
Chapter 1
1 Introduction
In the era of computers many things have changed and become easier. The computer is no longer just a machine that processes difficult calculations quickly or helps humans carry out monotonous work. Today many people cannot imagine life without computers. Everyday people work together in small groups to realise various types of projects. They often have to discuss and make changes to project materials. New technologies like interactive wall displays and digital tabletop systems offer great potential to help in these endeavours. But what kind of interfaces and user interaction techniques would enable people to intuitively perform useful interactions in these new environments while minimizing system learning time? This report describes the development of several novel user interfaces and interaction techniques for supporting tabletop collaboration. It is based on a project called Territoriality in Collaborative Tabletop Workspaces that is concerned with supporting collaborative interactions on a digital tabletop display [1].
When people work together on a collaborative project they often sit around a large table with papers and pens, having discussions, making notes, creating outlines, changing project material, and sharing the results with other group members. After these meetings, they often have to convert the paper data into digital form to do any follow-up work. People often spend considerable time typing in all the content or scanning the material into the computer. If people were able to work with digital data directly during their meetings, it might save a significant amount of rework, and thus free up valuable time that could be spent doing new work. The question is how can such a digital workspace be realised? What kind of hardware is necessary and how should the software interface look? People want to have easy user interactions, a clear interface, stability, and of course data must not be lost. It is not easy to find a reasonable solution for all of these problems and it is not possible to solve them for every person. Standard desktop computers are unsuitable for supporting tabletop collaboration. When two or more people have to sit in front of a small monitor people often feel crowded. Furthermore, only one person at a time can add or change something at a standard desktop computer because the input devices are only made for one person.
1.1 Motivation, Problems and Goals
Introduction
- 8 -
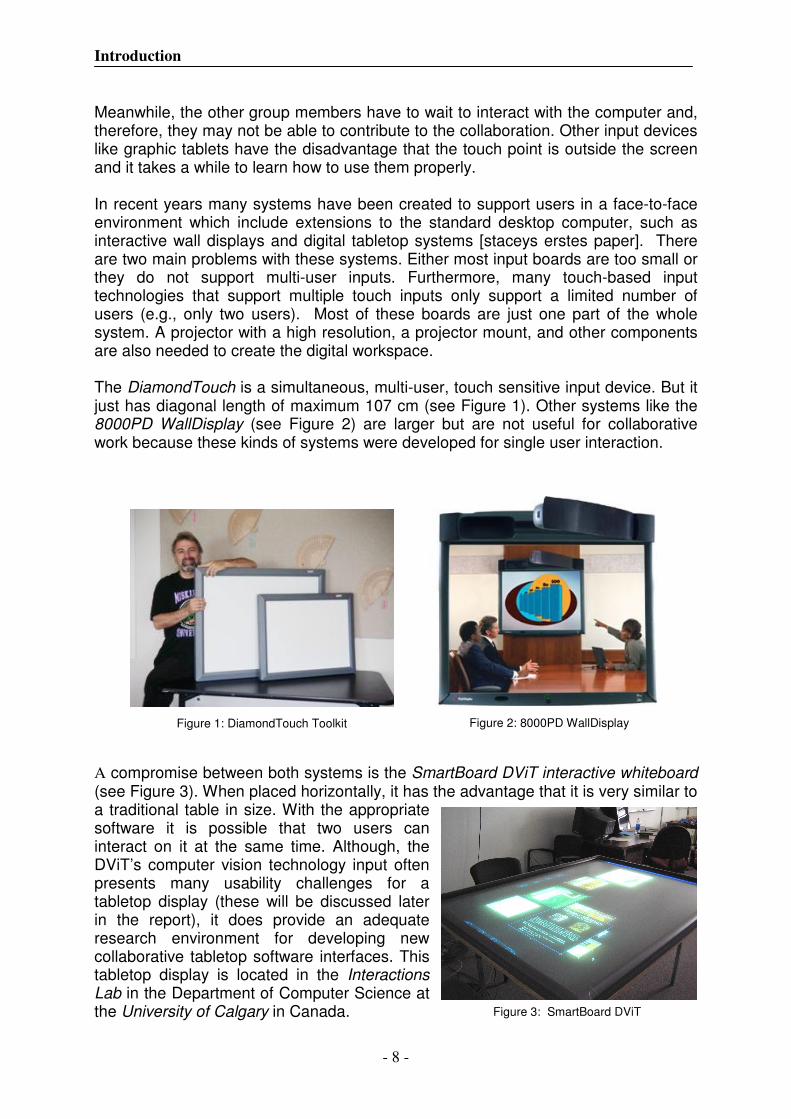
Meanwhile, the other group members have to wait to interact with the computer and, therefore, they may not be able to contribute to the collaboration. Other input devices like graphic tablets have the disadvantage that the touch point is outside the screen and it takes a while to learn how to use them properly. In recent years many systems have been created to support users in a face-to-face environment which include extensions to the standard desktop computer, such as interactive wall displays and digital tabletop systems [staceys erstes paper]. There are two main problems with these systems. Either most input boards are too small or they do not support multi-user inputs. Furthermore, many touch-based input technologies that support multiple touch inputs only support a limited number of users (e.g., only two users). Most of these boards are just one part of the whole system. A projector with a high resolution, a projector mount, and other components are also needed to create the digital workspace. The DiamondTouch is a simultaneous, multi-user, touch sensitive input device. But it just has diagonal length of maximum 107 cm (see Figure 1). Other systems like the 8000PD WallDisplay (see Figure 2) are larger but are not useful for collaborative work because these kinds of systems were developed for single user interaction. A compromise between both systems is the SmartBoard DViT interactive whiteboard (see Figure 3). When placed horizontally, it has the advantage that it is very similar to a traditional table in size. With the appropriate software it is possible that two users can interact on it at the same time. Although, the DViT’s computer vision technology input often presents many usability challenges for a tabletop display (these will be discussed later in the report), it does provide an adequate research environment for developing new collaborative tabletop software interfaces. This tabletop display is located in the Interactions Lab in the Department of Computer Science at the University of Calgary in Canada.
Figure 1: DiamondTouch Toolkit
Figure 3: SmartBoard DViT dsdssdfwhiinteractive
Figure 2: 8000PD WallDisplay

Introduction
- 9 -
The goals of this research are to investigate various software interfaces and interaction techniques to support tabletop collaboration. It is important that people do not have to spend too much time learning the functions of the system. So the interaction techniques of the environment must be clear, user-friendly and self-explanatory. Furthermore, the functionality has to work well in real-time. Even if the users have to wait for just a few seconds, it may not be adequate for collaborative work. In order to achieve this goal, observational studies of tabletop collaboration on the SmartBoard DViT tabletop system were performed.
The following chapter discusses related work both from the literature and from some on-going projects. It presents several collaborative systems, focusing mainly on tabletop systems and the interaction techniques used in these systems. Furthermore, Chapter 2 describes the hardware settings and basic principle of the SmartBoard DViT tabletop system, the system for which the software in this project was developed. The problems this system has for supporting collaboration are also discussed, along with several solutions that were developed as a part of this research project. Chapter 3 describes the basics of supporting collaboration on a digital tabletop system. In addition, the visualization of the collaborative tabletop environment that was developed during this research is then introduced, followed by a description of the interaction techniques used in this environment. Each stage of the software development is then discussed. Chapter 4 illustrates the main methods and algorithms that were developed during the research. Furthermore, the chapter presents the mathematical and procedural details of each of the algorithms that were developed. Finally, Chapter 5 gives a conclusion and discusses some ideas for future research.
1.2 Chapter Structure
Introduction
- 10 -
- 11 -
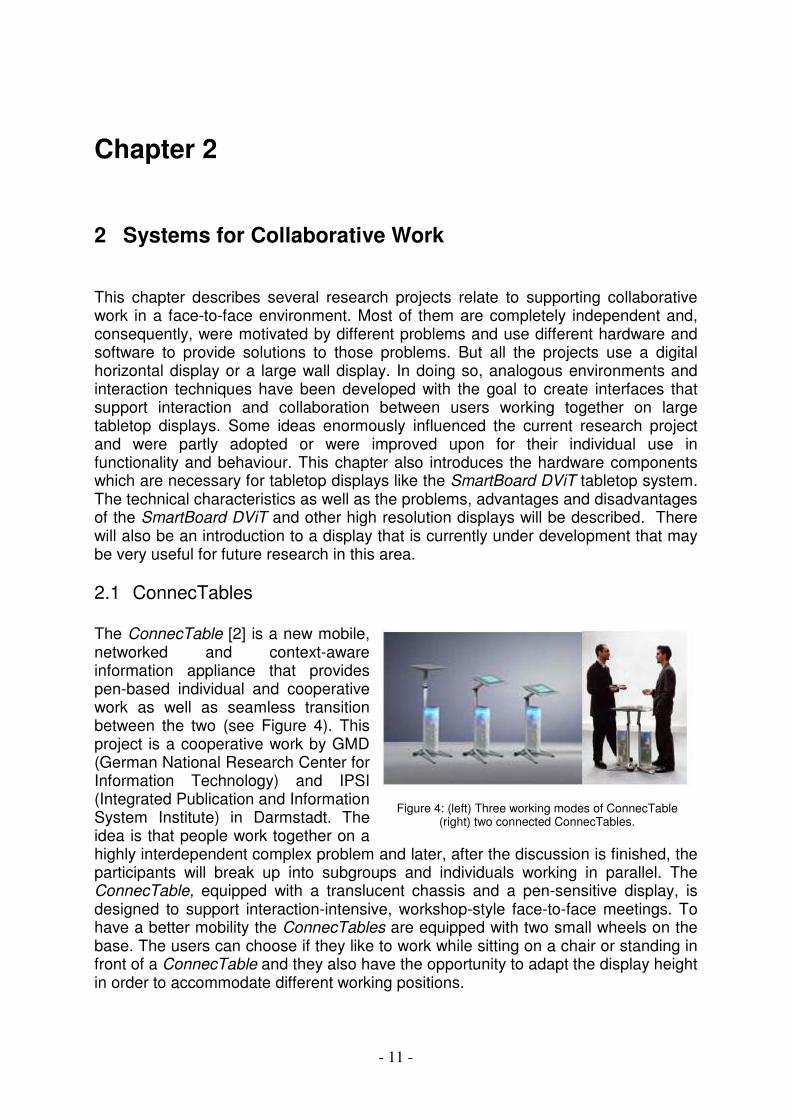
Figure 4: (left) Three working modes of ConnecTable
(right) two connected ConnecTables.
Chapter 2
2 Systems for Collaborative Work This chapter describes several research projects relate to supporting collaborative work in a face-to-face environment. Most of them are completely independent and, consequently, were motivated by different problems and use different hardware and software to provide solutions to those problems. But all the projects use a digital horizontal display or a large wall display. In doing so, analogous environments and interaction techniques have been developed with the goal to create interfaces that support interaction and collaboration between users working together on large tabletop displays. Some ideas enormously influenced the current research project and were partly adopted or were improved upon for their individual use in functionality and behaviour. This chapter also introduces the hardware components which are necessary for tabletop displays like the SmartBoard DViT tabletop system. The technical characteristics as well as the problems, advantages and disadvantages of the SmartBoard DViT and other high resolution displays will be described. There will also be an introduction to a display that is currently under development that may be very useful for future research in this area.
The ConnecTable [2] is a new mobile, networked and context-aware information appliance that provides pen-based individual and cooperative work as well as seamless transition between the two (see Figure 4). This project is a cooperative work by GMD (German National Research Center for Information Technology) and IPSI (Integrated Publication and Information System Institute) in Darmstadt. The idea is that people work together on a highly interdependent complex problem and later, after the discussion is finished, the participants will break up into subgroups and individuals working in parallel. The ConnecTable, equipped with a translucent chassis and a pen-sensitive display, is designed to support interaction-intensive, workshop-style face-to-face meetings. To have a better mobility the ConnecTables are equipped with two small wheels on the base. The users can choose if they like to work while sitting on a chair or standing in front of a ConnecTable and they also have the opportunity to adapt the display height in order to accommodate different working positions.
2.1 ConnecTables

Systems for Collaborative Work
- 12 -
In order to connect two ConnecTables they have to be moved close to each other as shown in Figure 5b. Then a shared workspace will created combining the two previously personal displays and expands across the border of the two screens which now form a homogeneous physical display area. Then the users are able to exchange information objects just by shuffling them over to the other display (see Figure 5c). Of course the common workspace can go back to individual non connected displays just by pulling them apart from each other.
Figure 5: (a) Individual work (b) two ConnecTales are paced next to each other for coupled work (c) exchanging information objects in a homogeneous display area (d) users can have their own but shared views of the same information object.
For that special kind of ‘roomware’ components the BEACH User Interface has been developed (BEACH = Basic Environment Collaboration with Hypermedia). It is a synchronous groupware to support face-to-face group work. If two ConnecTables are connected the users are able to visualize important points in parallel and exchange them from time to time during their discussion. Another way users can work together more effectively is by enabling the simultaneous view of the same information object by using a simple gesture (see Figure 5d). Then the second view can be moved to the other display and rotated, allowing each user to work on the same object using different displays, each showing the object in the proper orientation for the respective user. The users can also proceed to work on the exchanged objects when their ConneTables are no longer connected.
The Interactive Wall Map [3] is an older project aimed at creating a large conversation-inspiring public display with interaction possibilities. It is one of the components developed within the study Using Public Displays to Create Conversion
Opportunities. At that time, the display and sensor technologies had advanced to the point where it was possible to create the first large, interactive displays in public spaces. This study revealed that maps often act as attractors and people naturally gravitate toward them, especially when they are large and are mounted on walls. The viewers of the map often start to exchange stories about experiences related to where they have been, where they were born, or where they would like to go. Usually these stories are associated with memories like images,
2.2 Interactive Wall Map
Figure 6: Interactive Wall Map

Systems for Collaborative Work
- 13 -
project description or conference home pages, but this content is typically not accessible in front of the map. So the idea arose to create the Interactive Wall Map (see Figure 6) consisting of a set of six flat panel touch screen monitors and a collection of 24 LED-topped button switches embedded in a large wall map of the world with a size of 3.96 metres by 2.64 metres. The six monitors are placed paired up in three vertically partitioned geographical important regions. These regions are America, Middle East and Africa, Europe and Asia. The cities on the map that are of potential interest have a LED button insert at their location on the map. These LEDs on the top of the buttons have three different states:
• off: for power / LED conversations
• green: this location has some electronic content associated with it
• red: content currently being displayed on a monitor is associated with this location
The LEDs are combined with small button switches so that people can bring up specific content to the embedded monitors by pressing the LED buttons. Therefore, people standing at the map have a greater ability to get and exchange information map locations. The Interactive Wall Map was a great idea given the technology that was available at that time, but it does not compare to the rich interaction possibilities that are available with the technology available today. It only provided users limited interaction capabilities, yet the concepts could easily be applied to currently technology to provide an even richer, conversational environment.
The basic idea of The Virtual Round Table [4] is the perspective correct 3D stereo visualization of a synthetic scene within a real world working environment. The users use see-through projection glasses where virtual objects are displayed. That
2.3 The Virtual Round Table
Figure 7: Basic Virtual Round Table architecture.

Systems for Collaborative Work
- 14 -
interactive task-oriented cooperation environment enables the participants of a work group to share a 3D application with their real existing work environment. The Virtual Round Table architecture is shown in Figure 7. There the users are able to superimpose physical items by virtual objects. If they like to manipulate anything in the synthetic environment it can be directly mapped onto the appropriate virtual object. Real world objects such as cups, books, salt and pepper can be used as placeholders. These objects are associated with the virtual projected 3D objects. Thus real and virtual objects form an interaction unit (see Figure 8) and the superimposed physical items become a symbolic representative of its attached virtual counterpart. .
The i-Land [5] is an environment which represents a vision how the workspaces of the future might look. This project is a also cooperative work by GMD (German National Research Center for Information Technology) and IPSI (Integrated Publication and Information System Institute) in Darmstadt, Germany. It introduces new forms of human-computer interaction and new forms of computer-supported cooperative work. The design of i-Land is based on an integration of information and architectural spaces. The environment consists of different ‘roomware’ components like an interactive electronic wall, an interactive table and two computer-enhanced chairs. These components will be explained in more detailed later. Figure 9 presents the first visualization of these ideas when the i-Land project was started in 1997, showing parallel work of three subgroups and two individual groups. In that environment, the chairs, the table, and the whiteboard on the wall are all interactive electronic devices providing adequate IT support for interaction and cooperation situations.
The DynaWall The DynaWall [6] is an interactive electronic wall represented by a touch-sensitive surface that serves the needs of teams for example in project rooms where large areas of assembled sheets of paper covering the wall are used to create and organize information. The current realisation is 5 meters wide and 2.7 meters high with an active totally display size of 4.5 metres width and 1.1 metres height. It has a resolution of 3072x768 pixels and covers one side of the room completely (see Figure 10). At this wall, three users are able to work
2.4 i-Land: An interactive Landscape for Creativity and Innovation
Figure 8: Interaction unit
Figure 9: Model of i-Land
Figure 10: DynaWall in the i-Land environment.

Systems for Collaborative Work
- 15 -
simultaneously on separate areas. The DynaWall is a combination of three interactive rear projection whiteboards created by SMART Technologies Incorporated (www.smarttech.com). These wall segments are covered in a special way to create the illusion of one very large homogeneous working area. The software for it enables teams in small groups to display and interact with a large information structures collaboratively on the DynaWall. The goal was to facilitate the interaction with the wall and to minimize the physical work compared to desktop computers, with respect to arm movement, head turning, walking along the wall, and so on. The large size of the DynaWall provides new challenges for human-computer interaction. It can be very cumbersome to drag an object or a window holding down the pen over a long distance across the wall. The approach to this problem is the consistent use of gestures, either by hand/finger or by pen, and gesture sensitive widgets such as gedrics (gesture-driven icons). Therefore, three interaction styles have been implemented for the DynaWall: shuffling, throwing, and taking displayed objects. Shuffling One feature is the mechanism of shuffling displayed objects. It is a convenient and quick way of re-arranging objects on the display. The user is able to shuffle the objects by writing directed strokes on special widgets/handles. The software reacts on the input by moving the object by one length of its dimensions. The motion value is pre-defined for the shuffling operation. If the user wants to move an image of 200x300 pixels aside to the right, he simply has to write an almost horizontal quick stroke from the left to the right on the top of one of the image handles and as consequence, the image will be moved by one window width to the right. Throwing Moving objects across a larger distance can be archived by a different set of gestures. The user first has to write a short stroke to the opposite direction the object should be moving, followed by another longer stroke in the correct direction. The longer the first stroke becomes compared to the second one, the higher the pace of the tossed and it can be caught by another team member on the opposite side. But it needs some training to use the throwing in an efficient way. Taking By laying the users hand on one of the object’s handles and waiting about half a second the software is going to shrink the object which disappears behind the hand. Laying the hand afterwards on an empty area of the wall lets the object re-appear and grow behind the hand to its original size. That “Take and Put” operation is comparable to the usual “Cut and Paste” operation on general desktop computers. The software is in a temporary state and it is only possible to take another object if the previously taken object has been put back.
Systems for Collaborative Work
- 16 -
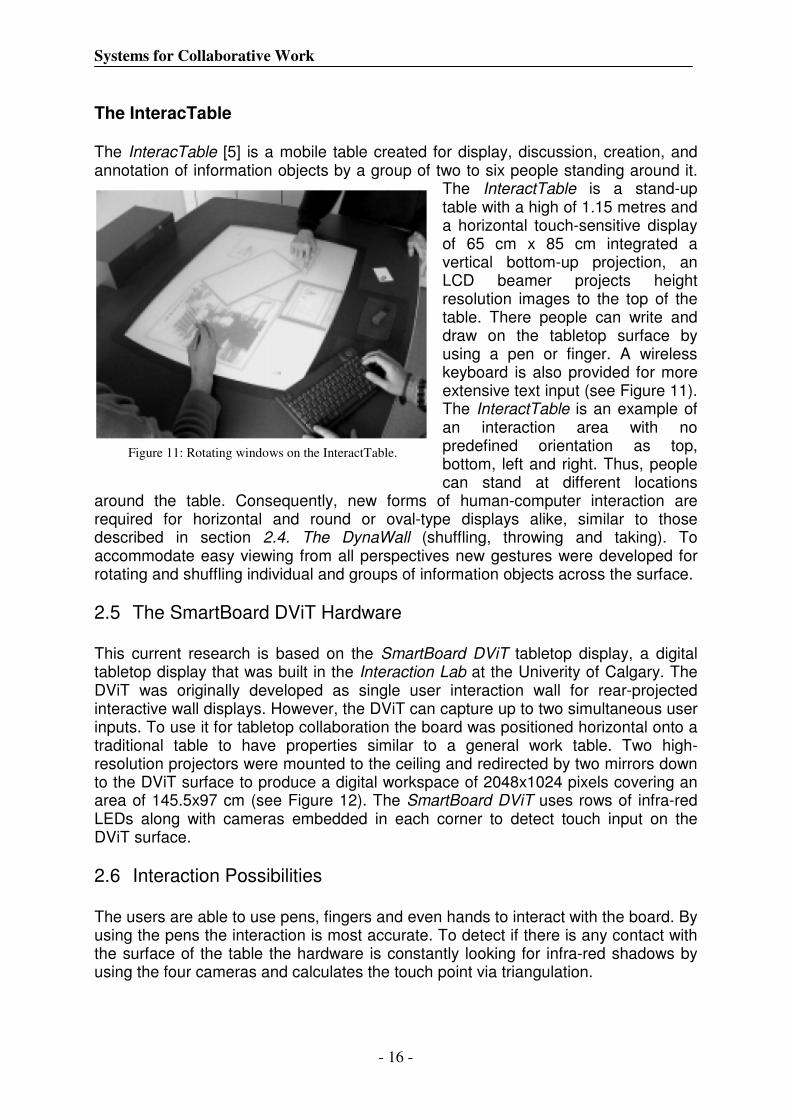
The InteracTable The InteracTable [5] is a mobile table created for display, discussion, creation, and annotation of information objects by a group of two to six people standing around it.
The InteractTable is a stand-up table with a high of 1.15 metres and a horizontal touch-sensitive display of 65 cm x 85 cm integrated a vertical bottom-up projection, an LCD beamer projects height resolution images to the top of the table. There people can write and draw on the tabletop surface by using a pen or finger. A wireless keyboard is also provided for more extensive text input (see Figure 11). The InteractTable is an example of an interaction area with no predefined orientation as top, bottom, left and right. Thus, people can stand at different locations
around the table. Consequently, new forms of human-computer interaction are required for horizontal and round or oval-type displays alike, similar to those described in section 2.4. The DynaWall (shuffling, throwing and taking). To accommodate easy viewing from all perspectives new gestures were developed for rotating and shuffling individual and groups of information objects across the surface.
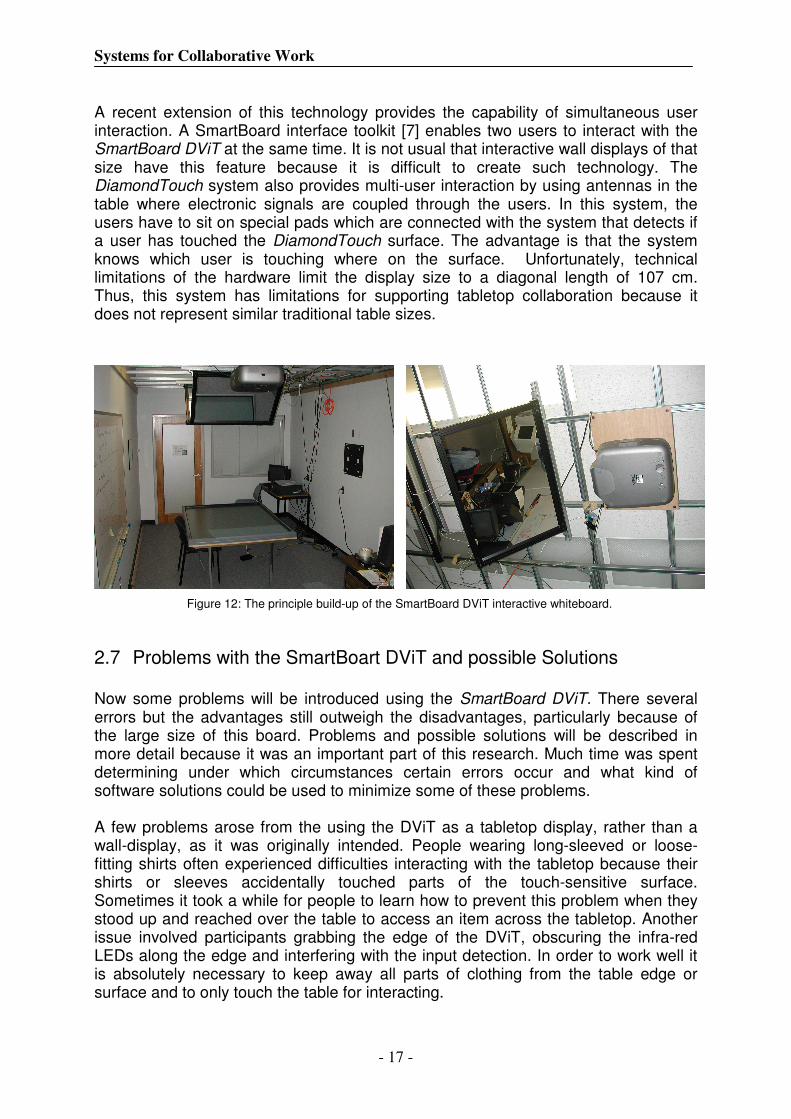
This current research is based on the SmartBoard DViT tabletop display, a digital tabletop display that was built in the Interaction Lab at the Univerity of Calgary. The DViT was originally developed as single user interaction wall for rear-projected interactive wall displays. However, the DViT can capture up to two simultaneous user inputs. To use it for tabletop collaboration the board was positioned horizontal onto a traditional table to have properties similar to a general work table. Two high-resolution projectors were mounted to the ceiling and redirected by two mirrors down to the DViT surface to produce a digital workspace of 2048x1024 pixels covering an area of 145.5x97 cm (see Figure 12). The SmartBoard DViT uses rows of infra-red LEDs along with cameras embedded in each corner to detect touch input on the DViT surface.
The users are able to use pens, fingers and even hands to interact with the board. By using the pens the interaction is most accurate. To detect if there is any contact with the surface of the table the hardware is constantly looking for infra-red shadows by using the four cameras and calculates the touch point via triangulation.
2.5 The SmartBoard DViT Hardware
2.6 Interaction Possibilities
Figure 11: Rotating windows on the InteractTable.
Systems for Collaborative Work
- 17 -
A recent extension of this technology provides the capability of simultaneous user interaction. A SmartBoard interface toolkit [7] enables two users to interact with the SmartBoard DViT at the same time. It is not usual that interactive wall displays of that size have this feature because it is difficult to create such technology. The DiamondTouch system also provides multi-user interaction by using antennas in the table where electronic signals are coupled through the users. In this system, the users have to sit on special pads which are connected with the system that detects if a user has touched the DiamondTouch surface. The advantage is that the system knows which user is touching where on the surface. Unfortunately, technical limitations of the hardware limit the display size to a diagonal length of 107 cm. Thus, this system has limitations for supporting tabletop collaboration because it does not represent similar traditional table sizes.
Now some problems will be introduced using the SmartBoard DViT. There several errors but the advantages still outweigh the disadvantages, particularly because of the large size of this board. Problems and possible solutions will be described in more detail because it was an important part of this research. Much time was spent determining under which circumstances certain errors occur and what kind of software solutions could be used to minimize some of these problems. A few problems arose from the using the DViT as a tabletop display, rather than a wall-display, as it was originally intended. People wearing long-sleeved or loose-fitting shirts often experienced difficulties interacting with the tabletop because their shirts or sleeves accidentally touched parts of the touch-sensitive surface. Sometimes it took a while for people to learn how to prevent this problem when they stood up and reached over the table to access an item across the tabletop. Another issue involved participants grabbing the edge of the DViT, obscuring the infra-red LEDs along the edge and interfering with the input detection. In order to work well it is absolutely necessary to keep away all parts of clothing from the table edge or surface and to only touch the table for interacting.
2.7 Problems with the SmartBoart DViT and possible Solutions
Figure 12: The principle build-up of the SmartBoard DViT interactive whiteboard.
Systems for Collaborative Work
- 18 -
Furthermore, it has been revealed that people would prefer to interact with a combination of digital data and pen and paper media on the table at the same time. Because of the hardware properties mentioned above there is no way to enable this feature at the moment. Another smaller problem is that of top projecting onto the glass surface of the DViT. It results in small display mistakes because some light rays will be reflected directly on top of the surface while other rays enter the surface and generate total reflectance. On closer examination the projection is not really sharp; it looks blurred. In this case the glass surface can be covered by a small non-transparent plastic film. It is very important to have a flat surface though; otherwise the hardware could detect input events all the time. There may be the question of why a bottom projection setup was not used. The answer is: The people would not have any legroom when the two big projectors and mirrors would be installed under the table. Such a table would enable stand-up collaboration only. These kinds of problems did not really influence developing software for the SmartBoard DViT tabletop display but they effect the collective project. More intensive errors occurred by the activation of the multi-user mode, which will be explained now. Unknown User ID Problem The SmartBoard hardware returns touch events similar to the typical mouse events on traditional desktop computers. These input events are touch-down, touch-move and touch-up. However, it also provides the additional information of a touch point identity number of zero or one. The first user who is touching onto the surface gets the identity number zero, the second one gets number one. Compared to the DiamondTouch systems the SmartBoard DViT can not differentiate which participant is touching. This could have disadvantages to provide certain user interactions. It will be described in more detail in Chapter 3. Triangulation Problem The Triangulation Problem is an exclusive hardware problem. There is no software solution to minimize this problem. The location of the touch points are calculated by using a triangulation algorithm. The situation may arise that, depending on the angles of both touch points to the cameras in the corners, the hardware returns just one identity number with a wrong location. That error especially happens when both users interact near the same edge of the DViT tabletop display (see Figure 13a). Item Switch Problem It arranged for lots of confusions during the observations as items were getting switched sometimes. It merely occurs after one user started to drag while the second one is interacting yet on the whiteboard (see figure 13b). However this error can be minimized by calculating the distance between the two touch points: Is the distance between them larger than a set threshold it is properly a sign of switching. But it will not have effect if the distance is smaller than the threshold.

Systems for Collaborative Work
- 19 -
Double Mouse-Up Event Problem Infrequently it can happen that the DViT hardware returns two touch-up events back-to-back. Depending on the software implementation items could be duplicated because moved items are stored in a special structure. When the touch-up event was called twice, the items were stored two times in the structure.
Figure 13 (a): The Triangulation Problem

Systems for Collaborative Work
- 20 -
Figure 13 (b): The Switching Problem [8]
Systems for Collaborative Work
- 21 -
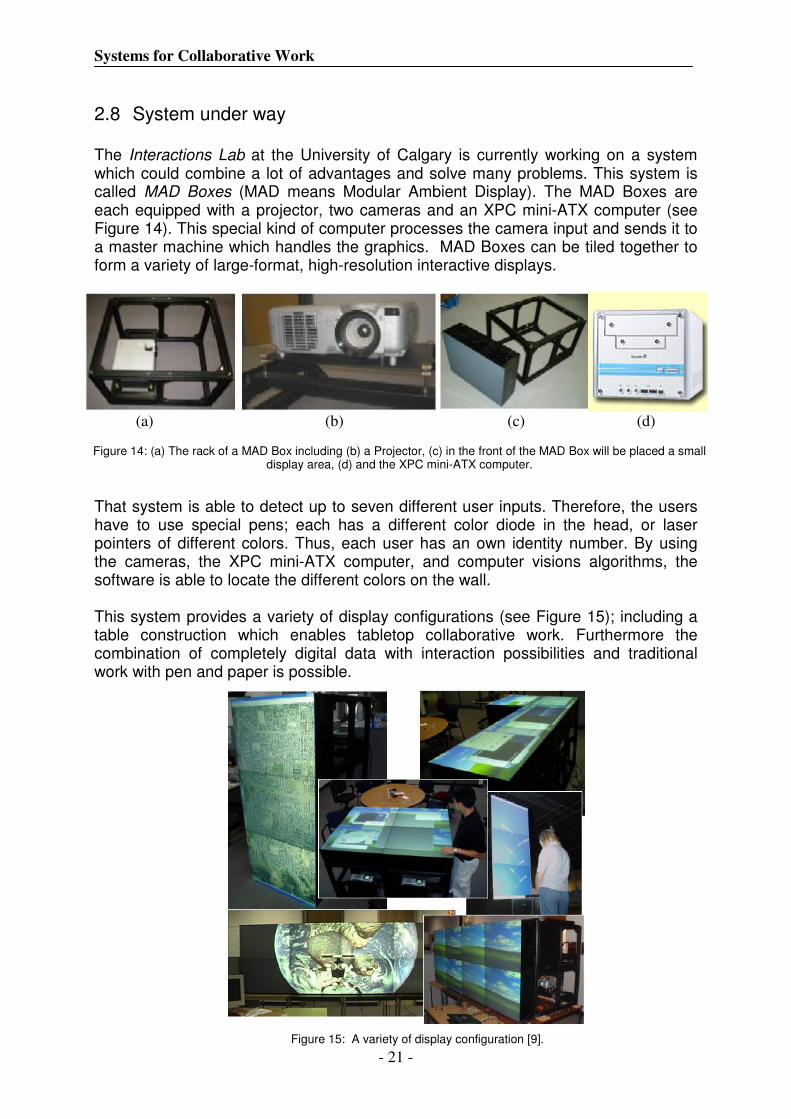
The Interactions Lab at the University of Calgary is currently working on a system which could combine a lot of advantages and solve many problems. This system is called MAD Boxes (MAD means Modular Ambient Display). The MAD Boxes are each equipped with a projector, two cameras and an XPC mini-ATX computer (see Figure 14). This special kind of computer processes the camera input and sends it to a master machine which handles the graphics. MAD Boxes can be tiled together to form a variety of large-format, high-resolution interactive displays.
That system is able to detect up to seven different user inputs. Therefore, the users have to use special pens; each has a different color diode in the head, or laser pointers of different colors. Thus, each user has an own identity number. By using the cameras, the XPC mini-ATX computer, and computer visions algorithms, the software is able to locate the different colors on the wall. This system provides a variety of display configurations (see Figure 15); including a table construction which enables tabletop collaborative work. Furthermore the combination of completely digital data with interaction possibilities and traditional work with pen and paper is possible.
2.8 System under way
(a) (b) (c) (d) Figure 14: (a) The rack of a MAD Box including (b) a Projector, (c) in the front of the MAD Box will be placed a small
display area, (d) and the XPC mini-ATX computer.
Figure 15: A variety of display configuration [9].

Systems for Collaborative Work
- 22 -
The table below shows the advantages and disadvantages of the mentioned systems with regard to collaborative work possibilities.
Size User Inputs Error Probability Interactive Wall Map large provides multi-users, but
no real interaction no error because of limited interaction possibilities
DynaWall large three user inputs but just on shared displays
for each shared display few errors
ConnecTables small two user inputs but just on shared displays
for each shared display few errors
InteractTables small single-user input no errors
DiamondTouch small multi-user input no errors
SmartBoard DViT medium up to two user inputs in single-user mode few errors, in multi-user mode a few errors, some of them can be minimized by the software
MAD Boxes large up to seven user inputs few errors
All the systems presented in this chapter have shown different ways of how people can work together in a computer-supported environment. They influenced the ideas and implementation of this current project. Although, the Interactive Wall Map is not comparable with current systems, however it shows the first attempts to have interaction on displays which are bigger than general monitor screens. Other systems like the ConnecTables, InteractTable or DiamondTouch system have a small interaction area. Unlike the DiamondTouch system most of them do not provide multi-user interaction. A large wall display system like the DynaWall provides a kind of multi-user interaction on shared areas. Three users are able to work simultaneous on each interactive whiteboard part. But that system is limited when two or more users want to work on the same shared area. The SmartBoard DViT tabletop display, an extension of the boards used for DynaWall, captures up to two users inputs. Unfortunately this technique has some problems in specific cases. Furthermore it is not possible to realise (interaction) ideas with regard to specific users at the table. The MAD Boxes system is a potential solution for all the mentioned problems. It has few input errors during interaction, especially during simultaneous work, and the size can cover one side of a room completely. A variety of display configurations are also possible and people are able to perform traditional work with paper and pen on it.
2.9 System Compromise
Systems for Collaborative Work
- 23 -
- 24 -
Chapter 3
3 The Software for Collaborative Work on the SmartBoard DViT Interactive Whiteboard System
This chapter describes the software functionalities (and their use) that were implemented during this research. Furthermore, this chapter discusses why some ideas and already implemented concepts were removed from the system; advantages and disadvantages of these functions also in reference to related programs will be explained.
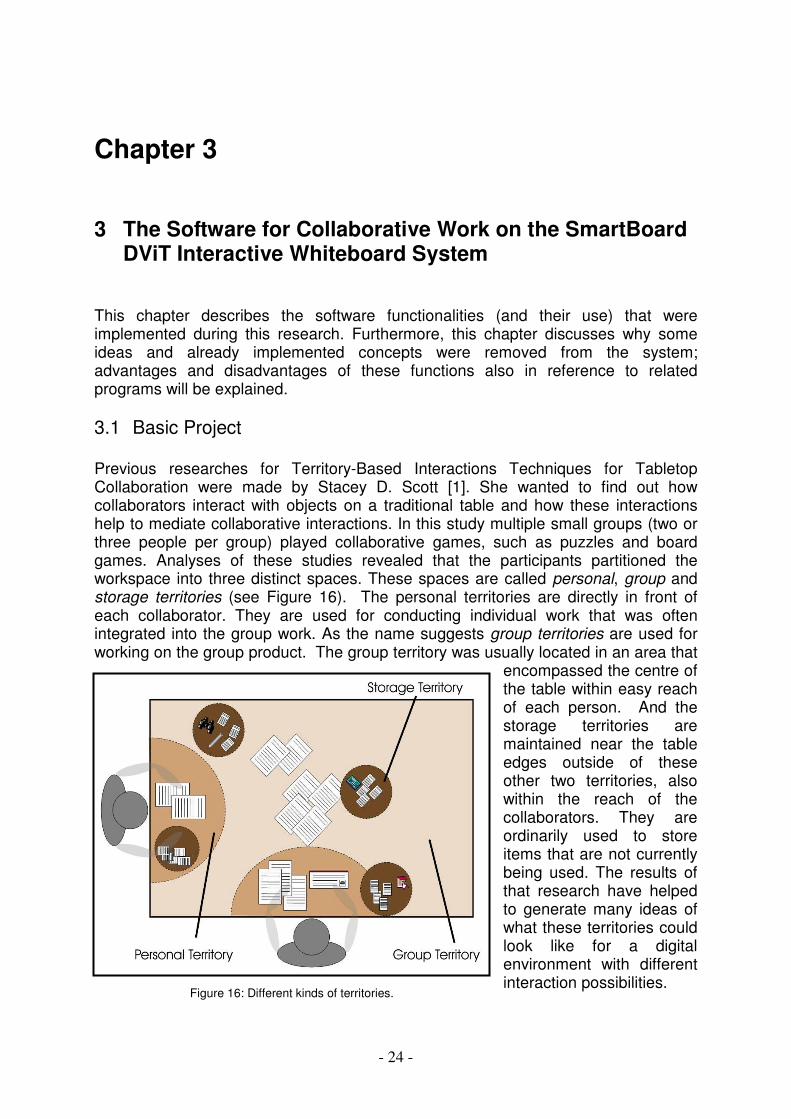
Previous researches for Territory-Based Interactions Techniques for Tabletop Collaboration were made by Stacey D. Scott [1]. She wanted to find out how collaborators interact with objects on a traditional table and how these interactions help to mediate collaborative interactions. In this study multiple small groups (two or three people per group) played collaborative games, such as puzzles and board games. Analyses of these studies revealed that the participants partitioned the workspace into three distinct spaces. These spaces are called personal, group and storage territories (see Figure 16). The personal territories are directly in front of each collaborator. They are used for conducting individual work that was often integrated into the group work. As the name suggests group territories are used for working on the group product. The group territory was usually located in an area that
encompassed the centre of the table within easy reach of each person. And the storage territories are maintained near the table edges outside of these other two territories, also within the reach of the collaborators. They are ordinarily used to store items that are not currently being used. The results of that research have helped to generate many ideas of what these territories could look like for a digital environment with different interaction possibilities.
3.1 Basic Project
Figure 16: Different kinds of territories.

Collaborative Work on SmartBoard Systems
- 25 -
Personal and storage territories observed in the original studies often dynamically changed shape, size and sometimes location. How should these territories be represented in the digital environment? How can the users exchange information using items? What should happen when these workspace items, the so-called Interface Object, are dragged into a personal or storage territory? One solution is to resize these digital items after crossing the border of these territories to preserve screen real-estate. Furthermore, there is the question of what kind of functionality should be used for reorienting or resizing digital items in the workspace. Other observations [11] which were partly made in an already existing digital tabletop environment in the Interactions Lab revealed that people wanted to throw items over larger distances. Out of these observations came the idea to implement a tossing interaction technique for digital items. For these ideas a software concept was created to bring them in digital form, to extend current versions of a software testbed, and to change the environment for different requirements. The main work during the research compromised of designing and developing various software interfaces and user-friendly interaction techniques to support tabletop collaboration. Compared to the work on traditional tables the interfaces must provide users certain advantages on the SmartBoard DViT tabletop system.
As the research started in April 1st 2004 a small test program was available to make the first steps. That program evolved from a previous research project. The program provided an interface with a bright gray background and two small transparent menu bars in the left and bottom edge containing two menu points, merely called Maps and Size. The menu bar here is not comparable to traditional menu bars in the windows of operating systems, it is more like a personal interaction unit in front of each collaborator’s place. The menu bar was implemented by Uta Hinrichs using a four-point interpolating subdivision curve algorithm [8]. Eight points were used, the so-called control points, and five subdivision levels to compute the sub points between the control points. These points are generated as follows: given a series of at least 4 points Pi, P’ can be obtained by:
P’2i = Pi
P’2i+1 = 1/16 [-(Pi-1) + 9(Pi) + 9(Pi+1) - (Pi+2)]
3.2 Beginning Stage
Figure 17: Illustration of the four-point subdivision algoritm [10]
Collaborative Work on SmartBoard Systems
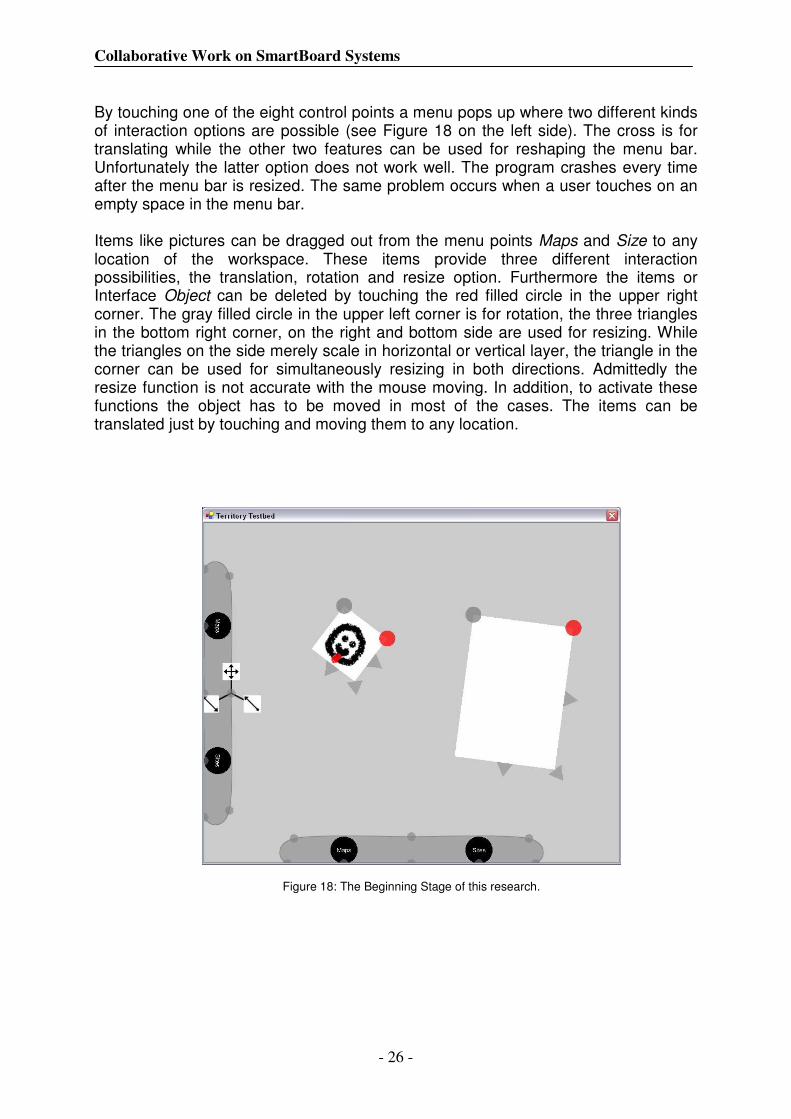
- 26 -
By touching one of the eight control points a menu pops up where two different kinds of interaction options are possible (see Figure 18 on the left side). The cross is for translating while the other two features can be used for reshaping the menu bar. Unfortunately the latter option does not work well. The program crashes every time after the menu bar is resized. The same problem occurs when a user touches on an empty space in the menu bar. Items like pictures can be dragged out from the menu points Maps and Size to any location of the workspace. These items provide three different interaction possibilities, the translation, rotation and resize option. Furthermore the items or Interface Object can be deleted by touching the red filled circle in the upper right corner. The gray filled circle in the upper left corner is for rotation, the three triangles in the bottom right corner, on the right and bottom side are used for resizing. While the triangles on the side merely scale in horizontal or vertical layer, the triangle in the corner can be used for simultaneously resizing in both directions. Admittedly the resize function is not accurate with the mouse moving. In addition, to activate these functions the object has to be moved in most of the cases. The items can be translated just by touching and moving them to any location.
Figure 18: The Beginning Stage of this research.

Collaborative Work on SmartBoard Systems
- 27 -
The first steps of Stage I were to remove the mistakes mentioned before and to update the environment design. The implementation is still based on the Beginning Stage program. There were no Storage, Group and Personal Territories as introduced above. So the next step was to create a design for the Storage and Personal Territories. There is no need to think about the Group Territory design because it is the space between the other territories. Storage Territory and Interaction A Storage Territory is a mobile graphical user interface widget that can be use to store items such as images, documents etc. It is controlled by a pen or mouse and it allows different kinds of interaction possibilities. The Storage Territory is created in form of a circle with a well-defined border. Interaction options like moving and reshaping were built into a menu that opens after touching one of the eight control points along the border. Of course these kinds of interactions influence the stored item inside. Figure 18 shows the menu that opens when the user is touching one of the eight control points. The menu fades out shortly after its use. Thus, the user is able to use the options in series and does not have to reopen the menu. Furthermore there was the question of how to present the symbols for the different kinds of interaction options. When there are similar interaction possibilities in the operating systems, it is useful to assume these symbols too.
As in the Beginning Stage the cross is for translating the Storage Territory. Also the items inside that area will be moved in the same way. This moving is very similar to the move option by clicking with the left mouse button onto the top of an operating system window (see figure 20).
3.3 Stage I
Figure 20: Moving of a Storage Territory including items.
Figure 19: The menu of the storage territories.
Collaborative Work on SmartBoard Systems
- 28 -
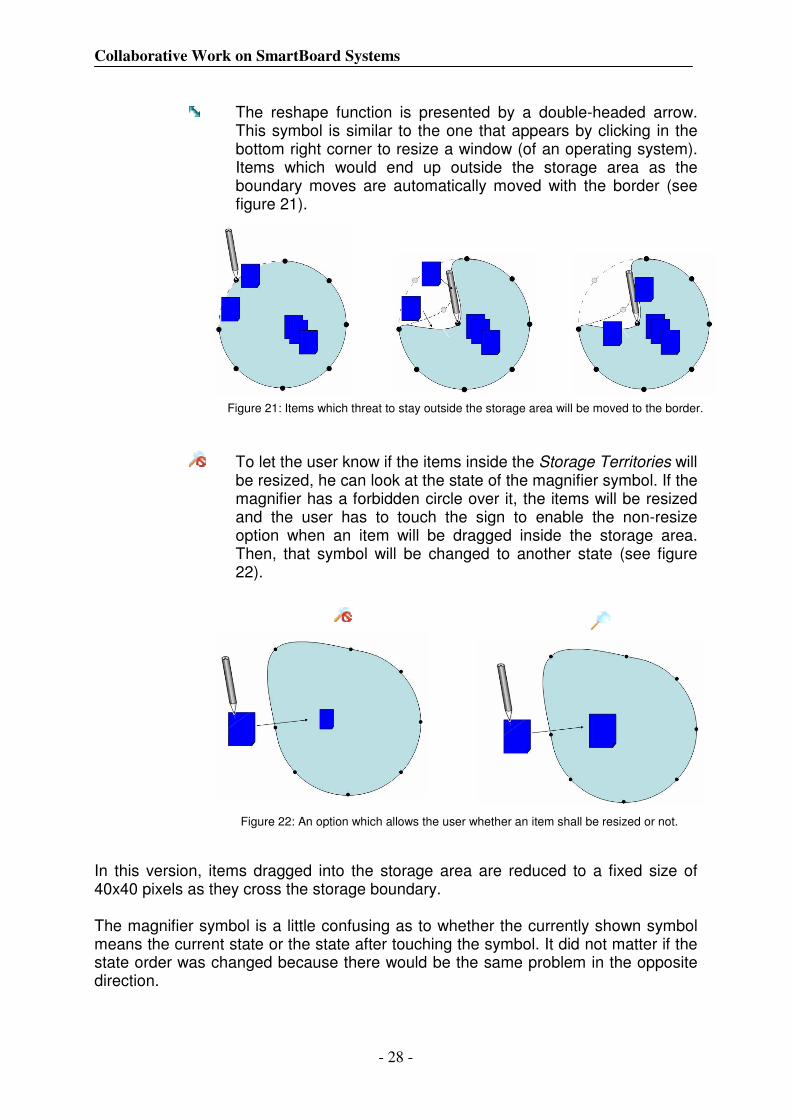
The reshape function is presented by a double-headed arrow. This symbol is similar to the one that appears by clicking in the bottom right corner to resize a window (of an operating system). Items which would end up outside the storage area as the boundary moves are automatically moved with the border (see figure 21).
To let the user know if the items inside the Storage Territories will be resized, he can look at the state of the magnifier symbol. If the magnifier has a forbidden circle over it, the items will be resized and the user has to touch the sign to enable the non-resize option when an item will be dragged inside the storage area. Then, that symbol will be changed to another state (see figure 22).
In this version, items dragged into the storage area are reduced to a fixed size of 40x40 pixels as they cross the storage boundary.
The magnifier symbol is a little confusing as to whether the currently shown symbol means the current state or the state after touching the symbol. It did not matter if the state order was changed because there would be the same problem in the opposite direction.
Figure 21: Items which threat to stay outside the storage area will be moved to the border.
Figure 22: An option which allows the user whether an item shall be resized or not.

Collaborative Work on SmartBoard Systems
- 29 -
Personal Territory and Interaction
A Personal Territory is a fixed graphical user interface widget in front of each user that can also be used to store personal items like images and documents. Each territory has a menu bar with different menu points. As mentioned in the Beginning Stage the items can be dragged out from the menu. This menu was extended with more menu points and an undo and storage button An undo function was developed to cancel deleted items. It happened many times that participants cleared an Interface Object by mistake. The only way to get it back was to drag out the whole pile from the according menu point again. If the user deletes an Interface Object it will be moved to a history structure where the last seven items are saved with all the states, positions, rotations, sizes, is the item inside or outside the storage or personal area. Then each user is able to undo the remove by opening the undo list and choosing the right item. There it does not matter which of the user had removed an item. It is shown in both undo lists and if one user brings it back it will be deleted in the history structure, and also in both undo list, otherwise there would be the risk that these deleted items will duplicated. The start environment comprises two Storage Territories. By using the storage button of the menu bar the users can add storage territories as much as they like. This option was provided because it is an individual decision how many areas somebody needs to clean his or her workspace. The Personal Territory also has 6 control points where a pop up menu opens when the user touched on it. That menu and functionality is similar to the Storage Territory. However because it is a fixed area the translate option in the pop up menu was removed. Otherwise, the personal areas, except the menu bar, conform to the storage territories in design and functionality.
Figure 24: Basic design of an Personal Territory
Figure 23: The menu of Personal Areas
Collaborative Work on SmartBoard Systems
- 30 -
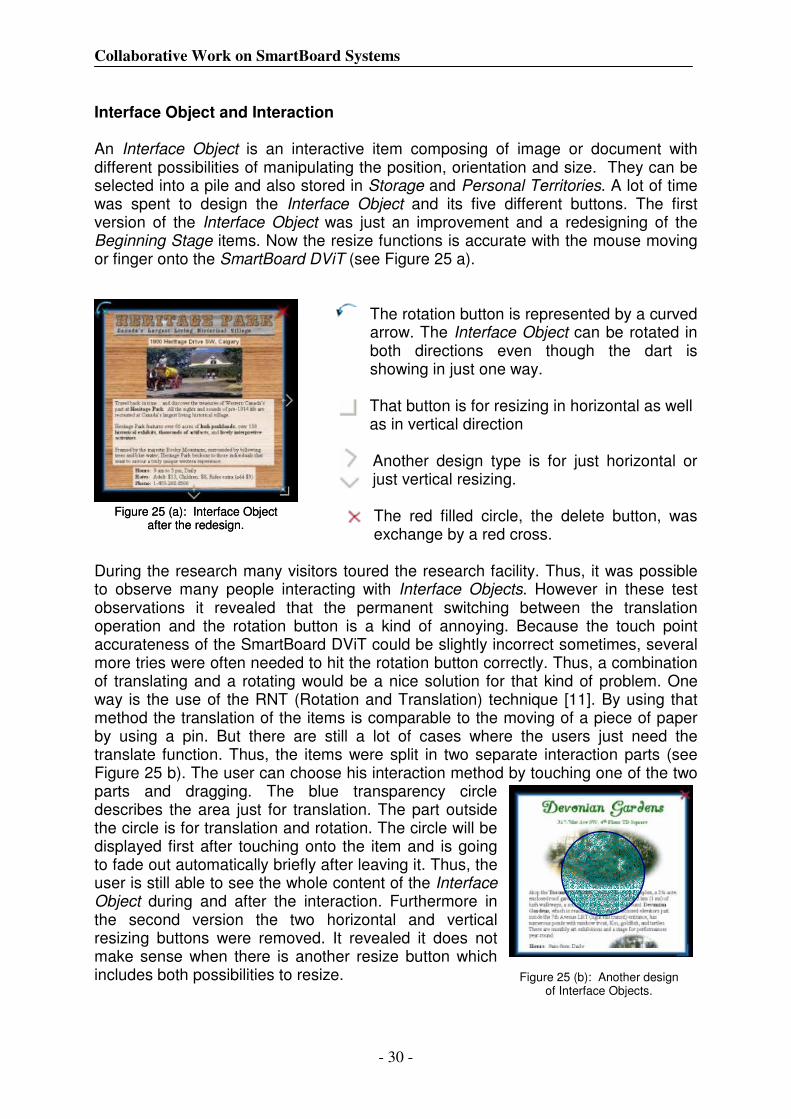
Interface Object and Interaction An Interface Object is an interactive item composing of image or document with different possibilities of manipulating the position, orientation and size. They can be selected into a pile and also stored in Storage and Personal Territories. A lot of time was spent to design the Interface Object and its five different buttons. The first version of the Interface Object was just an improvement and a redesigning of the Beginning Stage items. Now the resize functions is accurate with the mouse moving or finger onto the SmartBoard DViT (see Figure 25 a).
The rotation button is represented by a curved arrow. The Interface Object can be rotated in both directions even though the dart is showing in just one way.
That button is for resizing in horizontal as well as in vertical direction Another design type is for just horizontal or just vertical resizing. The red filled circle, the delete button, was exchange by a red cross.
During the research many visitors toured the research facility. Thus, it was possible to observe many people interacting with Interface Objects. However in these test observations it revealed that the permanent switching between the translation operation and the rotation button is a kind of annoying. Because the touch point accurateness of the SmartBoard DViT could be slightly incorrect sometimes, several more tries were often needed to hit the rotation button correctly. Thus, a combination of translating and a rotating would be a nice solution for that kind of problem. One way is the use of the RNT (Rotation and Translation) technique [11]. By using that method the translation of the items is comparable to the moving of a piece of paper by using a pin. But there are still a lot of cases where the users just need the translate function. Thus, the items were split in two separate interaction parts (see Figure 25 b). The user can choose his interaction method by touching one of the two parts and dragging. The blue transparency circle describes the area just for translation. The part outside the circle is for translation and rotation. The circle will be displayed first after touching onto the item and is going to fade out automatically briefly after leaving it. Thus, the user is still able to see the whole content of the Interface Object during and after the interaction. Furthermore in the second version the two horizontal and vertical resizing buttons were removed. It revealed it does not make sense when there is another resize button which includes both possibilities to resize.
Figure 25 (a): Interface Object
after the redesign.
Figure 25 (b): Another design
of Interface Objects.
Figure 25 (a): Interface Object
after the redesign.

Collaborative Work on SmartBoard Systems
- 31 -
Selected Piles During more test observations the participants often missed the possibility to move a pile of objects. By cleaning the workspace they had to move each item separately. Therefore the program was extended with the opportunity to select a pile of Interface Objects. In that the users were accustomed to the interaction with a single item, the selected pile interaction provides the same interaction possibilities. A small difference lies in the two button properties. If the user touches the delete button by now, the whole pile will removed and stored in the history structure. It can be brought back like it was described for a single item earlier in this chapter. To select a pile the user just has to drag a bounding box like it usually works in operating systems to select files in a file explorer. To deselect the pile the user has to make a double click, or double touch in the SmartBoard DViT system. As mentioned in chapter two the SmartBoard DViT does not know which of the two users is touching and it would bring a lot of confusion if the deselecting would work like in operating system, just by touching onto empty space. Figure 27 is showing the final version for Stage I with all mentioned Interface Object, Storage and Personal Territories, the menu bar with menu points and their history and storage buttons.
Figure 27: The final version of Stage I.
Figure 26: On the left side: selecting different items, right: a selected pile

Collaborative Work on SmartBoard Systems
- 32 -
Stage II involved a complete new implementation unlike Stage I. Of course many of the same algorithms and methods were used. But for the new requirements a different software concept was needed. Storage Territory Changes Now there are 2 different kinds of storage conditions while the personal areas including the menu bar were completely removed. These different territories are moveable storage areas, called Storage Bins, and the Fixed-Edge Storage Territory. Each territory type is used for different environment setting and composes of two parts; the transition zone and the container area (see Figure 28). The fixed-edge storage condition is an edge-based storage region along the periphery of the entire tabletop workspace while the Storage Bins are still moveable like it was used for Stage I (see figure 29). The items and the selected piles too are going to shrink when they will be dragged inside these areas. If an Interface Object is dragged into the container area it will shrink to 35 percent of the original size while the items and piles are going to have a size between this 35 percent and original size when they are dragged inside the transition zone which has a width of 30 pixels.
Furthermore the interaction possibilities changed a little bit too. Users can no longer turn off item shrinking in the storage areas. Thus, the option was removed in the menu which will opened by touching one of the control points. But a new option was developed for the Storage Bins, the resize function.
3.4 Stage II
Container
TransitionZone
Boundary
Figure 28: The different parts of Storage Territories.
Figure 29: Left a Fixed Storage Territory. The big border inside is the fuzzy boundary. The same for the Storage Bins on the right side.
Collaborative Work on SmartBoard Systems
- 33 -
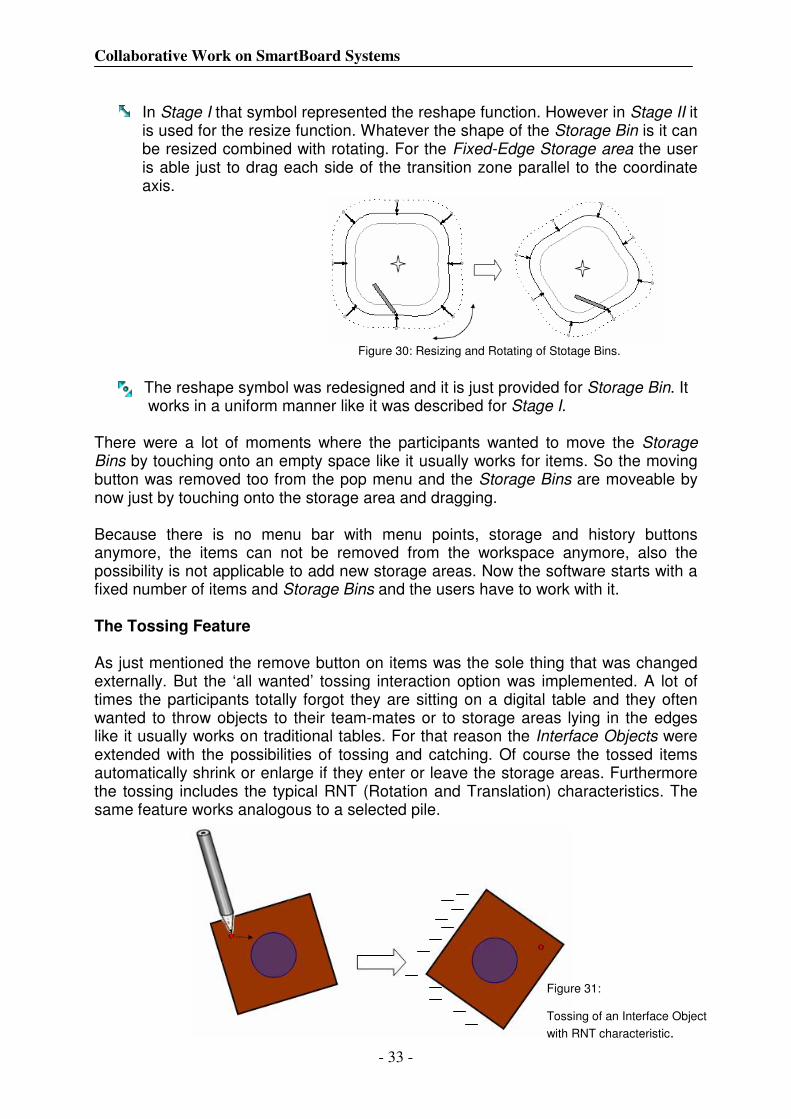
In Stage I that symbol represented the reshape function. However in Stage II it is used for the resize function. Whatever the shape of the Storage Bin is it can be resized combined with rotating. For the Fixed-Edge Storage area the user is able just to drag each side of the transition zone parallel to the coordinate axis.
The reshape symbol was redesigned and it is just provided for Storage Bin. It works in a uniform manner like it was described for Stage I.
There were a lot of moments where the participants wanted to move the Storage Bins by touching onto an empty space like it usually works for items. So the moving button was removed too from the pop menu and the Storage Bins are moveable by now just by touching onto the storage area and dragging. Because there is no menu bar with menu points, storage and history buttons anymore, the items can not be removed from the workspace anymore, also the possibility is not applicable to add new storage areas. Now the software starts with a fixed number of items and Storage Bins and the users have to work with it. The Tossing Feature As just mentioned the remove button on items was the sole thing that was changed externally. But the ‘all wanted’ tossing interaction option was implemented. A lot of times the participants totally forgot they are sitting on a digital table and they often wanted to throw objects to their team-mates or to storage areas lying in the edges like it usually works on traditional tables. For that reason the Interface Objects were extended with the possibilities of tossing and catching. Of course the tossed items automatically shrink or enlarge if they enter or leave the storage areas. Furthermore the tossing includes the typical RNT (Rotation and Translation) characteristics. The same feature works analogous to a selected pile.
Figure 30: Resizing and Rotating of Stotage Bins.
Figure 31: Tossing of an Interface Object
with RNT characteristic.

Collaborative Work on SmartBoard Systems
- 34 -

- 35 -
Chapter 4
4 Implementation Details This chapter describes some important methods and algorithms that were developed during this research. Furthermore a mathematic background will be introduced.
The software was implemented in Microsoft Visual C# and OpenGL by using Tao.OpenGL, a library binding C# and OpenGL. To realise the goals a high performance graphics platform was needed that enables real-time interaction. The graphic library integrated in C# was not up to standard. In that it is not supported by the hardware, the general speed, i.e. drawing geometric primitives like points, lines and polygons, is a kind of slow. Furthermore other important features such as the alpha blending, anti-aliasing or standard transformations like rotations, scaling and translations are not provided. Originally OpenGL should be just used for displaying the workspace environment with all their components. However it revealed that already implemented methods based on mathematical algorithms are very slow too, i.e. to detect if an Interface Object crossed the border of a Storage Territory or to calculate the percent how strong an item shall shrink in the transition zone of the storage bins. With the assistance of different OpenGL buffers, basically it concerned of the Frame- and Select Buffer, that kinds of problems could be minimized. In that the OpenGL Select Buffer became to the most important feature, it will be described more detailed in the following section.
The OpenGL Select Buffer is a selection mechanism in which the object geometry is transformed and compared against a selection sub-region of a window. Thereby the objects are identified by assigning them integer names. Each object will tested against the pick region; if the test succeeds a hit record is created to identify the object in an array, named the selecting array. In this way complex graphics object with complicated shape are very easy to detect whether they are below a mouse point.
4.1 General Problems
4.2 The OpenGL Select Buffer

Implementation Details
- 36 -
Basic steps:
� Set the glRenderMode to selection mode to detect the objects that are inside the viewing volume
� To do this, the scene has to draw in an extra pass: � Define the selection buffer – an array of hit records where the minimum
and maximum distance as well as the names of all selected objects will stored
� Start the OpenGL’s selection mode � Define a new viewing volume based on the mouse position using
gluPickMatrix() all objects that are drawn inside the viewing volume get a hit
� Enter the drawing loop: � Assign names (integers) to the objects � Draw the objects using normal OpenGL commands
� Leave the selection mode - OpenGL will report which objects ,including the names and distance, are in the set viewing volume
� Analyze the Select Buffer and perform appropriate action
Figure 32: Principle of OpenGL Select Buffer - all objects which are drawn in the small defined area become a hit
Implementation Details
- 37 -
( )( ) BottomLeftTopLeftFixHeightValuePercentreciprocal
TopRightTopLeftFixWidthValuePercentreciprocalMouseFixPottempTopLef
BottomLeftTopLeftMouseFixPoTopLeftFixHeight
TopRightTopLeftMouseFixPoTopLeftFixWidth
thCurrentWid
dthOriginalWiValuePercentreciprocal
∗∗−
∗∗−=
⋅=
⋅=
=
int
int
int
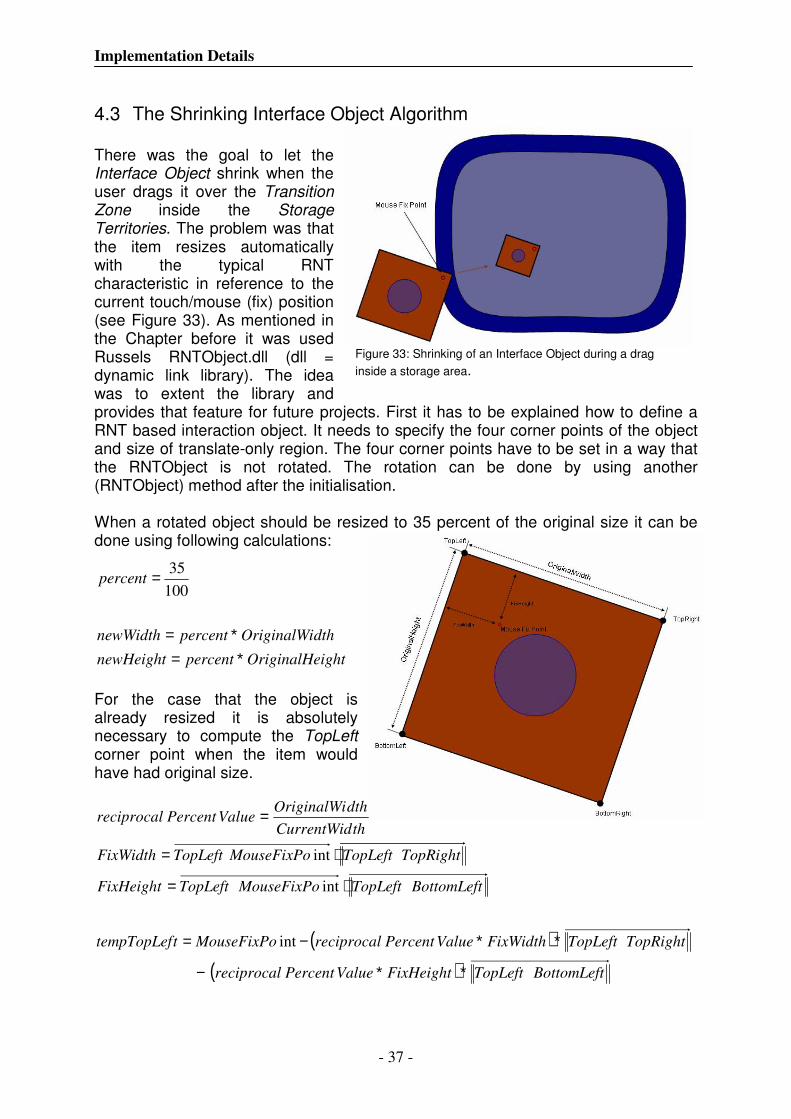
There was the goal to let the Interface Object shrink when the user drags it over the Transition Zone inside the Storage Territories. The problem was that the item resizes automatically with the typical RNT characteristic in reference to the current touch/mouse (fix) position (see Figure 33). As mentioned in the Chapter before it was used Russels RNTObject.dll (dll = dynamic link library). The idea was to extent the library and provides that feature for future projects. First it has to be explained how to define a RNT based interaction object. It needs to specify the four corner points of the object and size of translate-only region. The four corner points have to be set in a way that the RNTObject is not rotated. The rotation can be done by using another (RNTObject) method after the initialisation. When a rotated object should be resized to 35 percent of the original size it can be done using following calculations:
For the case that the object is already resized it is absolutely necessary to compute the TopLeft corner point when the item would have had original size.
4.3 The Shrinking Interface Object Algorithm
Figure 33: Shrinking of an Interface Object during a drag
inside a storage area.
ightOriginalHepercentnewHeight
dthOriginalWipercentnewWidth
percent
∗=∗=
=100
35
Implementation Details
- 38 -
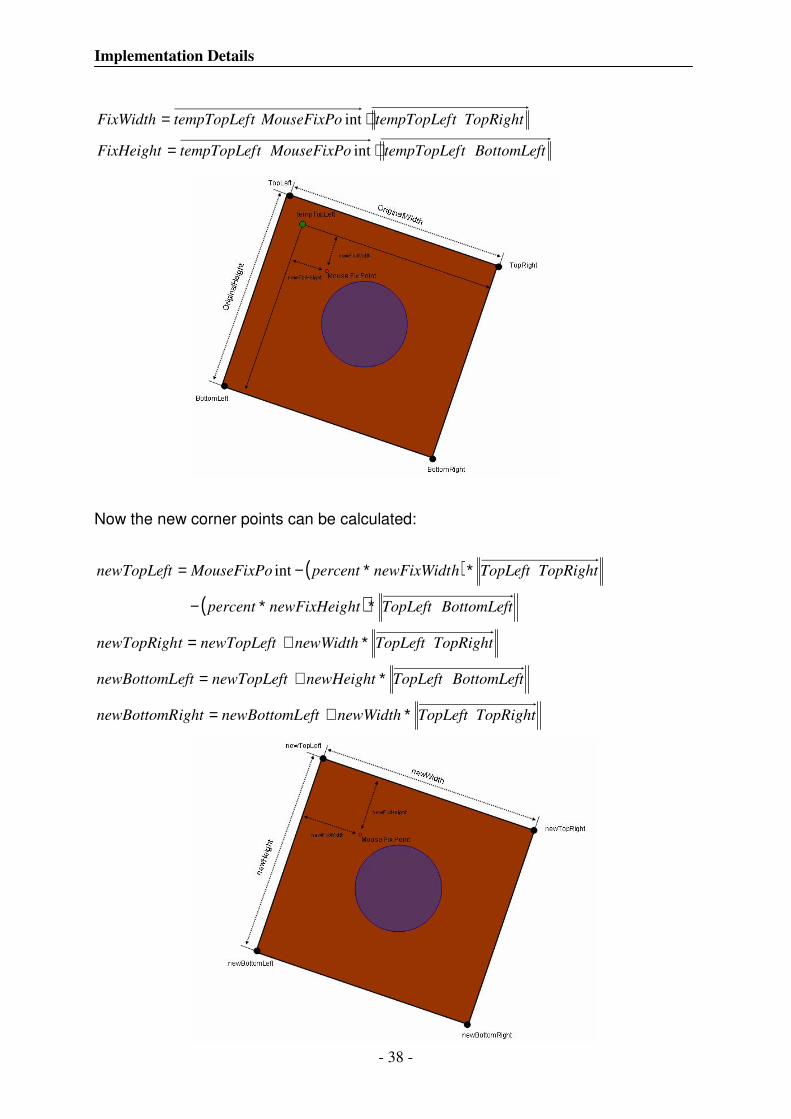
BottomLeftttempTopLefMouseFixPottempTopLefFixHeight
TopRightttempTopLefMouseFixPottempTopLefFixWidth
⋅=
⋅=
int
int
Now the new corner points can be calculated:
( )
( )
TopRightTopLeftnewWidtheftnewBottomLightnewBottomR
BottomLeftTopLeftnewHeightnewTopLefteftnewBottomL
TopRightTopLeftnewWidthnewTopLefttnewTopRigh
BottomLeftTopLefthtnewFixHeigpercent
TopRightTopLefthnewFixWidtpercentMouseFixPonewTopLeft
∗+=
∗+=
∗+=
∗∗−
∗∗−= int

Implementation Details
- 39 -
However at this state, the corner points have other values than the values inside the matrices of the RNTObject. Therefore it has to be reinitialised. In order to do it, the object must not be rotated. For this reason it has to be rotated back to initialise it again. The rotation angle and the centre point are also given by the RNTObject. To do the last step, it can be used the intern (RNTObject) method SetRotationAngle(angle) to reorientate it again. This procedure has to be
done for every touch/mouse step while the percent value decreases. In doing so the Interface Object will be shrunken fluent after it is entered into a storage area.
Implementation Details
- 40 -
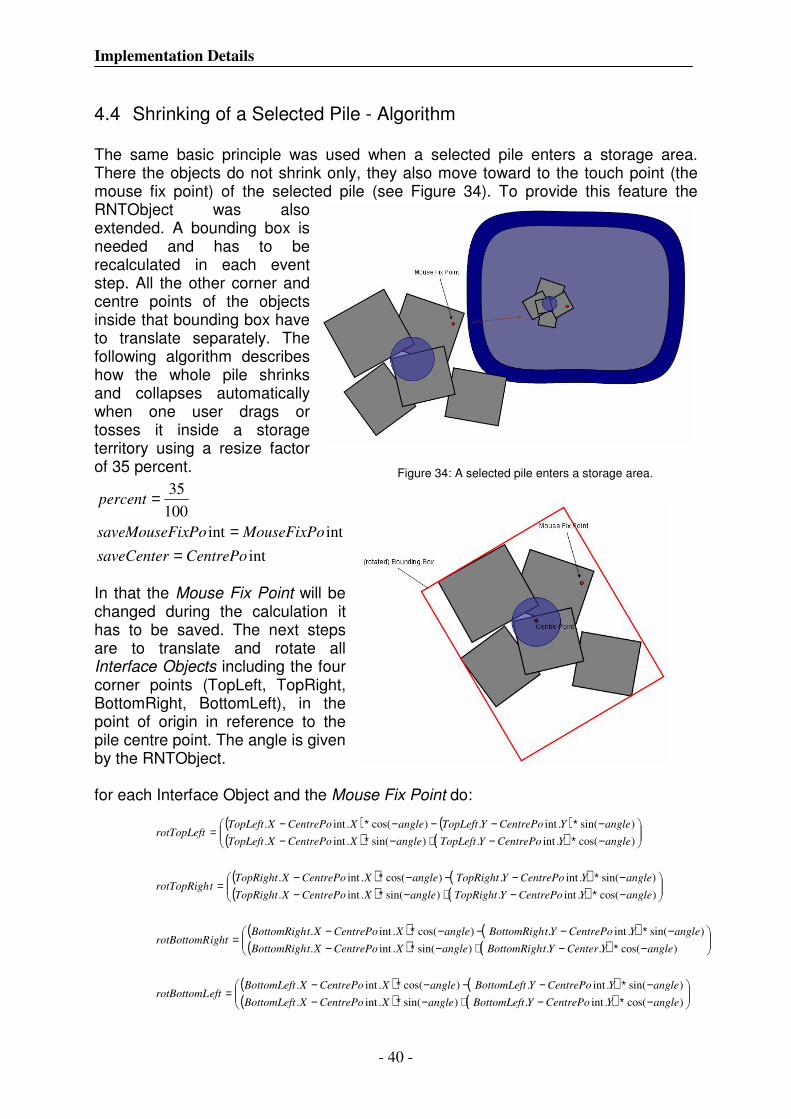
The same basic principle was used when a selected pile enters a storage area. There the objects do not shrink only, they also move toward to the touch point (the mouse fix point) of the selected pile (see Figure 34). To provide this feature the RNTObject was also extended. A bounding box is needed and has to be recalculated in each event step. All the other corner and centre points of the objects inside that bounding box have to translate separately. The following algorithm describes how the whole pile shrinks and collapses automatically when one user drags or tosses it inside a storage territory using a resize factor of 35 percent.
In that the Mouse Fix Point will be changed during the calculation it has to be saved. The next steps are to translate and rotate all Interface Objects including the four corner points (TopLeft, TopRight, BottomRight, BottomLeft), in the point of origin in reference to the pile centre point. The angle is given by the RNTObject. for each Interface Object and the Mouse Fix Point do:
4.4 Shrinking of a Selected Pile - Algorithm
Figure 34: A selected pile enters a storage area.
int
intint
100
35
CentrePosaveCenter
MouseFixPoixPosaveMouseF
percent
==
=
( ) ( )( ) ( )
( ) ( )( ) ( )
( ) ( )( ) ( )
( ) ( )( ) ( )
−∗−+−∗−−∗−−−∗−
=
−∗−+−∗−−∗−−−∗−
=
−∗−+−∗−−∗−−−∗−
=
−∗−+−∗−−∗−−−∗−
=
)cos(.int.)sin(.int.
)sin(.int.)cos(.int.
)cos(..)sin(.int.
)sin(.int.)cos(.int.
)cos(.int.)sin(.int.
)sin(.int.)cos(.int.
)cos(.int.)sin(.int.
)sin(.int.)cos(.int.
angleYCentrePoYBottomLeftangleXCentrePoXBottomLeft
angleYCentrePoYBottomLeftangleXCentrePoXBottomLefteftrotBottomL
angleYCenterYtBottomRighangleXCentrePoXtBottomRigh
angleYCentrePoYtBottomRighangleXCentrePoXtBottomRighightrotBottomR
angleYCentrePoYTopRightangleXCentrePoXTopRight
angleYCentrePoYTopRightangleXCentrePoXTopRighttrotTopRigh
angleYCentrePoYTopLeftangleXCentrePoXTopLeft
angleYCentrePoYTopLeftangleXCentrePoXTopLeftrotTopLeft
Implementation Details
- 41 -
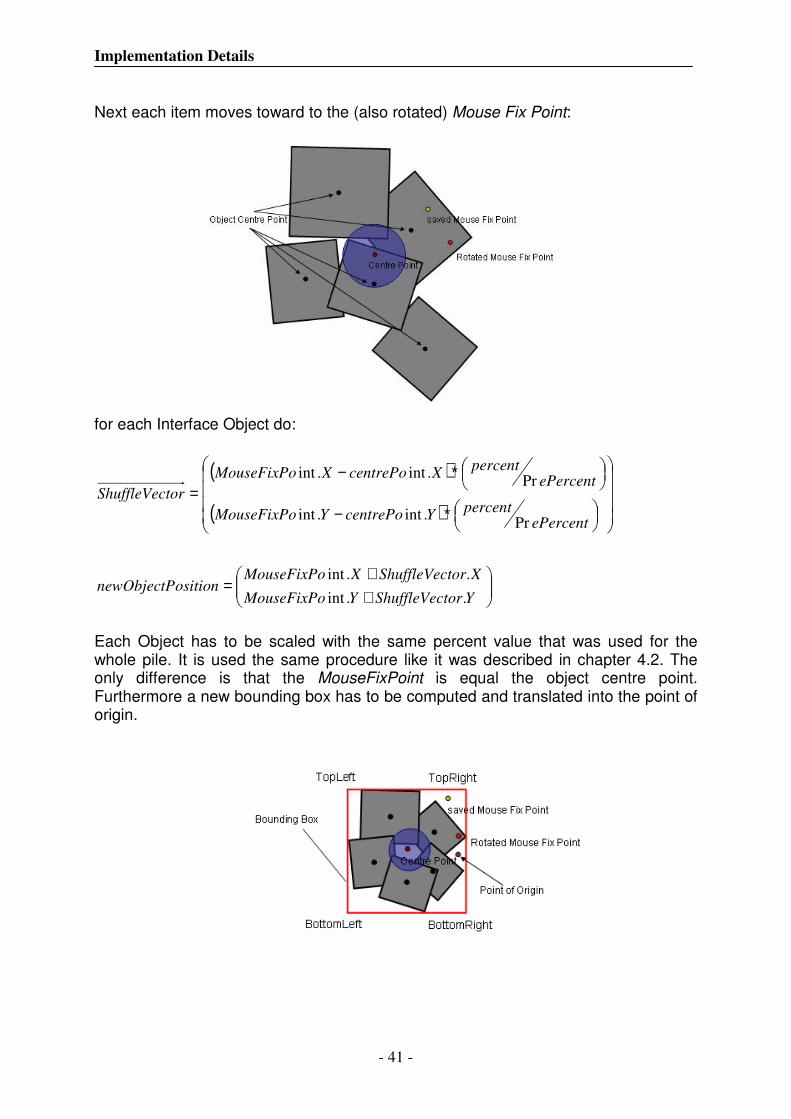
Next each item moves toward to the (also rotated) Mouse Fix Point: for each Interface Object do:
Each Object has to be scaled with the same percent value that was used for the whole pile. It is used the same procedure like it was described in chapter 4.2. The only difference is that the MouseFixPoint is equal the object centre point. Furthermore a new bounding box has to be computed and translated into the point of origin.
( )
( )
++
=
∗−
∗−
=
YtorShuffleVecYMouseFixPo
XtorShuffleVecXMouseFixPoositionnewObjectP
ePercentpercent
YcentrePoYMouseFixPo
ePercentpercent
XcentrePoXMouseFixPo
torShuffleVec
..int
..int
Pr.int.int
Pr.int.int
Implementation Details
- 42 -
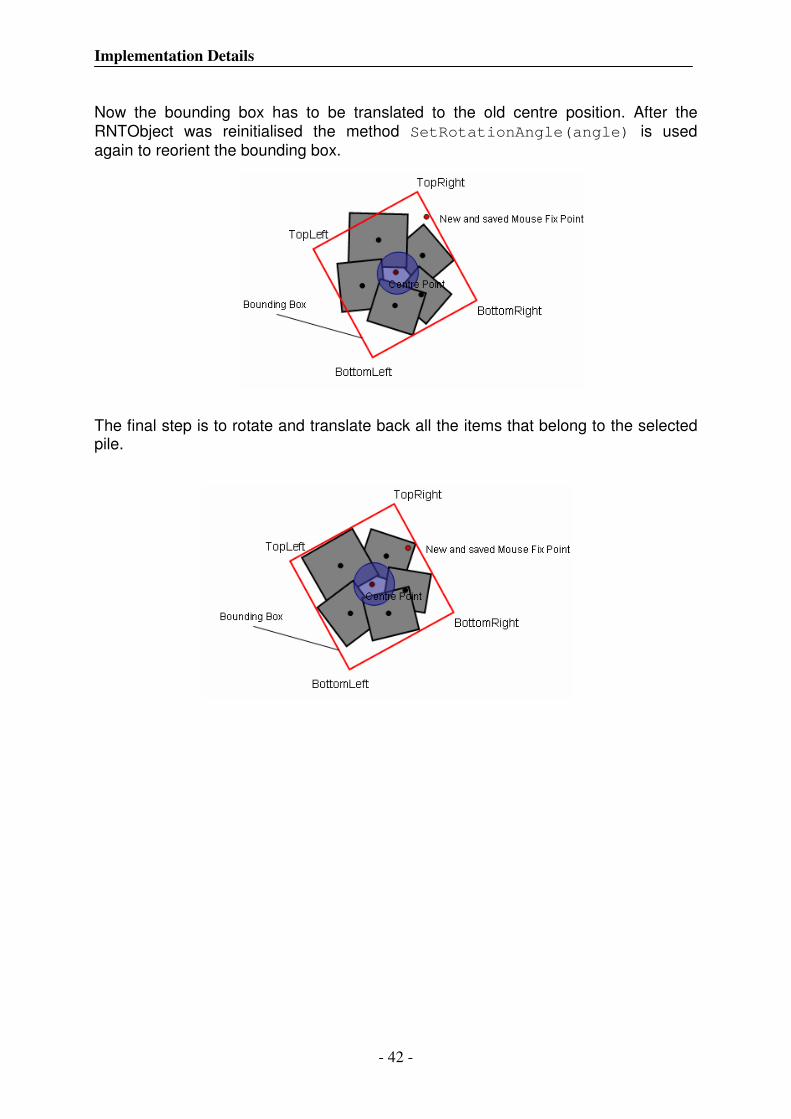
Now the bounding box has to be translated to the old centre position. After the RNTObject was reinitialised the method SetRotationAngle(angle) is used again to reorient the bounding box. The final step is to rotate and translate back all the items that belong to the selected pile.

Implementation Details
- 43 -
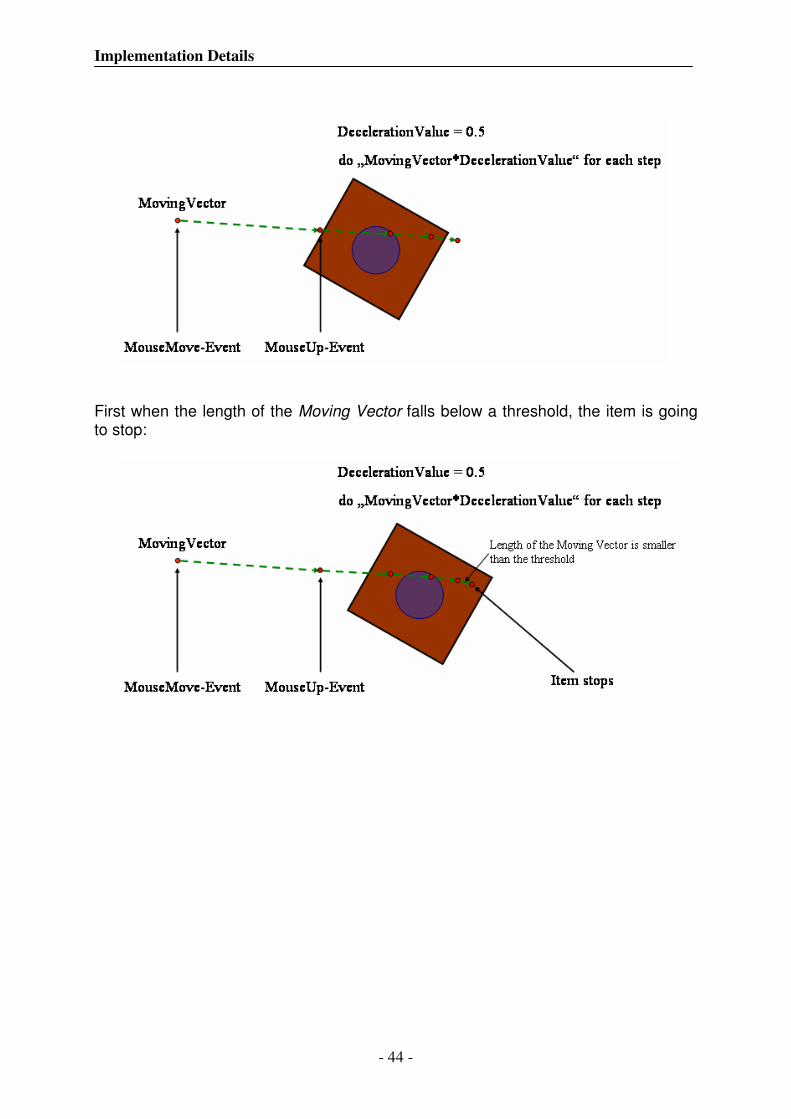
Another extension of the RNTObject is the Tossing feature. Thereby a lot of intern functions could be used that made the implementation much easier: After the user left the touch sensitive surface of the SmartBoard, the vector, named Moving Vector, between the two last touch positions can be calculated. To calculate the new position of the item, the Moving Vector has to be multiplied with a deceleration value, i.e. 0.5. Translate the object to the new position and repeat the steps:
4.5 The Tossing Algorithm
Implementation Details
- 44 -
First when the length of the Moving Vector falls below a threshold, the item is going to stop:

Implementation Details
- 45 -

- 46 -
Chapter 5
5 Conclusion and Future Work Chapter 5 will be given a summary about the report and describes a few ideas that were not able to implement anymore and might be realized in future projects.
Supported tabletop collaboration opens new dimension in human-computer interaction. It enables the possibilities to work in teams or small groups directly with digital data without wasting a significant amount of time before to type in all the content or scanning the material into the computer. In that are digital data, they can be changed and exchanged easy, i.e. translating, scaling or rotating of images. The environment is designed in an intuitive way and people do not have to spend a lot of time to learn the handling. The developed software provides user-friendly interaction opportunities to share large amount of items. Furthermore systems like the SmartBoard DViT or Mad Boxes provide multi-user interaction and open more possibilities for collaborative work. The results of this research were fairly satisfactory. The first phase involved the creation of a collaborative digital environment containing personal, group, and storage territories. Then, for the purposes of gaining further understanding of the design of storage territories, the second phase of this research involved the creation of a collaborative digital environment containing two alternate designs for storage territories. This environment was used for an observational user study. In this study, participants had to collaboratively create a set of photo collages on the SmartBoard DViT tabletop system. Most people easily understood how to interact with the digital items and it seemed that they did not have any major problems with the concept of the two different kinds of storage territories that were implemented. Each storage territory design supported different aspects of the collaborative activity. One storage area, called fixed storage, was very useful for the sorting phase at the beginning of the task. The collaborators found that it was very easy to organize the pictures into different parts of the fixed storage area. The second storage area, called mobile storage bins, was very useful for the arranging phase which occurred directly after the sorting phase of the task. Furthermore the tossing feature was very natural and intuitive to use on the table. It was nice to see that the participants used this function like it was normal to throw something like a pocket lighter over the table. Altogether the design of the complete environment was liked by most collaborators and it seemed they had fun working on the digital table.
5.1 Conclusion
Conclusion and Future Work
- 47 -
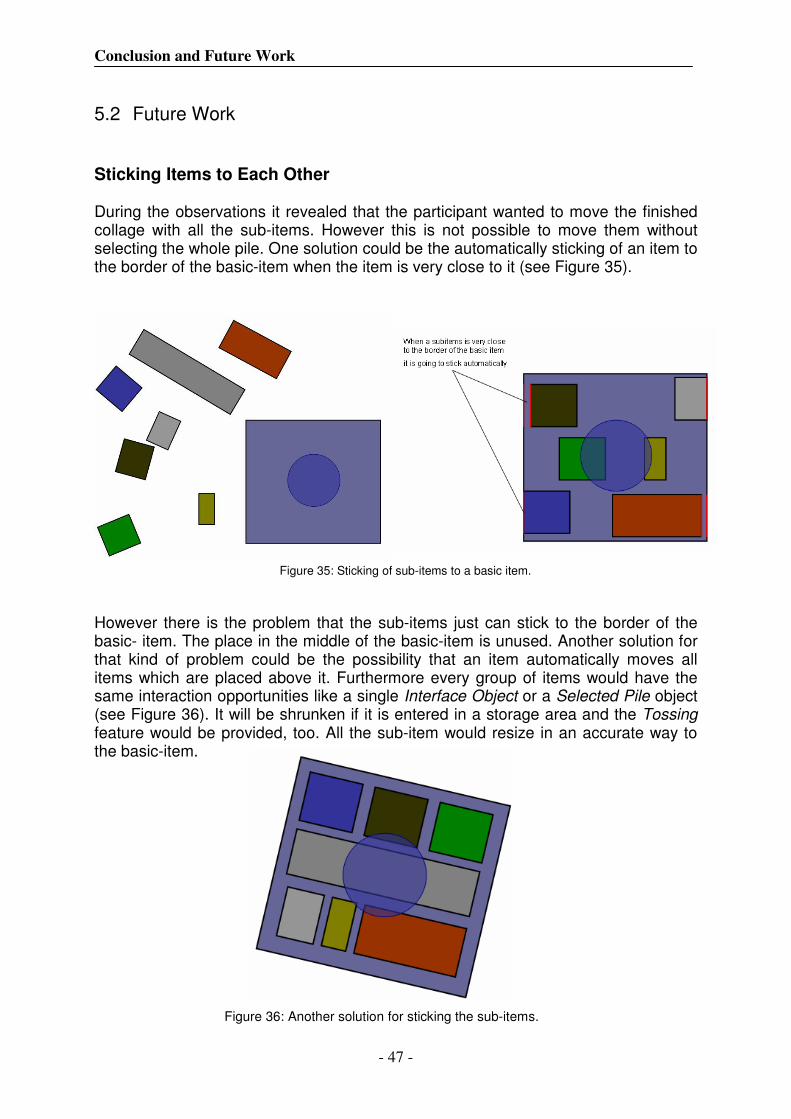
Sticking Items to Each Other During the observations it revealed that the participant wanted to move the finished collage with all the sub-items. However this is not possible to move them without selecting the whole pile. One solution could be the automatically sticking of an item to the border of the basic-item when the item is very close to it (see Figure 35).
However there is the problem that the sub-items just can stick to the border of the basic- item. The place in the middle of the basic-item is unused. Another solution for that kind of problem could be the possibility that an item automatically moves all items which are placed above it. Furthermore every group of items would have the same interaction opportunities like a single Interface Object or a Selected Pile object (see Figure 36). It will be shrunken if it is entered in a storage area and the Tossing feature would be provided, too. All the sub-item would resize in an accurate way to the basic-item.
5.2 Future Work
Figure 35: Sticking of sub-items to a basic item.
Figure 36: Another solution for sticking the sub-items.
Conclusion and Future Work
- 48 -
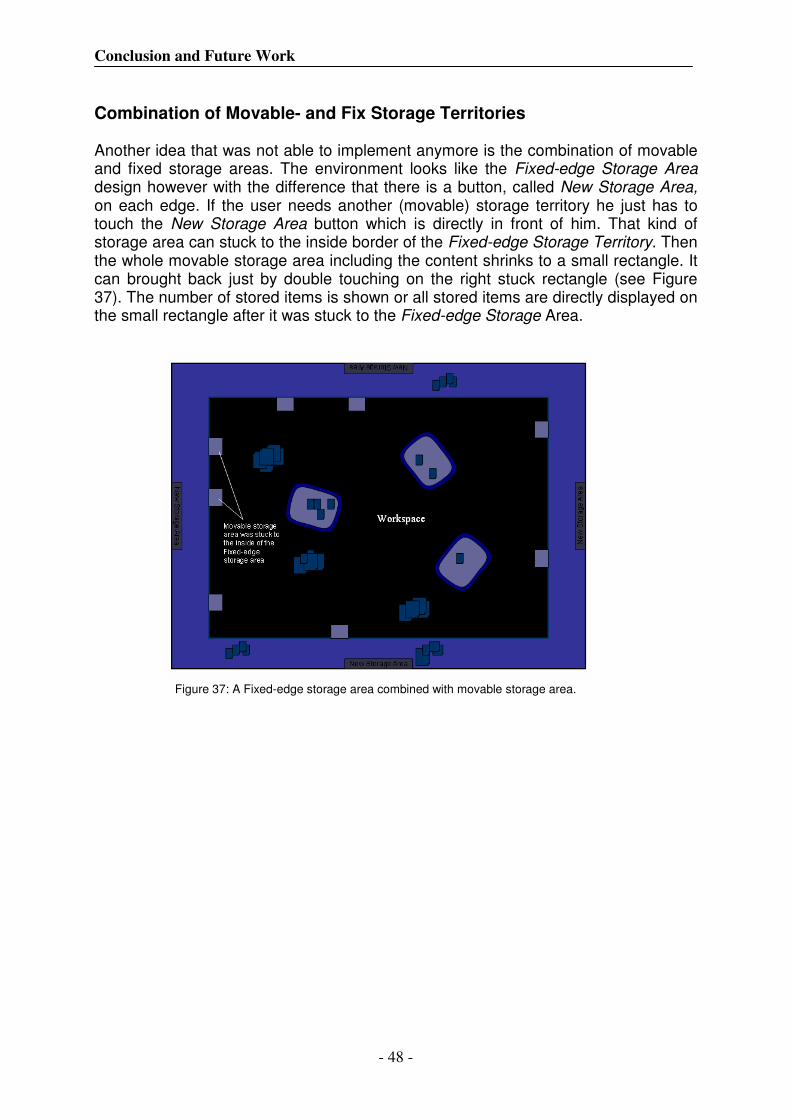
Combination of Movable- and Fix Storage Territories Another idea that was not able to implement anymore is the combination of movable and fixed storage areas. The environment looks like the Fixed-edge Storage Area design however with the difference that there is a button, called New Storage Area, on each edge. If the user needs another (movable) storage territory he just has to touch the New Storage Area button which is directly in front of him. That kind of storage area can stuck to the inside border of the Fixed-edge Storage Territory. Then the whole movable storage area including the content shrinks to a small rectangle. It can brought back just by double touching on the right stuck rectangle (see Figure 37). The number of stored items is shown or all stored items are directly displayed on the small rectangle after it was stuck to the Fixed-edge Storage Area.
Figure 37: A Fixed-edge storage area combined with movable storage area.

Conclusion and Future Work
- 49 -
- 50 -
Bibliography
[1] Scott, S.D., Carpendale, M.S.T, & Inkpen, K.M. (2004). Territoriality in Collaborative Tabletop Workspaces In: Proceedings of the ACM Conference on Computer-Supported Cooperative Work (CSCW'04), November 6-10, 2004, Chicago, IL, USA.
[2] Tandler, P., Prante, T., Muller-Tomfelde, C., Streitz, N., and Steinmetz, R. ConnecTable: Dynamic Coupling of Displays of the Flexible Creation of Shared Workspaces In: Proceedings of the 14. Annual ACM Symposium on User Interface Software and Technology (UIST’01), ACM Press (CHI Letters 3 (2)), 2001, pp. 11 – 20.
[3] Joseph F. McCarthy, Using Public Displays to Create Conversation Opportunities In: Workshop on Public, Community, and Situated Displays at the ACM 2002 Conference on Computer Supported Cooperative Work (CSCW 2002), 16 November 2002, New Orleans.
[4] Wolfgang Broll and Eckhard Meier and Thomas Schardt, The Virtual Round Table - A Collaborative Augmented Multi-User Environment In: Proceedings of The Third International Conference on Collaborative Virtual Environments (CVE'00), 2000, pp. 39 – 45.
[5] Norbert A. Streitz and Jörg Geißler and Torsten Holmer and Shin'ichi Konomi and Christian Müller-Tomfelde and Wolfgang Reischl and Petra Rexroth and Peter Seitz and Ralf Steinmetz, i-LAND: An Interactive Landscape for Creativity and Innovation In: Proceedings of the SIGCHI Conference on Human Factors in Computing Systems (CHI'99), 1999, pp. 120 – 127.
[6] Jörg Geißler, Shuffle, Throw or Take It! Working Efficiently with an Interactive Wall In: Conference Summary on Human Factors in Computing Systems (CHI’98), 1998, pp. 265 – 266.
[7] Smart Technologies Inc. Digital Vision Touch Technology – White Paper, http://www.smarttech.com/dvit/DViT_white_paper.pdf, as of May 3rd, 2004.

Bibliography
- 51 -
[8] Uta Hinrichts, Interface Currents: Supporting Co-Located Collaborative Work on Tabletop Displays, Technical Report: Interaction Lab, Department of Computer Science, University of Calgary 2500 University Dr. NW, Alberta, Canada, 2004.
[9] Ryan Schmidt and Eric Penner and Sheelagh Carpendale, Reconfigurable
Displays, Technical Report: Interactions Lab, Department of Computer Science University of Calgary 2500 University Dr. NW, Calgary, Alberta, Canada, 2004.
[10] Dyn, N., Levin, D., and Gregory, J. A Four-Point Interpolatory Subdivision Scheme for Curve Design. Computer Aided Geometric Design, 4(4), 1987, pp. 257– 268.
[11] Kruger, R., Carpendale, M.S.T., Tang, A., & Scott, S.D. (2004). Fluid Orientation on a Tabletop Display: Integrating Rotation and Translation. Technical Report: Interactions Lab, Department of Computer Science University of Calgary 2500 University Dr. NW, Calgary, Alberta, Canada, 2004-747-12.