real-time trna transit on single translating ribosomes at codon resolution
TRANSCRIPT
ARTICLES
Real-time tRNA transit on singletranslating ribosomes at codon resolutionSotaro Uemura1,2, Colin Echeverrıa Aitken1,3{, Jonas Korlach4, Benjamin A. Flusberg4, Stephen W. Turner4
& Joseph D. Puglisi1,3
Translation by the ribosome occurs by a complex mechanism involving the coordinated interaction of multiple nucleic acidand protein ligands. Here we use zero-mode waveguides (ZMWs) and sophisticated detection instrumentation to allowreal-time observation of translation at physiologically relevant micromolar ligand concentrations. Translation at each codonis monitored by stable binding of transfer RNAs (tRNAs)—labelled with distinct fluorophores—to translating ribosomes,which allows direct detection of the identity of tRNA molecules bound to the ribosome and therefore the underlyingmessenger RNA (mRNA) sequence. We observe the transit of tRNAs on single translating ribosomes and determine thenumber of tRNA molecules simultaneously bound to the ribosome, at each codon of an mRNA molecule. Our results showthat ribosomes are only briefly occupied by two tRNA molecules and that release of deacylated tRNA from the exit (E) site isuncoupled from binding of aminoacyl-tRNA site (A-site) tRNA and occurs rapidly after translocation. The methods outlinedhere have broad application to the study of mRNA sequences, and the mechanism and regulation of translation.
During translation, the ribosome progressively coordinates thedynamic interplay of tRNA and protein factors to decipher indi-vidual codons of an mRNA molecule and synthesize protein. Theribosome contains three tRNA-binding sites corresponding to threeadjacent codons1. As it elongates, the ribosome repetitively selectsaminoacylated tRNA molecules at the A site, orienting them forpeptide-bond formation with peptidyl tRNA positioned in the P site.Peptidyl transfer is followed by the coordinated movement of the A-and P-site tRNAs into the P and E sites, respectively, thus preparingthe deacylated tRNA for dissociation from the ribosome. During thistranslocation step, which is catalysed by the GTPase EF-G, the ribo-some simultaneously steps along the mRNA, positioning the nextcodon in the A site and preparing to select another aminoacylatedtRNA.
Although dynamic changes in ligand occupancy and positioning inthe A, P and E sites are intimately tied to the mechanism oftranslation2–5, the timing and relation of aminoacylated tRNA arrivalat the A site, as a ternary complex with EF-TuNGTP, and dissociationof deacylated tRNA from the E site remain unknown. Single-mole-cule fluorescence methods have recently probed dynamics duringtranslation, such as the selection of tRNA during elongation andribosomal conformational changes (reviewed in ref. 6). However,traditional single-molecule fluorescence only allows observation offluorescent ligands in the nanomolar range, well below the physio-logical micromolar concentration of most components of the trans-lational apparatus.
Real-time translation in ZMWs
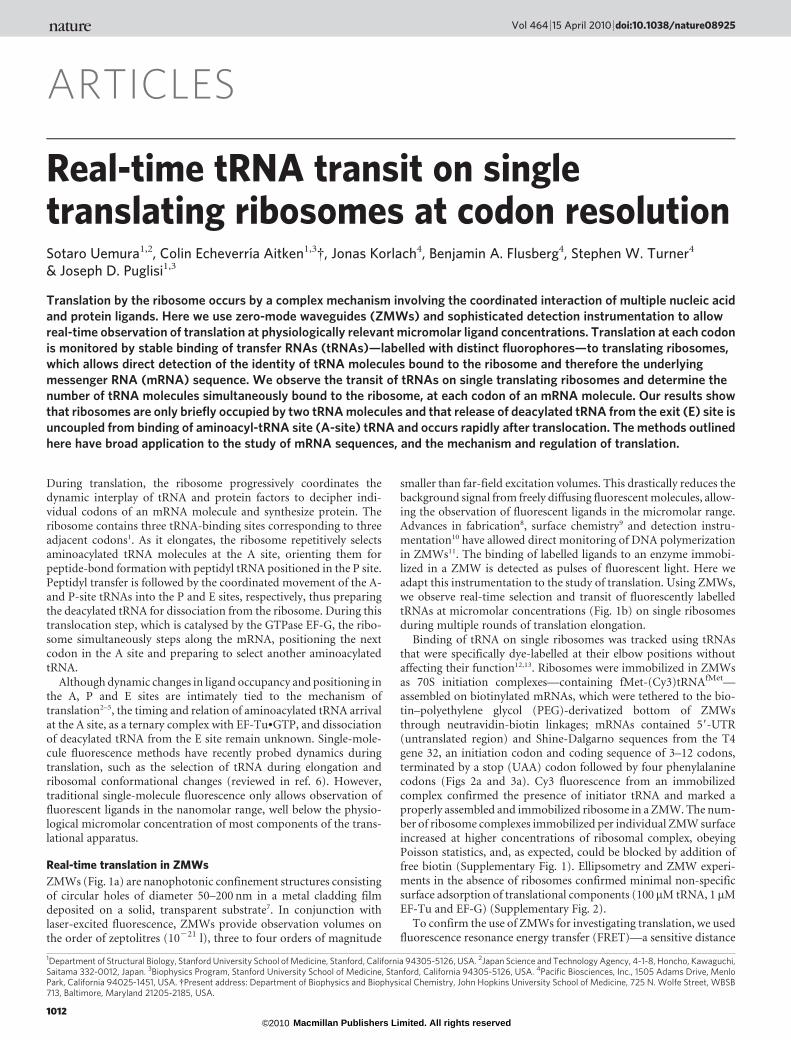
ZMWs (Fig. 1a) are nanophotonic confinement structures consistingof circular holes of diameter 50–200 nm in a metal cladding filmdeposited on a solid, transparent substrate7. In conjunction withlaser-excited fluorescence, ZMWs provide observation volumes onthe order of zeptolitres (10221 l), three to four orders of magnitude
smaller than far-field excitation volumes. This drastically reduces thebackground signal from freely diffusing fluorescent molecules, allow-ing the observation of fluorescent ligands in the micromolar range.Advances in fabrication8, surface chemistry9 and detection instru-mentation10 have allowed direct monitoring of DNA polymerizationin ZMWs11. The binding of labelled ligands to an enzyme immobi-lized in a ZMW is detected as pulses of fluorescent light. Here weadapt this instrumentation to the study of translation. Using ZMWs,we observe real-time selection and transit of fluorescently labelledtRNAs at micromolar concentrations (Fig. 1b) on single ribosomesduring multiple rounds of translation elongation.
Binding of tRNA on single ribosomes was tracked using tRNAsthat were specifically dye-labelled at their elbow positions withoutaffecting their function12,13. Ribosomes were immobilized in ZMWsas 70S initiation complexes—containing fMet-(Cy3)tRNAfMet—assembled on biotinylated mRNAs, which were tethered to the bio-tin–polyethylene glycol (PEG)-derivatized bottom of ZMWsthrough neutravidin-biotin linkages; mRNAs contained 59-UTR(untranslated region) and Shine-Dalgarno sequences from the T4gene 32, an initiation codon and coding sequence of 3–12 codons,terminated by a stop (UAA) codon followed by four phenylalaninecodons (Figs 2a and 3a). Cy3 fluorescence from an immobilizedcomplex confirmed the presence of initiator tRNA and marked aproperly assembled and immobilized ribosome in a ZMW. The num-ber of ribosome complexes immobilized per individual ZMW surfaceincreased at higher concentrations of ribosomal complex, obeyingPoisson statistics, and, as expected, could be blocked by addition offree biotin (Supplementary Fig. 1). Ellipsometry and ZMW experi-ments in the absence of ribosomes confirmed minimal non-specificsurface adsorption of translational components (100 mM tRNA, 1mMEF-Tu and EF-G) (Supplementary Fig. 2).
To confirm the use of ZMWs for investigating translation, we usedfluorescence resonance energy transfer (FRET)—a sensitive distance
1Department of Structural Biology, Stanford University School of Medicine, Stanford, California 94305-5126, USA. 2Japan Science and Technology Agency, 4-1-8, Honcho, Kawaguchi,Saitama 332-0012, Japan. 3Biophysics Program, Stanford University School of Medicine, Stanford, California 94305-5126, USA. 4Pacific Biosciences, Inc., 1505 Adams Drive, MenloPark, California 94025-1451, USA. {Present address: Department of Biophysics and Biophysical Chemistry, John Hopkins University School of Medicine, 725 N. Wolfe Street, WBSB713, Baltimore, Maryland 21205-2185, USA.
Vol 464 | 15 April 2010 | doi:10.1038/nature08925
1012Macmillan Publishers Limited. All rights reserved©2010
indicator—to observe the path of incoming A-site tRNA accom-modation on the ribosome. We have previously used traditionalsingle-molecule total internal reflection fluorescence (TIRF) to detectFRET between fMet-(Cy3)tRNAfMet in the P site and Phe-(Cy5)tRNAPhe in the A site12,13. We repeated these experiments usingZMW-immobilized ribosome complexes and excitation at 532 nm.Using FRET values calibrated in ZMWs, we matched the values andtimescales observed in previous tRNA–tRNA FRET experiments attRNA concentrations up to 600 nM, more than 20-fold higher thanpreviously measured (Supplementary Figs 3 and 4). Consistent withprevious single-molecule studies, bimolecular arrival rates of ternarycomplex to surface-bound ribosomes were decreased by an order ofmagnitude compared with bulk rates, but unimolecular rates wereunaffected. Decreased association rates are likely due to steric andsurface effects14, but ribosomal function is clearly maintained. Theseresults confirmed the functionality of ZMW-immobilized ribosomesand our ability to detect fluorescent tRNA-binding events on indi-vidual ribosomes at ternary complex concentrations greater than100 nM.Detecting tRNA binding in real time. The basic steps of translationwere then observed through direct detection of fluorescently labelledtRNA binding on single ribosomes immobilized in ZMWs. We
monitored the binding of ternary complexes Phe-(Cy5)tRNAPheNEF-TuNGTP and unlabelled Lys-tRNALysNEF-TuNGTP or labelled Lys-(Cy2)tRNALysNEF-TuNGTP to ribosomes programmed by mRNAsencoding four amino acids (MFFF or MFKF) (Fig. 2a, b); ZMWs wereilluminated simultaneously with 488-, 532- and 642-nm excitation.Initiated ribosomes were identified by the presence of fMet-(Cy3)-tRNAfMet; subsequent real-time arrival and occupation of tRNAs ontranslating ribosomes were detected as fluorescent pulses of appropri-ate colour10.
Each tRNA pulse marks the arrival and accommodation of thattRNA within the ribosomal A site. The arrival time of the first elon-gator tRNA encoded by the mRNA marks the transition of ribosomesinto elongation. The time between subsequent tRNA pulse arrivalsdelineates one round of translational elongation and arrival of tRNAat the next codon (Fig. 1b). This time should depend on the concen-tration of EF-G, which controls the rate of translocation to the nextcodon. The duration of each tRNA pulse represents the transit time ofthat tRNA through the A, P and E sites, followed by dissociation fromthe ribosome. At the low (,50 nM) factor and tRNA concentrationsnormally used for single-molecule experiments, photobleaching ofribosome-bound tRNA can also terminate a pulse. Because eachpulse describes binding of one tRNA molecule on the ribosome, full
a b
Fluo
resc
ence
inte
nsity
FirsttRNA arrival
SecondtRNA arrival
Between tRNA arrival
tRNA transit time
Photobleaching
Glass substrate
ZMW
50S
30S
Biotin–PEG
mRNA
Aluminiumcladding
GGTP
Tu GTPTu
G
G
G
Delivery components
GTP
GTPGTP
GTP
Excitation
ZMW
50S50S
30S30S
BioBiotintin–PEPEGG
mRNA
ThirdtRNA arrival
Time
tRN
A n
umb
erd
etec
ted
2
1
0
3
FirsttRNA arrival
SecondtRNA arrival
BetweentRNA arrival
One roundof elongation
A-sitearrival
E-site dissociation
Phe-(Cy5)tRNAPhePhe-(Cy5)tRNAPhePhe-(Cy5)tRNAPhe
Lys-(Cy2)tRNALysLys-(Cy2)tRNALysLys-(Cy2)tRNALysPhe-(Cy5)tRNAPhePhe-(Cy5)tRNAPhePhe-(Cy5)tRNAPhe
fMet-(Cy3)tRNAfMetfMet-(Cy3)tRNAfMetfMet-(Cy3)tRNAfMet
Time
Delivery
Low ternarycomplex
concentration
High ternarycomplex
concentration
Fluorescence Fluorescence
fMet-(Cy3)tRNAfMet
Phe-(Cy5)tRNAPhe
Lys-(Cy2)tRNALys
fMet-(Cy3)tRNAfMetfMet-(Cy3)tRNAfMetfMet-(Cy3)tRNAfMet
Delivery
Phe-(Cy5)tRNAPhePhe-(Cy5)tRNAPhePhe-(Cy5)tRNAPhe
Lys-(Cy2)tRNALysLys-(Cy2)tRNALysLys-(Cy2)tRNALys
Phe-(Cy5)tRNAPhePhe-(Cy5)tRNAPhePhe-(Cy5)tRNAPhe
Lys-(Cy2)tRNALysLys-(Cy2)tRNALysLys-(Cy2)tRNALys
Phe-(Cy5)tRNAPhePhe-(Cy5)tRNAPhePhe-(Cy5)tRNAPhe
Fluo
resc
ence
inte
nsity
Figure 1 | Translation in ZMWs. a, Experimental setup. ZMWs arecylindrical nanostructures with varying diameters (,50–200 nm). Thealuminium side wall and quartz bottom surfaces are derivatized to allowspecific biotin–streptavidin interactions on the quartz surface and to blocknon-specific interactions of molecules with ZMWs9,11. Ribosomal complexesare specifically immobilized in the bottom of derivatized ZMWs usingbiotinylated mRNAs. Ternary complexes Cy5-labelled Phe-tRNAPhe-EF-Tu(GTP) and Cy2-labelled Lys-tRNALys-EF-Tu(GTP), along with EF-G(GTP), are delivered to a ZMW surface-immobilized, initial ribosomecomplex containing Cy3-labelled fMet-tRNAfMet. Fluorescence is excited byillumination at 488, 532 and 642 nm, and Cy2, Cy3 and Cy5 fluorescence aresimultaneously detected using previously described instrumentation10,11.
b, Expected signal sequence. Initiation complexes are detected byfluorescence of fMet-(Cy3)tRNAfMet bound at an initiation codon.Fluorescent tRNAs are delivered as ternary complexes. Arrival of Phe-(Cy5)tRNAPhe or Lys-(Cy2)tRNALys at the ribosomal A site is marked by ared or blue fluorescent pulse. At low concentrations of ternary complex,tRNA arrival times are slow (much longer than 1 s), and Cy5- or Cy2-labelledtRNAs can photobleach on the ribosome while waiting for translocation. Inthe absence of photobleaching, the length of a pulse represents the transittime of that tRNA on the ribosome. At high concentrations of ternarycomplex, tRNA arrival times are fast (much less than 1 s), and fluorescentpulses are overlapped, which indicates simultaneous occupancy by two tRNAmolecules. The tRNA occupancy count is shown below the schematic trace.
NATURE | Vol 464 | 15 April 2010 ARTICLES
1013Macmillan Publishers Limited. All rights reserved©2010

translation is detected as a series of pulses corresponding to thenumber and sequential identity of codons in the mRNA.
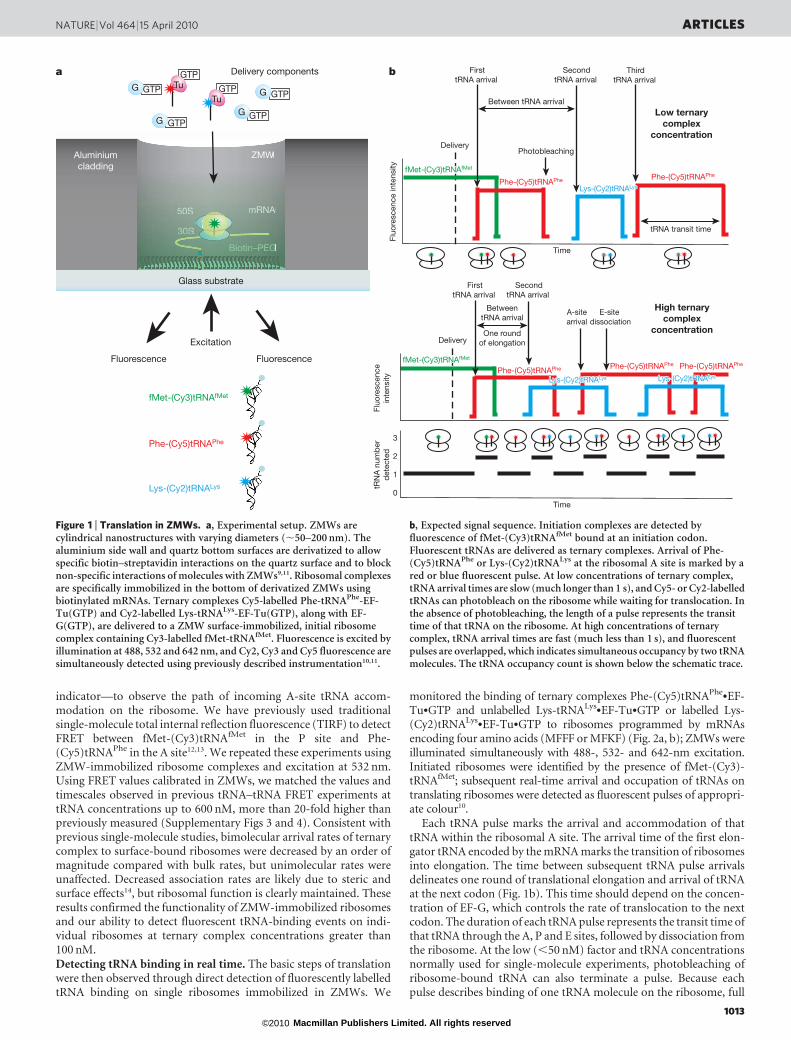
To define the order and identity of these pulses, initial experimentswere performed at concentrations of 30 nM EF-G/30 nM ternarycomplex, with translation times of about 20 s per codon, which allowsP-site tRNAs to photobleach (average lifetime 13.7 s) before thearrival of A-site tRNA. In the absence of EF-G, translation of theMFFF message stalls upon arrival of the first tRNAPhe (Fig. 2b).Cy3 fluorescence is followed only by a single red pulse, indicatingbinding of a single Phe-(Cy5)tRNAPhe and no subsequent transloca-tion (Fig. 2b). In the presence of 30 nM EF-G, three distinct redfluorescent pulses are observed (Fig. 2a, b). The number of fluor-escent tRNA pulses is similarly sensitive to the identity of the A-sitecodon and the presence of correct ternary complex. Translation ofthe MFKF mRNA in the presence of EF-G but absence of Lys-tRNALys
ternary complex results in a single fluorescence pulse following theCy3 signal, whereas two red pulses are observed upon addition ofunlabelled Lys-tRNALys ternary complex; finally, two red pulses sepa-rated by a blue pulse are observed upon inclusion of fluorescentlylabelled Lys-(Cy2)tRNALys ternary complex. In all traces, brief single-frame (100 ms) bursts in fluorescence can be observed (Fig. 2a).These events were only observed in the presence of 70S ribosomalcomplexes, and likely represent non-cognate ternary complex sam-pling at an A-site codon (see below). These results confirm our abilityto track translation through sequential stable tRNA-binding events.Monitoring translation in real time. These tRNA-binding signalswere then used to observe full translation of distinct heteropolymericmRNAs encoding 13 amino acids (M(FK)6 and M(FKK)4). Thesequence of the mRNA is readily distinguished from the pattern offluorescent pulses (Fig. 3a). The number of events observed relates thenumber of codons translated on each mRNA. At 200-nM ternarycomplex and 500-nM EF-G, ribosomes translate the entire mRNA(Fig. 3b, red bars). The duration of most tRNA pulses is not limitedby photobleaching at these high concentrations, which suggests thatthe lifetime of each tRNA signal provides a signal for its transit time onthe ribosome (see below). Addition of erythromycin, which binds tothe exit tunnel of the ribosome15, blocks translation at six to eightamino acids16, as expected (Fig. 3b). These data strongly support thedirect link between the pattern of tRNA pulses observed in the ZMWand translation.
The arrival of tRNAs at single ribosomes tracks the dynamic com-position of the translational apparatus in real time. First tRNA arrivalevents are fast, as they do not depend on translocation. As predicted, the
time between subsequent tRNA arrivals decreases with increasing EF-Gconcentrations between 30 and 500 nM (Fig. 3c). For codons 2–12, thetRNA transit time is also strongly dependent on EF-G, as it represents atleast two rounds of peptide-bond formation and translocation(Fig. 3d). Inhibition of EF-G by fusidic acid, which stabilizes EF-GNGDP on the ribosome after translocation17, lengthens the transittime by 3.3-fold (Fig. 3d). Arrival of the ribosome at the UGA stopcodon after translation of 12 codons leads to a long pulse from theremaining tRNA in the P site of the stalled ribosome. The dwell time forthis last tRNA is 4.9-fold longer than for preceding pulses, whichemphasizes that photobleaching of the P-site tRNA is not a significantproblem using our approach at high-factor concentrations: at 500 nMEF-G, the mean lifetime (4.1 s) of tRNAs bound to the ribosome issignificantly shorter than the photobleaching lifetime (17.3 s) observedin experiments at lower concentrations. While paused on the stopcodon, tRNA sampling events are observed with short lifetimes(,50 ms for Phe-(Cy5)tRNAPhe or Lys-(Cy2)tRNALys) (Fig. 4a, b),which are clearly distinguishable from real tRNA transit events ofmore than 1 s. These sampling events are consistent with non-cognateternary-complex interaction4 with the A site, and their frequency isproportional to ternary-complex concentration (Fig. 4c). All trendsdiscussed above were independent of mRNA sequence.
The total translation time for different mRNAs is characterized bythe arrival times of tRNAs at different codons. As expected, trans-lation rates depend on the concentrations of ternary complex andEF-G. For the M(FK)6 mRNA (Fig. 3e), translation rates increasedfrom 0.08 to 0.4 s21 for EF-G concentrations ranging from 30 and500 nM (200 nM ternary complex). Likewise, increasing the concen-tration of ternary complex also increased the overall translation rate.At the highest concentrations of ternary complex and EF-G, thetranslation rate was nearly one codon per second, approaching thatobtained using cell extracts in vitro18. When 30S pre-initiation com-plexes are immobilized in ZMWs and translation is initiated by addi-tion of 50S subunits, ternary complex and EF-G—requiringinitiation before protein synthesis (Supplementary Fig. 5)—the over-all translation rate is unaffected, except for a delay (12 s) in arrival ofthe first tRNA. This delay is consistent with the timescale of 50Ssubunit joining during initiation19, before progression to elongation.
Our approach allows analysis of translational rates at each codonof an mRNA molecule. Arrival of the first tRNA is independent of EF-G concentration, as expected. However, the first EF-G catalysedtranslocation of the ribosome may become the slowest step in elonga-tion, as revealed by the time between arrivals of tRNA molecules
0
0.4
0.8
1.2
Den
sity
1 2 3 1 2 3Codons translated
0
0.4
0.8
1.2
Den
sity
1 2 3 1 2 3Codons translated
– EF-G + EF-G
– Lys TC + Lys TC
0
0.4
0.8
1.2
Den
sity
1 2 3
+ Lys TC
Codons translated
AUGUUU UUUUAA(UUU)4
M F F
- AAA
K
AUGUUU UUU UUUUAA(UUU)4
M F F F
5′ Biotin-UTR-
MFFF
4,000
0
8,000
First F Second F Third F
300250200150100500Time (s)
Fluo
resc
ence
inte
nsity
0
4,000
8,000
0
MFKF
30025020015010050Time (s)
First F Third F
Fluo
resc
ence
inte
nsity
AUGUUU UUUUAA(UUU)4
M F F
- AAA
K
MFKF
0 30025020015010050Time (s)
0
4,000
8,000
Fluo
resc
ence
inte
nsity
First FThird F
Second K
a b
5′ Biotin-UTR
5′ Biotin-UTR
Figure 2 | Monitoring translation by fluorescenttRNA-binding events. a, Representative single-ZMW traces of ribosomes translating MFFFmRNA (top) and MFKF mRNA (bottom) in thepresence of 30 nM EF-G and 30 nM ternarycomplex. F, Phe-tRNAPhe; K, Lys-tRNALys. b, Thenumber of fluorescent pulses observed in ZMWsdepends on the presence of EF-G and ternarycomplex. Event histograms for the threeexperiments in the absence (n 5 341) andpresence (n 5 304) of 30 nM EF-G (top), and inthe absence (n 5 278) and presence (n 5 297) of30 nM unlabelled Lys-tRNALys ternary complex(middle) and presence (n 5 355) of 30 nM Lys(Cy2)tRNALys ternary complex (bottom).Histograms are normalized by the number ofribosomes showing single events.
ARTICLES NATURE | Vol 464 | 15 April 2010
1014Macmillan Publishers Limited. All rights reserved©2010
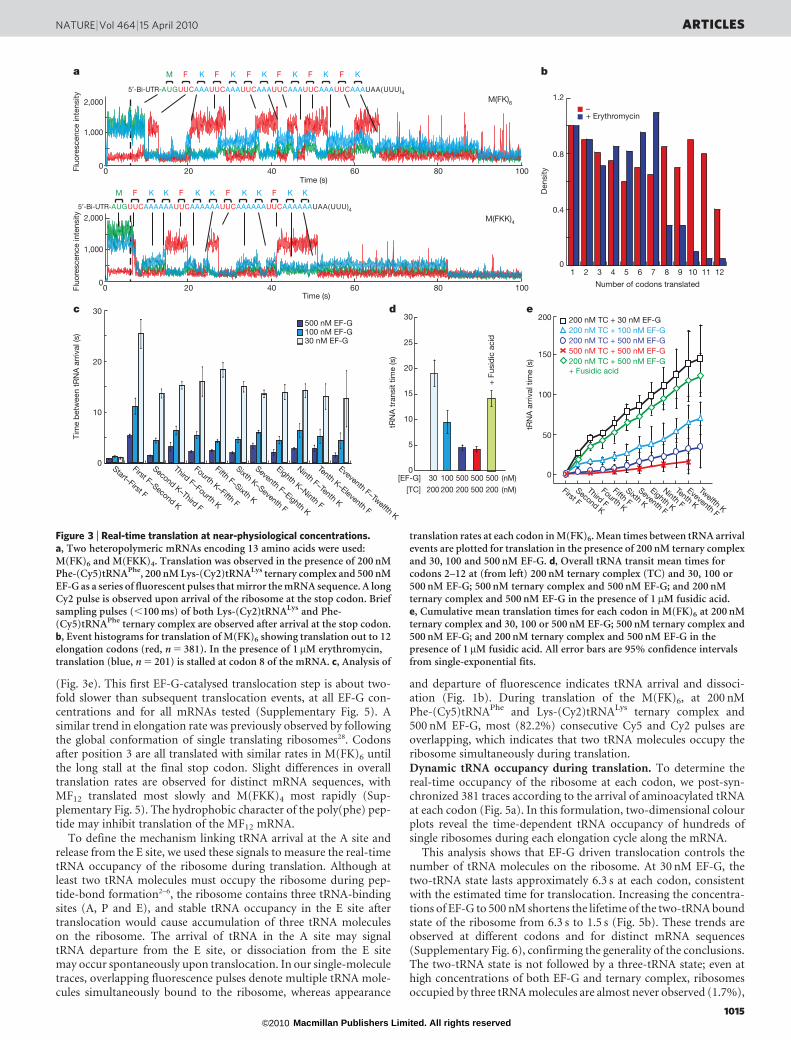
(Fig. 3e). This first EF-G-catalysed translocation step is about two-fold slower than subsequent translocation events, at all EF-G con-centrations and for all mRNAs tested (Supplementary Fig. 5). Asimilar trend in elongation rate was previously observed by followingthe global conformation of single translating ribosomes28. Codonsafter position 3 are all translated with similar rates in M(FK)6 untilthe long stall at the final stop codon. Slight differences in overalltranslation rates are observed for distinct mRNA sequences, withMF12 translated most slowly and M(FKK)4 most rapidly (Sup-plementary Fig. 5). The hydrophobic character of the poly(phe) pep-tide may inhibit translation of the MF12 mRNA.
To define the mechanism linking tRNA arrival at the A site andrelease from the E site, we used these signals to measure the real-timetRNA occupancy of the ribosome during translation. Although atleast two tRNA molecules must occupy the ribosome during pep-tide-bond formation2–6, the ribosome contains three tRNA-bindingsites (A, P and E), and stable tRNA occupancy in the E site aftertranslocation would cause accumulation of three tRNA moleculeson the ribosome. The arrival of tRNA in the A site may signaltRNA departure from the E site, or dissociation from the E sitemay occur spontaneously upon translocation. In our single-moleculetraces, overlapping fluorescence pulses denote multiple tRNA mole-cules simultaneously bound to the ribosome, whereas appearance
and departure of fluorescence indicates tRNA arrival and dissoci-ation (Fig. 1b). During translation of the M(FK)6, at 200 nMPhe-(Cy5)tRNAPhe and Lys-(Cy2)tRNALys ternary complex and500 nM EF-G, most (82.2%) consecutive Cy5 and Cy2 pulses areoverlapping, which indicates that two tRNA molecules occupy theribosome simultaneously during translation.Dynamic tRNA occupancy during translation. To determine thereal-time occupancy of the ribosome at each codon, we post-syn-chronized 381 traces according to the arrival of aminoacylated tRNAat each codon (Fig. 5a). In this formulation, two-dimensional colourplots reveal the time-dependent tRNA occupancy of hundreds ofsingle ribosomes during each elongation cycle along the mRNA.
This analysis shows that EF-G driven translocation controls thenumber of tRNA molecules on the ribosome. At 30 nM EF-G, thetwo-tRNA state lasts approximately 6.3 s at each codon, consistentwith the estimated time for translocation. Increasing the concentra-tions of EF-G to 500 nM shortens the lifetime of the two-tRNA boundstate of the ribosome from 6.3 s to 1.5 s (Fig. 5b). These trends areobserved at different codons and for distinct mRNA sequences(Supplementary Fig. 6), confirming the generality of the conclusions.The two-tRNA state is not followed by a three-tRNA state; even athigh concentrations of both EF-G and ternary complex, ribosomesoccupied by three tRNA molecules are almost never observed (1.7%),
a
1,000
0
0
2,000
Fluo
resc
ence
inte
nsity
Fluo
resc
ence
inte
nsity
1,000
2,000
0 20 40 60Time (s)
80 100
20 40 600Time (s)
80 100
M(FK)6
M(FKK)4
c d
Start–First F
First F–Second K
Second K–Third F
Third F–Fourth K
Fourth K–Fifth F
Fifth F–Sixth K
Sixth K–Seventh F
Seventh F–Eighth K
Eighth K–Ninth F
Ninth F–Tenth K
Tenth K–Eleventh F
Eveventh F–Twelfth K
500 nM EF-G100 nM EF-G30 nM EF-G
0
10
20
30
Tim
e b
etw
een
tRN
A a
rriv
al (s
)
e
200 nM TC + 500 nM EF-G200 nM TC + 100 nM EF-G200 nM TC + 30 nM EF-G
0
200
500 nM TC + 500 nM EF-G150
100
50
200 nM TC + 500 nM EF-G+ Fusidic acid
0
0.4
0.8
1.2
+ Erythromycin–
1 2 3 4 5 6 7 8 9 10 11 12
Number of codons translated
Den
sity
b
UGUUC UUC UUC UUC UUC UUCAAA AAA AAA AAA AAA AAAUAA(UUU)4
M F K F K F K F K F K F K
5′-Bi-UTR-AUGUUC UUC UUC UUCAAAAAA AAAAAA AAAAAA AAAAAAUAA(UUU)4
M F K K F K K F K K F K K
5′-Bi-UTR-A
tRN
A t
rans
it tim
e (s
)
0
5
10
15
20
25
30
50010030[EF-G] 500[TC] 200 200 200 500
500200
+ F
usid
ic a
cid
(nM)(nM)
tRN
A a
rriv
al t
ime
(s)
First F
Second K
Third F
Fourth K
Fifth F
Sixth K
Seventh F
Eighth K
Ninth F
Tenth K
Eveventh F
Twelfth K
Figure 3 | Real-time translation at near-physiological concentrations.a, Two heteropolymeric mRNAs encoding 13 amino acids were used:M(FK)6 and M(FKK)4. Translation was observed in the presence of 200 nMPhe-(Cy5)tRNAPhe, 200 nM Lys-(Cy2)tRNALys ternary complex and 500 nMEF-G as a series of fluorescent pulses that mirror the mRNA sequence. A longCy2 pulse is observed upon arrival of the ribosome at the stop codon. Briefsampling pulses (,100 ms) of both Lys-(Cy2)tRNALys and Phe-(Cy5)tRNAPhe ternary complex are observed after arrival at the stop codon.b, Event histograms for translation of M(FK)6 showing translation out to 12elongation codons (red, n 5 381). In the presence of 1mM erythromycin,translation (blue, n 5 201) is stalled at codon 8 of the mRNA. c, Analysis of
translation rates at each codon in M(FK)6. Mean times between tRNA arrivalevents are plotted for translation in the presence of 200 nM ternary complexand 30, 100 and 500 nM EF-G. d, Overall tRNA transit mean times forcodons 2–12 at (from left) 200 nM ternary complex (TC) and 30, 100 or500 nM EF-G; 500 nM ternary complex and 500 nM EF-G; and 200 nMternary complex and 500 nM EF-G in the presence of 1 mM fusidic acid.e, Cumulative mean translation times for each codon in M(FK)6 at 200 nMternary complex and 30, 100 or 500 nM EF-G; 500 nM ternary complex and500 nM EF-G; and 200 nM ternary complex and 500 nM EF-G in thepresence of 1 mM fusidic acid. All error bars are 95% confidence intervalsfrom single-exponential fits.
NATURE | Vol 464 | 15 April 2010 ARTICLES
1015Macmillan Publishers Limited. All rights reserved©2010
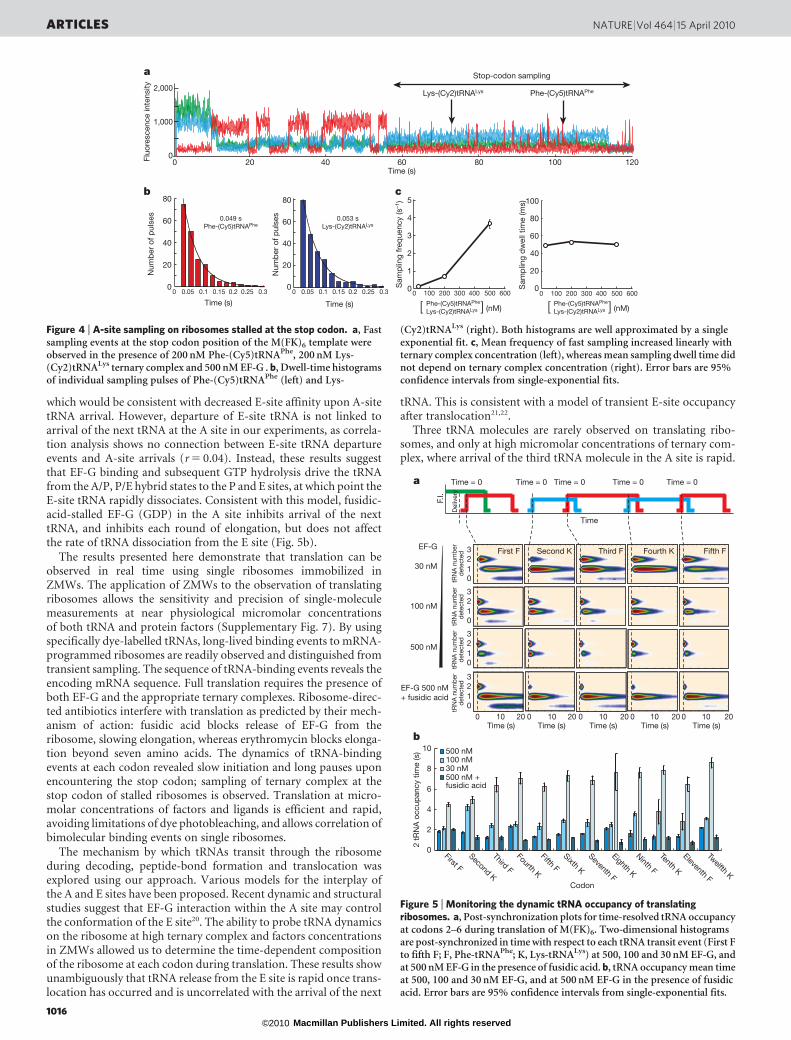
which would be consistent with decreased E-site affinity upon A-sitetRNA arrival. However, departure of E-site tRNA is not linked toarrival of the next tRNA at the A site in our experiments, as correla-tion analysis shows no connection between E-site tRNA departureevents and A-site arrivals (r 5 0.04). Instead, these results suggestthat EF-G binding and subsequent GTP hydrolysis drive the tRNAfrom the A/P, P/E hybrid states to the P and E sites, at which point theE-site tRNA rapidly dissociates. Consistent with this model, fusidic-acid-stalled EF-G (GDP) in the A site inhibits arrival of the nexttRNA, and inhibits each round of elongation, but does not affectthe rate of tRNA dissociation from the E site (Fig. 5b).
The results presented here demonstrate that translation can beobserved in real time using single ribosomes immobilized inZMWs. The application of ZMWs to the observation of translatingribosomes allows the sensitivity and precision of single-moleculemeasurements at near physiological micromolar concentrationsof both tRNA and protein factors (Supplementary Fig. 7). By usingspecifically dye-labelled tRNAs, long-lived binding events to mRNA-programmed ribosomes are readily observed and distinguished fromtransient sampling. The sequence of tRNA-binding events reveals theencoding mRNA sequence. Full translation requires the presence ofboth EF-G and the appropriate ternary complexes. Ribosome-direc-ted antibiotics interfere with translation as predicted by their mech-anism of action: fusidic acid blocks release of EF-G from theribosome, slowing elongation, whereas erythromycin blocks elonga-tion beyond seven amino acids. The dynamics of tRNA-bindingevents at each codon revealed slow initiation and long pauses uponencountering the stop codon; sampling of ternary complex at thestop codon of stalled ribosomes is observed. Translation at micro-molar concentrations of factors and ligands is efficient and rapid,avoiding limitations of dye photobleaching, and allows correlation ofbimolecular binding events on single ribosomes.
The mechanism by which tRNAs transit through the ribosomeduring decoding, peptide-bond formation and translocation wasexplored using our approach. Various models for the interplay ofthe A and E sites have been proposed. Recent dynamic and structuralstudies suggest that EF-G interaction within the A site may controlthe conformation of the E site20. The ability to probe tRNA dynamicson the ribosome at high ternary complex and factors concentrationsin ZMWs allowed us to determine the time-dependent compositionof the ribosome at each codon during translation. These results showunambiguously that tRNA release from the E site is rapid once trans-location has occurred and is uncorrelated with the arrival of the next
tRNA. This is consistent with a model of transient E-site occupancyafter translocation21,22.
Three tRNA molecules are rarely observed on translating ribo-somes, and only at high micromolar concentrations of ternary com-plex, where arrival of the third tRNA molecule in the A site is rapid.
b
100 nM
EF-G
30 nM
500 nM
0
2
4
6
8
500 nM100 nM30 nM
First F
Second K
Third F
Fourth K
Fifth F
Sixth K
Seventh F
Eighth K
Ninth F
Tenth K
Eleventh F
Twelfth K
2 tR
NA
occ
upan
cy t
ime
(s)
Time = 0 Time = 0 Time = 0 Time = 0 Time = 0
Codon
10
500 nM +fusidic acid
1
32
0
1
32
0
EF-G 500 nM+ fusidic acid
0 10Time (s) Time (s) Time (s) Time (s) Time (s)
20 0 10 20 0 10 20 0 10 20 0 10 20
1
32
tRN
A n
umbe
rde
tect
edtR
NA
num
ber
dete
cted
tRN
A n
umbe
rde
tect
edtR
NA
num
ber
dete
cted
0
Time
Del
iver
y
F.I.
a
1
32
0
First F Second K Third F Fourth K Fifth F
Figure 5 | Monitoring the dynamic tRNA occupancy of translatingribosomes. a, Post-synchronization plots for time-resolved tRNA occupancyat codons 2–6 during translation of M(FK)6. Two-dimensional histogramsare post-synchronized in time with respect to each tRNA transit event (First Fto fifth F; F, Phe-tRNAPhe; K, Lys-tRNALys) at 500, 100 and 30 nM EF-G, andat 500 nM EF-G in the presence of fusidic acid. b, tRNA occupancy mean timeat 500, 100 and 30 nM EF-G, and at 500 nM EF-G in the presence of fusidicacid. Error bars are 95% confidence intervals from single-exponential fits.
0
20
40
60
80
0
20
40
60
80
0 0.05 0.1 0.15 0.2 0.25 0.3
Time (s)0 0.05 0.1 0.15 0.2 0.25 0.3
Time (s)
Num
ber
of p
ulse
s
0
1
2
3
4
5
0 100 200 300 400 500 600 0 100 200 300 400 500 600
Sam
plin
g fr
eque
ncy
(s–1
)
0
20
40
60
80
100
Sam
plin
g d
wel
l tim
e (m
s)
Stop-codon sampling
Num
ber
of p
ulse
s
Phe-(Cy5)tRNAPhe
Lys-(Cy2)tRNALys[ ] (nM)Phe-(Cy5)tRNAPhe
Lys-(Cy2)tRNALys[ ] (nM)
0.049 sPhe-(Cy5)tRNAPhe
0.053 sLys-(Cy2)tRNALys
b
a
c
Phe-(Cy5)tRNAPheLys-(Cy2)tRNALys
0
1,000
2,000
Fluo
resc
ence
inte
nsity
0 20 40 60Time (s)
80 100 120
Figure 4 | A-site sampling on ribosomes stalled at the stop codon. a, Fastsampling events at the stop codon position of the M(FK)6 template wereobserved in the presence of 200 nM Phe-(Cy5)tRNAPhe, 200 nM Lys-(Cy2)tRNALys ternary complex and 500 nM EF-G . b, Dwell-time histogramsof individual sampling pulses of Phe-(Cy5)tRNAPhe (left) and Lys-
(Cy2)tRNALys (right). Both histograms are well approximated by a singleexponential fit. c, Mean frequency of fast sampling increased linearly withternary complex concentration (left), whereas mean sampling dwell time didnot depend on ternary complex concentration (right). Error bars are 95%confidence intervals from single-exponential fits.
ARTICLES NATURE | Vol 464 | 15 April 2010
1016Macmillan Publishers Limited. All rights reserved©2010
These data agree with dynamic investigations of the E site that showcoupling of E-site opening, in particular the L1 stalk23–25, with trans-location and E-site occupancy. Rapid dissociation of the E-site tRNAupon translocation is also consistent with the fast rates required forefficient elongation. Occupancy by three tRNA molecules occurswhen a slow E-site dissociation event is coincident with rapidtRNA arrival in the A site (Supplementary Fig. 7). Slow E-site dis-sociation delays subsequent rounds of elongation, and may beimportant in rare translational events, such as frameshifting26.
Future perspectives
The real-time system outlined here has broad application to the studyof translation. The dynamic events underlying translational fidelity andribosomal movement are probed directly at each codon during trans-lation, allowing rare translational events to be uncovered. Time-resolved analysis of compositional changes in the ribosome can beextended to initiation, elongation and release-factor binding and canbe merged with FRET signals to correlate ligand binding and ribosomalconformational changes. Eukaryotic translational systems can be read-ily substituted to probe the dynamics of translational control andregulation. This approach allows the direct detection of mRNA codingsequence, and may allow the observation of translational eventsinvolved in the regulation of protein synthesis, such as frameshifting.
METHODS SUMMARYSample preparation. Escherichia coli ribosomal subunits and factors were pre-
pared and purified as described12,13. tRNAfMet, tRNAPhe and tRNALys were
labelled with fluorescent dyes at their elbow positions (U8 or U47), purifiedand aminoacylated using previously described approaches12,13. Ribosome ini-
tiation complexes were assembled by combining 0.5-mM 30S subunits pre-incu-
bated with stoichiometric S1, 0.5-mM 50S subunits, 5 mM 59-biotinyated mRNA,
1 mM fMet-(Cy3)tRNAfMet, 2mM IF2 and 4 mM GTP in a polymix buffer
(50 mM Tris-acetate (pH 7.5), 100 mM potassium chloride, 5 mM ammonium
acetate, 0.5 mM calcium acetate, 5 mM magnesium acetate, 0.5 mM EDTA,
5 mM putrescine-HCl and 1 mM spermidine) and incubating at 37 uC for 5 min.
ZMW assay. The ZMW surface was derivatized with 1mM neutravidin for 2 min
and rinsed with the polymix buffer to remove unbound neutravidin. After rins-
ing, ribosome initiation complexes (diluted tenfold in polymix buffer containing
2 mM IF2 and 4 mM GTP) were delivered to the ZMW surface and incubated for
5 min at room temperature, after which the surface was rinsed with polymix
buffer containing 2 mM IF2 and 4 mM GTP, as well as an oxygen scavenging
system27 (250 nM protocatechuate dioxygenase, 2.5 mM PCA (3,4-dihydroxy-
benzoic acid) and 1 mM Trolox). Real-time delivery solutions were prepared in
polymix buffer and contained 2 mM IF2, 4 mM GTP, 30–500 nM EF-G and 30–
500 nM ternary complex (one or more of the following: Phe-(Cy5)tRNAPhe, Lys-
(Cy2)tRNALys or Lys-tRNALys, pre-assembled with 15 mM EF-Tu and 4 mMGTP), as well as the protocatechuate dioxygenase oxygen scavenging system.
Full Methods and any associated references are available in the online version ofthe paper at www.nature.com/nature.
Received 22 January 2010; accepted 18 February 2010.
1. Green, R. & Noller, H. F. Ribosomes and translation. Annu. Rev. Biochem. 66,679–716 (1997).
2. Moazed, D. & Noller, H. F. Intermediate states in the movement of transfer RNA inthe ribosome. Nature 342, 142–148 (1989).
3. Hausner, T. P., Geigenmuller, U. & Nierhaus, K. H. The allosteric three-site modelfor the ribosomal elongation cycle. New insights into the inhibition mechanism ofaminoglycosides, thiostrepton, and viomycin. J. Biol. Chem. 263, 13103–13111(1988).
4. Rodnina, M. W. & Wintermeyer, W. Fidelity of aminoacyl-tRNA selection on theribosome: kinetic and structural mechanisms. Annu. Rev. Biochem. 70, 415–435(2001).
5. Agirrezabala, X. et al. Visualization of the hybrid state of tRNA binding promotedby spontaneous racheting of the ribosome. Mol. Cell 32, 190–197 (2008).
6. Marshall, R. A., Aitken, C. E., Dorywalska, M. & Puglisi, J. D. Translation at thesingle-molecule level. Annu. Rev. Biochem. 77, 177–203 (2008).
7. Levene, M. J. et al. Zero-mode waveguides for single-molecule analysis at highconcentrations. Science 299, 682–686 (2003).
8. Foquet, M. et al. Improved fabrication of zero-mode waveguides for single-molecule detection. J. Appl. Phys. 103, 034301 (2008).
9. Korlach, J. et al. Selective aluminum passivation for targeted immobilization ofsingle DNA polymerase molecules in zero-mode waveguide nanostructures. Proc.Natl Acad. Sci. USA 105, 1176–1181 (2008).
10. Lundquist, P. M. et al. Parallel confocal detection of single molecules in real time.Opt. Lett. 33, 1026–1028 (2008).
11. Eid, J. et al. Real-time DNA sequencing from single polymerase molecules. Science323, 133–138 (2009).
12. Blanchard, S. C., Gonzalez, R. L. Jr, Kim, H. D., Chu, S. & Puglisi, J. D. tRNA selectionand kinetic proofreading in translation. Nature Struct. Mol. Biol. 11, 1008–1014 (2004).
13. Blanchard, S. C., Kim, H. D., Gonzalez, R. L. Jr, Puglisi, J. D. & Chu, S. tRNAdynamics on the ribosome during translation. Proc. Natl Acad. Sci. USA 101,12893–12898 (2004).
14. Chan, V., Graves, D. J. & McKenzie, S. E. The biophysics of DNA hybridization withimmobilized oligonucleotide probes. Biophys. J. 69, 2243–2255 (1995).
15. Schlunzen, F. et al. Structural basis for the interaction of antibiotics with thepeptidyl transferase centre in eubacteria. Nature 413, 814–821 (2001).
16. Tenson, T., Lovmar, M. & Ehrenberg, M. The mechanism of action of macrolides,lincosamides and streptogramin B reveals the nascent peptide exit path in theribosome. J. Mol. Biol. 330, 1005–1014 (2003).
17. Bodley, J. W. & Godtfredsen, W. O. Studies on translocation. XI. Structure-function relationships of the fusidane-type antibiotics. Biochem. Biophys. Res.Commun. 46, 871–877 (1972).
18. Underwood, K. A., Swartz, J. R. & Puglisi, J. D. Quantitative polysome analysisidentifies limitations in bacterial cell-free protein synthesis. Biotechnol. Bioeng. 91,425–435 (2005).
19. Marshall, R. A., Aitken, C. E. & Puglisi, J. D. GTP hydrolysis by IF2 guidesprogression of the ribosome into elongation. Mol. Cell 35, 37–47 (2009).
20. Gao, Y. G. et al. The structure of the ribosome with elongation factor G trapped inthe posttranslocational state. Science 326, 694–699 (2009).
21. Lill, R. & Wintermeyer, W. Destabilization of codon-anticodon interaction in theribosomal exit site. J. Mol. Biol. 196, 137–148 (1987).
22. Semenkov, Y. P., Rodnina, M. V. & Wintermeyer, W. The ‘‘allosteric three-sitemodel’’ of elongation cannot be confirmed in a well-defined ribosome systemfrom Escherichia coli. Proc. Natl Acad. Sci. USA 93, 12183–12188 (1996).
23. Cornish, P. V. et al. Following movement of the L1 stalk between three functionalstates in single ribosomes. Proc. Natl Acad. Sci. USA 106, 2571–2576 (2009).
24. Fei, J., Kosuri, P., MacDougall, D. D. & Gonzalez, R. L. Jr. Coupling of ribosomal L1stalk and tRNA dynamics during translation elongation. Mol. Cell 30, 348–359(2008).
25. Fei, J. et al. Allosteric collaboration between elongation factor G and the ribosomalL1 stalk directs tRNA movements during translation. Proc. Natl Acad. Sci. USA 106,15702–15707 (2009).
26. Sanders, C. L. & Curran, J. F. Genetic analysis of the E site during RF2 programmedframeshifting. RNA 13, 1483–1491 (2007).
27. Aitken, C. E., Marshall, R. A. & Puglisi, J. D. An oxygen scavenging system forimprovement of dye stability in single-molecule fluorescence experiments.Biophys. J. 94, 1826–1835 (2008).
28. Aitken, C. E. & Puglisi, J. D. Following the intersubunit conformation of theribosome during translation in real time. Nat. Struct. Mol. Biol. (in the press).
Supplementary Information is linked to the online version of the paper atwww.nature.com/nature.
Acknowledgements This work was supported by National Institutes of Healthgrant GM51266 (to J.D.P.). We thank T. Funatsu, A. Tsai and A. Petrov forencouragement and discussions. We thank J. Gray for performing ellipsometryexperiments.
Author Contributions S.U. performed all experiments and data analysis.S.U., C.E.A. and J.D.P. discussed results and wrote the manuscript. S.W.T., J.K.and B.A.F. provided technical expertise with instrumentation and dataprocessing.
Author Information Reprints and permissions information is available atwww.nature.com/reprints. The authors declare competing financial interests:details accompany the full-text HTML version of the paper at www.nature.com/nature. Correspondence and requests for materials should be addressed to J.D.P.([email protected]).
NATURE | Vol 464 | 15 April 2010 ARTICLES
1017Macmillan Publishers Limited. All rights reserved©2010

METHODSInstrumentation. Instrumentation10 and chips containing 3,000 individual
ZMWs8 were used and prepared as described previously11. Specific immobilization
of ribosome complexes in ZMWs was achieved by surface passivation using poly-
phosphonate with biotin–PEG–silane9. ZMW diameters were in the range 120–
135 nm. Cy2, Cy3 and Cy5 fluorescence was detected upon simultaneous excitation
at 488, 532 and 642 nm. Each laser power for three excitations was 0.5mWmm22 for
all three colour experiments, but 2.5mWmm22 for two colour experiments (Fig. 2a).
Each dye lifetime was 17.3 s for Phe-(Cy5)tRNAfMet in the P site, 22.5 s for fMet-
(Cy3)tRNAfMet in the P site and 16.5 s for fMet-(Cy2)tRNAfMet in the P site.Data collection and analysis. Data were collected on a highly parallel confocal
fluorescence detection instrument, using prism-based dispersion optics and an
electron-multiplying charge-coupled device camera10. Fluorescence traces were
recorded at a rate of 30 frames per second for 3 min, with the exception
experiments using MFF, MFKF mRNAs and those at 30 nM EF-G for
M(FK)6 mRNA, which were recorded at a rate of 100 frames per second for
5 min. Using custom software written in Matlab (MathWorks), fluorescence
traces that displayed Cy3 fluorescence corresponding to an fMet-
(Cy3)tRNAfMet molecule and co-localized with the arrival of labelled ternary
complex upon delivery were analysed to extract individual tRNA transit times,
time between tRNA arrivals and tRNA occupancy within single ribosomes.
Data from individual molecules (n . 200 molecules for all experiments) were
accumulated into statistical distributions to extract mean estimates for the
above-described values.
doi:10.1038/nature08925
Macmillan Publishers Limited. All rights reserved©2010