real-time traffic safety management model on …
TRANSCRIPT

B. Huzjan i dr. Model stvarno-vremenskog upravljanja sigurnošću prometa na autocestama
Tehnički vjesnik 24, 5(2017), 1457-1469 1457
ISSN 1330-3651 (Print), ISSN 1848-6339 (Online) https://doi.org/10.17559/TV-20150331093202
REAL-TIME TRAFFIC SAFETY MANAGEMENT MODEL ON MOTORWAYS
Boris Huzjan, Sadko Mandžuka, Goran Kos
Original scientific paper The methodology that allows predicting the occurrence of traffic accidents on the motorway was studied and defined in this paper. On the basis of this assessment the implementation of active measures for reducing the probability of their actual occurrence is included. The intensity of traffic does not give a simple correlation with the number and the type of accidents, that relationship is more complex. Previous studies have been applied to motorways with six and more traffic lanes, and no studies have been carried out for four-lane motorways (with the driving and overtaking lane on one carriageway). This paper presents a new model for such motorways, the model is based on measuring values of parameters of traffic flow and external factors that affect the traffic flow. The degree of crash potential was brought to correlation with the existing statistical data on traffic accidents on the test section and traffic flow data. This model is important for experts to produce algorithms that manage variable message signs on highways.
Keywords: crash potential factor; four-lane motorways; traffic flow; traffic safety management model; variable message signs
Model stvarno-vremenskog upravljanja sigurnošću prometa na autocestama
Izvorni znanstveni članka U radu je istražena i definirana metodologija koja omogućuje predviđanje nastanka prometnih nesreća na autocesti. Na osnovu te procjene uključuje se provedba aktivnih mjera za smanjenje vjerojatnosti njihova stvarnog nastanka. Sam intenzitet prometa ne daje jednostavnu korelacijsku vezu s brojem i vrstom prometnih nesreća već je taj odnos mnogo složeniji. Dosadašnja istraživanja primjenjivana su za autoceste sa šest i više prometnih traka, odnosno nema istraživanja napravljenih za četverotračne autoceste. U radu je prikazan novi model za takve autoceste, a baziran je na mjerenju vrijednosti parametara prometnog toka te vanjskih čimbenika koji utječu na odvijanje prometnog toka. Stupanj opasnosti od nastanka nesreće doveden je u korelaciju s postojećim statističkim podacima o prometnim nesrećama na testnoj dionici i podataka o prometnom toku. Ovaj model značajan je za eksperte koji izrađuju algoritme koji upravljaju promjenjivim prometnim znakovima na autocestama.
Ključne riječi: četverotračne autoceste; faktor opasnosti nastanka prometne nezgode; model upravljanja sigurnošću prometa; prometni tok; promjenljiva svjetlosna signalizacija
1 Introduction
In the area of road safety, extensive scientific research is carried out which aims to determine the mechanisms of road accidents’ occurrence and the development of new models and systems of their prevention. Road traffic safety is one of the biggest challenges of today’s society. According to the World Health Organization (WHO) data, road traffic is the tenth biggest cause of mortality in the world with 1,240,000 fatalities, and every year more people are killed in road traffic than in all the wars that are currently being fought in the world. Also, according to the World Health Organization data, the cost of one person killed in a traffic accident is estimated at about one million euro.
The research shows that a significant part of national wealth is spent to the consequences of traffic accidents. In ten years, approximately 62,000 accidents a year happen on Croatian roads [1, 2], in 26% of accidents there are injured persons, in other words 23,000 thousand people are hurt in traffic every year. From that number, almost 80% of injured suffered from minor injuries, 18% suffered serious injuries, and 2.5% a year are killed, which is 582 persons a year on average. According to the lowest estimates, due to traffic accidents the Republic of Croatia has a direct loss of at least 2% of GDP, while the indirect losses are manifold.
Road safety represents the interaction between a man, a road and a vehicle. By affecting each factor, safety status on the roads can be improved. The research problem in this paper is the elaboration of the real-time model of traffic safety management for four-lane motorways.
Road safety policy of the European Union aims to raise the level of road safety and provide a secure and easy mobility of citizens across Europe. Although there has been significant progress in the area of road safety, the targeted action program objective (reducing the number of fatalities by 50%) was not achieved.
Fig. 1 shows the shift achieved by the countries of the European Union. Sweden, England, the Netherlands and Denmark are the top countries in terms of prevention of casualties on the roads, while Croatia, Poland, Lithuania, Latvia and Romania are at the bottom.
Figure 1 Overview of movement in number of fatalities in EU countries [3]
The paper studied and defined the methodology for the prevention of accidents on the motorway. The objective of this study was to analytically determine the process of accident occurrence on the motorways, by analysing the factors of impact of man, vehicle and the road. Based on the risk analysis, a model to reduce the crash potential on motorways was made.

Real-time traffic safety management model on motorways B. Huzjan et al.
1458 Technical Gazette 24, 5(2017), 1457-1469
Through the analysis of relevant factors a model of accident occurrence on the motorways was designed and verified. Based on the created algorithm and using the existing ITS system, efficient management of traffic flow aimed at reducing the crash potential is enabled. Certain principles have been established by mutual evaluation and ranking of the relevant parameters at accident occurrence on the motorways as well as by bringing this data to correlation with the basic parameters of traffic flow.
Those algorithms can be incorporated into the model of real-time management of traffic safety on the motorway. The use of this new model of traffic flow management on the motorways will reduce the crash potential. 2 Overview of previous research
Previous studies do not discuss much the issue of correlation of number and characteristic of accidents and basic parameters of traffic flow on the accident site. The intensity of traffic gives no simple correlation with the number and the type of accidents, this relation is considerably more complex. The main issue in the research of relationship of traffic flow intensity and accidents is the problem of data shortage on traffic flow intensity on the accident site, at the time of the accident.
Large deviation of speed is very unfavourable for traffic safety as proved by many studies. The first study on the subject was conducted by Solomon [4] (1964) where he determined the relationship between vehicle speed and traffic accidents.
The impact of the system for variable speed limits on the behaviour of drivers is substantiated in several papers. For example, significant achievements using the system of variable speed limits were achieved in the Netherlands by Van de Hoogen et al. (1994) [5]. By means of variable traffic signs they homogenized the traffic flow on a 20-kilometre-long motorway section with six lanes. They proved that variable traffic signs can have influence on the regulation of headway and reduce the number of incurred shockwaves which affects better use of road space.
Similar methodology was also implemented in Great Britain by Borrough (1997) [6] on the M-25 motorway where, by using variable traffic signs in real time (depending on traffic flow conditions) speed limit changes as to avoid greater time losses (delay) or traffic jam when the system is close to the its full capacity.
Kirchsteiger (1997) [7] described the distribution of factors which precede the accident as gamma distribution, but on the basis of historical data on accidents, and not on the basis of real traffic data collected during the accidents. Speed limit change can affect the basic traffic flow characteristics (speed, density and flow) and in this way traffic flow can be adjusted, except in the conditions of maximum capacity, to the conditions of minimum crash potential.
Corby et al. (1998) [8] came to the conclusion that changes in traffic flow during the day have a much greater importance in the analysis of traffic flow safety than the statistical data on traffic flow (AADT etc.). They have also reached the conclusion that the speed deviation is the best indicator of crash potential, as authors Hughes and
Council [9] and Feng [12] who came to the same conclusion by reviewing several studies which are based on the relation of traffic flow speed and safety in traffic flow made on the basis of data collected in real time.
In order to avoid the factors that affect the traffic flow, and which are difficult to measure (driver behaviour, driving regimes, vehicle characteristics etc.) further development of the research was focused on determining more measurable connections between the traffic flow characteristics and the occurrence of accidents. Thus Cheol Oh et al. (2000, 2001) [10, 11] found that the standard deviation of speed five minutes before accident occurrence is the best indicator for distinguishing normal characteristics of traffic flow from traffic flow characteristics which precede the accident.
Existing models for the prevention of accident occurrence on the motorway (Crash Prediction Model) were developed by Lee et al. (2002) [13] and Abdel-Aty et al. (2005) [17, 18]. Model made by Abdel-Aty was tested by simulation on the 32-kilometres-long section on the Interstat-4 motorway (Tampa–Dayton) which in most cases has 6 lanes. The model is divided into two types, depending on traffic flow speed: for high and low speeds. Simulation test confirmed that the simultaneous increase of speed limit on the variable message sign before the reference point and the reduction of the speed limit on the variable message sign after the reference point results in positive influence on the reduced values of crash potential. It was also concluded that the system of variable signs has an influence to the reduced crash potential only at high speeds, i.e. uncongested traffic flow [21].
In the United States of America the system of variable message signs is used in Washington State, New Jersey, New Mexico and Wisconsin aiming to identify the danger and speed limit on the motorways which are often subject to the impact of adverse weather conditions by McLawhorn (2003) [14].
The original model by Lee et al. (2002.) was modified in 2003 [15], and then in 2004 [16] by the author and implemented in the simulation of a smaller transport network, 2.5 km long, which contains four inductive loops, three variable message signs and three traffic lanes. As a conclusion of the said simulation, the obtained results show that the average crash potential is reduced by approximately 25% by using the system of variable traffic signs and the crash prevention model. Evaluation of variable speed limits for real-time freeway safety, Lee et al. provided in 2006 [19], and Abdel-Aty (2006) [20]. Cunningham (2007) [21] examine dynamic variable speed limit strategies for the reduction of real-time crash risk on motorways.
Authors Wang et al. [22] (2007) show the method for the assessment of safety level on the motorways in rural areas based on accidents, traffic flow and characteristics of structures. Author Zhu [23] (2009) examines in detail the technologies and methods related to warning within traffic safety based on the methods of macro and micro prediction.
In the paper Xiaodoong et al. (2009) [24] study the system for traffic safety management on the motorway based on the dissipative structure and the theory of catastrophe, which shows whether the system for traffic

B. Huzjan i dr. Model stvarno-vremenskog upravljanja sigurnošću prometa na autocestama
Tehnički vjesnik 24, 5(2017), 1457-1469 1459
safety management on the motorway will be stable or unstable due to various disturbances.
Carlson et al. (2010) [25] have shown that traffic flow efficiency can be substantially improved when VSL control measures are used, particularly in integration with coordinated ramp metering. In the paper by Sivanesan et al. (2011) [26] research was conducted to determine the relation between accident and traffic flow as well as the relation between the road characteristics and the environment, and it was found that traffic flow and the access roads are significant factors contributing to the number of accidents.
Heydecker et al. (2011) [27] develop the relationship between speed and density to analyse the flow of traffic under the operation of variable speed limits. They develop an approach to modelling traffic in light of that.
Authors Xu et al. (2012) divided traffic flow on motorways according to various situations and the evaluation of safety impact related to each situation was made in the paper [28]. Youngtae et al. (2012) [29] survey variable speed limit to improve safety near traffic congestion on urban freeways.
Newer research was made by Chena et al (2014) [30] with variable speed limit control for steady and oscillatory queues at fixed freeway bottlenecks. Li et al. (2015) [31] develop a procedure for determining the optimal variable speed limit (VSL) control strategy for reducing collision risks and injury severity on large-scale freeway segments. Ebolia et al. (2015) [32] made experimental relationships between operating speeds of successive road design elements in two-lane rural highways. They propose two types of operating speed models: one for estimating speed profiles for horizontal curves, and the other one for tangents. Recent research on similar topic has been conducted by Çodur et al. (2015) with artificial neural network model for highway accident prediction [33].
The models [16, 18, 20] and research [5, 6, 14] were made on the so called urban motorways which have from 6 to 12 traffic lanes on average. In the same way, the existing models of accident occurrence prevention are adjusted to technical characteristics of such roads so the traffic volume change on the particular lane was taken into consideration as an important factor, as well as lane change frequency, area of the ramp for merging and exclusion, sections with increase or decrease of number of lanes etc. For this reason none of the existing models can be implemented on two-lane motorways.
Based on an analysis of the existing research and analysis of the current state of European motorways in the Republic of Croatia and the region and their traffic flow, it was found that there is a need to develop a model for the prevention of traffic accidents, or the model for traffic safety management on the motorways with similar characteristics in the Republic of Croatia. This model can also be implemented on the motorways with similar characteristics in other countries in Europe and worldwide.
The paper applied the research and results of the scientific-research project of the 7th Framework programme of the European Commission, Intelligent Cooperative Sensing for Improved Traffic Efficiency, 2012-2013, EC-FP7-317671, [34].
3 Making real-time traffic management model to increase traffic safety on motorways
3.1 General facts Real-time model of traffic management using the
input on the characteristic of traffic flow (speed, sequence, density, homogeneity etc.) and input data on external factors in traffic flow (input data) allows the calculation of the level of crash potential.
The model is based on the management of traffic flows on motorways in order to reduce the crash potential. Traffic flow management is carried out by contemporary ITS devices – variable message signs (VMS) and light text signs. Variable message signs will be used to change the maximum allowed speed, and light text signs will give drivers text alerts in order to achieve traffic flow with the minimum crash potential.
For the development of the model a test section of the motorway between Zagreb and Rijeka in Croatia with two carriageways with two lanes each, and one emergency lane on each carriageway was chosen. The motorway passes the lowland zone, hilly and mountainous terrain. A detailed analysis of statistical data on traffic accidents was made for the test section, and the field research of traffic flow characteristics was carried out.
The analysis of statistical data on traffic accidents on the test section found that most of the accidents happen in normal traffic conditions, i.e. 70% of accidents happen at maximum legally permissible speed limit (130 km/h on the lowland part, or110 km/h on the hilly part), and 73% of accidents happen at a flow rate of up to 30% of total capacity of the section [2].
Model of increasing traffic safety on the motorways and ITS systems will have an influence on the reduction of the number of accidents caused under normal traffic conditions. The model is based on measuring values of traffic flow parameters in real-time and external factors which affect the traffic flow and based on this a message or speed limit will be shown to drivers with the aid of which the minimum crash potential will be achieved.
Crash potential is defined through a relative danger degree of accident occurrence (n). Danger degree was brought into correlation with the existing statistic data on accidents on the test section and traffic flow data measured during research.
3.2 Development of the model
The analysis of previous research concluded that the
development of the new real-time model of traffic flow management aimed to prevent the occurrence of accidents will be based on the model developed by Lee et al. (2002) [29] which was further modified in 2004 in line with the new research [31]. The new model will be made for four-lane motorways. Model calibration is based on the analysis of traffic flows recorded on the test section and the analysis of statistical data on accidents.
The basic linear logarithmic model of crash developed by Lee et al. is as follows:
)ln( ... )ln(
)()(
)()()(EXP
...FmPlR
kCOVVjQiCVSβlllllQ
+++++++=
(1)

Real-time traffic safety management model on motorways B. Huzjan et al.
1460 Technical Gazette 24, 5(2017), 1457-1469
where: F - expected number of accidents in the observed period, Θ - constant, λCVS(i) - coefficient of variation of speed (CVS), λQ(j) - difference of average speed between the beginning and end of observed section (km/h), λCOVV(k) - influence of traffic lane change (COVariance of Volume difference between the upstream and downstream of a specific location), λR(l) - effect of road geometry (control factor), λP(m) - effect of peak/off-peak traffic volume (control factor), β - parameter for exposure, EXP - exposure to accident occurrence based on vehicle/kilometre.
According to Eq. (1) it can be seen that Lee at al. (2004) have chosen three main factors which have shown to be the most important for the prediction of crash potential: current difference between the speed of individual vehicles at a fixed location as a proof of speed stability between the vehicles, speed change along the observed section (small changes indicate constant speed and low acceleration, while large changes indicate sudden acceleration or speed reduction which points to crash potential) and frequency of traffic lane change.
Since there are significant differences between the conditions in which the model was developed (1) and the traffic flow conditions on the four-lane motorways which prevail in the Republic of Croatia the factors to be taken into account for the analysis of crash potential on such motorways were determined. 3.2.1 Variety of vehicle speed in traffic flow
The first factor is the difference (deviation) of vehicle speed in traffic flow on the fixed location. Speed deviation at fixed location points to speed stability of the vehicle in the traffic flow. According to Lee et al. [29] the factor is obtained through the ratio of standard deviation and average speed for each traffic lane and marked as coefficient of variation of speed (CVS). The calculation for identification of the speed change on the fixed location (CVS) according to Lee et al. [29] is shown in the equation:
i
in
i vnCVS )(1 s
1
s=∑= (2)
where: CVS - Coefficient of Variation of Speed, (σs)i - standard deviation of speed on traffic lane i during the period ∆t (km/h), iv - average speed on traffic lane i during period ∆t (km/h), n - total number of traffic lanes.
By analysing Eq. (2) we can conclude that, if there are smaller changes in speed (standard deviations) the traffic flow is balanced. If there is a significant increase in speed change, certain number of drivers will have to change the speed more frequently, which leads to instability in traffic flow, or increase in crash potential.
The research determined the relationship between vehicle speed in traffic accidents and the average speed of traffic flow (Fig. 2).
It is possible to conclude from the curve that most accidents happen at speeds that are different from average and that the larger number of accidents is represented at lower speeds than average.
Figure 2 Solomon curve [4]
In this study the speed deviation is observed on the
entire test section, or one motorway direction was considered to be one traffic lane. Thus the amount of the CVS factor is:
isCVS ss= (3)
The specified value will be considered average value
of the CVS factor. If the specified value using light text signs or variable message signs decreases, the crash potential will also reduce. 3.2.2 Change in average traffic flow speed
Another factor shows the change in average traffic flow speed between two points on the observed section of the motorway. Value of speed change on the observed section gives an insight into the change of the average speed of traffic flow between two points on the basis of which a conclusion can be made on traffic flow behaviour on the observed section. If there is a minor change in average speed on the observed section this means that the vehicle speed is almost constant, or that there is no considerable acceleration or deceleration. In case that the value of factor of average speed variation on the observed section assumes a considerable change, it can be concluded that there have been considerable changes in speed of individual vehicles which means that for some reason here was a significant acceleration or deceleration. The calculation to determine speed changes in the observed section according to Lee et al. [30] is:
∑∑−
∑∑=
=−=
=−==−=)(1
Δ)(1
Δ 2
2
12Δ1
1
11Δ
21
tvnt
ttv
ntt
vvQ
i
n
i
*t
t*tt
pi
n
i
*t
t*tt
p (4)
where: Q - average speed difference between beginning and end of observed section (km/h), 21 , vv - average speeds during period ∆t on end points of observed section (km/h), tp - duration of time interval of observed speed (seconds), ∆t - observation time (seconds), t* - time of traffic accident occurrence, v1i(t) - speed on traffic lane i

B. Huzjan i dr. Model stvarno-vremenskog upravljanja sigurnošću prometa na autocestama
Tehnički vjesnik 24, 5(2017), 1457-1469 1461
in time t at the end of the section (km/h), v2i (t) - speed on traffic lane i in time t at the beginning of the section (km/h), n1, n2 - number of traffic lanes on end points of observed section.
Time interval of measuring speed change in the fixed point on the observed section will be 5 minutes and freight vehicles will be exempt from calculation in this case, too. By measuring the changes in speed between the two locations on the test section, it was found that the speed at normal flow may deviate slightly or that it deviates only 5-6 km/h.
To simplify the practical model of speed variance between the two points, the entire cross-section of the carriageway, that is the whole cross-section of the carriageway, will be observed as one traffic lane. Since the weighting factor of speed variation as well as the speed deviation factor also depend on the speed at which the change occurs, that dependency will also be introduced in the calculation, and the modified calculation will be expressed as:
1
21
vvvQ −
= (5)
3.2.3 Factor of overtaking frequency
According to the model of Lee et al. [31] the frequency of lane change was taken into account as a very important factor. The factor was calculated based on the average covariance difference of load of an individual lane on the observed motorway section. The Covariance is the value that indicates how much two variables vary together, as opposed to the variance, which describes the changes in the value of a single variable. The coefficient of lane change frequency shown by equation (1) (COVV) is not relevant for the type of motorways in the Republic of Croatia, since the overtaking lane is used for overtaking and not for driving. For this reason, the volume change in each lane used in the model of Lee et al. [30] was not an appropriate way to determine the frequency of lane change (in this case overtaking frequency).
Overtaking frequency can be obtained by linking factors that cause overtaking. In this case we can introduce slow vehicles (freight vehicles). Analysis of traffic count found that there are occasionally over 25% of freight vehicles while the average proportion of freight vehicles in a typical day is about 10% on the test section in the total traffic volume. Except for the influence of slow vehicles to overtaking frequency, traffic flow analysis on the test section, it was also found that personal vehicles which drive below the speed limit have a significant impact on the need to change the lane, or overtake. The calculation for determining frequency change of traffic lane (in this case overtaking) for the motorways with one vehicle and one overtaking lane is shown by the equation:
)()( SLHV nunuP += (6) where: P - overtaking frequency factor, u(nHV) - share of freight vehicles in observed period ∆t, u(nSL) - share of
number of vehicles in period ∆t which drive below the speed limit.
Overtaking impact factor will be shown through the share of freight vehicles which are assumed to be overtaken on a certain section, and through the share of personal vehicles driving below the speed limit, for which it is also expected that they will be overtaken on a certain section. In order to quantify the additional risk of overtaking freight vehicles, the share of heavy vehicles is weighted with a coefficient of 2. In the absence of exact data about the increase danger when overtaking freight vehicle, coefficient is estimated in a manner that is equivalent to the factor for converting freight vehicles in equivalent units of personal vehicles to indicate flow or traffic flow intensity. According to the research conducted on the test section, the average factor of overtaking frequency can be shown as:
qn
qnP SLHV += 2 (7)
where: P - crash potential factor due to overtaking, nHV - number of freight vehicles, nSL - the number of personal vehicles travelling below the speed limit, q - total number of vehicles in the observed period. 3.2.4 Degree of saturation
An analysis of accidents that occurred on the test section from 2008 to 2011 found significant correlation between the number of traffic accidents and traffic volume. Hour traffic volume is reduced to the unit of ratio between volume and capacity V/C (degree of saturation).
Constant value of 1,650 vehicles per traffic lane and 3,300 vehicles on both lanes was taken as capacity value for this analysis.
The values of degree of saturation were classified in 10 groups, for which a statistical analysis was conducted.
The analysis was conducted for 132 accidents. Graphic presentation of the number of accidents in relation to the road load is shown in Fig. 3.
Figure 3 Ratio of number of accidents in relation to section volume and
capacity – degree of saturation (Source: prepared by authors)
It can be concluded from this histogram that there is a statistically significant dependency between the traffic volume and the number of accidents occurred. Regularity can also be shown mathematically:
3231
76022.
CV.I
−
⋅= (8)

Real-time traffic safety management model on motorways B. Huzjan et al.
1462 Technical Gazette 24, 5(2017), 1457-1469
where: I - crash potential factor due to traffic intensity, V/C - degree of saturation.
Measure of correlation (R2), for the said expression, amounts to 0.9546 which confirms strong correlation between the two analysed values (Fig. 2). The relationship between traffic volume and the number of accidents is inversely proportional, meaning that the higher number of accidents occurs when traffic volume is lower. This is because drivers drive more carefully when traffic density is higher, they are more concentrated and give more attention to vehicles around them and external factors, while in the conditions of lower traffic volume they are more relaxed when driving, meaning they are less focused on driving. The largest number of accidents occurred when traffic volume amounted up to 20% of traffic capacity.
The value of this parameter cannot be changed by influencing traffic flow by light text signs or variable message signs and the function of this parameter is just for determining the crash potential. 3.2.5 Impact of structures
Since the motorways in the Republic of Croatia include a large number of structures such as tunnels, bridges, viaducts, toll stations, road side facilities etc., in accordance with the research [10] in which the effect of structure to the occurrence of accidents on the motorways was demonstrated, impact analysis of structures to the crash potential value was made.
It was determined for all databases of accidents which occurred in the analysed three-year period whether they happened on the structure or regular motorway section. In this analysis, the structure was considered a structure on motorway section in the zone of the structure itself and the section in the length of up to 500 m before and after the structure.
By analysing data using this methodology, it was found that from the total number of 180 accidents with a known position, 42 accidents happened in the zone of the structure, which accounts for about 23% of accidents. If the length of motorway sections on the structures is analysed in relation to the overall length of the section, it is found that the length of the test section on the structures is 36.27 kilometres, which is, in relation to the overall length of the test section of 146.5 km, around 24%.
Based on this analysis, it can be concluded that the share of accidents on the structures is proportional to the share of structure length in the total length of the test section, and that the structures do not have a significant impact on the nature and the type of accidents that will try to be prevented by the application of the model. 3.2.6 Meteorological conditions As it has been proven by the studies [26, 29, 36] the impact of weather conditions is an important factor in traffic safety on the motorways. According to research of the dependency of the number of accidents and weather conditions and the state of the carriageway at the time of the accident (dry, wet, covered in snow), data was received that 71% of accidents happen in the conditions
of dry pavement, or in favourable meteorological conditions. The analysis of the data on accidents on the test section in the period from early 2009 until the end of 2011, shows that only 25% of accidents happened in adverse weather conditions. Since there are already algorithms of including variable speed limits in relation to weather conditions for the test section, it can be concluded that these algorithms have a positive impact on traffic safety, or that they determine well the values of variable message signs of restriction and light text signs. In case of adverse weather conditions, the existing algorithm of VMS will be activated with priority, based on weather conditions, and then the crash potential will be calculated by the new model which can then further reduce speed limit or include additional text message. 3.2.7 Time of day
Another factor which, according to previous models [27, 28, 29], was not taken into account is the crash potential depending on the time of day. Day and night were defined as the values of the time of day. The study was conducted for the accidents on the test section in the past three years. The share of accidents which occurred during the night can be defined through the expression:
(total)
(night)
ACC
ACC
NN
M = (9)
where: M - share of accidents which occurred during the night, NACC(night) - number of accidents which occurred during the night, NACC(total) - total number of accidents.
According to Tab. 1, 14,8% of traffic accidents occurred during the night. Since the traffic volume of the motorway is considerably lower at night, the share of accidents that occurred during the night needs to be correlated with the ratio of traffic volume in the day and night hours.
If average traffic volume of the characteristic day on the test section (Tab. 1) is analysed, it is determined that out of the total daily load of 17,381vehicles during the day (daylight) traffic volume was 15,212 and 2,169 during the night.
Consequently, the share of traffic in night hours in total traffic flow during 24 hours is:
(total)
(night)
Z = (10)
where: Z - share of vehicles in night hours, q(night) - traffic volume during night hours, q(total) - total traffic volume during 24 hours.
Correlation of the number of accidents that occurred during night hours and the intensity of traffic in night hours can be expressed as:
ZMk = (11)

B. Huzjan i dr. Model stvarno-vremenskog upravljanja sigurnošću prometa na autocestama
Tehnički vjesnik 24, 5(2017), 1457-1469 1463
In accordance with that, crash potential during the night can be shown as:
kp −=1 (12)
Based on this analysis, the overall crash potential will increase by 16% during the night hours. Based on this, the factor of crash potential due to time of day (day or night) will have two values: p = 0.84 for day and p = 1 for night.
Table 1 Results of measured and obtained parameters for a four-lane motorway
σs iv CVS 1v 2v P 18.609 147.29 0.127 146.0 140.0 0.483
nHV nSL g M N(night) N(total) 2.058 6.075 21.102 0.148 29 17,381
N q(night) q(total) k p 0.124 2,169 17,381 0.84 0.16
Source: prepared by authors 3.3 Mathematical form of the model
In accordance with the newly researched factors that affect traffic flow safety on the tested section, a mathematical model developed according to the Lee et al. model [29, 30, 31] is given, which can be used for:
[ ] MVnPnQnCVSnn ⋅+++= )()()()(41 (13)
where: n - total crash potential, n(CVS) - crash potential due to speed variance on fixed location, n(Q) - crash potential due to speed variance between two points, n(P) - crash potential due to overtaking, n(V) - crash potential due to traffic volume, M - crash potential due to night.
Equal weighting factor is determined to each of these five elements in the model in the total crash potential. In that way, the most unfavourable values of all elements will give the highest value of the crash potential. The range from the most favourable to the most unfavourable value is determined based on the results of the research conducted on the test section. The most unfavourable value will be the most unfavourable hourly value during the research period, and the most favourable will be the most favourable theoretical value or the most favourable value obtained by measuring during the research period. Table 2 Results of variables that affect traffic safety on the test section
Value Best Poor Result
CVS 0 0.147 6.801
max=
CVS
ivσs6.80
Q 0 0.069 .493411
max=
Q
1
2119314v
vv. −⋅
P 0 0.877 1.1401
max=
P
+⋅⋅
qn
qn. SLHV21401
I 2.762 58.068 0.1721
max=
O 3231)(4750 .CV. −⋅
M 1 1.16 1 (day) or 1.16 (night) Source: prepared by authors
Movement of the variable CVS depending on the speed deviation, since freight vehicles are excluded from the sample for this factor, can be from 0 to 0.147. The value of the Q variable, depending on the difference in speed of two points can be from 0 to 0.069. The value of the P variable, depending on the share of freight vehicles and the vehicles which drive below the speed limit, can be from 0 to 0.877. In order to reduce the CVS, Q and P factors to the common value with the other factors, they will be calculated so that the highest value of the factor is 1.
Value I is about the exponential function, and to avoid this very low value of load from producing illogically high values of crash potential, value V/C=1 was taken as the minimum value of load as the most favourable value, or the value at which the minimum number of accidents is determined to V/C=1, and the value of maximum road load. As determined in the studies, crash potential increases at night by 16%. Based on this parameter M can take on two values: M = 1 during the day and M = 1.16 during the night.
Mathematical model was made based on the conducted research, the result of processing statistical data on the accidents and the results of measured parameters of traffic flow on the test section:
⋅+
+⋅+
+
−⋅+⋅=
− 32311
21
1
1
47502
141
19314.8064
.SLHV
CV.
qnn....
...v
vv.v
Mn s
(14)
Value of danger factor in standard situations can
amount from 0 to 1. In extreme situations or during certain disruptions of traffic flow on motorways, the value of danger factors may exceed 1 (Fig. 4).
It is important to note that this is a theoretical model in which the weighting factors of a certain model component which affect the crash potential are estimated as equal, because it is not easy to investigate what is the exact impact of individual components on the crash potential.
In order to determine precisely the weighting factor of each model component, basic parameters of traffic flow used as input to the model should be recorded in future, for every accident. Accidents in the three-year period should be monitored in this way, and then the calibration of the model should be performed. 3.4 Application of the model
Application of the model in real time is possible for
traffic safety management on four-lane motorways. By measuring basic parameters of traffic flow and entering them into model it is possible to determine the value of the factor of danger. If high value of danger factor is determined, the system of variable message signs for speed restrictions will affect the traffic flow to reduce the value of the parameter that increases the factor of crash potential. Based on input data, the value of the factor for crash potential will be calculated. The theoretical value of factors can be from 0 to 1, and the value of the factor will
Real-time traffic safety management model on motorways B. Huzjan et al.
1464 Technical Gazette 24, 5(2017), 1457-1469
be divided into three categories: low, acceptable and high (Fig. 4).
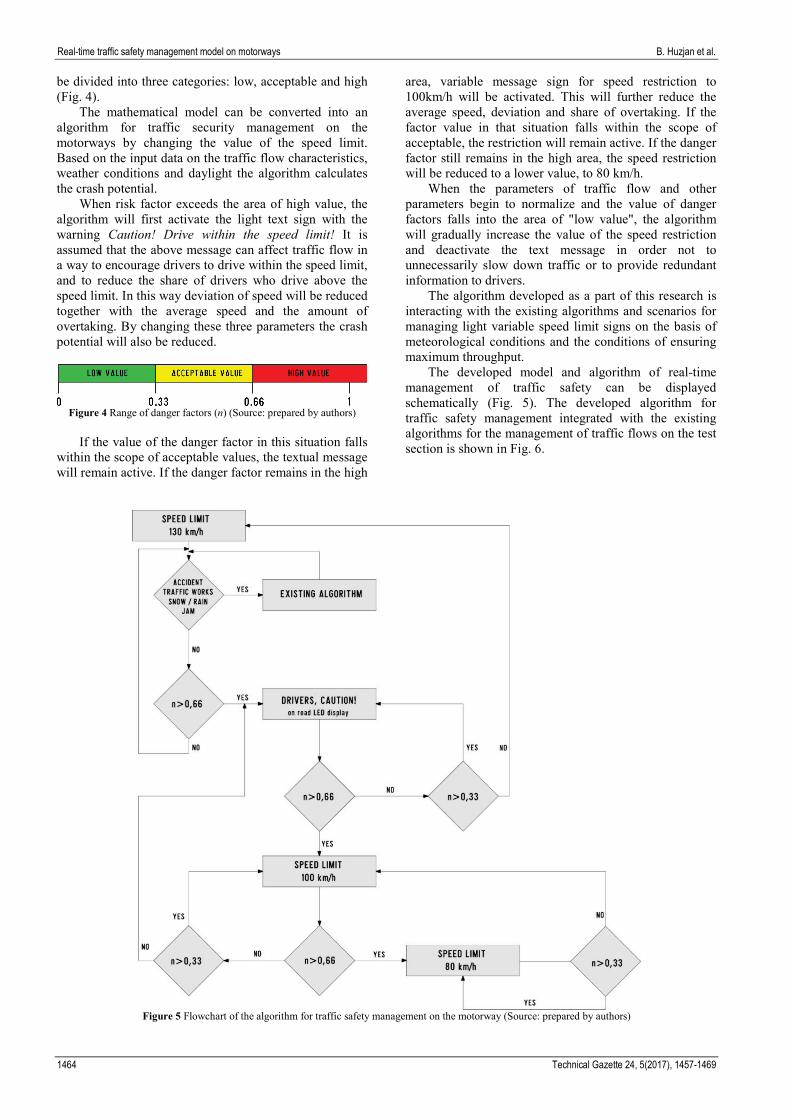
The mathematical model can be converted into an algorithm for traffic security management on the motorways by changing the value of the speed limit. Based on the input data on the traffic flow characteristics, weather conditions and daylight the algorithm calculates the crash potential.
When risk factor exceeds the area of high value, the algorithm will first activate the light text sign with the warning Caution! Drive within the speed limit! It is assumed that the above message can affect traffic flow in a way to encourage drivers to drive within the speed limit, and to reduce the share of drivers who drive above the speed limit. In this way deviation of speed will be reduced together with the average speed and the amount of overtaking. By changing these three parameters the crash potential will also be reduced.
Figure 4 Range of danger factors (n) (Source: prepared by authors)
If the value of the danger factor in this situation falls within the scope of acceptable values, the textual message will remain active. If the danger factor remains in the high
area, variable message sign for speed restriction to 100km/h will be activated. This will further reduce the average speed, deviation and share of overtaking. If the factor value in that situation falls within the scope of acceptable, the restriction will remain active. If the danger factor still remains in the high area, the speed restriction will be reduced to a lower value, to 80 km/h.
When the parameters of traffic flow and other parameters begin to normalize and the value of danger factors falls into the area of "low value", the algorithm will gradually increase the value of the speed restriction and deactivate the text message in order not to unnecessarily slow down traffic or to provide redundant information to drivers.
The algorithm developed as a part of this research is interacting with the existing algorithms and scenarios for managing light variable speed limit signs on the basis of meteorological conditions and the conditions of ensuring maximum throughput.
The developed model and algorithm of real-time management of traffic safety can be displayed schematically (Fig. 5). The developed algorithm for traffic safety management integrated with the existing algorithms for the management of traffic flows on the test section is shown in Fig. 6.
Figure 5 Flowchart of the algorithm for traffic safety management on the motorway (Source: prepared by authors)

B. Huzjan i dr. Model stvarno-vremenskog upravljanja sigurnošću prometa na autocestama
Tehnički vjesnik 24, 5(2017), 1457-1469 1465
Figure 6 Algorithm for safety management, integrated with existing algorithms for traffic management on the test section (for one type of VMS and light text signs), (Source: prepared by authors)
4 Testing the model
In order to confirm the reliability and applicability of the model, the model was tested in different traffic situations. Testing is possible on actual roads, the traffic polygons or by using computer models. When testing is conducted on actual roads, it is necessary that it has no negative impact on the traffic safety or the level of service of the road.
Computer model of the motorway was selected to test the traffic safety management model. The model of the motorway was made in the software package PTV VISSIM. With the aid of the above mentioned programme, a computer simulation of the motorway section was made in which the applicability of the model was tested. Traffic flow parameters, obtained through field research were used for the creation of the simulation so that the simulated section matches the actual state of the road to the greatest possible extent.
The aim of this simulation is to compare the parameters of traffic flow on the motorway before activating a variable sign for speed restriction and after activating such a sign and testing the impact of such changes on the crash potential. In order to test the model, the simulation of the motorway section was made in the
length of 10 km. Simulation is restricted to one way traffic or to one lane of the four-lane motorway. The motorway section was equipped in this simulation with variable message signs. Besides, the share was equipped with sensors for measuring basic characteristics of traffic flow. Every 2 km a variable message sign for speed restriction was set up on the motorway section, and behind the sign a sensor which measures traffic flow parameters. One sensor was placed before the first variable message sign for speed restriction. Traffic flows in a several scenarios will be simulated on such a section. The scenarios are divided by traffic intensity on the motorway and by the number of vehicles which respect the sign of variable speed restriction with increased share of freight vehicles in the traffic flow.
The simulation can test the change of total crash potential due to the change of risk due to speed deviation on the fixed location due to changes in risk because of overtaking and due to the change of risk due to traffic volume. Risk resulting from the differences in speed in two points will be excluded from the simulation by equalizing speed on both points or by reducing the difference to zero. The crash potential factor due to night will also be excluded from the simulation so that it is assumed that the complete analysis is carried out during

Real-time traffic safety management model on motorways B. Huzjan et al.
1466 Technical Gazette 24, 5(2017), 1457-1469
daylight. The number of freight vehicles and road load in the simulation are defined by a percentage and this value will be entered into the model. According to Tab. 3, scenarios S2, S5, S6, S8, S9 and S10 were selected for testing, as characteristic exemplars of traffic conditions.
Table 3 Simulation scenarios during daylight Share of freight vehicles 5 and 15%
Traffic flow (% capacity)
Keeping within the speed limit Low
(40%) Medium (70%)
High (90%)
Low (20%) S1 S2 S3 Medium (50%) S4 S5 S6
High (90%) S7 S8 S9 Share of freight vehicles 15%
High (90%) S10 Source: prepared by authors 5 Discussion of the simulation results
Entry parameters for all simulations are shown in Tab. 4. The point in question is free traffic flow with motorway traffic volume of 20% capacity (simulation S-2). It is evident that crash potential increases with the speed limit. The above phenomenon occurs due to the
increase in speed deviations, as some drivers respect the limitations, and some do not, and the difference in speed increases which negatively affects traffic safety.
The test found that in conditions of very low traffic volume, variable speed limits cannot affect traffic flow safety according to the model created. For this reason, the test was repeated with higher traffic volume.
The test found that in conditions of very low traffic volume, variable speed limits cannot affect traffic flow safety according to the model created. For this reason, the test was repeated with higher traffic volume.
Simulation S-5 was carried out to explore how speed reduction influences traffic safety under medium traffic volume. Traffic volume was increased to 50% capacity. In these circumstances, the risk of traffic accidents slightly increases with the speed limit. The above phenomenon occurs due to the increase in speed deviations as some drivers respect the limitations, and some do not, so the difference in speed increases which negatively affects traffic flow safety. From the value of crash potential factor, which is close to 1, it can be concluded that this situation is close to the actual situation on the test section according to which the limit values of crash potential factor are defined.
Table 4 Entry traffic parameters for various simulation scenarios
Scenario simulation
Motorway volume
V/C
Speed limit (km/h)
Crash potential - n 90% of drivers keep within the
speed limit
70% keep within the speed limit Improvement (%) Freight
vehicles 15% Freight
vehicles 5%
S-2 0,2 120 1.90 100 2.46 80 3.27
S-5 0,5 120 0.90 100 0.99 80 1.09
S-6 0,5 120 0.72 0.90 25 100 0.74 0.99 34 80 0.90 1.09 21
S-8 0,9 120 0.63 100 0.55 80 0.54
S-9 0,9 120 0.50 0.63 26 100 0.48 0.55 15 80 0.48 0.54 13
S-10 0,9 120 0.71 0.63 100 0.63 0.55 80 0.60 0.54
Source: prepared by authors
The parameters of simulation S-6 are 50% of traffic volume capacity. The comparison of crash factor value is shown in the conditions when 70% of drivers keep within the variable message sign, with the speed limit in the conditions in which 90% of drivers keep within the speed limit signs. From the test conducted, it is concluded that in the conditions of normal traffic flow with 50% capacity of traffic volume the use of the message "Keep within the speed limit" can reduce the crash factor by 25%. The test shows that in such traffic flow conditions it is still not necessary to reduce the speed limit since the crash potential factor slightly increases with the speed limit reduction.
In order to test the movement of crash potential factor in conditions of high traffic volume, the simulation S-8 for traffic volume of 90% of road capacity was made. The results show that crash potential factor can be reduced at 90% traffic volume capacity by reducing the speed limit. Should this scenario increase the number of vehicles which keep within the speed limit by using additional measures, it is assumed that the crash potential factor would significantly reduce. This test was repeated for that reason with an increased share of vehicles which keep within the speed limit. Repeated test criteria refer to 90% traffic volume. Comparison of crash potential factor was made in the conditions when 70% of drivers keep within the speed

B. Huzjan i dr. Model stvarno-vremenskog upravljanja sigurnošću prometa na autocestama
Tehnički vjesnik 24, 5(2017), 1457-1469 1467
limit on the variable message sign, with the conditions in which 90% of drivers keep within the speed limit (simulation S-9). The results show that with 90% capacity of traffic volume on the motorway, crash potential factor can be significantly reduced by encouraging drivers to keep within the speed limit. Increase of the number of drivers which keep within the speed limit from 70% to 90% is achieved by reducing the crash potential factor from 13 to 26% depending on the speed limit. Since the share of freight vehicles has significant influence on the crash potential factor, the simulation also tested the impact of the number of freight vehicles to crash potential factor. To test the impact of the share of freight vehicles to crash potential factor a scenario has been made with traffic volume of 90% capacity (simulation S-10). It can be concluded from the data presented that the crash potential factor can be reduced in such traffic flow conditions by reducing the speed to 100 or 80 km/h. In order to show the impact of freight vehicles share to crash potential factor, a comparison of crash potential factor for the same traffic flow conditions with a different share of freight vehicles was made. Increasing the share of freight vehicles has a negative impact to crash potential factor. By increasing the share of freight vehicles the crash potential factor also increases in the same traffic flow conditions. The conducted test suggests that with a 15% share of freight vehicles only by reducing the speed limit to 100 km/h the same crash potential factor is achieved as with a 5% share of freight vehicles at a speed of 120 km/h. Based on the simulation test it is concluded that the crash potential is a reliable indicator of the crash potential risk on the motorway. By changing the percentage of vehicles that keep within the speed limit or by changing the speed limit, the crash potential factor is reduced, which confirms the assumption that it is a good parameter for management of variable message signs in order to increase traffic safety. 6 Conclusion Road traffic safety is a constant subject of study for the purpose of reducing traffic accidents (and the implications they bring) and increasing the basic capacity of the infrastructure. In the Republic of Croatia and its wider European setting, main interregional road infrastructure is mainly of characteristic profile with a high level of serviceability (motorways with 4 lane /with the driving and overtaking lane on one carriageway/). This is a four-lane profile with separated carriageways with one driving, overtaking, and emergency lane. That is why the research was conducted for such motorways. Research conducted within this paper brings the relation of traffic accidents to correlation with basic parameters of traffic flow measured in the zone and the moment of accident occurrence. Model of real-time traffic safety management was made on the motorways with the purpose of reducing the crash potential factor. Model development is based on the final calibration of Lee’s model. The model defines the total crash potential according to current parameters of traffic flow as a function of risk due to speed variation on the fixed
location between the two points, on grounds of overtaking, traffic volume and traffic flow at night. The model distinguishes between the three risk levels (low, acceptable and high value) and based on that an algorithm is defined which allows traffic harmonization by regulating speed limits on motorways. This new model can be integrated as an upgrade of existing algorithms and scenarios which are used to manage variable message signs. The model is tested in several characteristic scenarios using simulation tools. Traffic flow intensity with varying levels of keeping within the speed limit and various shares of freight traffic and speed restrictions were changed in different scenarios by this simulation. It was proved that crash potential increases with speed restrictions in free traffic flow at low motorway traffic volume. The above phenomenon occurs due to speed variation increase since some drivers do not respect the speed reduction. Therefore, variable speed limit cannot affect traffic flow safety in the conditions of low traffic volume according to the developed model. If traffic volume increases to its half, or to normal traffic flow, it is possible to reduce the crash potential factor by 25%. The test shows that in such conditions of traffic flow it is still not necessary to reduce the speed limit because the crash potential factor slightly increases with the speed limit reduction. It is only necessary to activate the message to the drivers to reduce their speed and keep within the speed limit in accordance with the permanent traffic signs which is 130 km/h, or 110 km/h, depending on the part of the motorway. Furthermore, the research shows that the reduction of speed limit can reduce the crash potential factor at 90% capacity of motorway traffic volume. If during such traffic volume on the motorway the number of drivers who keep within the speed limit increases, reduction of crash potential factor is achieved up to one quarter, depending on the speed limit. Since the share of freight vehicles has a considerable impact on the crash factor, the impact of number of vehicles to crash potential factor was also tested in the simulation. Crash potential factor increases in conditions of high motorway traffic volume and increased share of freight vehicles. Only after reducing the speed limit to 100 km/h, with the share of freight traffic of 15%, is the crash potential factor achieved as it is at a speed of 120 km/h and with a 5% share of freight vehicles. By applying this new model, crash potential factor on motorways can be reduced and the level of traffic safety on four-lane motorways increased. For the sake of keeping within the speed limits, which result from the model, to a higher degree, it is desirable to include the control mechanisms (the Police) in order to harmonize the traffic flow as soon as possible. Acknowledgment The research reported in this paper is partially funded by the FP7 - Collaborative Project: Intelligent Cooperative Sensing for Improved traffic efficiency - ICSI (FP7-317671)

Real-time traffic safety management model on motorways B. Huzjan et al.
1468 Technical Gazette 24, 5(2017), 1457-1469
7 References [1] Bulletin on road traffic safety 2011. Ministry of Interior,
Department for strategic planning, analytics and development, ISSN 1331-2863, Zagreb, 2012.
[2] National report on motorways 2011. Croatian Association of Toll Motorways Concessionaires (HUKA), Zagreb, 2012.
[3] CARE (EU road accidents database) or national publications, European Commission. Directorate General Energyand Transport. http://ec.europa.eu/transport/wcm/ road_safety (15.11.2015)
[4] Solomon, D. Accidents on main rural motorways related to speed, driver, and vehicle. Technical report, U.S. Department of Commerce/Bureau of Public Roads, 1964, reprinted 1974.
[5] Van de Hoogen, E.; Smulders, S. Control by Variable Speed Signs, Results of the Dutch Experiment. // Road Traffic Monitoring and Control. Conference Publication 391 / 1994, pp. 145-149.
[6] Borrough, P. Variable Speed Limits Reduce Crashes Significantly in the U.K. // The Urban Transportation Monitor, 1997.
[7] Kirchsteiger, C. Impact of Accident Precursors on Risk Estimates from Accident Databases. // Journal of Loss Prevention, Process Ind. 10, 3(1997), pp. 159-167. http://cdn.elsevier.com/assets/pdf_file/0009/115578/ICHEME_VSI_4.pdf (22.06.2014)
[8] Corby, M. J.; Saccomanno, F. F. Analysis of Freeway Accident Detection. // Transportation Research Record 1603, TRB, National Research Council, Washington, D.C., 1998, pp. 80-89. http://www.civil.uwaterloo.ca/bhellinga/ publications/Publications/TRB%202002%20Precursors%20%2802-3790%29.pdf (11.11.2014)
[9] Hughes, R.; Council, F. On Establishing the Relationship(s) between Freeway Safety and Peak Period Operations: Performance Measurement and Methodological Considerations. // 78th Annual Meeting of Transportation Research Board, Washington, D.C., 1999. http://www.academia.edu/662665/Safety_Applications_of_Automatic_Vehicle_Identification_and_Real-Time_ Weather_Data_on_Freeways(19.11.2014)
[10] Oh, Cheal; J. Chang; Chang, M. Effects of Traffic Condition (v/c) on Safety at Freeway Facility Sections // Transportation Research Circular E-C018, 4th International Symposium on Motorway Capacity / Maui, Hawaii, 2000, pp. 200-208. http://onlinepubs.trb.org/onlinepubs/circulars/ ec018/18_27.pdf (11.11.2014)
[11] Oh, C.; J. Oh; S. Ritchie.; Chang, M. Real-Time Estimation of Freeway Accident Likelihood. // 80th Annual Meeting of Transportation Research Board, Washington, D.C., 2001, pp. 1-16. https://scholar.google.com/citations?user= rgwiy4YAAAAJ (17.09.2014)
[12] Feng, C. Synthesis of Studies on Speed and Safety. // 80th Annual Meeting of Transportation Research Board, Washington, D.C., 2001, pp. 86-92. https://doi.org/10.3141/1779-12
[13] Lee, C.; Saccomanno, F.; Hellinga, B. Analysis of Crash Precursors on Instrumented Freeways. // Transportation Research Record 1748, TRB, National Research Council, Washington, D.C., 2002, pp. 1-8. https:// doi.org/10.3141/1779-12
[14] McLawhorn, N. Variable Speed Limit Signs for Winter Weather. Wis-DOT. Winsconsin, 2003. http://wisdotresearch.wi.gov/wp-content/uploads/ tsrwintervariablespeedlimitsigns1.pdf
[15] Lee, C.; Hellinga, B.; Saccomanno, F. Real-Time Crash Prediction Model for Application to Crash Prevention in Freeway Traffic. // Transportation Research Record. 1840(2003), pp. 67-77. https://doi.org/10.3141/1840-08
[16] Lee, C.; Hellinga, B.; Saccomanno, F. Assessing Safety Benefits of Variable Speed Limits. // Transportation Research Record. 1897(2004), pp. 183-190. https://doi.org/10.3141/1897-24 (25.03.2015)
[17] Abdel-Aty, M.; Pande, A.; Uddin, N.; Dilmore, J.; Pemmanaboina, R. Relating Crash Occurrence to Freeway Loop Detectors Data, Weather Conditions and Geometric Factors. // Final Report, Department of Civil & Environmental Engineering, University of Central Florida, 2005.
[18] Abdel-Aty, M.; Uddin, N.; Pande, A. Split models for predicting multi-vehicle crashes during high-speed and low-speed operating conditions on freeways. // 84th Annual Meeting of the TRB, Washington, DC, 1908, 2005.
[19] Lee, C.; Hellinga, B.; Saccomanno, F. Evaluation of variable speed limits to improve traffic safety. // Transportation Research Part C: Emerging Technologies, 14, 3 (2006), pp. 213-228. https://doi.org/10.1016/j.trc.2006.06.002
[20] Abdel-Aty, M.; Dilmore, J.; Dhindsa, A. Evaluation of Variable Speed Limits for Real-Time Freeway Safety Improvement. // Accident Analysis and Prevention, 38(2006), pp. 335-345. http://www.sciencedirect.com/ science/article/pii/S0001457505001764 (05.01.2015)
[21] Cunningham, R. Examining Dynamic Variable Speed Limit Strategies for the Reduction of Real-Time Crash Risk on Freeways. // Department of Civil and Environmental Engineering, University of Central Florida, Orlando, 2007. http://etd.fcla.edu/CF/CFE0001723/Cunningham_Ryan_J_200708_MAST.pdf (02.02.2015)
[22] Wang, Y.; Guo, Z.-y.; Chen, H. Safety Assessment Based on Accident, Traffic Flow and Facilities Characteristics in Rural Freeways. // International Conference on Intelligent Computation Technology and Automation (ICICTA) 7 / Hunan, China, 2008, pp. 466-471.
[23] Zhu, Y. Study on the Traffic Safety Intelligent Warning Technologies and Methods Based on the Integrated Traffic Safety Dana. // First International Workshop on database Technology and Applications / Wuhan, Hubei, China, 2009, pp. 136-139.
[24] Xiaodoong, P.; Xiang, W.; Zhen, Y. Haozhe, C. Motorway Traffic Safety Management System Based on the Theory of Dissipative Structures and Catastrophe Theory. // International Conference on Information Management, Innovation Management and Industrial Engineering / Xi‛an, China, 2009, pp. 42-45.
[25] Carlson, C. R.; Papamichail, I.; Papageorgiou, M., Messmer, A. Optimal Motorway Traffic Flow Control Involving Variable Speed Limits and Ramp Metering. // Transportation Science, 44, 2 (2010), pp. 238-253. https://doi.org/10.1287/trsc.1090.0314
[26] Sivanesan, C.; Sundararajan, R. Modeling Road Accidents for Undivided Two-Line Motorway Segments with Mixed Traffic. // European Journal of Scientific Research, ISSN 1450-216X, 62, 4 (2011), pp. 491-499.
[27] Heydecker, B. G.; Addison, J. D. Analysis and modelling of traffic flow under variable speed limits. // Transportation Research Part C: Emerging Technologies. 19, 2(2011), pp. 206-217. https://doi.org/10.1016/j.trc.2010.05.008
[28] Xu, C.; Liu, P.; Wang, W.; Li, Z. Evaluation of the impacts of traffic states on crash risks on freeways. // Accident Analysis & Prevention, 47, 2012, pp. 162-171. https://doi.org/10.1016/j.aap.2012.01.020
[29] Youngtae, J.; Hyungdo, C.; Soobin, J.; Inbum, J. Variable Speed Limit to Improve Safety near Traffic Congestion on Urban Freeways // Information Science and Technology (ICIST), 2012 International Conference / Huazhong, China, 2012, pp. 43-50.
[30] Chena, D.; Ahnb, S.; Hegyic, A. Variable speed limit control for steady and oscillatory queues at fixed freeway

B. Huzjan i dr. Model stvarno-vremenskog upravljanja sigurnošću prometa na autocestama
Tehnički vjesnik 24, 5(2017), 1457-1469 1469
bottlenecks. // Transportation Research Part B: Methodological. 70 (2014), pp. 340-358. https://doi.org/10.1016/j.trb.2014.08.006
[31] Li, Z.; Liu, P.; Xu, C.; Wang, W. Optimal Mainline Variable Speed Limit Control to Improve Safety on Large-Scale Freeway Segments. // Computer Aided Civil and Infrastructure Engineering, online 2015 https://doi.org/10.1111/mice.12164
[32] Ebolia, L.; Guidoa, G.; Mazzullaa, G.; Pungilloa, G. Experimental relationships between operating speeds of successive road design elements in two-lane rural highways // Transport, Vilnius, Lithuania, 2015, online. https://doi.org/10.3846/16484142.2015.1110831
[33] Çodur M. Y.; Tortum, A. An Artificial Neural Network Model for Highway Accident Prediction: A Case Study of Erzurum. // Promet – Traffic & Transportation, 27, 3(2015), pp. 217-225. https://doi.org/10.7307/ptt.v27i3.1551
[34] Intelligent Cooperative Sensing for Improved Traffic Effici-ency. R&D project, 7. Frame programme EU commission 2012-2015., EC-FP7-317671.
Authors’ addresses Boris Huzjan, Ph. D. Rijeka - Zagreb Motorway Širolina 4, HR-10000 Zagreb, Croatia [email protected] Prof. Sadko Mandžuka, Ph. D. Faculty of Transport and Traffic Sciences Vukelićeva 4, HR-10000 Zagreb, Croatia [email protected] Prof. Goran Kos, Ph. D. Institut for Tourism Vrhovec 5, HR-10000 Zagreb, Croatia [email protected]