real-time classification of evoked emotions using facial feature tracking and physiological...
TRANSCRIPT

ARTICLE IN PRESS
1071-5819/$ - se
doi:10.1016/j.ijh
�CorrespondE-mail addr
(I.B. Mauss), ja
mjabon@stanfo
(C.A.C. Hutche
oliver.john@be
Int. J. Human-Computer Studies 66 (2008) 303–317
www.elsevier.com/locate/ijhcs
Real-time classification of evoked emotions using facial feature trackingand physiological responses
Jeremy N. Bailensona,�, Emmanuel D. Pontikakisb, Iris B. Maussc, James J. Grossd,Maria E. Jabone, Cendri A.C. Hutchersond, Clifford Nassa, Oliver Johnf
aDepartment of Communication, Stanford University, Stanford, CA 94305, USAbDepartment of Computer Science, Stanford University, Stanford, CA 94305, USA
cDepartment of Psychology, 2155 South Race Street, University of Denver, Denver, CO 80208, USAdDepartment of Psychology, Stanford University, Stanford, CA 94305, USA
eDepartment of Electrical Engineering, Stanford University, Stanford, CA 94305, USAfDepartment of Psychology, University of California, Berkeley, CA 94720, USA
Received 15 February 2007; received in revised form 28 October 2007; accepted 29 October 2007
Communicated by S. Brave
Available online 1 November 2007
Abstract
We present automated, real-time models built with machine learning algorithms which use videotapes of subjects’ faces in conjunction
with physiological measurements to predict rated emotion (trained coders’ second-by-second assessments of sadness or amusement).
Input consisted of videotapes of 41 subjects watching emotionally evocative films along with measures of their cardiovascular activity,
somatic activity, and electrodermal responding. We built algorithms based on extracted points from the subjects’ faces as well as their
physiological responses. Strengths of the current approach are (1) we are assessing real behavior of subjects watching emotional videos
instead of actors making facial poses, (2) the training data allow us to predict both emotion type (amusement versus sadness) as well as
the intensity level of each emotion, (3) we provide a direct comparison between person-specific, gender-specific, and general models.
Results demonstrated good fits for the models overall, with better performance for emotion categories than for emotion intensity, for
amusement ratings than sadness ratings, for a full model using both physiological measures and facial tracking than for either cue alone,
and for person-specific models than for gender-specific or general models.
r 2007 Elsevier Ltd. All rights reserved.
Keywords: Affective computing; Facial tracking; Emotion; Computer vision
1. Introduction
The number of applications in which a user’s face istracked by a video camera is growing exponentially.Cameras are constantly capturing images of a person’sface—on cell phones, webcams, even in automobiles—often with the goal of using that facial information as a
e front matter r 2007 Elsevier Ltd. All rights reserved.
cs.2007.10.011
ing author. Tel.: +1650 7230701; fax: +1 650 7232472.
esses: [email protected] (J.N. Bailenson),
ford.edu (E.D. Pontikakis), [email protected]
[email protected] (J.J. Gross),
rd.edu (M.E. Jabon), [email protected]
rson), [email protected] (C. Nass),
rkeley.edu (O. John).
clue to understand more about the current state of mind ofthe user. For example, many car companies (currently inJapan and soon in the US and Europe) are installingcameras in the dashboard with the goal of detecting angry,drowsy, or drunk drivers. Similarly, advertisers on webportals are seeking to use facial information to determinethe effect of specific billboards and logos, with theintention of dynamically changing the appearance of awebsite in response to users’ emotions regarding theadvertisements. Moreover, video game companies areinterested in assessing the player’s emotions during gameplay to help gauge the success of their products.There are at least two goals in developing real-time
algorithms to detect facial emotion using recordings of

ARTICLE IN PRESSJ.N. Bailenson et al. / Int. J. Human-Computer Studies 66 (2008) 303–317304
individuals’ facial behavior. The first is to assist in the typesof human–computer interaction (HCI) applications de-scribed above. The second is to advance our theoreticalunderstanding of emotions and facial expression. By usinglearning algorithms to link rich sets of facial anchor pointsand physiological responses to emotional responses ratedby trained judges, we can develop accurate models of howemotions expressed in response to evocative stimuli arecaptured via facial expressions and physiological responses.By examining these algorithms, social scientists who studyemotion will have a powerful tool to advance theirknowledge of human emotion.
2. Related work
2.1. Psychological research on emotion assessment
In the psychological literature, emotion has been definedas an individual’s response to goal-relevant stimuli thatincludes behavioral, physiological, and experiential com-ponents (Gross and Thompson, 2007). In the presentpaper, we focus on the assessment of the first two of thesecomponents. There are at least three main ways in whichpsychologists assess facial expressions of emotions (seeRosenberg and Ekman, 2000, for additional details).
The first approach is to have naı̈ve coders view images orvideotapes, and then make holistic judgments concerningthe degree to which they see emotions on target faces inthose images. While relatively simple and quick to perform,this technique is limited in that the coders may miss subtlefacial movements, and in that the coding may be biased byidiosyncratic morphological features of various faces.Furthermore, this technique does not allow for isolatingexactly which features in the face are responsible fordriving particular emotional expressions.
The second approach is to use componential codingschemes in which trained coders use a highly regulatedprocedural technique to detect facial actions. For example,the Facial Action Coding System (Ekman and Friesan,1978) is a comprehensive measurement system that usesframe-by-frame ratings of anatomically based facialfeatures (‘‘action units’’). Advantages of this techniqueinclude the richness of the dataset as well as the ability touncover novel facial movements and configurations fromdata mining the anchor points. The disadvantage of thissystem is that the frame-by-frame coding of the points isextremely laborious.
The third approach is to obtain more direct measures ofmuscle movement via facial electromyography (EMG) withelectrodes attached on the skin of the face. While thisallows for sensitive measurement of features, the placementof the electrodes is difficult and also relatively constrainingfor subjects who wear them. This approach is also nothelpful for coding archival footage.
The use of computer vision algorithms promises to be asolution that maximizes the benefits of the above statedtechniques while reducing many of the costs. In the next
section, we discuss some of the previous models ofdetecting facial emotions through computer algorithms.
2.2. Computer vision work
Automatic facial expression recognition and emotionrecognition have been researched extensively. One ap-proach has been to evaluate intensity of facial action units(Kimura and Yachida, 1997; Lien et al., 1998; Sayetteet al., 2001). Other experiments, such as Essa and Pentland(1997), have represented intensity variation in smiling usingoptical flow. They measured intensity of face muscles fordiscriminating between different types of facial actions.Similarly, Ehrlich et al. (2000) emphasized the importanceof facial motion instead of the actual face snapshots torecognize emotion in a network environment. While muchof the work analyzes the front view of the face, Pantic andPatras (2006) developed a system for automatic recognitionof facial action units and analyzed those units usingtemporal models from profile-view face image sequences.Many types of algorithms have been employed in this
endeavor. For example, Sebe et al. (2002) used videosequences of faces to show that the Cauchy distributionperforms better than the Gaussian distribution on recog-nizing emotions. Similarly, Tian et al. (2000) discriminatedintensity variation in eye closure as reliably as did humancoders by using Gabor features and an artificial neuralnetwork. Zhang et al. (1998) showed that a combination offacial point geometry and texture features, such as Gaborwavelets, led to more accurate estimation of the currentfacial gesture. Moreover, recent work in Bartlett et al.(2005) has continued to make use of representations basedon a combination of feature geometry and texture features.A system developed by Lyons (2004) automaticallytranslated facial gestures to actions using vision techniques.For a more detailed review of the state of the art of currentsystems, see Li and Jain (2005) or Lyons and Bartneck(2006).In terms of using the facial tracking data to predict
affective states, the pioneering work of Picard et al. (seePicard, 1997 for an early example, and Picard and Daily,2005, for a recent review of this work) has demonstratedacross a number of types of systems that it is possible totrack various aspects of the face, and that by doing so onecan gain insight into the mental state of the person whoseface is being tracked. More recently, el Kaliouby et al.(el Kaliouby et al., 2003; Michel and el Kaliouby, 2003;el Kaliouby and Robinson, 2005) have developed a generalcomputational model for facial affect inference and haveimplemented it as a real-time system. This approach useddynamic Bayesian networks for recognizing six classes ofcomplex emotions. Their experimental results demon-strated that it is more efficient to assess a human’s emotionby looking at the person’s face historically over a twosecond window instead of just the current frame. Theirsystem was designed to classify discrete emotional classesas opposed to the intensity of each emotion.
ARTICLE IN PRESSJ.N. Bailenson et al. / Int. J. Human-Computer Studies 66 (2008) 303–317 305
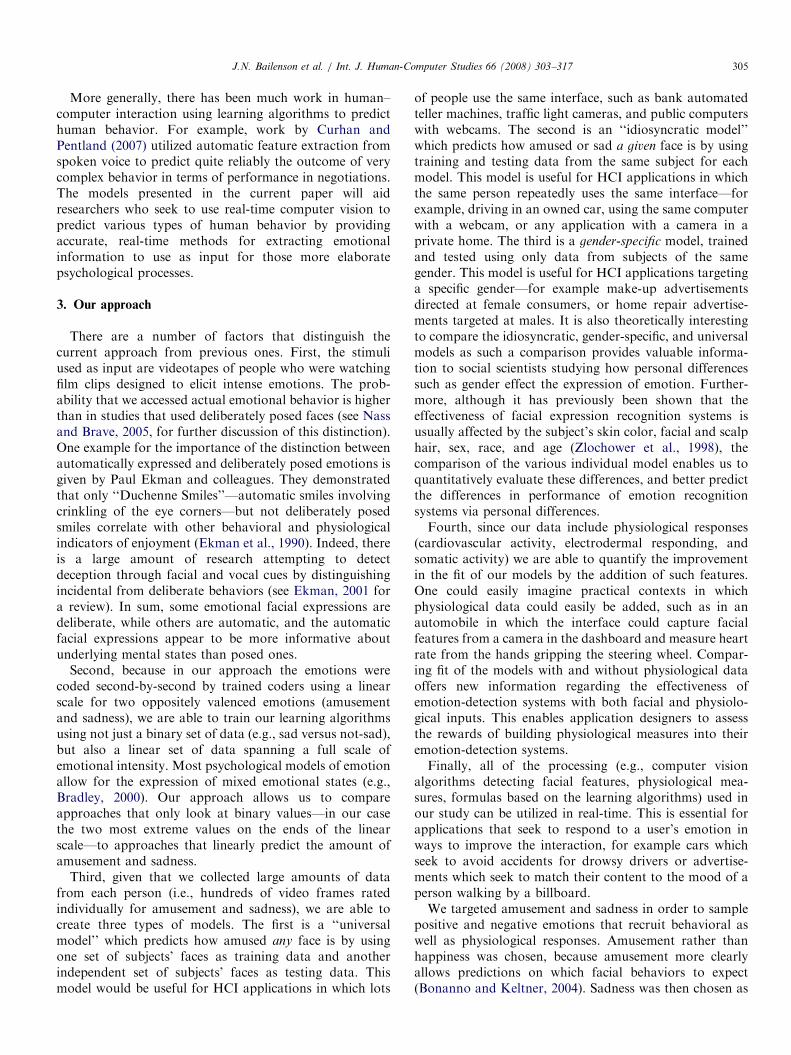
More generally, there has been much work in human–computer interaction using learning algorithms to predicthuman behavior. For example, work by Curhan andPentland (2007) utilized automatic feature extraction fromspoken voice to predict quite reliably the outcome of verycomplex behavior in terms of performance in negotiations.The models presented in the current paper will aidresearchers who seek to use real-time computer vision topredict various types of human behavior by providingaccurate, real-time methods for extracting emotionalinformation to use as input for those more elaboratepsychological processes.
3. Our approach
There are a number of factors that distinguish thecurrent approach from previous ones. First, the stimuliused as input are videotapes of people who were watchingfilm clips designed to elicit intense emotions. The prob-ability that we accessed actual emotional behavior is higherthan in studies that used deliberately posed faces (see Nassand Brave, 2005, for further discussion of this distinction).One example for the importance of the distinction betweenautomatically expressed and deliberately posed emotions isgiven by Paul Ekman and colleagues. They demonstratedthat only ‘‘Duchenne Smiles’’—automatic smiles involvingcrinkling of the eye corners—but not deliberately posedsmiles correlate with other behavioral and physiologicalindicators of enjoyment (Ekman et al., 1990). Indeed, thereis a large amount of research attempting to detectdeception through facial and vocal cues by distinguishingincidental from deliberate behaviors (see Ekman, 2001 fora review). In sum, some emotional facial expressions aredeliberate, while others are automatic, and the automaticfacial expressions appear to be more informative aboutunderlying mental states than posed ones.
Second, because in our approach the emotions werecoded second-by-second by trained coders using a linearscale for two oppositely valenced emotions (amusementand sadness), we are able to train our learning algorithmsusing not just a binary set of data (e.g., sad versus not-sad),but also a linear set of data spanning a full scale ofemotional intensity. Most psychological models of emotionallow for the expression of mixed emotional states (e.g.,Bradley, 2000). Our approach allows us to compareapproaches that only look at binary values—in our casethe two most extreme values on the ends of the linearscale—to approaches that linearly predict the amount ofamusement and sadness.
Third, given that we collected large amounts of datafrom each person (i.e., hundreds of video frames ratedindividually for amusement and sadness), we are able tocreate three types of models. The first is a ‘‘universalmodel’’ which predicts how amused any face is by usingone set of subjects’ faces as training data and anotherindependent set of subjects’ faces as testing data. Thismodel would be useful for HCI applications in which lots
of people use the same interface, such as bank automatedteller machines, traffic light cameras, and public computerswith webcams. The second is an ‘‘idiosyncratic model’’which predicts how amused or sad a given face is by usingtraining and testing data from the same subject for eachmodel. This model is useful for HCI applications in whichthe same person repeatedly uses the same interface—forexample, driving in an owned car, using the same computerwith a webcam, or any application with a camera in aprivate home. The third is a gender-specific model, trainedand tested using only data from subjects of the samegender. This model is useful for HCI applications targetinga specific gender—for example make-up advertisementsdirected at female consumers, or home repair advertise-ments targeted at males. It is also theoretically interestingto compare the idiosyncratic, gender-specific, and universalmodels as such a comparison provides valuable informa-tion to social scientists studying how personal differencessuch as gender effect the expression of emotion. Further-more, although it has previously been shown that theeffectiveness of facial expression recognition systems isusually affected by the subject’s skin color, facial and scalphair, sex, race, and age (Zlochower et al., 1998), thecomparison of the various individual model enables us toquantitatively evaluate these differences, and better predictthe differences in performance of emotion recognitionsystems via personal differences.Fourth, since our data include physiological responses
(cardiovascular activity, electrodermal responding, andsomatic activity) we are able to quantify the improvementin the fit of our models by the addition of such features.One could easily imagine practical contexts in whichphysiological data could easily be added, such as in anautomobile in which the interface could capture facialfeatures from a camera in the dashboard and measure heartrate from the hands gripping the steering wheel. Compar-ing fit of the models with and without physiological dataoffers new information regarding the effectiveness ofemotion-detection systems with both facial and physiolo-gical inputs. This enables application designers to assessthe rewards of building physiological measures into theiremotion-detection systems.Finally, all of the processing (e.g., computer vision
algorithms detecting facial features, physiological mea-sures, formulas based on the learning algorithms) used inour study can be utilized in real-time. This is essential forapplications that seek to respond to a user’s emotion inways to improve the interaction, for example cars whichseek to avoid accidents for drowsy drivers or advertise-ments which seek to match their content to the mood of aperson walking by a billboard.We targeted amusement and sadness in order to sample
positive and negative emotions that recruit behavioral aswell as physiological responses. Amusement rather thanhappiness was chosen, because amusement more clearlyallows predictions on which facial behaviors to expect(Bonanno and Keltner, 2004). Sadness was then chosen as

ARTICLE IN PRESSJ.N. Bailenson et al. / Int. J. Human-Computer Studies 66 (2008) 303–317306
the emotion opposite to amusement on the valencecontinuum (cf. Watson and Tellegen, 1985). We choseonly these two emotions since increasing the number ofemotions would come at the cost of sacrificing thereliability of the emotions we induced. Amusement andsadness (in contrast to anger, fear, or surprise) can beethically and reliably induced using films (Philippot, 1993;Gross and Levenson, 1995), a feature crucial to the presentdesign as films allow for standardization of moment-by-moment emotional context across participants across longenough time periods. The selected films induced dynamicchanges in emotional states over the 9-min period, rangingfrom neutral to more intense emotional states. Becausedifferent individuals responded to films with differentdegrees of intensity we were able to assess varying levelsof emotional intensity across participants.
4. Data collection
The training data were taken from a study in which 151Stanford undergraduates watched movies pretested to elicitamusement and sadness while their faces were videotapedand their physiological responses were assessed. In thelaboratory session, participants watched a 9-min film clipthat was composed of an amusing, a neutral, a sad, andanother neutral segment (each segment was approximately2min long). From the larger dataset of 151, we randomlychose 41 to train and test the learning algorithms. We didnot use all 151 due to the time involved running the modelswith such rich datasets. In incremental tests during datasetconstruction, we determined that the current sample sizewas large enough such that adding additional subjects didnot change the fits of the models.
Fig. 1. System for recording physiological data.
4.1. Expert ratings of emotions
A total of five trained coders rated facial expressions ofamusement and sadness from the video recordings ofparticipants’ faces such that each participant’s tape wasrated by two coders (cf. Mauss et al., 2005). Coders usedlaboratory software to rate the amount of amusement andsadness displayed in each second of video. The codingsystem was informed by microanalytic analyses of expres-sive behavior (Ekman and Friesan, 1978). It was anchoredat 0 with neutral (no sign of emotion) and 8 with stronglaughter for amusement and strong sadness expression/sobbing for sadness. Coders were unaware of other coders’ratings, of the experimental hypotheses, and of whichstimuli participants were watching. Average inter-raterreliabilities were satisfactory, with Cronbach’salphas ¼ 0.89 (S.D. ¼ 0.13) for amusement behavior and0.79 (S.D. ¼ 0.11) for sadness behavior. We thus averagedthe coders’ ratings to create one second-by-second amuse-ment and one second-by-second sadness rating for eachparticipant. These average ratings of amusement andsadness were used as criterion in our model.
4.2. Physiological measures
During the experimental session, 15 physiologicalmeasures were monitored at 400Hz using a 12-channelGrass Model 7 polygraph. Fig. 1 depicts a participantwearing the measurement sensors. The features included:heart rate (derived from inter-beat intervals assessed byplacing Beckman miniature electrodes in a bipolar config-uration on the participant’s chest and calculating theinterval in ms between successive R-waves), systolic blood
pressure (obtained from the third finger of the non-dominant hand), diastolic blood pressure (obtained fromthe third finger of the non-dominant hand), mean arterial
blood pressure (obtained from the third finger of the non-dominant hand), pre-ejection period (identified as the timein ms elapsed between the Q point on the ECG wave of theleft ventricle contracting and the B inflection on the ZCGwave), skin conductance level (derived from a signal using aconstant-voltage device to pass 0.5V between Beckman
ARTICLE IN PRESS
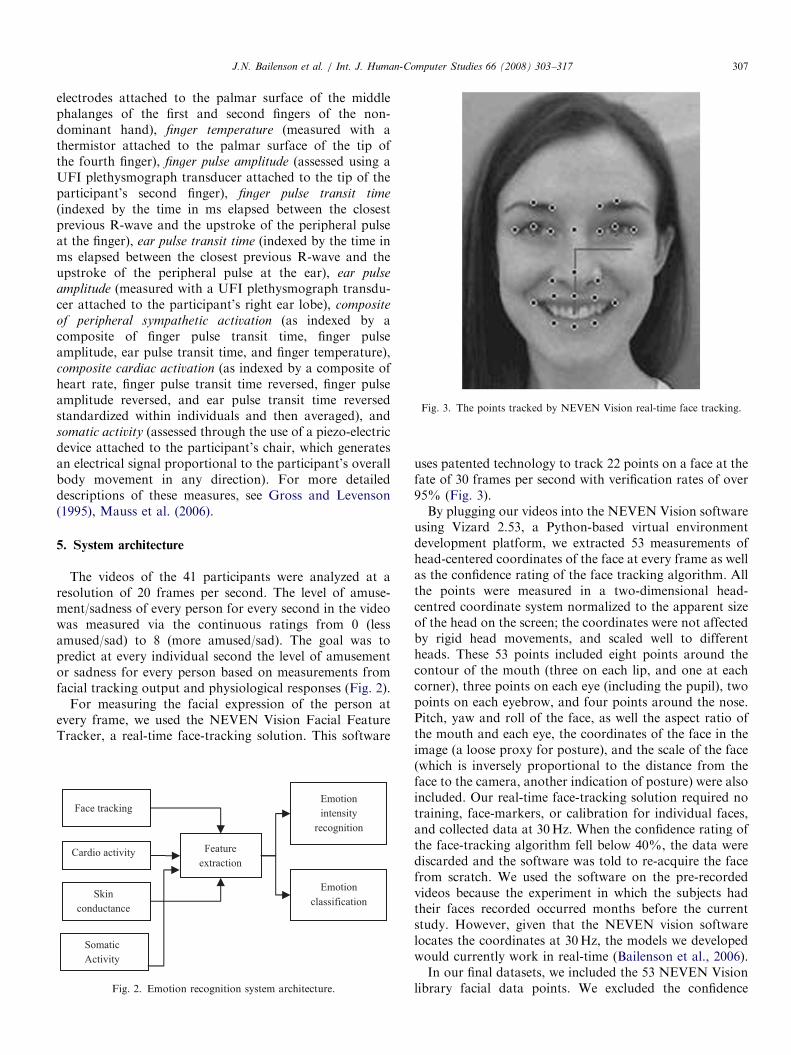
Fig. 3. The points tracked by NEVEN Vision real-time face tracking.
J.N. Bailenson et al. / Int. J. Human-Computer Studies 66 (2008) 303–317 307
electrodes attached to the palmar surface of the middlephalanges of the first and second fingers of the non-dominant hand), finger temperature (measured with athermistor attached to the palmar surface of the tip ofthe fourth finger), finger pulse amplitude (assessed using aUFI plethysmograph transducer attached to the tip of theparticipant’s second finger), finger pulse transit time
(indexed by the time in ms elapsed between the closestprevious R-wave and the upstroke of the peripheral pulseat the finger), ear pulse transit time (indexed by the time inms elapsed between the closest previous R-wave and theupstroke of the peripheral pulse at the ear), ear pulse
amplitude (measured with a UFI plethysmograph transdu-cer attached to the participant’s right ear lobe), composite
of peripheral sympathetic activation (as indexed by acomposite of finger pulse transit time, finger pulseamplitude, ear pulse transit time, and finger temperature),composite cardiac activation (as indexed by a composite ofheart rate, finger pulse transit time reversed, finger pulseamplitude reversed, and ear pulse transit time reversedstandardized within individuals and then averaged), andsomatic activity (assessed through the use of a piezo-electricdevice attached to the participant’s chair, which generatesan electrical signal proportional to the participant’s overallbody movement in any direction). For more detaileddescriptions of these measures, see Gross and Levenson(1995), Mauss et al. (2006).
5. System architecture
The videos of the 41 participants were analyzed at aresolution of 20 frames per second. The level of amuse-ment/sadness of every person for every second in the videowas measured via the continuous ratings from 0 (lessamused/sad) to 8 (more amused/sad). The goal was topredict at every individual second the level of amusementor sadness for every person based on measurements fromfacial tracking output and physiological responses (Fig. 2).
For measuring the facial expression of the person atevery frame, we used the NEVEN Vision Facial FeatureTracker, a real-time face-tracking solution. This software
Face tracking
Feature
extraction
Emotion
intensity
recognition
Cardio activity
Skin
conductance
Emotion
classification
Somatic
Activity
Fig. 2. Emotion recognition system architecture.
uses patented technology to track 22 points on a face at thefate of 30 frames per second with verification rates of over95% (Fig. 3).By plugging our videos into the NEVEN Vision software
using Vizard 2.53, a Python-based virtual environmentdevelopment platform, we extracted 53 measurements ofhead-centered coordinates of the face at every frame as wellas the confidence rating of the face tracking algorithm. Allthe points were measured in a two-dimensional head-centred coordinate system normalized to the apparent sizeof the head on the screen; the coordinates were not affectedby rigid head movements, and scaled well to differentheads. These 53 points included eight points around thecontour of the mouth (three on each lip, and one at eachcorner), three points on each eye (including the pupil), twopoints on each eyebrow, and four points around the nose.Pitch, yaw and roll of the face, as well the aspect ratio ofthe mouth and each eye, the coordinates of the face in theimage (a loose proxy for posture), and the scale of the face(which is inversely proportional to the distance from theface to the camera, another indication of posture) were alsoincluded. Our real-time face-tracking solution required notraining, face-markers, or calibration for individual faces,and collected data at 30Hz. When the confidence rating ofthe face-tracking algorithm fell below 40%, the data werediscarded and the software was told to re-acquire the facefrom scratch. We used the software on the pre-recordedvideos because the experiment in which the subjects hadtheir faces recorded occurred months before the currentstudy. However, given that the NEVEN vision softwarelocates the coordinates at 30Hz, the models we developedwould currently work in real-time (Bailenson et al., 2006).In our final datasets, we included the 53 NEVEN Vision
library facial data points. We excluded the confidence

ARTICLE IN PRESS
Table 1
Chi-square values for top 20 features in amusement analysis
Chi-square
value
Features from amusement analysis
5833.16 Average difference right mouth corner eye corner
5402.68 Average difference left mouth corner eye corner
5392.56 Difference right mouth corner eye corner
5285.98 Average face left mouth corner Y
5043.99 Difference left mouth corner eye corner
4971.89 Face left mouth corner Y
4631.21 Somatic activity
4449.13 Average mouth aspect ratio, divided with eyes aspect
ratio
4407.18 Average face right mouth corner Y
4233.76 Face right mouth corner Y
4198.46 Average upper lip curviness
3944.40 Finger temperature
3868.17 Mouth aspect ratio, divided with eyes aspect ratio
3710.65 Upper lip curviness
3635.23 Average face left upper lip Y
3600.06 Average mouth aspect ratio
3581.85 Average face right upper lip Y
3348.80 Left upper lip Y
3314.28 Average face left nostril Y
3241.55 Mouth aspect ratio
Table 2
Chi-square values for top 20 features in sadness analysis
Chi-square value Features from sadness analysis
5882.53 Finger temperature
4903.57 Skin conductance level
3391.84 Average face Y
3356.33 Average face X
3314.70 Face X
3282.54 Face Y
2601.23 Average Face Scale
2321.38 Average Face Euler Y
2152.49 Average upper lip curviness
2066.28 Face Scale
2031.30 Face Euler Y
1995.66 Heart rate
1975.78 Average face left nostril Y
1930.09 Ear pulse transit time
1802.30 Average face left mouth corner Y
1743.33 Average difference left mouth corner eye corner
1657.78 Face left nostril Y
1656.34 Average face nose tip Y
1622.59 Finger pulse transit time
1615.12 Ear pulse amplitude
J.N. Bailenson et al. / Int. J. Human-Computer Studies 66 (2008) 303–317308
rating, as it is not a meaningful predictor a priori ofemotion. We also included six new features which wecreated heuristically from linear and non-linear combina-tions of the NEVEN Vision coordinates: the differencebetween the right mouth corner and right eye corner, thedifference left mouth corner and left eye corner, the mouthheight, the mouth width, the upper lip curviness (defined asthe difference between the right upper lip Y and the upperlip center Y plus the difference between the left upper lip Yand the upper lip center Y), and the mouth aspect ratiodivided by the product of the left and right eye aspectratios. We analyzed the 2 s history for those 59 features,computing the averages, the velocities, and the variancesfor each one of them. This totaled to 236 facial features (59instantaneous, 59 averaged positions, 59 averaged velo-cities, 59 averaged variances) used as inputs to the models.Finally, we added the 15 physiological and somaticmeasures utilized by Mauss et al. (2006). So in total, therewere 251 features used (236 facial features, 15 physiologicalfeatures). A complete list of these features can be found inAppendix A.
6. Relevant feature extraction
We applied Chi-square feature selection (which evaluatesthe contribution of each feature by computing the value ofthe Chi-squared statistic with respect to the emotionratings) using the freely distributed machine learningsoftware package Waikato Environment for KnowledgeAnalysis (WEKA; Witten and Fank, 2005) to find the mostrelevant features for the amusement dataset. For thisexperiment, we processed 19,625 instances and we dis-cretized the expert’s ratings into two classes (amused andneutral) where each rating above 3 is considered to beamused and each rating below 0.5 is considered as neutral.We repeated the same methodology for finding the mostrelevant features for the sadness dataset. The top 20 resultsare shown in Tables 1 and 2. For amusement, the facialcharacteristics were the most informative (compared to thephysiological measures) according to Chi-square, with onlytwo of the physiological features appearing in the top 20.In contrast, for predicting sadness the physiologicalfeatures seemed to play much more of a role, with 6 outof the top 20 features being physiological. This wouldindicate that the facial features by themselves are not asstrong an indicator of sadness as the physiologicalcharacteristics. It is important to note that while the Chi-square analysis is important to understand the featureswhich contribute most to the model fit, we used all facialand physiological features when building our models.
7. Predicting emotion intensity
We began with the more challenging task of assessingemotion intensity before turning to the more commonlyreported task of classifying emotion. Research by Schianoet al. (2004) has demonstrated that people perceive
emotions of others in a continuous fashion, and thatmerely representing emotions in a binary (on/off) manneris problematic. Consequently, we used linear regressionand neural networks for predicting experts’ ratings in acontinuous manner for every second in the face video.We used the WEKA software package linear regression
function using the Akaike criterion for model selection andused no attribute selection. The linear neural nets wereMultilayer Perceptrons configured to have two hiddenlayers. Two-fold cross-validation was performed on each
ARTICLE IN PRESS
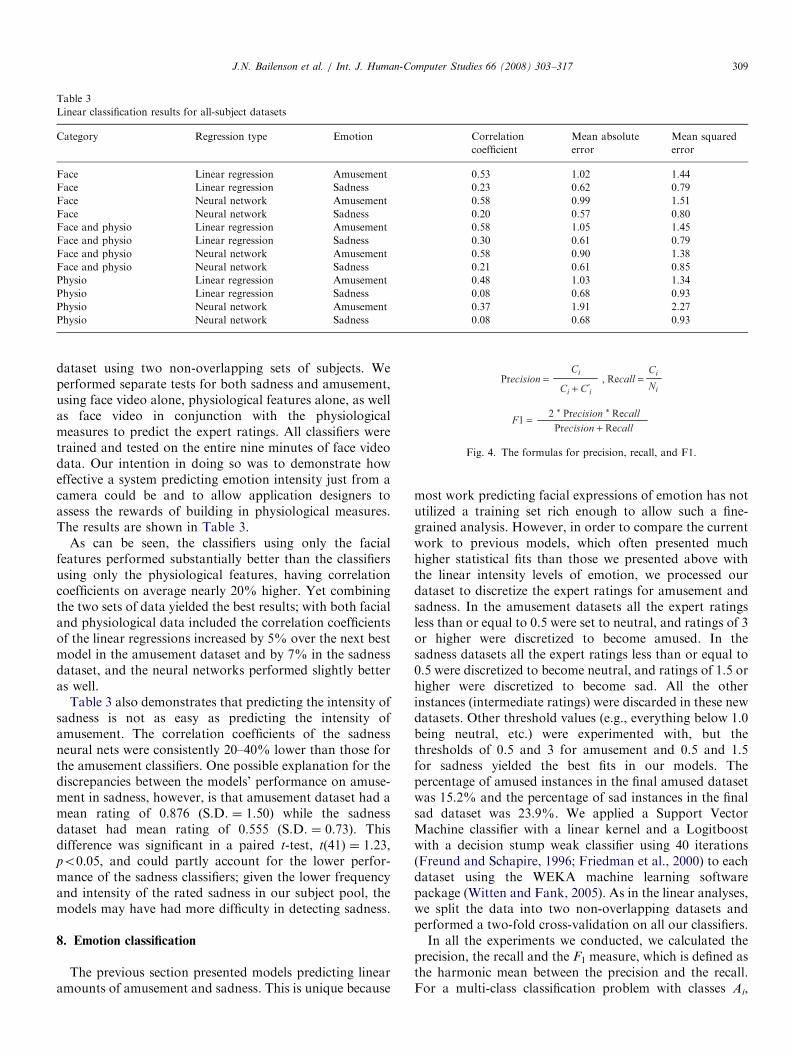
Table 3
Linear classification results for all-subject datasets
Category Regression type Emotion Correlation
coefficient
Mean absolute
error
Mean squared
error
Face Linear regression Amusement 0.53 1.02 1.44
Face Linear regression Sadness 0.23 0.62 0.79
Face Neural network Amusement 0.58 0.99 1.51
Face Neural network Sadness 0.20 0.57 0.80
Face and physio Linear regression Amusement 0.58 1.05 1.45
Face and physio Linear regression Sadness 0.30 0.61 0.79
Face and physio Neural network Amusement 0.58 0.90 1.38
Face and physio Neural network Sadness 0.21 0.61 0.85
Physio Linear regression Amusement 0.48 1.03 1.34
Physio Linear regression Sadness 0.08 0.68 0.93
Physio Neural network Amusement 0.37 1.91 2.27
Physio Neural network Sadness 0.08 0.68 0.93
F1 =Precision + Recall
2 * Precision * Recall
Precision =Ci + C'
i
Ci
Ni
Ci, Recall =
Fig. 4. The formulas for precision, recall, and F1.
J.N. Bailenson et al. / Int. J. Human-Computer Studies 66 (2008) 303–317 309
dataset using two non-overlapping sets of subjects. Weperformed separate tests for both sadness and amusement,using face video alone, physiological features alone, as wellas face video in conjunction with the physiologicalmeasures to predict the expert ratings. All classifiers weretrained and tested on the entire nine minutes of face videodata. Our intention in doing so was to demonstrate howeffective a system predicting emotion intensity just from acamera could be and to allow application designers toassess the rewards of building in physiological measures.The results are shown in Table 3.
As can be seen, the classifiers using only the facialfeatures performed substantially better than the classifiersusing only the physiological features, having correlationcoefficients on average nearly 20% higher. Yet combiningthe two sets of data yielded the best results; with both facialand physiological data included the correlation coefficientsof the linear regressions increased by 5% over the next bestmodel in the amusement dataset and by 7% in the sadnessdataset, and the neural networks performed slightly betteras well.
Table 3 also demonstrates that predicting the intensity ofsadness is not as easy as predicting the intensity ofamusement. The correlation coefficients of the sadnessneural nets were consistently 20–40% lower than those forthe amusement classifiers. One possible explanation for thediscrepancies between the models’ performance on amuse-ment in sadness, however, is that amusement dataset had amean rating of 0.876 (S.D. ¼ 1.50) while the sadnessdataset had mean rating of 0.555 (S.D. ¼ 0.73). Thisdifference was significant in a paired t-test, t(41) ¼ 1.23,po0.05, and could partly account for the lower perfor-mance of the sadness classifiers; given the lower frequencyand intensity of the rated sadness in our subject pool, themodels may have had more difficulty in detecting sadness.
8. Emotion classification
The previous section presented models predicting linearamounts of amusement and sadness. This is unique because
most work predicting facial expressions of emotion has notutilized a training set rich enough to allow such a fine-grained analysis. However, in order to compare the currentwork to previous models, which often presented muchhigher statistical fits than those we presented above withthe linear intensity levels of emotion, we processed ourdataset to discretize the expert ratings for amusement andsadness. In the amusement datasets all the expert ratingsless than or equal to 0.5 were set to neutral, and ratings of 3or higher were discretized to become amused. In thesadness datasets all the expert ratings less than or equal to0.5 were discretized to become neutral, and ratings of 1.5 orhigher were discretized to become sad. All the otherinstances (intermediate ratings) were discarded in these newdatasets. Other threshold values (e.g., everything below 1.0being neutral, etc.) were experimented with, but thethresholds of 0.5 and 3 for amusement and 0.5 and 1.5for sadness yielded the best fits in our models. Thepercentage of amused instances in the final amused datasetwas 15.2% and the percentage of sad instances in the finalsad dataset was 23.9%. We applied a Support VectorMachine classifier with a linear kernel and a Logitboostwith a decision stump weak classifier using 40 iterations(Freund and Schapire, 1996; Friedman et al., 2000) to eachdataset using the WEKA machine learning softwarepackage (Witten and Fank, 2005). As in the linear analyses,we split the data into two non-overlapping datasets andperformed a two-fold cross-validation on all our classifiers.In all the experiments we conducted, we calculated the
precision, the recall and the F1 measure, which is defined asthe harmonic mean between the precision and the recall.For a multi-class classification problem with classes Ai,

ARTICLE IN PRESS
Table 4
Discrete classification results for all-subject datasets
Category Classifier Emotion Neutral precision Emotion
precision
Neutral F1
measure
Emotion F1
measure
Face SVMs Amusement 0.93 0.64 0.93 0.62
Face SVMs Sadness 0.78 0.35 0.82 0.20
Face LogitBoost Amusement 0.93 0.66 0.93 0.63
Face LogitBoost Sadness 0.78 0.31 0.79 0.26
Face and physio SVMs Amusement 0.95 0.63 0.93 0.66
Face and physio SVMs Sadness 0.81 0.51 0.84 0.37
Face and physio LogitBoost Amusement 0.94 0.75 0.95 0.69
Face and physio LogitBoost Sadness 0.79 0.36 0.79 0.28
Physio SVMs Amusement 0.88 0.77 0.93 0.41
Physio SVMs Sadness 0.78 0.32 0.79 0.25
Physio LogitBoost Amusement 0.90 0.49 0.91 0.49
Physio LogitBoost Sadness 0.78 0.43 0.76 0.24
Table 5
Linear classification results for individual subjects (average results)
Categories Emotion Correlation
coefficient
(average)
Mean
absolute
error
(average)
Mean
squared
error
(average)
Face only Amusement 0.85 0.38 0.64
Face only Sadness 0.73 0.20 0.33
Face and
physio
Amusement 0.90 0.29 0.52
Face and
physio
Sadness 0.83 0.15 0.26
Physio only Amusement 0.84 0.48 0.69
Physio only Sadness 0.83 0.16 0.24
J.N. Bailenson et al. / Int. J. Human-Computer Studies 66 (2008) 303–317310
i ¼ 1,y, M and each class Ai having a total of Ni instancesin the dataset, respectively, if the classifier predictscorrectly Ci instances for Ai and predicts C0i instances tobe in Ai where in fact those belong to other classes(misclassifies them), then the former measures are definedas following (Fig. 4):
Precision ¼Ci
Ci þ C0i; Recall ¼
Ci
Ni
F1 ¼2� Precision�Recall
PrecisionþRecall
Maximizing precision or recall individually does notresult in a perfect classifier; F1 gives the optimal accuracyscore by relating precision to recall. The results of ouranalyses are shown in Table 4.
In these analyses both classifiers performed equally aswell, with precisions nearing 70% for amusement, 50% forsadness, and 94% for neutral in the face and physiologicaldatasets, a substantial improvement over the precisions ofthe linear classifiers. We noted too, that the addition of thephysiological features offered much greater improvementin the discrete classifiers than in the linear classifiers. Theaddition of physiological features increased the SVMsadness precision by over 15% and the LogitBoostamusement precision by 9%. Also, just as in the linearanalyses, the precisions of the sadness classifiers wereconsistently over 15% worse than the precisions of theamusement classifiers.
9. Experimental results within subjects
In addition to creating general models applicable to anysubject, we ran experiments in which we trained and testedindividual models specifically for each one of the 41subjects. We expected the linear prediction and theclassification accuracy to be better within the same subject,since the models are optimized for the facial characteristics
of each specific subject as well as his or her levels ofexpressivity.
9.1. Predicting continuous ratings within subjects
We built 41 different Multilayer Perceptron neuralnets with two hidden layers and individualized them bytraining and testing them only within the same subject.We chose Multilayer Perceptron neural nets over regres-sion formulas as the previous analyses indicated betterfits with the neural nets. For each subject, we used two-fold cross-validation for training and testing. In Table 5,we present the average of the results of the 41 neuralnets.Using these idiosyncratic methods of building specialized
models for particular subjects, we noted a number ofimportant trends.First, building specialized models for each subject
significantly increased the prediction accuracy. Withsadness in particular, we saw an improvement in thecorrelation coefficient of more than 50%. This is especiallyremarkable given that the input set was reduced 20-fold;the all-subject training sets had on average 12,184 instances

ARTICLE IN PRESS
Table 6
Discrete classification results for individual subjects (average results)
Categories Emotion Neutral accuracy
(average)
Emotion accuracy
(average)
Neutral F1 measure
(average)
Emotion F1 measure
(average)
Face only Amusement 0.99 0.93 0.99 0.90
Face only Sadness 0.97 0.89 0.97 0.86
Face and physio Amusement 0.99 0.94 0.99 0.92
Face and physio Sadness 0.99 0.98 0.99 0.95
Physio only Amusement 0.96 0.82 0.97 0.73
Physio only Sadness 0.95 0.82 0.95 0.77
J.N. Bailenson et al. / Int. J. Human-Computer Studies 66 (2008) 303–317 311
while the individual training sets had on average only 595instances. So even though the within-subject models onlyhad about 300 trials to train on, the fits remained quitehigh.
Second, like the universal models, using physiologicalmeasures improved the fit for all models. Interestingly, theclassifier for sadness using only physiological data slightlyout-performed the classifier using only facial features. Thissupports our earlier findings that physiological featuresseem to be more important in the detection of sadnesscompared to amusement.
The mean absolute error and the mean squared errorwere not comparable between the amusement and sadnesscases, however since mean ratings of the two datasets wereunequal; the majority of expert ratings on sadness did notgo beyond the scale of 3.5, while the amusement ratingsfluctuated in scale from 0 to 7.
9.2. Classification results within subjects
We performed a similar analysis by building anindividual Support Vector Machine classifier with a linearkernel for each one of the 41 subjects. In Table 6 we presentthose results.
As can be seen by comparing the prediction success inTable 6 to all other tables in the paper, the discreteclassifiers designed to predict emotion within subjectsperformed by far the best, with average accuracies nearing95%.
10. Experimental results by gender
Given that previous research has identified systematicgender differences in facial expressions of emotion, withwomen appearing somewhat more accurate in expressingsome emotions than men (see Hall, 1984, for a review;Timmers et al., 1998; Kring, 2000), we separated ourdataset into two parts, with one part containing onlymale subjects (n ¼ 17) and the other part only femalesubjects (n ¼ 24). We created individual classifiers foreach of the datasets in order to compare their perfor-mance. We expected the linear prediction and theclassification accuracy to be better for the female classifiers
given the greater facial expressiveness of women. We alsoperformed relevant feature extraction on each of thedatasets to examine any differences in the most informativefeatures between the two genders.
10.1. Relevant feature extraction within gender
We applied Chi-square feature selection using theWEKA machine learning software package (Wittenand Fank, 2005) to find the most relevant features forboth the male and female amusement datasets. For thisexperiment, we discretized the expert’s ratings into twoclasses (amused and neutral) where each rating above 3was considered to be amused and each rating below 0.5was considered as neutral. We repeated the same metho-dology for finding the most relevant features for themale and female sadness datasets. The top 20 results foreach gender are shown in Tables 7 and 8. We observedthat in the male dataset the physiological measures weremore informative according to Chi-square than forfemales. This is especially noticeable in the sadness analysiswhere 8 of the top 20 male features are physiologicalwhereas only 3 of the top 20 female characteristics arephysiological.
10.2. Predicting continuous ratings within gender
We created separate Multilayer Perceptron neuralnetwork models with two hidden layers for each genderand measured the correlation coefficient, mean absoluteerror, and root mean squared error. As in previousanalyses the subjects were split into two non-over-lapping datasets in order to perform two-fold cross-validation on all classifiers. The results are shown inTable 9.As can be seen, the female classifiers generally yielded a
greater correlation coefficient, suggesting that our modelsmore accurately predict emotions in women than in men.Also, adding the physiological features increased thecorrelation coefficient in males by almost 20%, whereas itonly increased the correlation coefficient in females by10%. This indicates that physiological features may be

ARTICLE IN PRESS
Table 7
Chi-square values for top 20 features in male and female amusement analyses
Chi-square Features from male amusement analysis Chi-square Features from female amusement analysis
2390.29 Average difference left mouth corner eye corner 3363.06 Average left mouth corner Y
2192.56 Difference left mouth corner eye corner 3236.11 Average mouth aspect ratio divided with eyes aspect ratio
2173.04 Average left mouth corner Y 3209.90 Finger temperature
2149.07 Average difference right mouth corner eye corner 3196.37 Average difference left mouth corner eye corner
2107.02 Somatic activity 3137.08 Left mouth corner Y
1996.80 Left mouth corner Y 3115.47 Somatic activity
1925.40 Skin conductance level 3099.96 Average right mouth corner Y
1787.31 Average upper lip curviness 2974.77 Right mouth corner Y
1785.56 Difference right mouth corner eye corner 2966.45 Difference left mouth corner eye corner
1533.58 Finger temperature 2890.10 Average left upper lip Y
1454.53 Upper lip curviness 2823.22 Average mouth aspect ratio
1369.33 Average right mouth corner Y 2789.79 Average right upper lip Y
1347.73 Average left nostril Y 2659.73 Average mouth height
1346.67 Average left upper lip Y 2610.82 Mouth aspect ratio divided with eyes aspect ratio
1240.03 Composite of cardiac activation 2562.26 Left upper lip Y
1217.84 Right mouth corner Y 2526.48 Mouth aspect ratio
1203.93 Left upper lip Y 2470.99 Average upper lip curviness
1174.46 Mouth aspect ratio divided with eyes aspect ratio 2442.35 Mouth height
1096.93 Average right upper lip Y 2387.87 Right upper lip Y
1095.57 Left nostril Y 2333.37 Skin conductance level
Table 8
Chi-square values for top 20 features in male and female sadness analyses
Chi-square Features from male sadness analysis Chi-square Features from female sadness analysis
3907.62 Skin conductance level 3363.06 Average left mouth corner Y
3412.75 Finger temperature 3236.11 Average mouth aspect ratio divided with eyes aspect ratio
2372.60 Average X position 3209.90 Finger temperature
2325.77 X position 3196.37 Average difference left mouth corner eye corner
2169.87 Average Euler Y 3137.08 Left mouth corner Y
2148.95 Y position 3115.47 Somatic activity
2114.66 Average scale 3099.96 Average right mouth corner Y
2065.24 Average Y position 2974.77 Right mouth corner Y
1984.77 Euler Y 2966.45 Difference left mouth corner eye corner
1939.58 Scale 2890.10 Average left upper lip Y
1779.59 Heart rate 2823.22 Average mouth aspect ratio
1691.42 Pre-ejection period 2789.77 Average right upper lip Y
1682.98 Average left pupil X 2659.73 Average mouth height
1646.60 Ear pulse transit time 2610.82 Mouth aspect ratio divided with eyes aspect ratio
1523.33 Ear pulse amplitude 2562.26 Left upper lip Y
1467.22 Diastolic blood pressure 2526.48 Mouth aspect ratio
1448.72 Average upper lip curviness 2470.99 Average upper lip curviness
1380.15 Average left nostril Y 2442.35 Mouth height
1347.30 Finger pulse transit time 2387.87 Right upper lip Y
1339.80 Average left eye aspect ratio 2333.37 Skin conductance level
J.N. Bailenson et al. / Int. J. Human-Computer Studies 66 (2008) 303–317312
more important in detecting male emotional responses thanfemale responses.
10.3. Classification results by gender
We performed a similar analysis by building an indivi-dual Support Vector Machine classifier with a linear kernelfor both males and females. As in other classifications,
two-fold cross-validation was used. We present thoseresults in Table 10.Again we see a significantly higher accuracy in our
female models over our male models. Interestingly, theonly classifier that performed better in the male datasetthan the female dataset was the sadness classifier using onlyphysiological data. Also, when adding the physiologicaldata to the facial data we only saw improvements in

ARTICLE IN PRESS
Table 9
Linear classification results for gender-specific datasets
Categories Emotion Gender Correlation
coefficient (average)
Mean absolute error
(average)
Mean squared error
(average)
Face only Amusement Male 0.25 1.40 1.94
Face only Amusement Female 0.63 0.94 1.43
Face only Sadness Male 0.23 0.61 0.82
Face only Sadness Female 0.33 0.56 0.79
Face and physio Amusement Male 0.45 0.92 1.48
Face and physio Amusement Female 0.73 0.77 1.17
Face and physio Sadness Male 0.20 0.57 0.78
Face and physio Sadness Female 0.04 0.65 0.82
Physio only Amusement Male 0.24 2.26 2.71
Physio only Amusement Female 0.20 2.06 2.40
Physio only Sadness Male 0.02 0.71 0.97
Physio only Sadness Female 0.03 0.78 1.01
Table 10
Discrete classification results for gender-specific datasets
Categories Emotion Gender Neutral accuracy
(average)
Emotion accuracy
(average)
Neutral F1
measure (average)
Emotion F1
measure (average)
Face only Amusement Male 0.93 0.53 0.93 0.62
Face only Amusement Female 0.94 0.69 0.93 0.68
Face only Sadness Male 0.77 0.15 0.84 0.46
Face only Sadness Female 0.80 0.39 0.80 0.39
Face and physio Amusement Male 0.93 0.28 0.85 0.34
Face and physio Amusement Female 0.95 0.82 0.96 0.79
Face and physio Sadness Male 0.85 0.38 0.85 0.38
Face and physio Sadness Female 0.84 0.42 0.84 0.47
Physio only Amusement Male 0.90 0.43 0.90 0.25
Physio only Amusement Female 0.89 0.62 0.88 0.41
Physio only Sadness Male 0.87 0.29 0.87 0.34
Physio only Sadness Female 0.71 0.19 0.56 0.22
J.N. Bailenson et al. / Int. J. Human-Computer Studies 66 (2008) 303–317 313
performance in the male classifiers. These results supportthe findings of the Chi-square analysis, suggestingphysiological data are more important for males thanfemales.
11. Conclusion and future work
We have presented a real-time system for emotionrecognition and showed that this system is accurate andeasy to implement. The present study is unique for anumber of reasons, perhaps most notably because of theunusually rich data set. A relatively large number ofsubjects watched videos designed to make them feelamused or sad while having their facial and physiologicalresponses recorded, and we then produced second-by-second ratings of the intensity with which they expressedamusement and sadness using trained coders. By havingthis level of detail in both input and output, we were able tomake a number of important advances in our learningalgorithms.
11.1. Summary of findings
First, we demonstrated the ability to find good statisticalfits on algorithms to predict the emotion from the naturalfacial expressions of everyday people, rather than fromdiscrete and deliberately created facial expressions oftrained actors, as in many previous studies. This isimportant, because people in their day-to-day lives maynot produce extreme facial configurations such as thosedisplayed by actors used in typical experimental stimuli.Consequently, previous work may be overestimating theutility of emotion prediction based on the novelty of thestimulus set.Second, in the current study, we demonstrated that
amusement is more easily detected than sadness, per-haps due to the difficulty in eliciting true sadness. Inour dataset, facial expressions of people watching sadmovies and receiving high sadness ratings tended to nothave the stereotypical ‘‘long face’’, but were predomi-nantly characterized by a lack of movement or any

ARTICLE IN PRESSJ.N. Bailenson et al. / Int. J. Human-Computer Studies 66 (2008) 303–317314
expressivity at all. Consequently, we are demonstrat-ing the importance of examining people experiencingemotions in a naturalistic element. Previous work hasalso demonstrated that sadness is a difficult emotion tocapture using analysis of facial feature points (Deng et al.,2006).
Third, we provided evidence that applications forwhich a single user occupies an interface over time,models tailored to that user, show significant advancesover more general models. While in many ways this isintuitive, quantifying the exact level of improvement isan important first step in designing these systems.Specifically with categorizing emotions, the tailored in-dividual models performed extremely well compared to theother models.
Fourth, we have shown that both amusement andsadness are more easily detected in female subjectsthan in male subjects. This finding is consistent with theresearch done by Hall (1984) suggesting that womenare more facially expressive than men, and providesnew quantitative data for social scientists studying thedifferences in emotional response among individuals ofopposite gender.
Fifth, we have demonstrated that by incorporatingmeasures of physiological responding into our model, weget more accurate predictions than when just using theface. Indeed, when we analyze physiological features as thesole inputs to the model, the fit is often extremely high atpredicting the coded emotion ratings of the face. Suchmeasurements can be used in real systems with relativelyeasy installments of sensors (e.g., on a person’s chair or onthe steering wheel of a car). In fact, the Chi-square analysisindicates that some of the physiological levels in thedetection of sadness outperformed facial tracking, espe-cially for males. Given that real-time computer visionalgorithms are not yet as reliable as physiologicalmeasurement techniques in terms of consistent perfor-mance, augmenting facial tracking with physiological datamay be crucial.
11.2. Limitations and future work
Of course there are a number of limitations to thecurrent work. First, our models’ accuracy is closely relatedto the quality of the vision library that we are usingas well as the accuracy of our physiological measures.As these tools improve, our system will become muchmore useful. Moreover, while the psychologists trainedto code amusement and sadness demonstrated highinter-coder reliability, it could be the case that theirratings were not actually picking up the ‘‘true emo-tion’’ but were picking up on other types of behavioralartifacts. Our model is only as good as the input andoutput used to train, and while we are confident thatthis dataset is more robust than most that have beenused previously, there are many ways to improve ourmeasurements.
Second, we only examined two emotions, while mostmodels posit there are many more than two emotions(Ekman and Friesan, 1978). In pilot testing, we examinedthe videos of subjects and determined that there were veryfew instances of all seven emotions, such as fear, disgust,and surprise. Consequently, we decided to focus oncreating robust models which were able to capture thetwo oppositely valenced emotions which occurred mostfrequently in our dataset. We also decided to begin with themost conservative models, which were binary comparisonsbetween amused and neutral and sad and neutral ratherthan a general comparison of all emotions. We acknowl-edge, however, that these decisions limit the scope of ourexperiment. In future work, we can expand the models toinclude other emotions and to compare emotions directly.Third, our study was based upon coders’ labels of
subjects’ emotions. Thus, although we are confident in thevalidity of our coders’ ratings based upon their high inter-coder reliability, we cannot claim to be detecting the actualexpression of the emotions sadness and amusement; rather,we can only claim to be detecting the expressions of sadnessand amusement as evaluated by coders. A possibility forfuture work would be to repeat the study using reports ofemotion from the subjects themselves rather than coders’ratings.Fourth, our some of the algorithms in our study depend
upon physiological features collected through use ofelectrodes and transducers which may be too intrusive forsome applications. In future work alternate ways ofobtaining physiological data could be explored.Finally, all of our results are tied to the specific learning
algorithms we utilized as well as to the ways in which wedivided the data. The fact that we discarded any data pointsrated between 0.5 and 3 in our discrete amusement datasetsand between 0.5 and 1.5 in our discrete sad datasets makesour models more applicable to subjects with greater facialmotion since subjects whose expressions tend to fall in theintermediate range tend to be less represented in the data. Itmay be the case that different techniques of modeling wouldproduce different patterns of results.In the future, we plan to use our emotion-recognizer
model for analyzing data from other studies; for example,assessing how emotion is related to driving safety and howemotions can affect social interaction during a negotiationsetting.
Acknowledgments
We thank Rosalind Picard, Jonathan Gratch, and AlexPentland for helpful suggestions in early stages of thiswork. Moreover, we thank Dan Merget for softwaredevelopment, Amanda Luther and Ben Trombley-Shapirofor assistance in data analysis, and Keith Avila, BryanKelly, Alexia Nielsen, and Alice Kim for their help inprocessing video. This work was in part sponsored by NSFGrant 0527377, as well as a grant from OMRONCorporation.

ARTICLE IN PRESSJ.N. Bailenson et al. / Int. J. Human-Computer Studies 66 (2008) 303–317 315
Appendix A. Facial and physiological features
Full list of the 53 facial features from NEVEN Vision, 6 heuristically created facial metafeatures, and 15 physiologicalfeatures used as inputs for the learning algorithms.
Facial features
Physiological features1
X position 28 Left mouth corner X 1 Composite of cardiac activation 2 Y position 29 Left mouth corner Y 2 Skin conductance level 3 Scale 30 Left outer eye corner X 3 Finger temperature 4 Euler X 31 Left outer eye corner Y 4 Systolic blood pressure 5 Euler Y 32 Left inner eye corner X 5 Composite of peripheral sympathetic activation 6 Euler Z 33 Left inner eye corner Y 6 Finger pulse transit time 7 Left eye aspect ratio 34 Right inner eye corner X 7 Ear pulse transit time 8 Right eye aspect ratio 35 Right inner eye corner Y 8 Pre-ejection period 9 Mouth aspect ratio 36 Right outer eye corner X 9 Finger pulse amplitude10
Right pupil X 37 Right outer eye corner Y 10 Mean arterial blood pressure 11 Right pupil Y 38 Right upper lip X 11 Heart rate 12 Left pupil X 39 Right upper lip Y 12 Ear pulse transit time 13 Left pupil Y 40 Left upper lip X 13 Ear pulse amplitude 14 Right inner eye brow X 41 Left upper lip Y 14 Diastolic blood pressure 15 Right inner eye brow Y 42 Right lower lip X 15 Somatic activity 16 Left inner eye brow X 43 Right lower lip Y 17 Left inner eye brow Y 44 Left lower lip X 18 Nose root X 45 Left lower lip Y 19 Nose root Y 46 Right eye brow center X 20 Nose tip X 47 Right eye brow center Y 21 Nose tip Y 48 Left eye brow center X 22 Upper lip center X 49 Left eye brow center Y 23 Upper lip center Y 50 Right nostril X 24 Lower lip center X 51 Right nostril Y 25 Lower lip center Y 52 Left nostril X 26 Right mouth corner X 53 Left nostril Y 27 Right mouth corner YMetafeatures
1
Difference right mouth corner eye corner (right outer eye corner Y-right mouth corner Y) 2 Mouth height (lower lip center Y-upper lip center Y) 3 Difference left mouth corner eye corner (left outer eye corner Y-left mouth corner Y) 4 Mouth width (left mouth corner X—right mouth corner X) 5 Upper lip curviness ((upper lip center Y-right mouth corner Y)+(upper lip center Y-left mouth corner Y)) 6 Mouth aspect ratio, divided with eyes aspect ratio (mouth aspect ratio/(right eye aspect ratio� left eye aspect ratio))Appendix B. Software packages
Softwarepackage
Description D
eveloper Latest release OS L icense WebsiteNEVEN Vision
Real-time face-trackingsolutionNI
evenvision,nc.NEVENVision 1.0
Cross-platform
GI
oogle,nc.www.nevenvision.com
Vizard 2.53 VRToolkit
Platform for developing 3-Dvirtual reality worlds
WI
orldViz,nc.
Vizard 3.0 Cross-platformWI
orldViz,nc.
http://www.worldviz.com/products/vizard/index.html
ARTICLE IN PRESSJ.N. Bailenson et al. / Int. J. Human-Computer Studies 66 (2008) 303–317316
WaikatoEnvironment forKnowledgeAnalysis(WEKA)
Open source collection ofvisualization tools andalgorithms for data analysisand predictive modeling
Universityof Waikato
WEKA 3.5.6(developer)WEKA 3.4.11(book)
Cross-platform
GPL
http://www.cs.waikato.ac.nz/�ml/weka/References
Bailenson, J., Yee, N., Merget, D., Schroeder, R., 2006. The Effect of
Behavioral Realism and Form Realism of Real-Time Avatar Faces on
Verbal Disclosure, Non-/verbal Disclosure, Emotion Recognition, and
Copresence in Dyadic Interaction, Presence, vol. 15, No. 4, August
2006, pp. 359–372.
Bartlett, M., Littlewort, G., Frank, M., Lainscsek, C., Fasel, I., Movellan,
J., 2005. Recognizing Facial Expression: Machine Learning and
Application to Spontaneous Behavior, IEEE CVPR 2005.
Bonanno, A.G., Keltner, D., 2004. The coherence of emotion systems:
comparing ‘‘on-line’’ measures of appraisal and facial expressions, and
self-report. Cognition and Emotion 18, 431–444.
Bradley, M., 2000. Emotion and motivation. In: Cacioppo, J., Tassinary,
L., Brenston, G. (Eds.), Handbook of Psychophysiology. Cambridge
University Press, New York.
Curhan, J.R., Pentland, A., 2007. Thin slices of negotiation: predicting
outcomes from conversational dynamics within the first 5mins.
Journal of Applied Psychology 92, 802–811.
Deng, Z., Bailenson, J.N., Lewis, J.P., Neumann, U., 2006. Perceiving
visual emotions with speech. In: Proceedings of the 6th International
Conference on Intelligent Virtual Agents.
Ehrlich, S.M., Schiano, D.J., Sheridan, K., 2000. Communicating facial
affect: it’s not the realism, it’s the motion. CHI ’00. ACM Press, New
York, NY, pp. 251–252.
Ekman, P., 2001. Telling Lies: Clues to Deceit in the Marketplace, Politics,
and Marriage. Norton, New York.
Ekman, P., Friesan, W., 1978. The Facial Action Coding System: A
Technique for the Measurement of Facial Movement. Consulting
Psychologists Press.
Ekman, P., Davidson, R.J., Friesen, W.V., 1990. The Duchenne smile:
emotional expression and brain physiology II. Journal of Personality
and Social Psychology 58, 342–353.
el Kaliouby, R., Robinson, P., 2005. Real-time inference of
complex mental states from facial expressions and head gestures.
In: Real-time Vision for HCI. Springer, pp. 181–200. ISBN 0-387-
27697-1.
el Kaliouby, R., Robinson, P., Keates, S., 2003. Temporal context and
the recognition of emotion from facial expression. In: Proceedings of
HCI International, vol. 2, Crete, June 2003, pp. 631–635. ISBN
0-8058-4931-9.
Essa, I., Pentland, A., 1997. Coding, analysis, interpretation, and
recognition of facial expressions. IEEE Transactions on Pattern
Analysis and Machine Intelligence 19 (7), 757–763.
Freund, Y., Schapire, R., 1996. Experiments with a New boosting
algorithm. In: Machine Learning—Proceedings of the Thirteenth
International Conference. Morgan Kaufmann, San Francisco,
pp. 148–156.
Friedman, J., Hastie, T., Tibshirani, R., 2000. Additive logistic regression:
a statistical view of boosting. Annals of Statistics 28, 337–407.
Gross, J.J., Levenson, R.W., 1995. Emotion elicitation using films.
Cognition and Emotion 9, 87–108.
Gross, J.J., Thompson, R., 2007. Emotion regulation: conceptual
foundations. In: Gross, J.J. (Ed.), Handbook of Emotion Regulation.
Guilford Press, New York, pp. 3–24.
Hall, J.A., 1984. Nonverbal Sex Differences: Communication Accuracy
and Expressive Style. The Johns Hopkins University Press, Baltimore,
MD.
Kimura, S., Yachida, M., 1997. Facial expression recognition and its
degree estimation. In: Proceedings of the International Conference on
Computer Vision and Pattern Recognition, pp. 295–300.
Kring, A.M., 2000. Gender and anger. In: Fischer, A.H. (Ed.), Gender
and Emotion: Social Psychological Perspectives. Cambridge University
Press, New York, pp. 211–231.
Li, S.Z., Jain, A.K., 2005. Handbook of Face Recognition. Springer, New
York. ISBN# 0-387-40595 (Chapter 11).
Lien, J.-J., Kanade, T., Cohn, J., Li, C., 1998. Subtly different facial
expression recognition and expression intensity estimation. In:
Proceedings of the IEEE International Conference on Computer
Vision and Pattern Recognition, pp. 853–859.
Lyons, M.J., 2004. Facial gesture interfaces for expression and commu-
nication. In: IEEE International Conference on Systems, Man, and
Cybernetics, vol. 1, pp. 598–603.
Lyons, M.J., Bartneck, C., 2006. HCI and the face. In: CHI ’06 Extended
Abstracts on Human Factors in Computing Systems. ACM,
pp. 1671–1674.
Mauss, I.B., Levenson, R.W., McCarter, L., Wilhelm, F.H., Gross, J.J.,
2005. The tie that binds? Coherence among Emotion Experience,
Behavior, and Physiology 5 (2), 175–190.
Mauss, I.B., Evers, C., Wilhelm, F.H., Gross, J.J., 2006. How to bite your
tongue without blowing your top: Implicit evaluation of emotion
regulation predicts affective responding to anger provocation.
Personality and Social Psychology Bulletin 32, 389–602.
Michel, P., el Kaliouby, R., 2003. Real time facial expression recognition
in video using support vector machines. In: Proceedings of the 5th
International Conference on Multimodal Interfaces, pp. 258–264.
ISBN: 1-58113-621-8
Nass, C., Brave, S., 2005. Wired for Speech: How Voice Activates and
Advances the Human–Computer Relationship. The MIT Press. ISBN:
0262140926.
Pantic, M., Patras, I., 2006. Dynamics of Facial Expression: Recognition
of Facial Actions and Their Temporal Segments from Face Profile
Image Sequences. IEEE Transactions on Systems, Man and Cyber-
netics—Part B, vol. 36, no. 2, pp. 433–449, April 2006.
Picard, R.W., 1997. Affective Computing. MIT Press, 1997, Cambridge,
MA.
Picard, R.W., Daily, S.B., 2005. Evaluating affective interactions:
alternatives to asking what users feel. In: CHI Workshop on Evaluat-
ing Affective Interfaces: Innovative Approaches, April 2005, Portland,
OR.
Philippot, P., 1993. Inducing and assessing differentiated emotion-feeling
states in the laboratory. Cognition and Emotion 7 (2), 171–193.
Rosenberg, E.L., Ekman, P., 2000. Emotion: methods of study. In:
Kazdin, A.E. (Ed.), Encyclopedia of Psychology, vol. 3. American
Psychological Association, pp. 171–175.
Sayette, M., Cohn, J., Wertz, J., Perrott, M., Parrott, D., 2001.
A psychometric evaluation of the facial action coding system for
assessing spontaneous expression. Journal of Nonverbal Behavior 25,
167–186.
Schiano, D.J., Ehrlich, S.M., Sheridan, K., 2004. Categorical Imperative
NOT: Facial Affect is Perceived Continuously. CHI, pp. 49–56.
Sebe, N., Lew, M.S., Cohen, I., Garg, A., Huang, T.S., 2002. Emotion
recognition using a cauchy naive bayes classifier. In: Proceedings of
ICPR, vol. 1, pp. 17–20.
Tian, Y.-L., Kanade, T., Cohn, J., 2000. Eye-state action unit detection by
Gabor wavelets. In: Proceedings of International Conference on Multi-
modal Interfaces (ICMI), pp. 143–150.

ARTICLE IN PRESSJ.N. Bailenson et al. / Int. J. Human-Computer Studies 66 (2008) 303–317 317
Timmers, M., Fischer, A.H., Manstead, A.S.R., 1998. Gender differences
in motives for regulating emotions. Personality and Social Psychology
Bulletin 24, 974–985.
Watson, D., Tellegen, A., 1985. Toward a consensual structure of mood.
Psychological Bulletin 98 (2), 219–235.
Witten, H.I., Fank, E., 2005. Data Mining: Practical Machine Learn-
ing Tools and Techniques, second ed. Morgan Kaufmann, San
Francisco.
Zhang, Z., Lyons, M., Schuster, M., Akamatsu, S., 1998. Comparison
between geometry-based and gabor-wavelets-based facial expression
recognition using multi-layer perceptron. In: 3rd International
Conference on Face and Gesture Recognition, p. 454.
Zlochower, A., Cohn, J., Lien, J., Kanade, T., 1998. A computer vision
based method of facial expression analysis in parent–infant interac-
tion. In: International Conference on Infant Studies.