real estate industry white paper
TRANSCRIPT
Real Estate Industry White Paper
Table of Contents Introduction ......................................................................................................................................................................................... 1
Product Summary ........................................................................................................................................................................... 1
Company Summary ...................................................................................................................................................................... 2
RE01 - COO Dashboard ................................................................................................................................................................ 3
RE02 - Project Comparison Dashboard ........................................................................................................................... 4
RE03 - Region Comparison Dashboard ............................................................................................................................ 5
RE04 - Agent Comparison Dashboard ............................................................................................................................. 6
RE05 - Bank Comparison Dashboard ................................................................................................................................7
RE08 - Sales Performance ........................................................................................................................................................ 8
RE09 - Real Estate Stock Analysis ........................................................................................................................................ 9
RE20 – Sales Budget Form ......................................................................................................................................................10

Copyright ©2020, Solver. All rights reserved. Visit us: www.solverglobal.com Solver White Paper | Page 1
Real Estate Industry White Paper
Introduction The purpose of this white paper is to provide an overview of Solver. With frequent, automated cloud updates, the solution is continuously being enhanced to drive faster, better decisions across its global customer base. For the latest information or to discuss your specific needs, please contact your local Solver partner, visit Solver’s web-site or email us at [email protected].
Product Summary Solver provides a single, cloud-based solution that automates reporting and planning processes, and supports faster and better decisions based on key information from across the organization’s data sources. Key benefits that Solver provides include: - A top-rated Corporate Performance Management (CPM) solution by G2 based on
user satisfaction- Global partner channel with industry expertise to help you whenever and
wherever- Cloud software, support, and upgrades packaged into a subscription price
providing unmatched ROI over traditional CPM solutions- Built for business users to manage the entire solution without the need for
developers- Executive and management data from across the organization that is easily
accessible in ONE place with Solver’s intelligent data warehouse- Solver’s multi-tenant cloud application provides quick initiation, SOC 2
compliance, automatic software upgrades, and scalability at one’s convenience- Solver provides the power and the familiarity of cloud-connected Excel to solve
the most complex formula and layout requirements for reporting and planningtemplate designers
- Easy-to-use, pre-built integration to Power BI, the world’s #1 visualization solution- Fast and cost effective integrations provided with Solver’s wizard-driven CSV, SQL,
and prebuilt ERP/CRM Connectors- Unlimited access to reports and dashboards from secure web portal- Hybrid cloud option provides customers with real-time cloud reporting
capabilities for their on-premise ERP system

Copyright ©2020, Solver. All rights reserved. Visit us: www.solverglobal.com Solver White Paper | Page 2
Real Estate Industry White Paper
Company Summary Solver, Inc. is redefining the category of cloud-based reporting and planning. The Solver solution is built to enable faster and better business decisions across the entire organization. Solver combines financial and other key data into a single tool, powered by the most flexible report and planning form designer on the market. Organizations use this solution to automate and streamline financial and operational reports, consolidations, and budgeting and forecasting processes. Solver empowers users with complete insight that drives intelligent decisions and competitive advantages. Headquartered in the United States, Solver, Inc. has more than a dozen offices and hundreds of partners globally that provide local and industry expertise. To learn more, visit www.solverglobal.com.

Copyright ©2020, Solver. All rights reserved. Visit us: www.solverglobal.com Solver White Paper | Page 3
Real Estate Industry White Paper
RE01 - COO Dashboard The COO Dashboard example prepares answers to the questions that a COO (Chief Operating Officer) often is being asked, in a single dashboard view. The COO will be able to provide answers about:
x US Sales Trend – ACT vs BUD x Revenues by Status x Top 5 Projects – Month of Stock x Available Units by State x US Sales MTD – ACT vs BUD x Sold Units Trend x Top 5 Projects – Monthly Average Speed x Top 5 Agents – US Sales
Copyright ©2020, Solver. All rights reserved. Visit us: www.solverglobal.com Solver White Paper | Page 4
Real Estate Industry White Paper
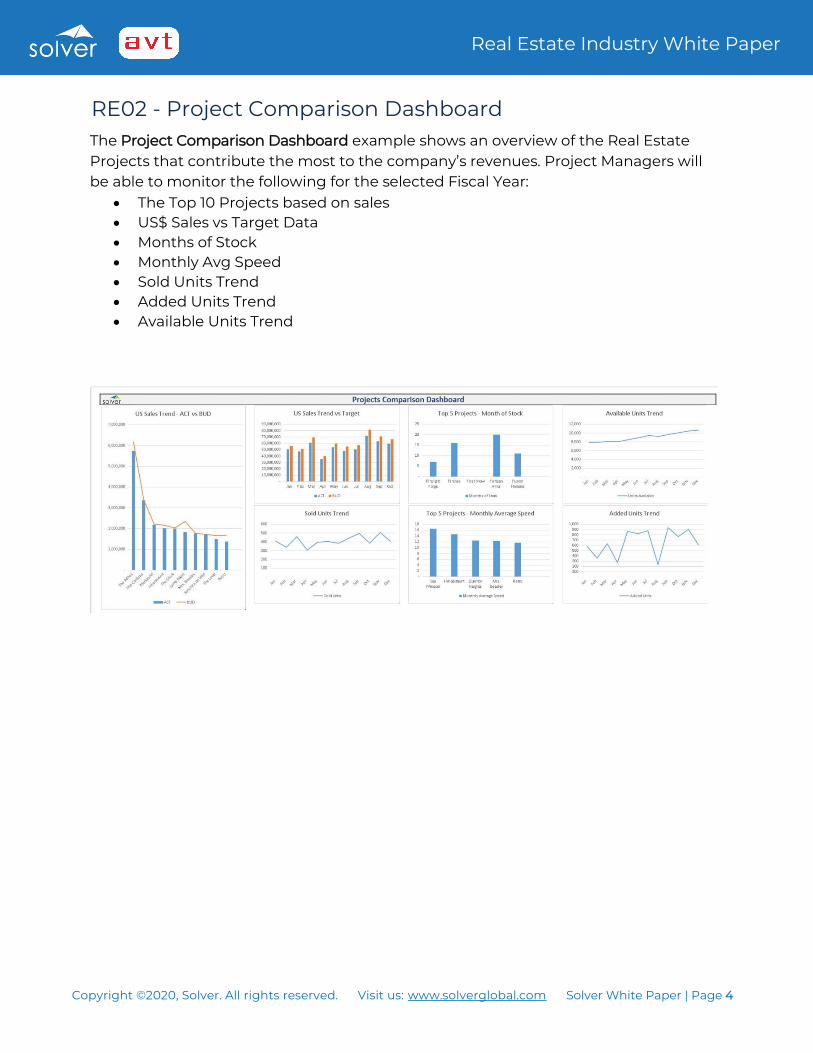
RE02 - Project Comparison Dashboard The Project Comparison Dashboard example shows an overview of the Real Estate Projects that contribute the most to the company’s revenues. Project Managers will be able to monitor the following for the selected Fiscal Year:
x The Top 10 Projects based on sales x US$ Sales vs Target Data x Months of Stock x Monthly Avg Speed x Sold Units Trend x Added Units Trend x Available Units Trend
Copyright ©2020, Solver. All rights reserved. Visit us: www.solverglobal.com Solver White Paper | Page 5
Real Estate Industry White Paper
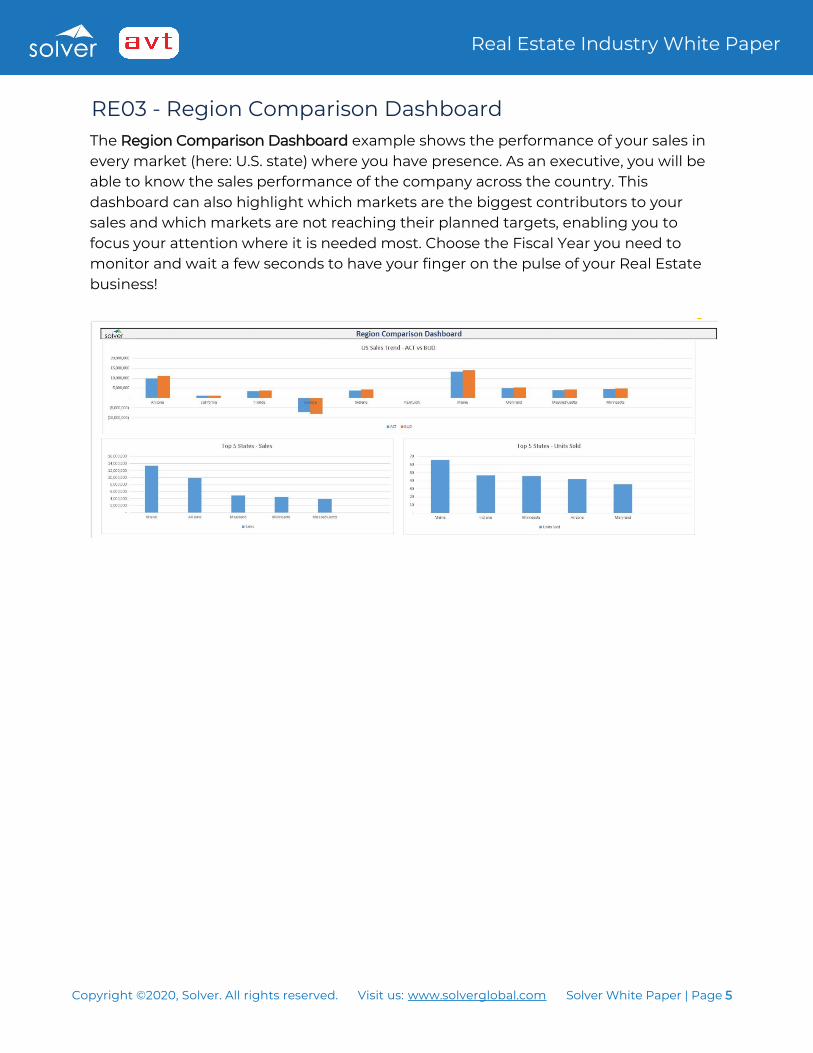
RE03 - Region Comparison Dashboard The Region Comparison Dashboard example shows the performance of your sales in every market (here: U.S. state) where you have presence. As an executive, you will be able to know the sales performance of the company across the country. This dashboard can also highlight which markets are the biggest contributors to your sales and which markets are not reaching their planned targets, enabling you to focus your attention where it is needed most. Choose the Fiscal Year you need to monitor and wait a few seconds to have your finger on the pulse of your Real Estate business!
Copyright ©2020, Solver. All rights reserved. Visit us: www.solverglobal.com Solver White Paper | Page 6
Real Estate Industry White Paper
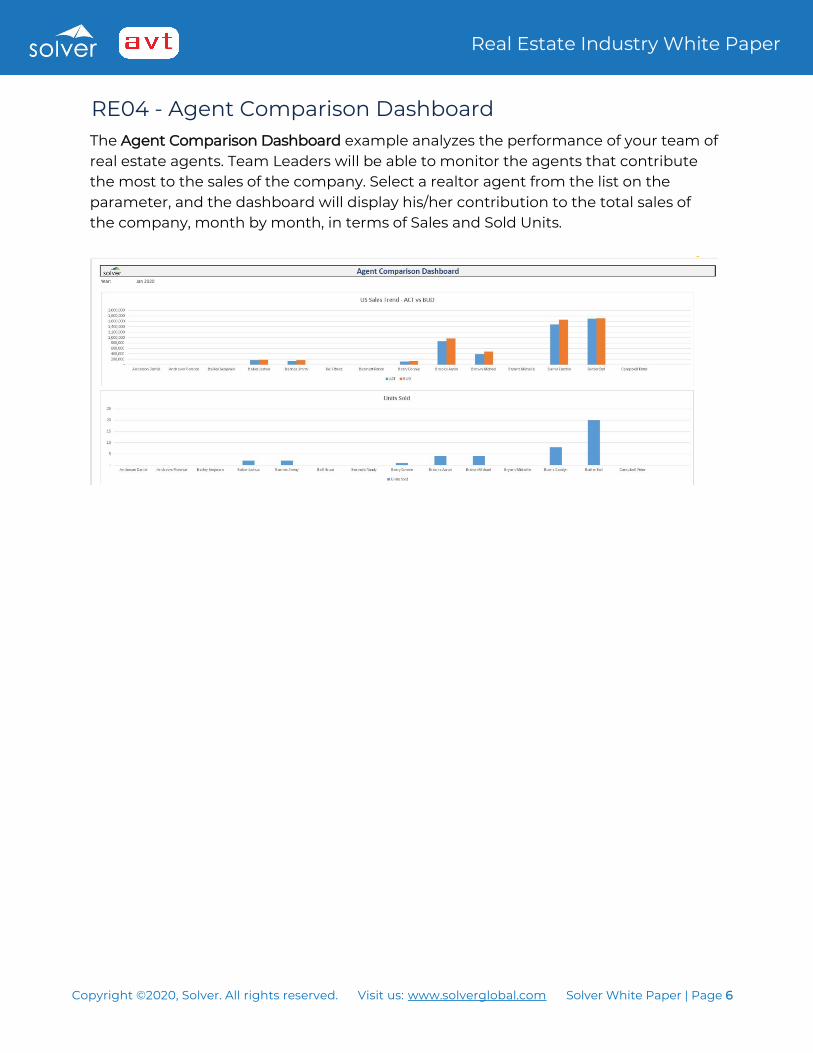
RE04 - Agent Comparison Dashboard The Agent Comparison Dashboard example analyzes the performance of your team of real estate agents. Team Leaders will be able to monitor the agents that contribute the most to the sales of the company. Select a realtor agent from the list on the parameter, and the dashboard will display his/her contribution to the total sales of the company, month by month, in terms of Sales and Sold Units.

Copyright ©2020, Solver. All rights reserved. Visit us: www.solverglobal.com Solver White Paper | Page 7
Real Estate Industry White Paper
RE05 - Bank Comparison Dashboard The Bank Comparison Dashboard example shows which banks finance the most Real Estate Projects in the current year. This is the starting point to discover if there’s a relation between the bank services and the sales performance of the projects. A pie graph displays what is the participation each bank as a percent of total sales of the company for the selected Fiscal Year.
Copyright ©2020, Solver. All rights reserved. Visit us: www.solverglobal.com Solver White Paper | Page 8
Real Estate Industry White Paper
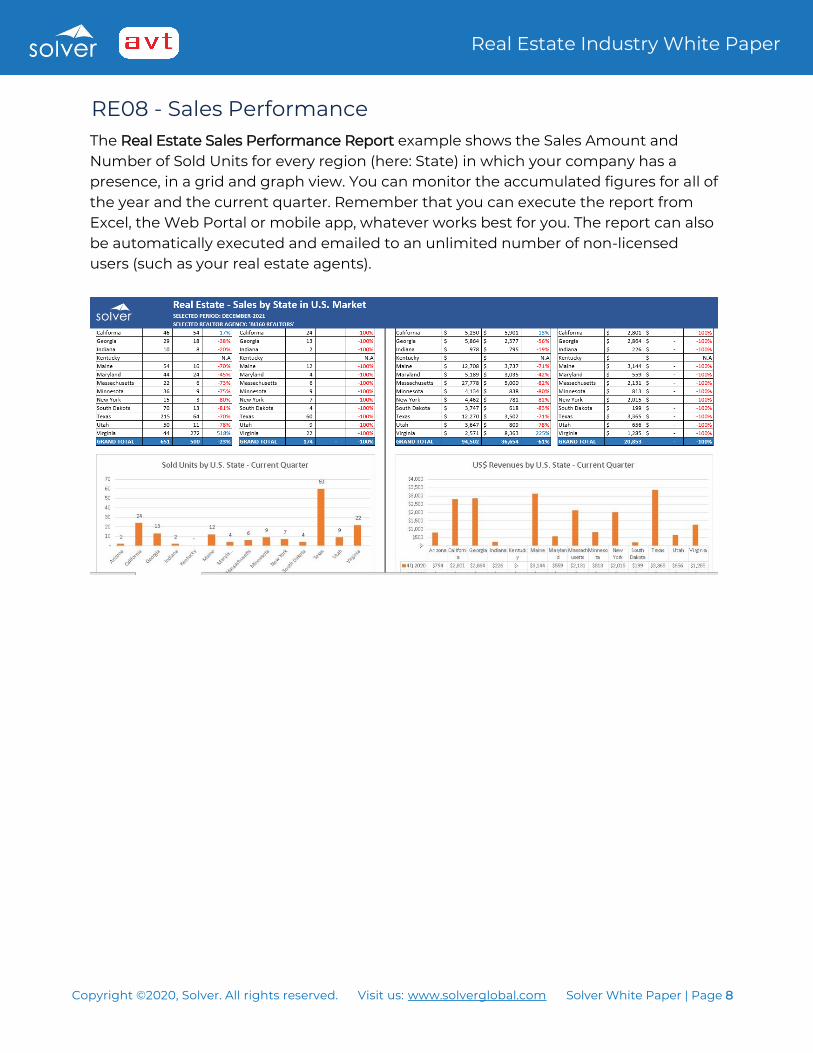
RE08 - Sales Performance The Real Estate Sales Performance Report example shows the Sales Amount and Number of Sold Units for every region (here: State) in which your company has a presence, in a grid and graph view. You can monitor the accumulated figures for all of the year and the current quarter. Remember that you can execute the report from Excel, the Web Portal or mobile app, whatever works best for you. The report can also be automatically executed and emailed to an unlimited number of non-licensed users (such as your real estate agents).

Copyright ©2020, Solver. All rights reserved. Visit us: www.solverglobal.com Solver White Paper | Page 9
Real Estate Industry White Paper
RE09 - Real Estate Stock Analysis The Real Estate Stock Analysis Report example tells you, for every region (here: State) in which your company has presence, four key metrics to analyze in your real estate inventory:
x Available Stock (available properties) x Sold Units x Monthly Average Speed x Months Of Stock (properties)
Remember that you can execute the report from Excel, the Web Portal or mobile app - whatever works best for you. The report can also be automatically executed andemailed to an unlimited number of non-licensed users (such as your real estateagents).
Copyright ©2020, Solver. All rights reserved. Visit us: www.solverglobal.com Solver White Paper | Page 10
Real Estate Industry White Paper
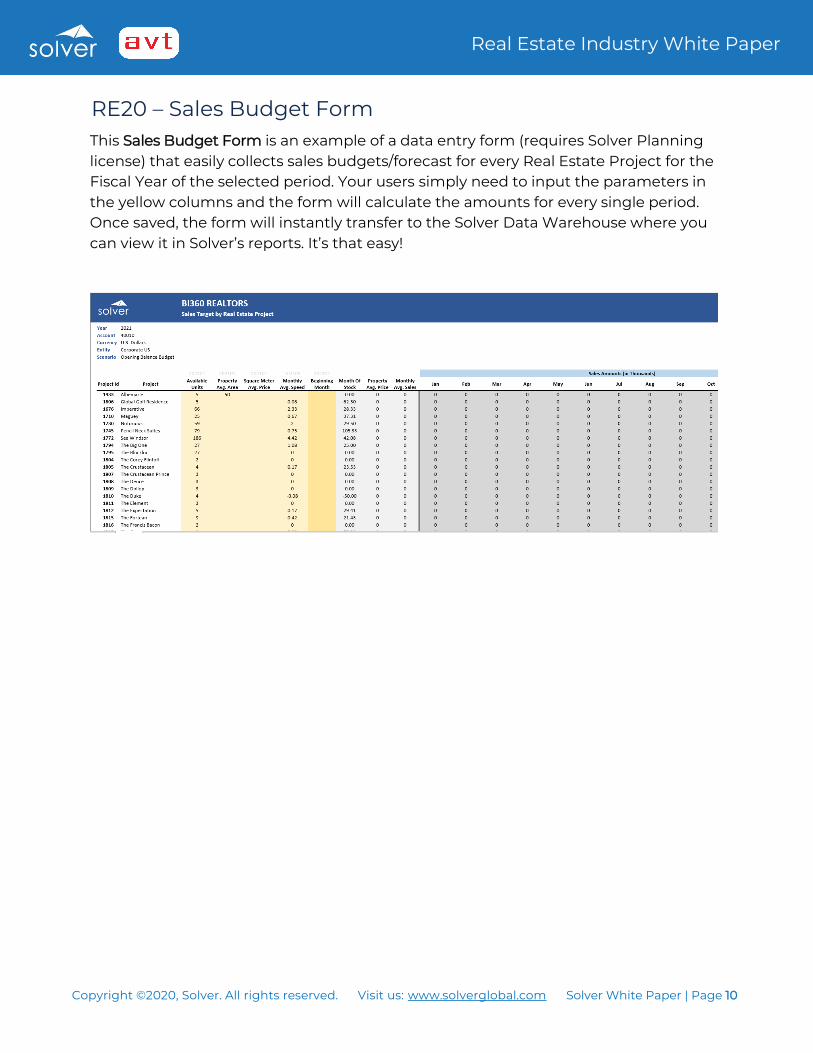
RE20 – Sales Budget Form This Sales Budget Form is an example of a data entry form (requires Solver Planning license) that easily collects sales budgets/forecast for every Real Estate Project for the Fiscal Year of the selected period. Your users simply need to input the parameters in the yellow columns and the form will calculate the amounts for every single period. Once saved, the form will instantly transfer to the Solver Data Warehouse where you can view it in Solver’s reports. It’s that easy!