reagent company (beijing, china). cdcl o was provided by … · 2014-11-06 · reagent company...
TRANSCRIPT
1
Supporting information
1. Materials and instruments
BSA, NADPH and other related bio-reagents were purchased from Dingguo Changsheng
biotechnology (Beijing, China). Reduced glutathione (r-GSH) were purchased from Aladdin
(Shanghai, China). Sodium selenite(Na2SeO3)were purchased from Xiya Reagent (Chengdu,
China). Sodium borohydride and all other chemicals were purchased from Beijing Chemical
Reagent Company (Beijing, China). CdCl2•2.5H2O was provided by Northeast Normal University
in Changchun, China. The double-distilled water (dH2O) used throughout the experiments was
produced by a Milli-Q system (Millipore, Bedford, MA, USA)
UV-visible absorption spectra were characterized using a Shimadzu 3600. Fluorescence
spectroscopy was obtained with a Shimadzu 5301 PC spectrophotometer. Fourier transform infrared
spectrometer (FT-IR Spectrometer) was carried out on a Brucker Vertex 80V. All optical
measurements were performed at room temperature under ambient conditions. SEM images were
conducted on a JEOL FESEM 6700F electron microscope. DLS was performed on a Zetasizer Nano
ZS (Malvern Instruments). TEM images were collected using a JEOL JEM-2100F microscope.
2. Synthetic methods for the CdSe QDs
2.1 Preparation of SeNPs
The method of SeNP synthesis was modified from previous report.[1] Size controllable SeNPs were
successfully produced by adding sodium selenite to solution containing BSA and GSH. Specifically,
Selenite (0.1M, 500μl) was added into the 2.5ml solution containing BSA (10 mg) and GSH (15.5
mg). Within five minutes, the color of the solution turns from colorless to red, indicating the
formation of SeNPs.
2.2 Synthesis of CdSe QDs
Unlike the general synthesis methods where Se2- was produced by the reaction of sodium
borohydride with selenium powder in an ice bath under the N2 atmosphere for several hours, we use
SeNPs as the source of active selenium. Specifically, SeNPs (400 μl) was added into the 14 ml
Electronic Supplementary Material (ESI) for RSC Advances.This journal is © The Royal Society of Chemistry 2014

2
water-solution containing 24 mg sodium borohydride. Within three minutes, the colour of the
solution became colorless and produced some foams, suggesting the formation of Se2- group. After
that, 0.1M Cd2+ (115 μl) was added into the Se2- solution. In a second, the solution changed to
yellow-green, hinting the formation of BSA-GSH-CdSe QDs. All the processes were acted within
ten minute and did not need special equipment or skills (Scheme 1).
2.3 NADPH Detection
To study NADPH sensor function, NADPH (0.25 mM – 13 mM) was added into 400 μl PBS buffer
(pH 7.4) containing BSA-GSH-CdSe QDs (0.82 mM), the fluorescence responses were recorded
and analyzed carefully.
2.4 Detection of NADPH in biological background
Human blood samples were collected from volunteers. All the blood samples were centrifuged at
1000 g for 10 min at 4℃ before use. In parallel to BSA-GSH-CdSe QDs - PBS buffer system, 10%
of PBS buffer was replaced by serum. The fluorescence responses of both systems toward NADPH
were carefully compared.
3
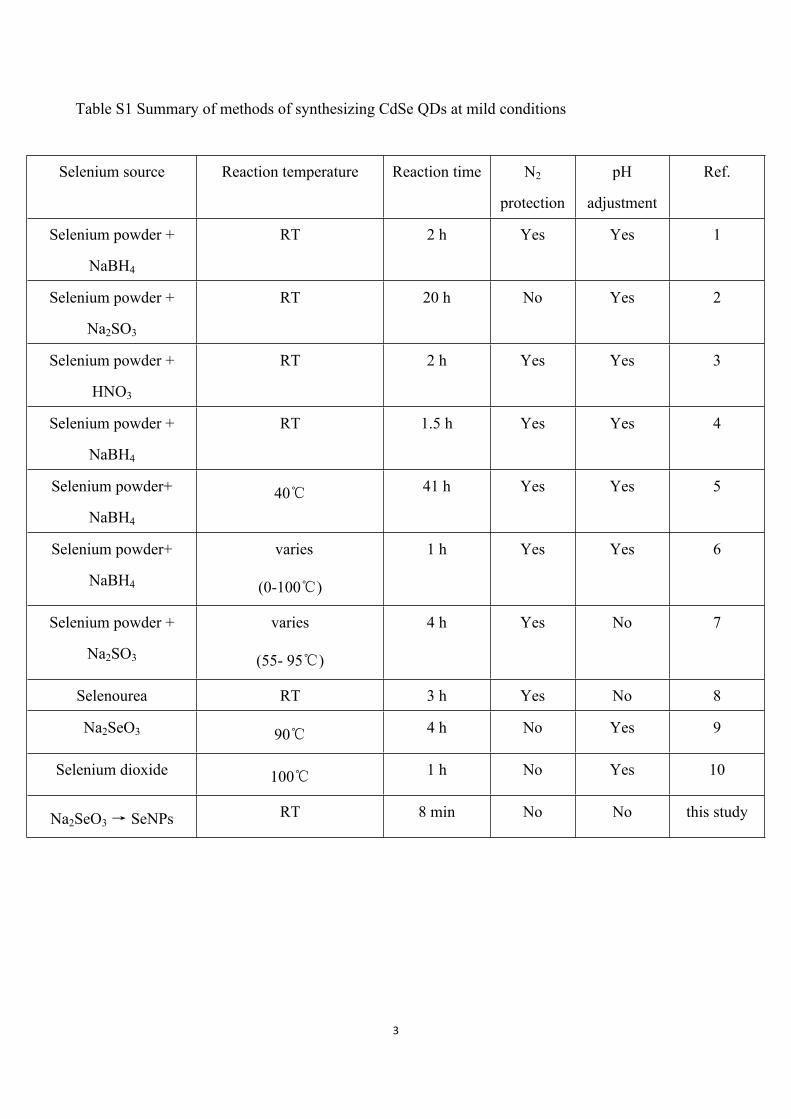
Table S1 Summary of methods of synthesizing CdSe QDs at mild conditions
Selenium source Reaction temperature Reaction time N2
protection
pH
adjustment
Ref.
Selenium powder +
NaBH4
RT 2 h Yes Yes 1
Selenium powder +
Na2SO3
RT 20 h No Yes 2
Selenium powder +
HNO3
RT 2 h Yes Yes 3
Selenium powder +
NaBH4
RT 1.5 h Yes Yes 4
Selenium powder+
NaBH4
40℃ 41 h Yes Yes 5
Selenium powder+
NaBH4
varies
(0-100℃)
1 h Yes Yes 6
Selenium powder +
Na2SO3
varies
(55- 95℃)
4 h Yes No 7
Selenourea RT 3 h Yes No 8
Na2SeO3 90℃ 4 h No Yes 9
Selenium dioxide 100℃ 1 h No Yes 10
Na2SeO3 → SeNPs RT 8 min No No this study

4
Table S2 Recovery for the determination of NADPH content in serum samples (Mean ± s; n = 3).
Type of samples NADPH spiked (mM) Recovery (%)
0.25 102 ± 2.8
Human blood serum 0.75 98 ± 3.2
1.5 99 ± 1.7
5
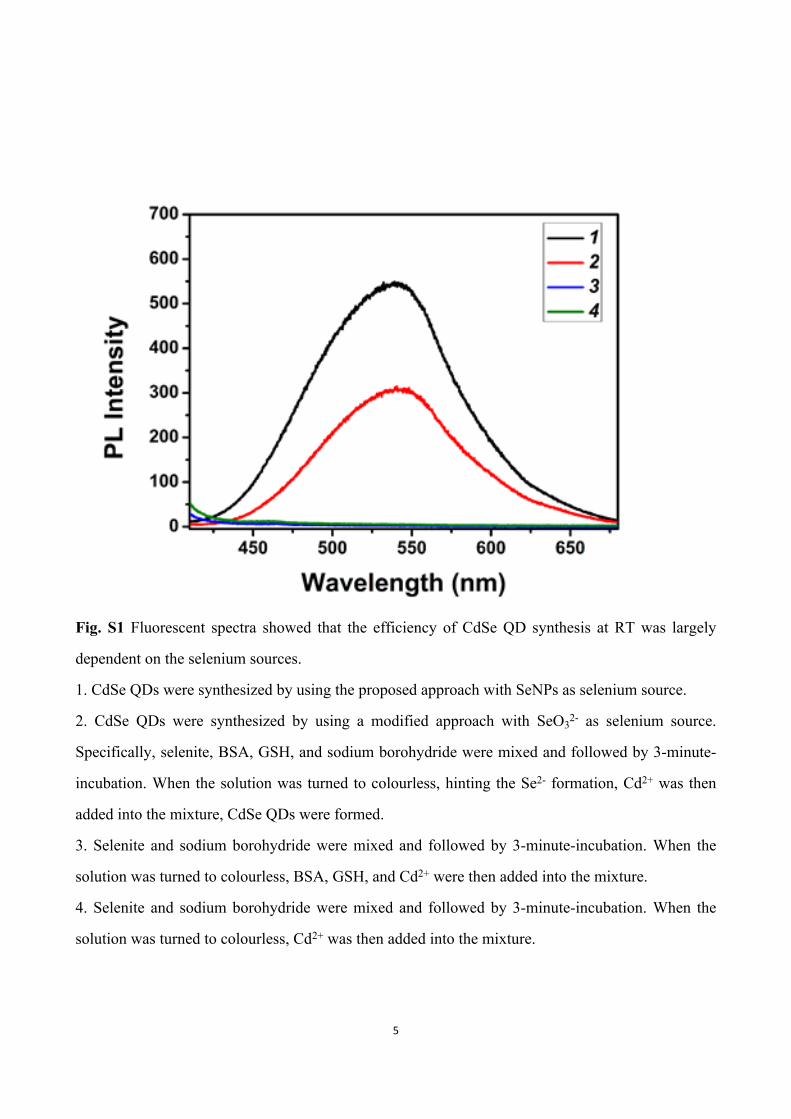
Fig. S1 Fluorescent spectra showed that the efficiency of CdSe QD synthesis at RT was largely
dependent on the selenium sources.
1. CdSe QDs were synthesized by using the proposed approach with SeNPs as selenium source.
2. CdSe QDs were synthesized by using a modified approach with SeO32- as selenium source.
Specifically, selenite, BSA, GSH, and sodium borohydride were mixed and followed by 3-minute-
incubation. When the solution was turned to colourless, hinting the Se2- formation, Cd2+ was then
added into the mixture, CdSe QDs were formed.
3. Selenite and sodium borohydride were mixed and followed by 3-minute-incubation. When the
solution was turned to colourless, BSA, GSH, and Cd2+ were then added into the mixture.
4. Selenite and sodium borohydride were mixed and followed by 3-minute-incubation. When the
solution was turned to colourless, Cd2+ was then added into the mixture.

6
Fig. S2 The FT-IR spectra of BSA, GSH and BSA-GSH-CdSe QDs

7
Fig. S3 a. Comparison of CdSe QD synthesis in the prescent/absence of BSA. b. The blue shift
based on the changes of maximum fluorescence wavelength (535→482 nm) was observed
alongwith the increase of BSA content in 2.5 ml solutions (0, 5, 10. 40, 80, 100 mg).
Fig. S4 The fluorescence spectroscopy of different proteins conjugated QDs using the same
procedure, 10 mg proteins were added into 2.5 ml solution.

8
Fig. S5 The stability of BSA-GSH-CdSe QDs in different conditions. a. the fluorescence intensity
of BSA-GSH-CdSe QDs in different buffers (BSA-GSH-CdSe QDs were lyophilized, and then
9
dissolved in different buffers. All the buffer solution was 20 mM (pH 7.4)). B. the stability of BSA-
GSH-CdSe QDs toward the change of salt centration as indicated by the relative fluorescence
intensity (NaCl concentration: 0, 10, 50, 100, 200, 300, 500 mM). c. the stability of BSA-GSH-
CdSe QDs toward the change of pH as indicated by the relative fluorescence intensity. d. the
stability of BSA-GSH-CdSe QDs toward longtime incubation at RT as indicated by the relative
fluorescence intensity. I482 and I0 refer to the fluorescent intensity at 482 and 535 nm, respectively.
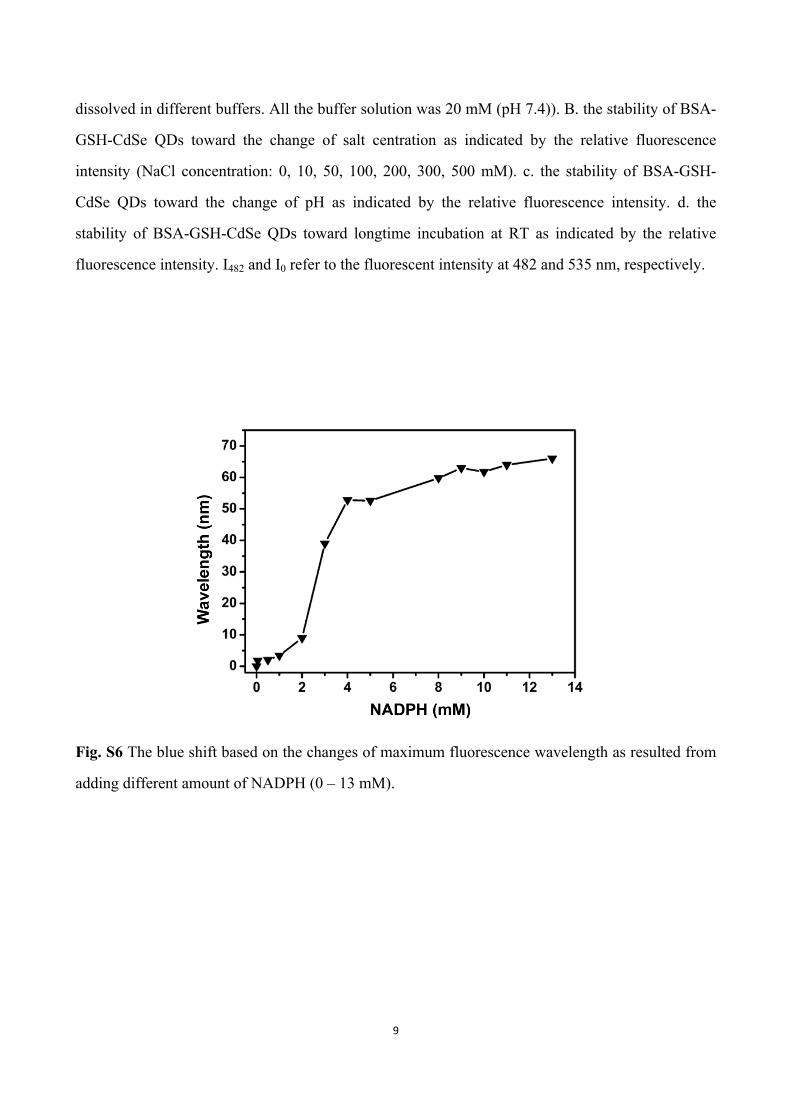
Fig. S6 The blue shift based on the changes of maximum fluorescence wavelength as resulted from
adding different amount of NADPH (0 – 13 mM).
10
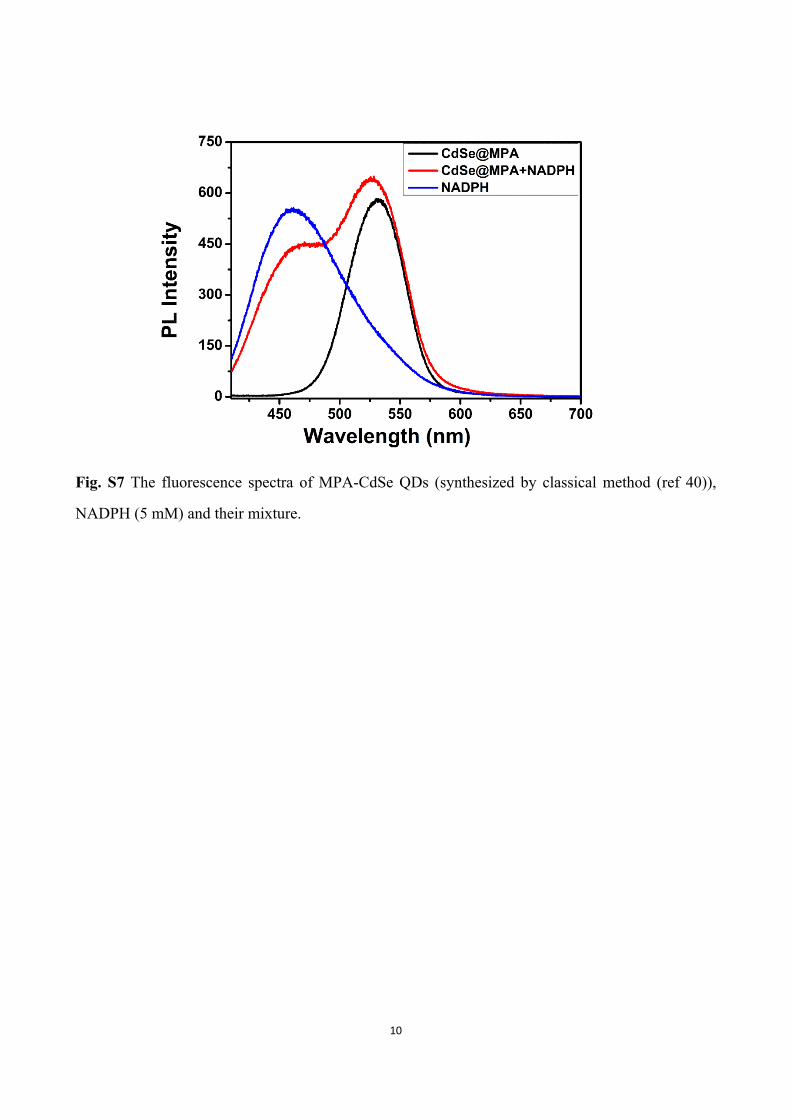
Fig. S7 The fluorescence spectra of MPA-CdSe QDs (synthesized by classical method (ref 40)),
NADPH (5 mM) and their mixture.

11
Fig. S8 Schematic chemical structures of NADPH and its derivatives or several other related
compounds.
12
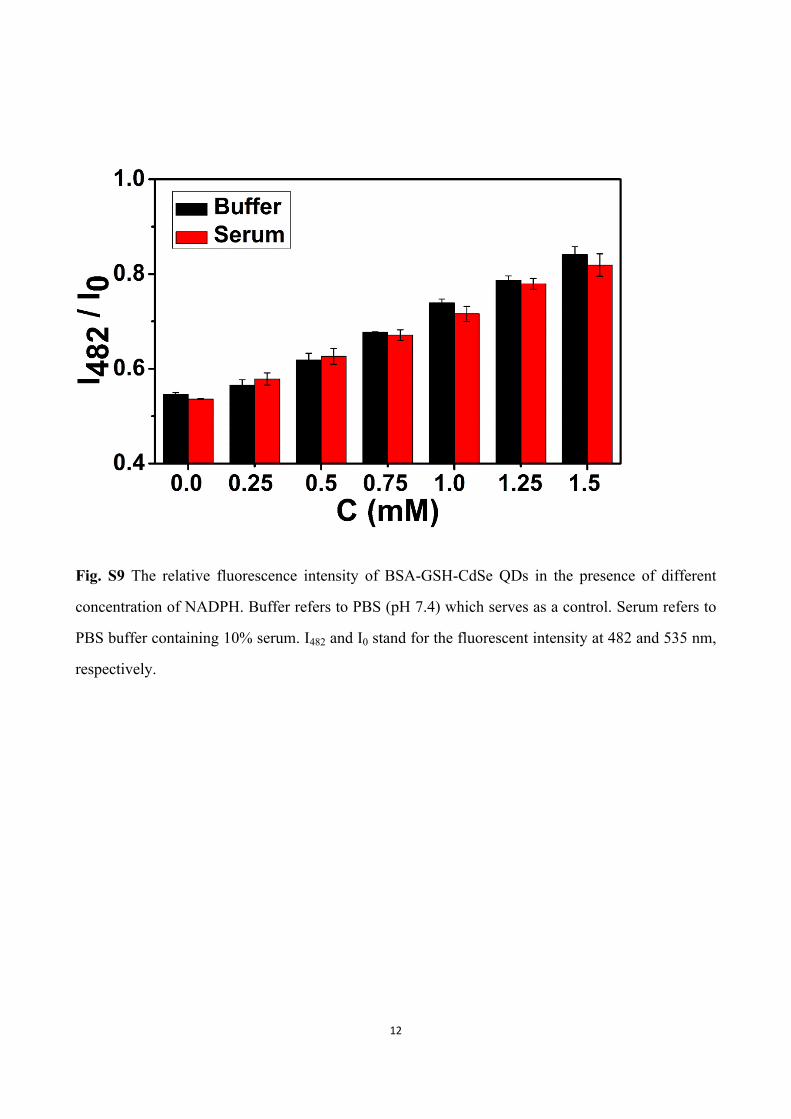
Fig. S9 The relative fluorescence intensity of BSA-GSH-CdSe QDs in the presence of different
concentration of NADPH. Buffer refers to PBS (pH 7.4) which serves as a control. Serum refers to
PBS buffer containing 10% serum. I482 and I0 stand for the fluorescent intensity at 482 and 535 nm,
respectively.

13
References
1 Oluwatobi S. Oluwafemi, Colloids and Surfaces B: Biointerfaces., 2009, 73, 382
2 Jin Hua Li, Cui Ling Ren, XiaoYan Liu, Zhi De Hu, De Sheng Xue, Materials Science and
Engineering A., 2007, 458, 319
3 Oliva M. Primera-Pedrozo, Zikri Arslan, Bakhtiyor Rasulev and Jerzy Leszczynski, Nanoscale.,
2012, 4, 1312
4 M. Penchal Reddy, W. Madhuri, I.S.S.K. Rao, I.G.Kim and R. Ramakrishna Reddy,
International Journal of ChemTech Research., 2014, 6, 2048
5 Qisui Wang, Song Li, Peng Liu, Xinmin Min, Materials Chemistry and Physics., 2012,137, 580
6 Qizhuang Sun, Shasha Fu, Tingmei Dong, Shuxian Liu and Chaobiao Huang, Molecules., 2012,
17, 8430
7 Amal M. Al-Amri, S.J. Yaghmour, Waleed E. Mahmoud, Journal of Crystal Growth., 2011,
334, 76
8 Yuanyuan Wang, Ying Zhang, Fudong Wang, Daryl E. Giblin, Jessica Hoy, Henry W. Rohrs,
Richard A. Loomis, and William E. Buhro, Chem. Mater., 2014, 26, 2233
9 Min Zhoua, Huijuan Geng, Juan Rena, Xiaofeng Chen, Cuiling Ren, Hongli Chen, Xingguo Chen,
Chemical Engineering Journal., 2013, 215, 144
10 R.M. Hodlur, M.K. Rabinal, Chemical Engineering Journal, 2014, 244, 8