reading first impact study: interim report · w. carter smith robert g. st.pierre fatih unlu ......
TRANSCRIPT

U . S . D E PA R T M E N T O F E D U C AT I O N
Reading First Impact Study:Interim Report
NCEE 2008-4016
Reading First Impact Study:Interim Report
April 2008
Beth C. Gamse, Project Director, Abt AssociatesHoward S. Bloom, MDRCJames J. Kemple, MDRCRobin Tepper Jacob, Abt Associates/University of Michigan
Beth Boulay Laurie Bozzi Linda Caswell Megan Horst W. Carter Smith Robert G. St.Pierre Fatih Unlu Abt Associates
Corinne Herlihy Pei ZhuMDRC
With the assistance ofDiane Greene Jongsun Kim Don LaLiberty Ken LamKenyon MareeRachel McCormickJesselle Miura Rebecca UntermanEdmond Wong
NCEE 2008-4016U.S. DEPARTMENT OF EDUCATION

This report was prepared for the Institute of Education Sciences under Contract No. ED-01-CO-0093/0004. The project offi cer was Tracy Rimdzius in the National Center for Education Evaluation and Regional Assistance.
U.S. Department of EducationMargaret SpellingsSecretary
Institute of Education SciencesGrover J. WhitehurstDirector
National Center for Education Evaluation and Regional Assistance Phoebe CottinghamCommissioner
April 2008
This report is in the public domain. Authorization to reproduce it in whole or in part is granted. While permission to reprint this publication is not necessary, the citation should be: Gamse, B.C., Bloom, H.S., Kemple, J.J., Jacob, R.T., (2008). Reading First Impact Study: Interim Report (NCEE 2008-4016). Washington, DC: National Center for Education Evaluation and Regional Assistance, Institute of Education Sciences, U.S. Department of Education.
IES evaluation reports present objective information on the conditions of implementation and impacts of the programs being evaluated. IES evaluation reports do not include conclusions or recommendations or views with regard to actions policymakers or practitioners should take in light of the fi ndings in the reports.
To order copies of this report,Write to ED Pubs, Education Publications Center, U.S. Department of Education, P.O. Box 1398, Jessup, MD • 20794-1398.Call in your request toll free to 1-877-4ED-Pubs. If 877 service is not yet available in your area, call 800-872-5327 • (800-USA-LEARN). Those who use a telecommunications device for the deaf (TDD) or a teletypewriter (TTY) should call 800-437-0833.Fax your request to 301-470-1244.• Order online at • www.edpubs.org.
This report also is available on the IES website at http://ncee.ed.gov.
Alternate FormatsUpon request, this report is available in alternate formats such as Braille, large print, audiotape, or computer diskette. For more information, please contact the Department’s Alternate Format Center at 202-260-9895 or 202-205-8113.

Acknowledgements The Reading First Impact Study Team would like to express its gratitude to the students, faculty, and staff in the study’s participating schools and districts. Their contributions to the study (via assessments, observations, surveys, and more) are deeply appreciated. We are the beneficiaries of their generosity of time and spirit. The listed authors of this report represent only a small part of the team involved in this project. We would like to acknowledge the support of staff from Computer Technology Services (for the study’s data collection website), from DataStar (for data entry), from MDRC (especially Mario Flecha, for his help on the calendar front), from Retail Solutions at Work (and the hundreds of classroom observers who participated in intensive training and data collection activities), from Paladin Pictures (for developing training videos for classroom observations), from RMC Research (especially Chris Dwyer, for help on developing instruments and on training observers), from Rosenblum-Brigham Associates (for district site visits), from Westat (especially Sherry Sanborne and Alex Ratnofsky, for managing the student assessment, and the many Student Assessment Coordinators and even more test administrators), and from Westover (especially Wanda Camper, LaKisha Dyson, and Pamela Wallace for helping with meeting logistics). The study has also benefited from both external and internal technical advisors, including: External Advisors Josh Angrist David Card Robert Brennan Thomas Cook* Jack Fletcher* David Francis Larry Hedges* Robinson Hollister* Guido Imbens Brian Jacob David Lee Tim Shanahan* Judy Singer Jeff Smith Faith Stevens* Petra Todd Wilbert Van der Klaauw Sharon Vaughn*
Internal advisors Steve Bell (A) Gordon Berlin (M) Nancy Burstein (A) Fred Doolittle (M) Barbara Goodson (A) John Hutchins (M) Marc Moss (A) Chuck Michalopoulous (M) Larry Orr (A) Cris Price (A) Janet Quint (M) Howard Rolston (A) (A—Abt Associates) (M—MDRC)
* Individuals who have served on the study’s Technical Work Group Finally, we want to recognize the steady contributions of Abt staff, including Brenda Rodriguez, Fran Coffey, Lynn Reneau, Davyd Roskilly, Jon Schmalz, and Estella Sena, who were instrumental in completing multiple data collections, and Eileen Fahey, Katheleen Linton, and Jan Nicholson for countless hours of production support.

Disclosure of Potential Conflicts of Interests1 The research team for this evaluation consists of a prime contractor, Abt Associates, and two major subcontractors, MDRC and Westat. None of these organizations or their key staff has financial interests that could be affected by findings from the Reading First Impact Study. No one on the Technical Work Group, convened to provide advice and guidance, has financial interests that could be affected by findings from the evaluation.
1 Contractors carrying out research and evaluation projects for IES frequently need to obtain expert advice
and technical assistance from individuals and entities whose other professional work may not be entirely independent of or separable from the particular tasks they are carrying out for the IES contractor. Contractors endeavor not to put such individuals or entities in positions in which they could bias the analysis and reporting of results, and their potential conflicts of interest are disclosed.

Contents i
Contents
Executive Summary ............................................................................................................................ ix The Reading First Program.......................................................................................................... x The Reading First Impact Study .................................................................................................. x
Research Design ................................................................................................................ x Study Sample....................................................................................................................xi Data Collection and Outcome Measures .........................................................................xii
Average Impacts Across All Sites ............................................................................................xiv Impact Differences....................................................................................................................xvi Further Research .......................................................................................................................xix
Chapter One: Study Overview ........................................................................................................... 1 Overview of Reading First Program ............................................................................................ 1 A Conceptual Framework for the Reading First Impact Study.................................................... 2
Legislative Specifications and Administrative Guidelines................................................ 4 The Flow of Reading First Funds ...................................................................................... 4 Design and Implementation of Research-Based Reading Programs ................................. 5 Enhanced Student Reading Achievement.......................................................................... 5
Reading First Impact Study Evaluation Questions ...................................................................... 5
Chapter Two: Study Design, Methods, and Sample......................................................................... 7 Study Design................................................................................................................................ 7
Approach ........................................................................................................................... 7 Measures.......................................................................................................................... 10 Estimation........................................................................................................................ 10
The Study Sample ...................................................................................................................... 15 Representativeness of the Sample ................................................................................... 19
Chapter Three: Measures and Data Collection .............................................................................. 25 Student Reading Comprehension............................................................................................... 28 Reading Instruction.................................................................................................................... 30
Development of Classroom Observational Measures...................................................... 31 Student Time-on-Task and Engagement with Print ................................................................... 34
Chapter Four: Impact Findings ........................................................................................................ 37 Average Impacts for the Study Sites.......................................................................................... 38
Reading Comprehension.................................................................................................. 38 Reading Instruction ......................................................................................................... 41 Student Engagement with Print ....................................................................................... 45
Variation in Impacts Across Sites .............................................................................................. 47 Variation in Impacts on Reading Comprehension........................................................... 47 Variation in Impacts on Reading Instruction................................................................... 49 Variation in Impacts on Student Engagement with Print ................................................ 49
Alternative Approaches to Weighting: Implications of Variation in Impacts Across Sites....... 50

Differences in Impacts by Length of Time That Reading First Funding Was Available .......... 51 Differences in Impacts for Early and Late Award Sites.................................................. 54
A Preliminary Exploration of Factors That Could Be Related to Program Impacts ................. 60 Related Differences Between Site Award Subgroups..................................................... 61 Associations Between Program Impacts and Two Site Characteristics .......................... 63
Summary ................................................................................................................................... 63 Appendix A: State and Site Award Data .................................................................................... A-1 Appendix B: Methods................................................................................................................... B-1 Appendix C: Measures ................................................................................................................. C-1 Appendix D: Additional Exhibits for Main Impact Analyses................................................... D-1 Appendix E: Confidence Intervals for Main Impact Estimates............................................... E-1 Appendix F: Graphs of Site-By-Site Impact Estimates .............................................................F-1 Appendix G: Additional Exhibits for Subgroup Analyses ........................................................ G-1 Appendix H: Alternative Moderators of Reading First Impacts.............................................. H-1
References......................................................................................................................................... R-1

List of Exhibits iii
List of Exhibits Exhibit ES.1: Baseline Characteristics of Relevant Groups of Reading First Schools for 2002-2003...........................................................................................................................................xii Exhibit ES.2: Data Collection Schedule for the Reading First Impact Study ....................................xiii Exhibit ES.3: Estimated Impacts on Reading Comprehension, Instruction, and Percentage of Students Engaged with Print: Spring 2005, Fall 2005, and Spring 2006 ........................................... xv Exhibit ES.4: Estimated Impacts on Reading Comprehension and Minutes in the Five Dimensions, by Implementation Year, Calendar Year, and Award Status..............................................................xvii Exhibit ES.5: Estimated Impacts on Key Outcomes for Early and Late Award Sites, by Grade.....xviii Exhibit 1.1: Conceptual Framework for the Reading First Program: From Legislation and Funding to Program Implementation and Impact.................................................................................3 Exhibit 2.1: Regression Discontinuity Analysis for a Hypothetical School District............................. 9 Exhibit 2.2: Estimated Residual Differences in Baseline Characteristics of Schools in the Study Sample: 2002-2003 .................................................................................................................. 13 Exhibit 2.3: Minimal Detectable Effects for Full Sample Impact Estimates ...................................... 15 Exhibit 2.4: RFIS Sample Selection: From Regression Discontinuity Design Target Sample to Analytic Sample ............................................................................................................................. 17 Exhibit 2.5: Numbers, Ratings, and Cut-points for Selection of Reading First and Reading First Impact Study Schools, by Site (Initial Sample for 17 Sites, Excluding Random Assignment Site) ................................................................................................................................ 18 Exhibit 2.6: Relevant Groups of Reading First Schools...................................................................... 20 Exhibit 2.7: Baseline Characteristics of Relevant Groups of Reading First Schools for 2002-2003........................................................................................................................................... 21 Exhibit 2.8: School-Level Characteristics of Reading First Schools in the Reading First Impact Study and the Reading First Implementation Study for 2004-2005....................................... 23 Exhibit 3.1: Data Collection Schedule for the Reading First Impact Study........................................ 25 Exhibit 3.2: Summary of RFIS Data Collection Activities and Respective Response Rates, by Grade ............................................................................................................................................. 26 Exhibit 3.3: Description of Measures Utilized in the Reading First Impact Study ............................. 27 Exhibit 4.1: Estimated Impacts on Student Achievement: Spring 2005 and 20061 ............................ 39 Exhibit 4.2: Estimated Impacts and Confidence Intervals for Key Outcomes, in Effect Size, by Grade ............................................................................................................................................. 42 Exhibit 4.3: Estimated Impacts on Instructional Outcomes: Spring 2005, Fall 2005, and Spring 2006 ........................................................................................................................................ 43 Exhibit 4.4: Estimated Impacts on Instructional Outcomes: Spring 2005, Fall 2005, and Spring 2006 ........................................................................................................................................ 45 Exhibit 4.5: Estimated Impacts on the Percentage of Students Engaged with Print: Fall 2005 and Spring 2006.................................................................................................................................. 46 Exhibit 4.6: Fixed Effect Impact Estimates on Reading Comprehension, by Site, by Grade .............. 48 Exhibit 4.7: Results of Composite F-Test for Variation in Site Level Impacts.................................... 49 Exhibit 4.8: Estimated Impacts on Reading Comprehension and Minutes in the Five Dimensions, by Implementation Year, Calendar Year, and Award Status ........................................ 53

iv List of Exhibits
Exhibit 4.9: Estimated Impacts on Reading Comprehension: Spring 2005 and 2006, by Award Status................................................................................................................................. 55 Exhibit 4.10: Estimated Impacts on Reading Instruction, by Award Status ........................................ 57 Exhibit 4.11: Estimated Impacts on the Percentage of Students Engaged with Print: Fall 2005 and Spring 2006, by Award Status .................................................................................... 58 Exhibit 4.12: Estimated Impacts and Confidence Intervals for Key Outcomes, in Effect Size, by Grade, by Award Status ................................................................................................................ 59 Exhibit 4.13: Characteristics of Early and Late Award Sites............................................................... 61 Exhibit 4.14: Baseline Characteristics of RFIS Reading First Schools, by Award Status................... 62 Exhibit A.1: Award Date by Site in Order of Date when Reading First Funds Were First Made Available for Implementation .................................................................................................. A-1 Exhibit B.1: Observed Differences in Baseline Characteristics of Schools in the Study Sample: 2002-2003 ............................................................................................................................ B-4 Exhibit B.2: Estimated Residual Differences in Baseline Characteristics of Schools in the Study Sample: 2002-2003.................................................................................................................. B-5 Exhibit B.3: Sensitivity Tests for Reading Comprehension: Dropping Outermost Pair(s) (2005, 2006)....................................................................................................................................... B-7 Exhibit B.4: Sensitivity Tests for Instruction: Dropping Outermost Pair(s) (2005, 2006) ................ B-8 Exhibit B.5: Sensitivity Tests for Student Engagement with Print: Dropping Outermost Pair(s) (2005, 2006) ........................................................................................................................... B-9 Exhibit B.6: Sensitivity Test of Different Functional Forms of Rating Variable for Reading Comprehension (2005, 2006)........................................................................................................... B-10 Exhibit B.7: Sensitivity Test of Different Functional Forms of Rating Variable for Instruction (2005, 2006)..................................................................................................................................... B-11 Exhibit B.8: Sensitivity Test of Different Functional Forms of Rating Variable for Student Engagement with Print (2005, 2006) ............................................................................................... B-12 Exhibit B.9: Estimated Residual Differences in Baseline Characteristics of Schools in the Study Sample: Early Award Sites, 2002-2003................................................................................. B-13 Exhibit B.10: Estimated Residual Differences in Baseline Characteristics of Schools in the Study Sample: Late Award Sites, 2002-2003 .................................................................................. B-14 Exhibit B.11: Outcome Tiers for the Reading First Impact Analysis ............................................. B-17 Exhibit B.12: Summary of Impacts and Results of Composite Tests ............................................. B-18 Exhibit B.13: Estimated Impacts on Reading Comprehension, by Weighting Approach (2005, 2006)..................................................................................................................................... B-21 Exhibit B.14: Estimated Impacts on Instructional Outcomes, by Weighting Approach (2005, 2006)..................................................................................................................................... B-22 Exhibit B.15: Estimated Impacts on Student Engagement with Print, by Weighting Approach (2005, 2006) .................................................................................................................... B-23 Exhibit B.16: Minimal Detectable Effects for Full Sample Impact Estimates ............................... B-27 Exhibit C.1: Features of SAT 10: Reading/Listening Comprehension for Spring Administration .. C-2 Exhibit C.2: Student Assessment Data Collection: Sample Information........................................... C-4 Exhibit C.3: Examples of Instruction in the Five Dimensions of Reading Instruction..................... C-6

List of Exhibits v
Exhibit C.4: Instructional Practice in Reading Inventory (IPRI) ...................................................... C-9 Exhibit C.5: IPRI Data Collection: School, Classroom, and Observation Sample Information ..... C-14 Exhibit C.6: Composite of Classroom Constructs........................................................................... C-19 Exhibit C.7: Unconditional HLM Models to Estimate Pseudo-ICCs (ρ1 ) and True Variance Across Classrooms (ρ2).................................................................................................................... C-24 Exhibit C.8: Average Correlation Between Paired Observers’ Codes Across Classrooms............. C-25 Exhibit C.9: Main and Interaction Effects in a (r: c)*i Design........................................................ C-26 Exhibit C.10: Calculating Variance Components for a (r: c)*i Design........................................... C-28 Exhibit C.11: Generalizability Coefficients Estimated from the Co-Observation Data.................. C-29 Exhibit C.12: Student Time-on-Task and Engagement with Print (STEP) Instrument................... C-31 Exhibit C.13: Prototypical STEP Observation in One Classroom .................................................. C-36 Exhibit C.14: STEP Data Collection: School, Classroom and Observation Sample Information... C-37 Exhibit C.15: Percent Correct by Code and Overall for STEP Reliability Tape, Fall 2006............ C-39 Exhibit D.1: Estimated Impacts on Reading Comprehension: Spring 2005, Scaled Score..............D-1 Exhibit D.2: Estimated Impacts on Reading Comprehension: Spring 2005, Percent At or Above Grade Level ............................................................................................................................D-2 Exhibit D.3: Estimated Impacts on Reading Comprehension: Spring 2006, Scaled Score..............D-3 Exhibit D.4: Estimated Impacts on Reading Comprehension: Spring 2006, Percent At or Above Grade Level ............................................................................................................................D-4 Exhibit D.5: Estimated Impacts on Time Spent in Instruction in Five Dimensions of Reading Instruction: Spring 2005....................................................................................................................D-5 Exhibit D.6: Estimated Impacts on Instructional Outcomes: Spring 2005.......................................D-6 Exhibit D.7: Estimated Impacts on Time Spent in Instruction in Five Dimensions of Reading Instruction: Fall 2005 and Spring 2006 .............................................................................................D-7 Exhibit D.8: Estimated Impacts on Instructional Outcomes: Fall 2005 and Spring 2006................D-8 Exhibit D.9: Differences Across Study Years for Reading Comprehension and Instructional Outcomes: 2004-2005 to 2005-20061.................................................................................................D-9 Exhibit D.10: SAT 10 Reading Comprehension Means: Spring 2005 and Spring 2006.................D-11 Exhibit D.11: SAT 10 Reading Comprehension Means: Spring 2005 and Spring 2006.................D-12 Exhibit E.1: Confidence Intervals for Estimated Impacts on Reading Comprehension: Spring 2005 and 2006; Scaled Score.................................................................................................. E-1 Exhibit E.2: Confidence Intervals for Estimated Impacts on Reading Comprehension: Spring 2005 and 2006; Percent At or Above Grade Level................................................................. E-2 Exhibit E.3: Confidence Intervals for Estimated Impacts on Instructional Outcomes: Spring 2005, Fall 2005, and Spring 2006........................................................................................... E-3 Exhibit E.4: Confidence Intervals for Estimated Impacts on Time Spent in Instruction in the Five Dimensions: Spring 2005, Fall 2005, and Spring 2006.............................................................. E-4 Exhibit E.5: Confidence Intervals for Estimated Impacts on Student Engagement with Print: Fall 2005 and Spring 2006 ................................................................................................................. E-5

vi List of Exhibits
Exhibit F.1: Fixed Effect Impact Estimates for Instruction, by Site, by Grade .................................F-2 Exhibit F.2: Fixed Effect Impact Estimate for Student Engagement with Print, by Site, by Grade..............................................................................................................................................F-3 Exhibit G.1: Estimated Impacts on Reading Comprehension by Award Group: Spring 2005; Scaled Score....................................................................................................................................... G-2 Exhibit G.2: Award Group Differences in Estimated Impacts on Reading Comprehension: Spring 2005; Scaled Score ................................................................................................................. G-3 Exhibit G.3: Estimated Impacts on Reading Comprehension by Award Group: Spring 2005; Percent At or Above Grade Level...................................................................................................... G-4 Exhibit G.4: Award Group Differences in Estimated Impacts on Reading Comprehension: Spring 2005; Percent At or Above Grade Level ................................................................................ G-5 Exhibit G.5: Estimated Impacts on Reading Comprehension by Award Group: Spring 2006; Scaled Score....................................................................................................................................... G-6 Exhibit G.6: Award Group Differences in Estimated Impacts on Reading Comprehension: Spring 2006; Scaled Score ................................................................................................................. G-7 Exhibit G.7: Estimated Impacts on Reading Comprehension by Award Group: Spring 2006; Percent At or Above Grade Level...................................................................................................... G-8 Exhibit G.8: Award Group Differences in Estimated Impacts on Reading Comprehension: Spring 2006; Percent At or Above Grade Level ................................................................................ G-9 Exhibit G.9: Estimated Impacts on Instructional Outcomes by Award Group: Spring 2005 ......... G-10 Exhibit G.10: Award Group Differences in Estimated Impacts on Instructional Outcomes: Spring 2005...................................................................................................................................... G-11 Exhibit G.11: Estimated Impacts on Instructional Outcomes, by Award Group: Fall 2005 and Spring 2006...................................................................................................................................... G-12 Exhibit G.12: Award Group Differences in Estimated Impacts on Instructional Outcomes: Fall 2005 and Spring 2006............................................................................................................... G-13 Exhibit G.13: Award Group Differences in Estimated Impacts on Percentage of Students Engaged with Print: Fall 2005 and Spring 2006 .............................................................................. G-14 Exhibit G.14: Differences Across Years for Reading Comprehension, Reading Instruction, and Student Engagement with Print: Early Award Sites ................................................................. G-15 Exhibit G.15: Differences Across Years for Reading Comprehension, Reading Instruction, and Student Engagement with Print: Late Award Sites ................................................................... G-16 Exhibit H.1: Estimated Impacts on Reading Comprehension, by Award Status .............................. H-5 Exhibit H.2: Estimated Impacts on Reading Instruction, by Award Status ...................................... H-6 Exhibit H.3: Estimated Impacts on Percentage of Student Engagement with Print, by Award Status...................................................................................................................................... H-7 Exhibit H.4: Estimated Impacts on Reading Comprehension, by Fall 2004 Reading Performance of the non-Reading First Schools...................................................................................................... H-8 Exhibit H.5: Estimated Impacts on Reading Instruction, by Fall 2004 Reading Performance of the Non-Reading First Schools ......................................................................................................... H-9 Exhibit H.6: Estimated Impacts on Student Engagement with Print, by Fall 2004 Reading Performance of the Non-Reading First Schools............................................................................... H-10

List of Exhibits vii
Exhibit H.7: Estimated Impacts on Reading Comprehension, by Reading First Funds Per Student .......................................................................................................................................H-11 Exhibit H.8: Estimated Impacts on Reading Instruction, by Reading First Funds Per Student ......H-12 Exhibit H.9: Estimated Impacts on Percentage of Student Engagement with Print, by Reading First Funds Per Student ....................................................................................................................H-13 Exhibit H.10: Change in Impact Associated with One Unit of Change In Continuous Dimensions.......................................................................................................................................H-14

viii Interim Report: Executive Summary

Interim Report: Executive Summary ix
Executive Summary
This report presents preliminary findings from the Reading First Impact Study, a congressionally mandated evaluation of the federal government’s $1.0 billion-per-year initiative to help all children read at or above grade level by the end of third grade. The No Child Left Behind Act of 2001 (P.L. 107-110) established Reading First (Title I, Part B, Subpart 1) and mandated its evaluation. This evaluation is being conducted by Abt Associates and MDRC with RMC Research, Rosenblum-Brigham Associates, Westat, Computer Technology Services, DataStar, Field Marketing Incorporated, and Westover Consulting under the oversight of the U.S. Department of Education, Institute of Education Sciences (IES). The present report is the first of two; it examines the impact of Reading First funding in 2004-05 and 2005-06 in 17 school districts across 12 states and one statewide program (18 sites). The report examines program impacts on students’ reading comprehension and teachers’ use of scientifically based reading instruction. Key findings are that:
• On average, across the 18 participating sites, estimated impacts on student reading comprehension test scores were not statistically significant.
• On average, Reading First increased instructional time spent on the five essential components of reading instruction promoted by the program (phonemic awareness, phonics, vocabulary, fluency, and comprehension).
• Average impacts on reading comprehension and classroom instruction did not change systematically over time as sites gained experience with Reading First.
• Study sites that received their Reading First grants later in the federal funding process (between January and August 2004) experienced positive and statistically significant impacts both on the time first and second grade teachers spent on the five essential components of reading instruction and on first and second grade reading comprehension. Time spent on the five essential components was not assessed for third grade, and impacts on third grade reading comprehension were not statistically significant. In contrast, there were no statistically significant impacts on either time spent on the five components of reading instruction or on reading comprehension scores at any grade level among study sites that received their Reading First grants earlier in the federal funding process (between April and December 2003).
The study’s final report, which is due early 2009, will provide an additional year of follow-up data, and will examine whether the magnitude of impacts on the use of scientifically based reading instruction is associated with improvements in reading comprehension.

x Interim Report: Executive Summary
The Reading First Program
Reading First promotes instructional practices that have been validated by scientific research (No Child Left Behind Act, 2001). The legislation explicitly defines scientifically based reading research and outlines the specific activities state, district, and school grantees are to carry out based upon such research (No Child Left Behind Act, 2001). The Guidance for the Reading First Program provides further detail to states about the application of research-based approaches in reading (U.S. Department of Education, 2002). Reading First funding can be used for:
• Reading curricula and materials that focus on the five essential components of reading instruction as defined in the Reading First legislation: 1) phonemic awareness, 2) phonics, 3) vocabulary, 4) fluency, and 5) comprehension;
• Professional development and coaching for teachers on how to use scientifically based reading practices and how to work with struggling readers;
• Diagnosis and prevention of early reading difficulties through student screening, interventions for struggling readers, and monitoring of student progress.
Reading First grants were made to states between July 2002 and September 2003. By April 2007, states had awarded subgrants to 1,809 school districts, which had provided funds to 5,880 schools. Districts and schools with the greatest demonstrated need, in terms of student reading proficiency and poverty status, were intended to have the highest funding priority (U.S. Department of Education, 2002). In addition to grants for individual schools, states and districts could reserve up to 20 percent of their Reading First funds to support staff development and reading assessments, among other activities, for all high-need schools (U.S. Department of Education, 2002). The Reading First Impact Study
The Reading First Impact Study (RFIS) was commissioned to address the following questions: 1) What is the impact of Reading First on student reading achievement? 2) What is the impact of Reading First on classroom instruction? 3) What is the relationship between the degree of implementation of scientifically based reading
instruction and student reading achievement? The current report presents preliminary answers to the first two questions. The study’s final report will address all three questions. Research Design
The Reading First Impact Study employs a regression discontinuity design that capitalizes on the systematic process used by a number of school districts to allocate their Reading First funds. A regression discontinuity design is the strongest quasi-experimental method that exists for estimating program impacts. Under certain conditions, outlined below, all of which are met by the present study, this method can produce unbiased estimates of program impacts:

Interim Report: Executive Summary xi
1) Schools eligible for Reading First grants were rank-ordered for funding based on a quantitative rating, such as an indicator of past student reading performance or poverty.
2) A cut-point in the rank-ordered priority list separated schools that did or did not receive Reading First grants, and this cut-point was set without knowing which schools would then receive funding.
3) Funding decisions were based only on whether a school’s rating was above or below its local cut-point; nothing superseded these decisions.
4) The shape of the relationship between schools’ ratings and outcomes is correctly modeled. Under these conditions, there should be no systematic differences between eligible schools that did and did not receive Reading First grants (Reading First and non-Reading First schools respectively), except for the characteristics associated with the school rating used to determine the funding decision. By controlling for differences in schools’ ratings, one can then control statistically for all systematic pre-existing differences between the two groups. This makes it possible to estimate the impact of Reading First by comparing the outcomes for Reading First schools and non-Reading First schools in the study sample, controlling for differences in their ratings. Non-Reading First schools in a regression discontinuity analysis thereby play the same role as do control schools in a randomized experiment—they represent the best indications of what outcomes would have been for the treatment group (Reading First schools) in the absence of the program being evaluated. Study Sample
Twenty-eight school districts plus one state Reading First program that met the preceding criteria were identified. Sixteen districts plus the state program were chosen from this pool to participate in the regression discontinuity design; the final selection reflected wide variation in district characteristics and provided enough schools to meet the study’s sample size requirements. One other school district agreed to randomly assign some of its eligible schools to Reading First or a control group. The 17 school districts and one state Reading First program are referred to as study sites. The regression discontinuity sites provide 238 schools for the analysis and the randomized experimental site provides 10 schools. Half of these schools at each site are Reading First schools and half are non-Reading First schools; the study schools comprise some, not all, of the RF schools in study sites. Exhibit ES.1 compares background characteristics of Reading First schools in the study sample to those of all Reading First schools in the 18 study sites, all Reading First schools in the 13 study states, and all Reading First schools in the nation. Visual inspection of the data displayed in this exhibit suggests that, overall, the present sample is similar to the other three groups of Reading First schools. Almost all are eligible for Title I support, they enroll high percentages of students eligible for free or reduced price lunch, and their past third grade reading scores are near their state averages for Reading First schools. The RFIS sample, on average, has proportionally lower percentages of Hispanic students and higher percentages of Black students than Reading First schools in the study states or in the nation; at the same time, RFIS sample schools, on average, have a lower percentage of Black students and a higher percentage of White students than Reading First schools in study districts. A greater proportion of Reading First schools in the study sample are in large or mid-size cities, and not other locales, than are Reading First schools in the study states or in the nation. Also, the sizes of Reading First schools in the study sample, on average, are somewhat smaller than those in the three other groups. Further, these data cannot provide conclusive evidence that the study sample fully represents the experience of the entire national Reading First program, as the study sample might differ from the Reading First population in other ways that were not observed.

xii Interim Report: Executive Summary
Exhibit ES.1: Baseline Characteristics of Relevant Groups of Reading First Schools for 2002-2003
Characteristic
RF Schools in Study Sample
RF Schools in Study Districts
RF Schools in Study States
RF Schools in U.S.
Students Male (%) 52.3 52.0 51.7 51.5 Race (%)
Asian 3.1 2.5 1.5 3.5 Black 35.6 41.1 26.4 30.5 Hispanic 26.7 28.6 37.1 34.8 White 34.2 27.4 34.3 28.6 American Indian/Alaskan 0.5 0.4 0.6 2.5
Free Lunch and Reduced Lunch (%) 74.4 75.0 67.8 73.2 Schools Eligible for Title 1(%) 97.6 97.4 96.4 94.8 Locale (%)
Large City 39.2 39.8 26.7 26.8 Mid-size City 36.8 36.5 21.0 19.5 Othera 24.0 23.7 52.3 53.6
Size Total Number of Students 474.8 487.4 502.4 531.4 Number of Students in Grade 3 71.6 75.1 80.2 84.9 Student/Teacher Ratio 15.1 14.8 15.1 16.5 Third Grade Reading Performance Deviation from State RF Mean Proficiency Rate (%)b -1.3 -3.3 0.0 0.0 Number of Schoolsc 125 274 1,728 4,793
Notes: The RF study sample includes 128 schools from 18 sites (17 districts and 1 state) located in 13 states. The RF schools in Study Districts include all RF schools ranked and/or rated on the RF grant application for each of the 18 sites in the study. All RF schools in Study States include all RF schools in the 13 states included in the study. All RF schools nationally include all schools that received RF grants. a Other Locale includes urban fringe of a large city, urban fringe of a mid-sized city, large town, small town, and rural. b A school’s proficiency score is defined as the percentage of third grade students (or fourth or fifth grade when third grade is unavailable)
in the school that score at or above the state-defined proficiency threshold on the state’s reading assessment. The values in this row represent the average percentage point deviation from the mean proficiency score for the Reading First schools in the state. By definition, for a given state the mean proficiency score for all Reading First schools in the state is the benchmark for comparison. Therefore, in the final two columns, the deviation from the benchmark within each state is zero and the average deviation across states is zero.
c Due to missing values for some variables, the number of schools included varies by characteristic.
Sources: Baseline characteristic data are from the Common Core of Data. RF school samples are defined based on information from the Southwest Educational Development Laboratory.
Data Collection and Outcome Measures
Exhibit ES.2 summarizes the study’s three-year, multi-source data collection plan. The present report reflects data for 2004-05 and 2005-06. Key outcome measures include student reading comprehension, teacher reading instructional practices, and student engagement with print.

Interim Report: Executive Summary xiii
Exhibit ES.2: Data Collection Schedule for the Reading First Impact Study
2004-2005 2005-2006 2006-2007 Data Collection Elements Fall Spring Fall Spring Fall Spring Student Testing Classroom Observations Teacher, Principal, Reading Coach Surveys District Staff Interviews Student reading comprehension was assessed with the Stanford Achievement Test, 10th Edition (SAT 10, Harcourt Assessment, Inc., 2004). Its comprehension subtests are well documented, broadly accepted, and widely used.2 Test scores are analyzed in two forms: scaled scores and the percentage of students who read at or above grade level, based upon national SAT 10 norms. The SAT 10 was administered to students in grades one, two, and three during spring 2005 and spring 2006, with completion rates of 80 percent or higher for both waves. Classroom instruction was assessed in first grade and second grade reading classes through an observation system developed by the study team called the Instructional Practice in Reading Inventory (IPRI). Observations were conducted in each study school on two consecutive days in spring 2005, fall 2005, and spring 2006, with completion rates over 96 percent. Measures of classroom instruction were created from IPRI data to represent the components of reading instruction emphasized by the Reading First legislation:3
• Total daily minutes of instruction in all five dimensions: This measure equals the total number of minutes of instruction in phonemic awareness, phonics, vocabulary, fluency, and comprehension during the daily reading block, which is the time period designated for reading instruction.
• Minutes of instruction per day in each of the five dimensions: These five measures correspond to the number of minutes of instruction in each of the five dimensions per daily reading block.
• Percentage of three-minute observational intervals with instruction in the five dimensions that involve highly explicit instruction: This measure records instances of “highly explicit instruction” that occur during instruction in any of the five dimensions. Highly explicit instruction means active teaching, modeling or explaining concepts, or helping children use reading strategies.
2 In spring 2007, the study added the Test of Silent Word Reading Fluency (TOSWRF) for grade 1; findings
based on this test will be presented in the final report. 3 For ease of explication, the measures created from IPRI data are referred to as the five dimensions of
reading instruction (or “the five dimensions”) throughout the report. References to the programmatic emphases as required by legislation are labeled as the five essential components of reading instruction.
xiv Interim Report: Executive Summary
• Percentage of three-minute observational intervals with instruction in the five dimensions that involve high quality student practice: This measure records instances of “high quality student practice” that occur during instruction in any of the five dimensions. High quality student practice involves dimension-specific opportunities for students to practice their skills.
Student engagement with print was assessed beginning in fall 2005 through classroom observations using the Student Time-on-Task and Engagement with Print (STEP) instrument to measure the percentage of students engaged in academic work who are reading or writing print. The STEP, which was developed by the study team, was used to observe classrooms in both fall 2005 and spring 2006, with a completion rate of over 97 percent. Average Impacts Across All Sites
Exhibit ES.3 reports average impacts for school years 2004-05 and 2005-06.4 All impact estimates are regression-adjusted to control for a linear specification of the rating variable each site used to select its Reading First schools as well as selected teacher and/or student background characteristics used in the analysis. The impacts have been estimated using multi-level models to account for the clustering of students within classrooms, classrooms within schools, and schools within sites. In Exhibit ES.3, values in the "Actual Mean with Reading First" column are actual, unadjusted values for Reading First schools; values in the "Estimated Mean without Reading First" column represent the best estimates of what would have happened in Reading First schools absent Reading First funding and are calculated by subtracting the impact estimates from the Reading First schools' actual mean values. Impacts were estimated for each study site and averaged across sites in proportion to their number of Reading First schools in the sample. Average impacts thus represent the average study school. On average:
• Reading First did not improve students’ reading comprehension. The program did not increase the percentages of students in grades one, two, or three, whose reading comprehension scores were at or above grade level. In each of the three grades, fewer than half of the students in the Reading First schools were reading at or above grade level.
• Reading First increased total class time spent on the five essential components of reading instruction promoted by the program. The program increased average class time spent on the five essential components of reading instruction by 8.56 minutes per daily reading block in grade one, and by 12.09 minutes per daily reading block in grade two. This implies a weekly increase of three quarters of an hour for grade one and one hour for grade two.
• Reading First increased highly explicit instruction in grades one and two and increased high quality student practice in grade two. The program increased the percentage of class observational intervals spent on the five dimensions of reading instruction that involve highly explicit instruction by 3.65 percentage points in grade one and by 6.98 percentage points in grade two. The program also increased the percentage of class observational intervals spent on the five dimensions of reading instruction that involve high quality student practice by 3.67 percentage points in grade two. There was virtually no observed change in grade one.
4 Exhibit ES.3 and all other tables indicate whether findings are based on the full study sample or specific
subgroups. Where appropriate, each exhibit also includes an “Exhibit Reads” section that walks readers through the exhibit by highlighting the first row or line of information presented.

Interim Report: Executive Summary xv
Exhibit ES.3: Estimated Impacts on Reading Comprehension, Instruction, and Percentage of Students Engaged with Print: Spring 2005, Fall 2005, and Spring 2006
Actual Mean with
Reading First
Estimated Mean
without Reading
First Impact
Statistical Significance
of Impact (p-value)
Reading Comprehension Percent Reading At or Above Grade Level Grade 1 45.4 42.2 3.15 (0.260) Grade 2 38.9 38.8 0.12 (0.965) Grade 3 37.9 40.1 -2.22 (0.383) Instruction Number of minutes of instruction in the five
dimensions combined
Grade 1 59.41 50.85 8.56* (0.003) Grade 2 59.53 47.44 12.09* (<0.001)
Percentage of intervals in five dimensions with Highly Explicit Instruction
Grade 1 29.78 26.13 3.65* (0.023) Grade 2 31.55 24.57 6.98* (<0.001)
High Quality Student Practice Grade 1 19.21 18.35 0.86 (0.559) Grade 2 18.78 15.11 3.67* (0.012) Percentage of Students Engaged with Print Grade 1 46.92 42.29 4.63 (0.216) Grade 2 49.72 58.14 -8.42* (0.030) Notes:
The complete Reading First Impact Study (RFIS) sample includes 248 schools from 18 sites (17 school districts and 1 state) located in 13 states. 125 schools are Reading First schools and 123 are non-Reading First schools. For grade 2, one non-RF school could not be included in the analysis because test score data were not available.
Impact estimates are statistically adjusted (e.g., take each school's rating, site-specific funding cut-point, and other covariates into account) to reflect the regression discontinuity design of the study.
Values in the “Actual Mean with Reading First” column are actual, unadjusted values for Reading First schools; values in the “Estimated Mean without Reading First” column represent the best estimates of what would have happened in RF schools absent RF funding and are calculated by subtracting the impact estimates from the RF schools’ actual mean values. A two-tailed test of significance was used, and where applicable, statistically significant findings at the p≤.05 level are indicated by *.
EXHIBIT READS: The observed average percent of first-graders reading at or above grade level with Reading First was 45.4 percentage points. The estimated average percent without Reading First was 42.2 percentage points. The impact of Reading First on the percent of first grade students reading at or above grade level was 3.2 percentage points, which was not statistically significant at the p<.05 level (p=.260).
Sources: RFIS SAT 10 administration in the spring of 2005 and 2006, as well as from state/district education agencies in those sites that already used the SAT 10 for their standardized testing (i.e., FL, KS, MD, OR); RFIS Instructional Practice in Reading Inventory, spring 2005, fall 2005, and spring 2006; RFIS Student Time-on-Task and Engagement with Print, fall 2005 and spring 2006.
• Reading First had mixed effects on student engagement with print. The program reduced the percentage of students engaged with print by a statistically significant 8.42 percentage points in grade two. The impact on student engagement with print in grade one (4.63 percentage points) was not statistically significant.

xvi Interim Report: Executive Summary
Impact Differences
Study sites differ from each other in ways that could potentially influence the effectiveness of Reading First. For example, sites differ in terms of the length of time since date of Reading First grant award, levels of Reading First funding per student, and prior levels of reading performance. Consequently, average impacts for the full study sample might mask important differences that exist over time and/or across sites. The study explored this possibility by examining the pattern of impacts over time for two groups of study sites. The first group consists of the eight “late award” sites that received Reading First grants between January and August 2004. As of May 2006, these sites had been receiving Reading First funds for an average of approximately two years. The second group consists of the 10 “early award” sites that received Reading First grants between April and December 2003. As of May 2006, these sites had been receiving Reading First funds for an average of approximately three years, although data from the study are available only for the last two years. Study findings indicate that:
• The impacts of Reading First on classroom instruction and student reading comprehension have not changed consistently over time. Exhibit ES.4 shows estimated impacts for the two years that data are available for late award and early award sites, respectively. For both groups of sites, estimates of program impacts on reading comprehension and classroom instruction vary from year to year (across columns). However, this variation exhibits no consistent pattern and is not statistically significant. These findings do not suggest that program impacts increased or decreased with program maturity.
• The estimated impacts of Reading First were consistently positive for late award sites and mixed for early award sites. Exhibit ES.5 presents estimated impacts for the two groups of sites that are averaged over the two years for which data are available. It indicates that, for grades one and two in late award sites, Reading First produced positive and statistically significant increases both in teachers' instruction in the five dimensions and in students' reading comprehension. Impacts on third grade reading comprehension were not statistically significant for late award sites, though the direction of the (not significant) estimated impact was positive. None of the impact estimates presented in Exhibit ES.5 are statistically significant for early award sites. The (not significant) estimated impacts on teachers’ instruction were positive, and the (not significant) estimated impacts on student reading comprehension were negative. Differences in impacts on reading comprehension test scores between early and late award sites were statistically significant for grades two and three, and not statistically significant for grade one. Differences in impacts on instruction in the five dimensions between early and late award sites were not statistically significant.
• It is not possible to determine which of numerous differences between early award sites and late award sites may have caused observed differences in Reading First impacts, only some of which were statistically significant. The average per K-3 student Reading First funding was higher in late award sites than early award sites ($574 versus $432 per student). Although the study did not begin to collect data until after early award sites began to implement Reading First, it appears that the benchmarks of comparison for student reading comprehension were lower for late award sites. Thus, late award sites may have had more room to increase reading comprehension skills. Any or all of these differences, plus others not measured, could have produced the impact differences observed.

Interim Report: Executive Summary xvii
Exhibit ES.4: Estimated Impacts on Reading Comprehension and Minutes in the Five Dimensions, by Implementation Year, Calendar Year, and Award Status
Implementation Year Year 1 Year 2 Year 3 Impact (p-value) Impact (p-value) Impact (p-value)
Panel 1 Late Award Sites 2005 2006 2007 Grade 1 Percent reading at or above
grade level (%) 6.3 (0.077) 9.4* (0.024) N/A N/A
Instruction in five dimensions (minutes)
11.51* (0.001) 12.03* (0.004) N/A N/A
Grade 2 Percent reading at or above
grade level (%) 6.3* (0.028) 5.7 (0.155) N/A N/A
Instruction in five dimensions (minutes)
14.84* (<0.001) 16.11* (<0.001) N/A N/A
Grade 3 Percent reading at or above
grade level (%) 1.7 (0.537) 4.2 (0.269) N/A N/A
Instruction in five dimensions (minutes)
N/A N/A N/A N/A N/A N/A
Panel 2 Early Award Sites 2004 2005 2006 Grade 1 Percent reading at or above
grade level (%) N/A N/A -2.6 (0.708) -1.9 (0.751)
Instruction in five dimensions (minutes)
N/A N/A 5.49 (0.376) 4.16 (0.457)
Grade 2 Percent reading at or above
grade level (%) N/A N/A -8.2 (0.163) -6.8 (0.303)
Instruction in five dimensions (minutes)
N/A N/A 10.93 (0.083) 4.56 (0.410)
Grade 3 Percent reading at or above
grade level (%) N/A N/A -9.9 (0.110) -7.7 (0.225)
Instruction in five dimensions (minutes)
N/A N/A N/A N/A N/A N/A
Notes: The complete RF study sample includes 248 schools from 18 sites (17 school districts and 1 state) located in 13 states. 125 schools are Reading First schools and 123 are non-Reading First schools. For grade 2, one non-RF school could not be included in the analysis because test score data were not available. Implementation year represents the number of years since sites received notice of their Reading First grants. For early award sites, this occurred in 2003, and Years 1, 2, and 3 refer to the 2003-2004, 2004-2005, and 2005-2006 school years, respectively. For late award sites, notification of funding occurred in 2004, and Years 1 and 2 refer to the 2004-2005 and 2005-2006 school years, respectively (data are available for the 2004-2005 and 2005-2006 school years only). Impact estimates are statistically adjusted (e.g., take each school's rating, site-specific funding cut-point, and other covariates into account) to reflect the regression discontinuity design of the study. A two-tailed test of significance was used, and where applicable, statistically significant findings at the p≤.05 level are indicated by *. EXHIBIT READS: The impact of Reading First on the percent of students reading at or above grade level in grade one, for late award sites, in implementation Year 1 and Calendar Year 2005, was 6.3 percentage points, which was not statistically significant at the p≤.05 level (p=.077).
Sources: RFIS SAT 10 administration in the spring of 2005 and 2006, as well as from state/district education agencies in those sites that already use the SAT 10 for their standardized testing (i.e., FL, KS, MD, OR); and RFIS Instructional Practice in Reading Inventory, spring 2005, fall 2005, and spring 2006.

xviii Interim Report: Executive Summary
Exhibit ES.5: Estimated Impacts on Key Outcomes for Early and Late Award Sites, by Grade
Student Achievement
-2.34
7.55*
-10
0
10
20
30
40
Early Late
Perc
ent R
eadi
ng a
t or a
bove
Gra
deLe
vel
Time in 5 Dimensions
4.73
11.57*
0
4
8
12
16
Early Late
Num
ber o
f Min
utes
Student Achievement
-7.69
6.1*
-10
0
10
20
30
40
Early Late
Perc
ent R
eadi
ng a
t or a
bove
Gra
deLe
vel
Time in 5 Dimensions
7.49
15.63*
0
4
8
12
16
Early Late
Num
ber o
f Min
utes
Student Achievement
-9.04
2.97
-10
0
10
20
30
40
Early Late
Perc
ent R
eadi
ng a
t or a
bove
Gra
deLe
vel
Notes: The complete RF study sample includes 248 schools from 18 sites (17 school districts and 1 state) located in 13 states. 125 schools are Reading First schools and 123 are non-Reading First schools. There are 8 late award sites, with 137 schools, and 10 early award sites, with 111 schools. Impact estimates are statistically adjusted (e.g., take each school's rating, site-specific funding cut-point, and other covariates into account) to reflect the regression discontinuity design of the study. A two-tailed test of significance was used, and where applicable, statistically significant findings at the p≤.05 level are indicated by *.
EXHIBIT READS: For grade one, the impact of Reading First on the percent of students reading at or above grade level was 7.55 percentage points for late award sites, which was statistically significant (p≤.05). The corresponding impact for grade one in early award sites was –2.34 percentage points, which was not statistically significant. Sources: RFIS SAT 10 administration in the spring of 2005 and 2006, as well as from state/district education agencies in those sites that already use the SAT 10 for their standardized testing (i.e., FL, KS, MD, OR); and RFIS Instructional Practice in Reading Inventory, spring 2005, fall 2005, and spring 2006.
Grade 1
Grade 2
Grade 3

Interim Report: Executive Summary xix
Further Research
Data for the study’s final report will include three years of follow-up on students’ reading comprehension for grades one, two and three and three years of follow-up on teachers’ classroom instruction for grades one and two. These data will enable the study to examine program impacts on comprehension and instruction for an additional school year and on one year of follow-up on first grade students’ decoding skills. Finally, the study’s final report will explore whether the observed Reading First impacts on instructional practices are associated with observed impacts on student reading comprehension.

Interim Report: Study Overview 1
Chapter One: Study Overview
The No Child Left Behind Act of 2001 (NCLB) established the Reading First Program, a major federal initiative designed to help ensure that all children can read at or above grade level by the end of third grade. The RF legislation requires the U.S. Department of Education to contract with an outside entity to evaluate the impact of the Reading First Program. To meet this requirement, the Department contracted with Abt Associates in September 2003 to design and conduct the Reading First Impact Study (RFIS). The partner organizations included MDRC, RMC Research, Rosenblum-Brigham Associates, and Westat.5 The RFIS is a multi-year study that encompasses data collection over the course of three school years: 2004-05, 2005-06, and 2006-07.
This interim report presents major findings based on data collected during the 2004-05 and 2005-06 school years. This chapter begins with an overview of the Reading First Program, briefly describes the conceptual framework underlying the program and this evaluation as a whole, and then outlines the study’s guiding evaluation questions and data collection activities.
Overview of Reading First Program
The No Child Left Behind Act (P.L. 107-110), signed into law in January 2002, established the Reading First Program (Title I, Part B, Subpart 1). The Reading First legislation requires programs and instruction to be based on scientific research in reading, and aims to ensure that all children can read at or above grade level by the end of third grade, thereby significantly reducing the number of students who experience difficulties in later years. The overarching goal of Reading First is to improve students’ reading achievement. The program targets low-income, low-performing schools whose districts and states prepared articulated plans for increasing the use of teachers’ research-based instruction through intensive professional development for teachers, reading coaches, and administrators, with the explicit aim of reaching out to all eligible schools over time (No Child Left Behind Act, 2001).
To qualify for Reading First funding, state and district professional development plans must include training on reading instructional methods and materials that incorporate the five essential components of reading instruction (phonemic awareness, phonics, vocabulary development, reading fluency, and reading comprehension strategies), and on the use of assessments that effectively screen, diagnose, and monitor student progress in reading (No Child Left Behind Act, 2001).
The Reading First legislation outlines the general components and activities to be included in state and local plans, and the Reading First Guidance describes several strategies that states and local educational agencies should use to improve students’ reading skills (No Child Left Behind Act, 2001; U.S. Department of Education, 2002). First, the guidance specifies that curricula used in classrooms must reflect scientifically based reading research that includes the essential components of reading instruction, and further, that students should have sufficient opportunity to practice the development of their skills in these essential components. Second, it addresses teacher professional development on the implementation of scientifically based reading practices; states must offer comprehensive professional development on how teachers should work with academically struggling students, as
5 Other subcontractor organizations included: Computer Technology Services, Inc.; DataStar, Inc.; Field
Marketing Inc.; Paladin Pictures, Inc.; and Westover Consultants, Inc.

2 Interim Report: Study Overview
well as how teachers can implement research-based reading instruction. Third, state and local plans must include procedures for diagnosis and prevention of early reading difficulties through a) using valid, reliable measures to screen students; b) using empirically validated intensive interventions to help struggling students; and c) monitoring the progress of students experiencing difficulties to ensure that the early interventions are indeed effective. Reading First is an ambitious federal program, yet it is also a funding stream that combines local flexibility and national commonalities. The commonalities are reflected in the guidelines to states and districts and schools about allowable uses of resources. The flexibility is reflected in two ways: one, states (and districts) could allocate resources to various categories within target ranges rather than on a strictly formulaic basis. Two, states could make local decisions about the specific choices within given categories (e.g., which materials, reading programs, assessments, professional development providers, etc.). The activities, programs, and resources that were likely to be implemented across states and districts would therefore reflect both national priorities and local interpretations. All states received RF grants after their applications were subjected to an expert review process, and all states received funds for a six-year period. States then awarded sub-grants to local school districts and/or directly to schools based on a competitive process. As of April 2007, all states, territories, and the District of Columbia reported that over 5,880 sub-grants had been awarded to schools in over 1,809 school districts (Southwest Educational Development Laboratory, 2007). A Conceptual Framework for the Reading First Impact Study
To understand the implementation and desired effects of Reading First, the conceptual framework presented below identifies the program’s central goals and specifies the pathways through which its principles and components are hypothesized to improve reading instruction, and subsequently student reading achievement. The conceptual framework provides a substantive backdrop for the Reading First Impact Study. Exhibit 1.1 shows the pathways through which Reading First is hypothesized to influence reading achievement: (1) the Reading First legislation provides programmatic specifications and administrative guidelines; (2) Reading First funds flow to states, districts, and ultimately to eligible schools; (3) districts and schools design and implement research-based reading programs and provide school personnel with training on research-based instructional strategies; and (4) student reading achievement is enhanced. Each of these steps is influenced by contextual variables, especially state and district funding for other reading programs.6 The general focus of the Reading First Impact Study is on elements within the third and, ultimately, the fourth steps specified above (columns 3 and 4 in Exhibit 1.1). Each column is described below.
6 Schools and districts could have sought and obtained other (non-RF) funding to support reading-related
programs and instruction.

iatesnc.
Interim
Repo
rt:S
tud
yO
verview3
Exhibit 1.1: Conceptual Framework for the Reading First Program: From Legislation and Funding to Program Implementation and Impact
Legislative Specifications andAdministrative Guidelines
Flow of Funds toEligible Schools
Design andImplementation of Research-
Based Reading ProgramsEnhanced Student
Reading Achievement
• NCLB, Title I, Part B,Subpart I
• Specification of effectivereading programcomponents
• Rules for state grant anddistrict subgrant formulasand allocation
• Specification forallowable state anddistrict use of funds
• Administrative guidelinesfor state grant applicationand district subgrant
• Accountability andevaluation requirements
• Increased proportion ofstudents readingat/above grade level
• Adequate mastery offive essentialcomponents of earlyreading
• All students reading atgrade level by the endof third grade
Use of research-basedreading programs,instructional materials, andassessments, as articulatedin LEA/school applications
Teacher professionaldevelopment in use ofmaterials and instructionalapproaches
• Teacher use ofinstructional strategies andcontent based on fiveessential components ofreading instruction
• Use of assessments todiagnose student needsand measure progress
• Classroom organizationand supplemental servicesand materials that supportfive essential components
State and district policy context; existing reading programs; other resources and programs that may support reading
SEAs submit applications forReading First funds
Awarded funds to SEAs withapproved application
Eligible LEAs and/or schoolssubmit competitive subgrantproposal
SEAs and/or schools awardsubgrants to LEAs and/or schoolswith approved applications
Funds distributed to eligibleschools
Expert panel review
SEA review
Legislative Specifications andAdministrative Guidelines
Flow of Funds toEligible Schools
Design andImplementation of Research-
Based Reading ProgramsEnhanced Student
Reading Achievement
• NCLB, Title I, Part B,Subpart I
• Specification of effectivereading programcomponents
• Rules for state grant anddistrict subgrant formulasand allocation
• Specification forallowable state anddistrict use of funds
• Administrative guidelinesfor state grant applicationand district subgrant
• Accountability andevaluation requirements
• Increased proportion ofstudents readingat/above grade level
• Adequate mastery offive essentialcomponents of earlyreading
• All students reading atgrade level by the endof third grade
Use of research-basedreading programs,instructional materials, andassessments, as articulatedin LEA/school applications
Teacher professionaldevelopment in use ofmaterials and instructionalapproaches
• Teacher use ofinstructional strategies andcontent based on fiveessential components ofreading instruction
• Use of assessments todiagnose student needsand measure progress
• Classroom organizationand supplemental servicesand materials that supportfive essential components
State and district policy context; existing reading programs; other resources and programs that may support reading
SEAs submit applications forReading First funds
Awarded funds to SEAs withapproved application
Eligible LEAs and/or schoolssubmit competitive subgrantproposal
SEAs and/or schools awardsubgrants to LEAs and/or schoolswith approved applications
Funds distributed to eligibleschools
Expert panel reviewExpert panel review
SEA reviewSEA review

4 Interim Report: Study Overview
Legislative Specifications and Administrative Guidelines
The first column of Exhibit 1.1 shows Reading First’s major legislative specifications and administrative guidelines (No Child Left Behind Act, 2001). The Reading First legislation defines five essential components of reading instruction: (1) phonemic awareness; (2) phonics; (3) vocabulary development; (4) reading fluency, including oral reading skills; and (5) reading comprehension strategies (No Child Left Behind Act, 2001). The legislation also specifies state and district grant formulas, based primarily upon the proportion or number of children from low-income families who are reading below grade level in K–3, reflecting each district’s percentage of the state’s total Title I, Part A funds (No Child Left Behind Act, 2001). Sub-grants to eligible districts and schools must be of sufficient size and scope to enable full implementation of the selected research-based reading programs. Consequently, as indicated by states’ Reading First applications and subsequent subgrant announcements, states did not fund all eligible entities, in order to concentrate resources and maximize the quality of implementation.7 The Reading First legislation and guidance indicate that states must allocate at least 80 percent of their funding to school districts, with the remainder allocated to state-level activities, including: (1) teacher professional development (not more than 13 percent of the state grant); (2) technical assistance for districts and schools (not more than five percent of the state grant); and (3) planning, administration and reporting (not more than two percent of the state grant). It is important to note that the residual funds (up to 20 percent) were to be used by states to disseminate Reading First-like information and resources to all schools (including those not awarded RF grants), in order to broaden the potential reach of the program beyond the RF-funded districts and schools awarded sub-grants (No Child Left Behind Act, 2001).8 Local districts could spend up to 3.5 percent of their grants on administrative and technical assistance (U.S. Department of Education, 2002). The Flow of Reading First Funds
The second column of Exhibit 1.1 shows that RF funds flow from the federal government through the states to eligible districts and schools, as specified in the Reading First legislation (No Child Left Behind Act, 2001). First, the U.S. Department of Education convened expert panels to evaluate the State Education Agency (SEA) applications and make recommendations to the Department. Second, state departments of education scrutinized Local Education Agency (LEA) and/or school applications to determine which LEAs and/or schools were most likely to be able to meet the state’s goals and specifications for Reading First.9
7 For examples of state applications, see “Making Reading First in Michigan,” (Michigan Department of
Education, 2002, p. 64, 68) and “The State of Wisconsin Reading First Grant Proposal” (Wisconsin Department of Education, 2003, p. 47). For a list of award announcements, see “Reading First: Awards” (Southwest Educational Development Laboratory, 2007).
8 The study did not collect data on other funding sources districts or schools obtained to support reading instruction.
9 In some states, subgrants were made directly to schools (e.g., Hawaii, Kentucky).

Interim Report: Study Overview 5
Design and Implementation of Research-Based Reading Programs
The activities listed in the third column of Exhibit 1.1 represent short-term or mediating outcomes for the Reading First program as well as the hypothesized precursors to the longer-term outcomes identified in the fourth column. Implementing research-based reading programs includes the following: use of reading programs deemed effective through scientifically based reading research; aligned materials and assessments for diagnosing student needs and measuring progress; well-designed professional development activities that train teachers explicitly in the essential components of reading instruction; strategies for adapting these practices to the varying skill levels of their students; and appropriate use of materials and assessments that support the chosen reading program (No Child Left Behind Act, 2001). According to the Reading First guidelines, a well-implemented, high quality reading program sets high expectations for reading achievement and includes explicit strategies for monitoring student progress (U.S. Department of Education, 2002). Effective classroom reading instruction should also include differentiated small group instruction with flexible placement and movement based on ongoing assessment. Teachers should be using effective classroom management strategies to maximize time on reading-based tasks and activities. Most importantly, teachers and students should be continuously engaged in activities related to the five essential components of reading instruction. Enhanced Student Reading Achievement
The final column of Exhibit 1.1 identifies longer-term Reading First outcomes, all of which are focused on student reading achievement, including increased proportion of students reading at/above grade level in grades 1, 2, and 3; adequate mastery of the five essential components; and all students reading at or above grade level by the end of the third grade. The hypothesis underlying Reading First is that these outcomes will be achieved only through successful implementation of appropriate research-based reading programs, teacher professional development, use of diagnostic assessments, and appropriate classroom organization and provision of supplemental services. Reading First Impact Study Evaluation Questions
There are three major evaluation questions for the Reading First Impact Study: 1. What is the impact of Reading First on student reading achievement? 2. What is the impact of Reading First on classroom instruction? 3. What is the relationship between the degree of implementation of scientifically based
reading instruction and student reading achievement? The question about impact on student reading achievement focuses on the some of the elements represented in the final column of Exhibit 1.1. The Reading First Impact Study focuses primarily on student reading comprehension skills, by comparing student reading performance in Reading First schools to students’ reading performance that would have been observed without Reading First funding. Students in the study schools are assessed with the Stanford Achievement Test, reading comprehension subtest, 10th Edition (Harcourt Assessment, Inc., 2004). The question about impact on classroom instruction focuses primarily on the elements represented in the third box of the third column of Exhibit 1.1. Impacts on classroom instruction are assessed by

6 Interim Report: Study Overview
comparing characteristics of classroom instruction in Reading First schools to estimates of what those same characteristics of classroom instruction would have been had the schools not received Reading First funding. The third question, about relationships between implementation and students’ reading achievement, focuses on the connections between elements represented in the third and fourth columns of Exhibit 1.1. Results of analyses addressing these relationships will be presented in the final report. The evaluation design (described in more detail in Chapter 2) calls for three years of data collection. This report presents findings based upon two years of data collection. While there is no prior research on the amount of time necessary for schools to have fully implemented the Reading First program, prior research on implementation of programs designed to improve student achievement through changing teachers’ instructional practices suggests that while changes in instruction may be evident sooner, changes in student achievement can take several years to appear (e.g., Aladjem et al., 2006; Bloom, 2001; Borman et al., 2003). This holds particular salience for the Reading First program, which attempts to promote a comprehensive approach to reading instruction that persists from kindergarten through grade three. Some aspects of Reading First may be easy to implement quickly (i.e., purchase of new core reading programs and assessments, providing research-based professional development). Yet other aspects may require several years to implement effectively and consistently across the entire K-3 grade span (i.e., aligning curricula, instructional practices, and support services with the underlying principles of Reading First) to yield sustained improvement in student reading performance. Further, it will take four years of implementation before any students will have been able to experience Reading First funded activities as they progress from kindergarten through third grade. The next chapter presents a discussion of the study design, estimation methods, and sample.

Interim Report: Study Sample and Methods 7
Chapter Two: Study Design, Methods, and Sample
This chapter describes the study design and sample. It begins with a description of regression discontinuity design, a type of quasi-experimental study design that lends itself to a study of Reading First, in particular. The discussion of the regression discontinuity design (RDD) outlines the criteria that must be met to use this design, the requirements of sample size, and the outcome measures to be used, and it also presents a brief description of the estimation models and other key technical features of the analytic approach. The chapter then describes the study’s sample of schools. Study Design
Approach
The Reading First Impact Study is based on a regression discontinuity design that capitalizes on the systematic process used by a number of school districts to allocate their Reading First funds.10 A regression discontinuity design is the strongest quasi-experimental method that exists for estimating program impacts. Under certain conditions (which are met by the present study) this method can approach the rigor of a randomized experiment.11 The conditions include: 1) Eligible schools were rank-ordered for funding based on a quantitative rating, such as an indicator
of past student reading performance or poverty. 2) A cut-point in the rank-ordered priority list separated schools that did or did not receive Reading
First grants, and this cut-point was set without knowing which schools would then receive funding.
3) Funding decisions were based only on whether a school’s rating was above or below its local cut-point; nothing superseded these decisions.
4) The shape of the relationship between schools’ ratings and outcomes is correctly modeled. To see how the method works, consider a hypothetical school district that allocates its $2 million annual Reading First grant to 10 schools in equivalent allotments of $200,000, per year, per school. The district also has prioritized the schools with the highest rates of poverty, as measured by the percentage of students eligible for free or reduced priced meals. The district therefore awards grants first to the school with the highest poverty rate, then to the school with the next-highest poverty rate, and so on, until ten schools receive grants and all of the Reading First funding has been allocated. Exhibit 2.1 illustrates how the dividing line, or “cut-point,” between the last funded school and the first school not funded on the district’s priority list (or between the 10th and 11th schools on this
10 The Reading First Impact Study was originally planned as a randomized control study, in which eligible
schools from a sample of districts were to receive Reading First funds or become members of a non-Reading First control group. The approach was not feasible, however, in the 38 states that had already begun to allocate their Reading First grants before the study began. Furthermore, in the remaining states, randomization was counter to the spirit of the Reading First Program, which strongly emphasizes serving the schools most in need. It was possible, however, to randomize schools in one site.
11 Regression discontinuity analysis was introduced by Thistlethwaite and Campbell (1960) and has more recently experienced a resurgence of interest (e.g., Cappelleri et al., 1991; Goldberger, 1972; Hahn, Todd and Van Der Klaauw, 2001; Mohr, 1995; and Reichardt, Trochim, and Cappelleri, 1995).

8 Interim Report: Study Sample and Methods
hypothetical district’s list) creates a “discontinuity” that makes it possible to estimate program impacts on future outcomes. The vertical axis of the exhibit represents a future outcome measure for each school, such as its average student reading score in a subsequent year. The horizontal axis represents the rating used to determine each school’s priority for Reading First (in this example, the percentage of past students eligible for free or reduced price meals). Schools to the left of the cut-point do not receive Reading First funding and serve as a “comparison group” for the impact analysis; these schools are referred to as non-Reading First schools. Schools to the right of the cut-point receive Reading First funding; these schools represent the “treatment group” for the impact analysis, and are referred to as Reading First schools. The exhibit illustrates a downward-sloping relationship between schools’ ratings and their future outcomes. This implies that schools with a higher proportion of past (and thus future) students who live in poverty will tend to have lower levels of future student achievement. In the absence of Reading First, average student achievement at non-Reading First schools would therefore tend to be higher than at Reading First schools. Consequently, the average outcome for non-Reading First schools most likely over-states what this average would have been for Reading First schools without the program (their “counterfactual”). Because of this, a simple comparison of average outcomes for Reading First schools and non-Reading First schools would understate the impact of Reading First. Given the way that schools were selected for Reading First, however, it is possible to obtain unbiased estimates of the program’s impacts on future outcomes by controlling statistically for the relationships that exist between school outcomes and ratings. (These relationships comprise the “regression” part of regression discontinuity analysis.) Intuitively, this analysis would proceed as follows. The first step is to fit a regression line through the data points for non-Reading First schools, as indicated by the solid line to the left of the cut-point in Exhibit 2.1. The second step is to extrapolate the fitted line across the cut-point to predict what student achievement would have been for Reading First schools—in the absence of the program. This is indicated by the dashed line in the exhibit. The third step is to fit a regression line through the data points for Reading First schools, as indicated by the solid line to the right of the cut-point. (For the purpose of this hypothetical example, the two fitted lines are assumed to have the same slope and are thus parallel, which simplifies the analysis but is not necessary.) The impact of Reading First thus can be measured by the vertical distance between the solid fitted line for Reading First schools (what actually happened in Reading First schools after the program was launched) and the dashed extrapolated line for Reading First schools (the counterfactual prediction of what would have happened in Reading First schools without the program). This distance is indicated by a two-sided arrow. In short, the analysis uses the observable discontinuity in the regression relationship to identify the impact of Reading First. The magnitude of the discontinuity indicates the magnitude of the impact. If the regression model has the correct shape for the data being modeled (for example, two parallel straight lines for Reading First and non-Reading First schools), the discontinuity provides an unbiased impact estimate.

Interim Report: Study Sample and Methods 9
Exhibit 2.1: Regression Discontinuity Analysis for a Hypothetical School District
The approach works properly, if schools’ ratings are the only thing that determines their selection for Reading First. Consequently, only background characteristics that are correlated with ratings can be correlated with selection for the program. In other words, the only characteristics that can differ systematically between Reading First schools and non-Reading First schools are those correlated with their ratings. Controlling statistically for the ratings thereby controls for any systematic pre-existing differences between the two groups of schools.12 It is this control that makes unbiased impact estimates possible, yet it (regression discontinuity design) requires a much larger sample size than a randomized control trial to provide the same precision, because one must include the rating variable in any models to account for the design effect (Bloom, Kemple and Gamse, 2004). Seventeen of the 18 sites in the Reading First Impact Study (16 school districts and one state program) allocated their Reading First grants in ways that meet the requirements of a regression discontinuity design (see Appendix B for a more detailed discussion). Each site prioritized its eligible schools according to a specified quantitative indicator, in most cases, an indicator based on a measure of student poverty, student performance, or both.13 Each site then allocated its Reading First funds according to the prioritized list, funding the top priority school first, the second priority school next, and so on through the list, until all available resources were allocated. In the context of this study, these sites are referred to as regression discontinuity design (RDD) sites. As explained later in this chapter in the section entitled “The Study Sample”, the study sample was drawn from Reading First schools and non-Reading First schools whose ratings were as close as possible to their sites’ local cut-point. Half of the schools in the study sample are Reading First 12 It is because regression discontinuity analysis utilizes “selection on observables” (i.e., values of the rating)
that it can produce unbiased impact estimates (Cain, 1975). This feature is what distinguishes the approach from other quasi-experimental designs.
13 Exhibit 2.5 reports the criteria used by each site to rate its schools for Reading First. A separate rating coefficient (in the impact estimation model) was specified for each site to account for differences in rating variables and cut-points. These differences enhance the generalizability of the present study because it comprises 17 regression discontinuity analyses from different parts of the United States.

10 Interim Report: Study Sample and Methods
schools and half are non-Reading First schools.14 Only 9 of the 248 sample schools from study sites had their rating-based Reading First funding status changed. Consequently, the study’s sites support what is called a “sharp” regression discontinuity analysis, which is the strongest form of the design.15 In the 18th study site (a school district), it was possible to randomly assign a subset of its Reading First-eligible schools to receive or not receive Reading First funds. In this site, five candidate schools were assigned to Reading First and five were assigned to a control group. Hence, this site provides a group-randomized experiment. This site is referred to as the experimental site. Measures
The Reading First Impact Study focuses on three categories of outcome measures: student reading comprehension, classroom reading instruction, and student engagement with print during reading instruction. These three categories represent the outcome domains for the study. The outcome for student reading comprehension is represented by scores on the Stanford Achievement Test, 10th Edition (Harcourt Assessment, Inc., 2004). Classroom reading instruction and student engagement with print were measured through classroom observations made by trained observers. The outcome measures for instruction are represented by amount of instructional time on the five essential components of reading instruction, and the outcome for student engagement with print is the average percentage of students engaged with print during the reading block. Chapter Three describes what these measures mean and how they were obtained. Estimation
For each measure from the preceding outcome domains, an extension of the statistical model in Equation 1 was used to estimate the impacts of Reading First in the 17 RDD sites.16 This equation is referred to as a linear regression discontinuity model. kkkk RTY μβββ +++= 210 (1)
where: Yk = the outcome measure for school k, Tk = one if school k is a Reading First school and zero otherwise, Rk = the value of the rating for school k, μk = a random error for school k that is assumed to be independently and identically
distributed.
14 These proportions were exact for the original study sample of 258 schools. With the subsequent loss of 10
schools, they remain almost exact. 15 A sharp regression discontinuity analysis has very few cases where assignment to treatment or comparison
status based on ratings is changed due to other considerations. A “fuzzy” regression discontinuity design has more such aberrant cases. A fuzzy regression discontinuity analysis is more complex and requires further assumptions (Shadish, Cook and Campbell, 2002).
16 Full statistical models for estimating impacts on all study outcomes for all 17 RDD sites are presented in Appendix B. The models include an indicator for the site where schools were randomized (for which impacts were estimated using a standard regression-adjusted difference of mean outcomes for the treatment group and control group).

Interim Report: Study Sample and Methods 11
The coefficient, Β2, for the rating, Rk, represents the slope of the two fitted regression lines in Exhibit 2.1. This summarizes the continuous relationship between outcomes and ratings that exists on either side of the cut-point. As noted, controlling for this relationship controls for all systematic pre-existing differences between Reading First schools and non-Reading First schools. The coefficient, Β1, for the treatment indicator, Tk, represents the discontinuity in the regression line produced by Reading First. The estimated value of Β1 therefore provides an estimate of the impact of Reading First. The Reading First Impact Study is composed of separate regression discontinuity designs for each of the 17 RDD sites, plus a group-randomized experiment for the experimental site; as a result, the impact estimates presented are averaged across the study’s 18 sites. The average is weighted in proportion to the number of Reading First schools in the study sample from each site. Findings presented in this report therefore represent average impacts for the average Reading First school in the sample. To increase the precision of impact estimates a limited number of covariates (student background characteristics, teacher background characteristics, and/or school baseline test scores) were added to the estimation model. In addition, because students are clustered within classrooms, and classrooms are clustered within schools, multi-level models were used to estimate impacts on student outcomes. Appendix B describes the statistical models used to estimate impacts for outcomes in each of the study’s three domains. Specification Tests As noted earlier, in developing the study sample, Reading First schools and non-Reading First schools were selected to be as close as possible to their local cut-points for receipt of Reading First funding. This was done to yield two groups of schools that were as similar as possible.17 In addition, program impacts were estimated using a linear regression discontinuity model that controls for values of the ratings used to choose schools for program funding. Furthermore, as discussed earlier, estimates of impacts on measures of student reading comprehension control explicitly for school-level baseline measures of reading achievement. This combination of sample design and statistical analysis was expected to provide internally valid estimates of program impacts. Three sets of specification tests were conducted to assess whether this expectation was met.18 Although none of these tests by itself can prove that internal validity was achieved, in combination they provide evidence that this is most likely the case. The most important such test used a linear regression discontinuity model (as represented in Equation 1) to compare baseline characteristics of Reading First schools and non-Reading First schools. If a linear regression discontinuity model is an appropriate way to control for all pre-existing differences between the two groups, observable or not, then it should eliminate their observed baseline differences.
17 See Appendix B, Part 2, Exhibit B.1 for unadjusted baseline characteristics of schools in the study sample. 18 See Appendix B for a detailed presentation of the specification tests conducted to assess the study’s internal
validity.

12 Interim Report: Study Sample and Methods
Results of the baseline specification tests are presented in Exhibit 2.2. These findings were obtained using aggregate school-level baseline characteristics.19 The first column presents adjusted residual differences between Reading First schools and non-Reading First schools for the selected baseline characteristics. The second column presents p-values for each of these residual differences. None of the residual differences in the exhibit are statistically significant. Hence, there is little evidence of residual differences in these school-level baseline characteristics. Results shown in the exhibit do not provide statistical evidence of substantial bias in impact estimates for the present report. Also, because impact estimates for student reading comprehension control explicitly for observed differences in school-level mean baseline test scores (typically the strongest predictor of future test scores), they provide further protection against bias. Statistical Significance Two-tailed t-tests are used to assess the statistical significance of impact estimates, and an asterisk (*) denotes statistically significant estimates at the conventional 0.05 probability level. The 0.05 standard for statistical significance implies that if a true impact is zero, there is only a one-in-twenty chance that its estimate will be statistically significant. Statistical significance does not represent the size, meaning, or importance of an impact estimate. It only indicates the probability that it occurred by chance. For example, a statistically significant impact estimate is not necessarily policy relevant; it is large enough that it is likely not due entirely to chance. This could occur for a small impact estimate from a large sample, for which the actual size of the estimated impact might not be deemed substantively meaningful, even though it was statistically significant. Lack of statistical significance for an impact estimate does not mean that the impact being estimated equals zero, only that that estimate cannot be distinguished from zero reliably. This could occur for a large impact estimate from a small sample, for which the actual size of the estimated impact might be substantively meaningful, although there is uncertainty about the estimate. The Reading First Impact Study focuses on several different outcomes and subgroups, and therefore estimates numerous impacts. Each individual estimate has only a 5 percent chance of falsely indicating an impact’s statistical significance when there is no impact. However, the group of estimates together has a much greater chance of falsely indicating that some impacts are statistically significant, even if none are.
19 Baseline data were available at the school level only.

Interim Report: Study Sample and Methods 13
Exhibit 2.2: Estimated Residual Differences in Baseline Characteristics of Schools in the Study Sample: 2002-2003
Characteristic Estimated Residual
Difference
Statistical Significance of
Difference (p-value)
Students Male (%) 0.9 (0.246) Race (%)
Asian 0.9 (0.363) Black -7.2 (0.199) Hispanic 3.3 (0.345) White 2.8 (0.503) American Indian/Alaskan 0.2 (0.182)
Free Lunch and Reduced Lunch (%) -6.0 (0.073) Schools Eligible for Title I (%) -1.4 (0.802) Locale (%)
Large City 4.3 (0.419) Mid-size City 9.1 (0.108) Othera -13.4 (0.083)
Size Total Number of Students -0.9 (0.982) Number of Students in Grade 3 -3.8 (0.558) Student/Teacher Ratio 0.1 (0.861) Third Grade Reading Performance Deviation from State RF Mean Proficiency Rate (%)b 4.3 (0.085) Notes:
The complete RF study sample includes 248 schools from 18 sites (17 districts and 1 state) located in 13 states. 125 schools are Reading First schools and 123 are non-Reading First schools. The “Estimated Residual Difference” is the adjusted residual differences between Reading First schools and non-Reading First schools estimated using the regression discontinuity model, which controls for each school’s rating. A two-tailed test of significance was used, and where applicable, statistically significant findings at the p≤.05 level are indicated by *. a Other Locale includes urban fringe of a large city, urban fringe of a mid-sized city, large town, small town, and rural. b A school’s proficiency score is defined as the percentage of third grade students (or fourth or fifth grade when third grade is unavailable) in
the school that score at or above the state-defined proficiency threshold on the state’s reading assessment. The values in this row represent the average percentage point deviation from the mean proficiency score for the Reading First schools in the state.
EXHIBIT READS: The estimated residual difference on the percent of male students between Reading First and non-Reading First schools was 0.9 percentage points. The difference was not statistically significant at the p≤.05 level (p=.246).
Sources: Data on baseline characteristics are from the Common Core of Data.
Given the study’s broad research questions, the number of impacts estimated was limited to the minimum possible to reduce the problem of “multiple hypotheses testing.”20 As a further safeguard, composite hypothesis tests were used to assess the overall statistical significance for groups of impact estimates within outcome domains. These composite tests measure the statistical significance of impact estimates that are pooled across outcome measures, subgroups, or both. A statistically significant composite test would suggest that some of its components are statistically significant. If the composite test is not statistically significant, the statistically significant findings for its
20 Researchers disagree about whether and how to account for multiple hypothesis testing (e.g., Gelman and
Stern, 2006; Shaffer, 1995).

14 Interim Report: Study Sample and Methods
components might be due to chance. The composite tests therefore help to “qualify” or call into question statements that are based on individual findings.21 Statistical Precision The statistical precision of an impact estimator reflects its ability to detect true intervention effects when they exist. A common way to represent precision is a minimum detectable effect (MDE), which is the smallest true effect that an estimator has a “good chance” of detecting (Bloom, 1995). The current analysis uses the standard convention of defining a minimum detectable effect as the smallest true impact that has an 80 percent chance of being found to be statistically significant (it has 80 percent statistical power) at the 0.05 level of statistical significance for a two-tailed test of the null hypothesis of no effect. When a minimum detectable effect is expressed as a standardized effect size (in standard deviation units), it is referred to as a minimum detectable effect size (MDES). Exhibit 2.3 reports minimum detectable effects and effect sizes for estimates of program impacts on the two most central study outcomes for the full study sample (e.g., student reading comprehension and amount of time on instruction in the five dimensions of reading instruction). These findings are based on data from the two follow-up years for which information is now available, rather than the initial assumptions that guided the study design. As such, they represent the actual precision of the design. The top panel in Exhibit 2.3 presents MDEs for the study’s two measures of student achievement, average scores in reading comprehension on the SAT 10 and percent at or above grade level, while the bottom panel presents information on the study’s primary measure of classroom instruction, average time per daily reading block spent on the five essential components of reading instruction (phonemic awareness, phonics, fluency, vocabulary, and comprehension). Columns in the table provide findings for each grade. Minimum detectable effects for reading comprehension range from about 6 to 8 scaled-score points, corresponding to standardized effect sizes of roughly 0.15 to 0.16 standard deviations, even smaller than the 0.20 standard deviations that the study was initially designed to detect.22 The minimum detectable effect is about 7 to 8 percentage points with respect to the percentage of students who read at or above grade level. The minimum detectable effect for “time in the five dimensions” is about 8 minutes, or roughly 0.38 standard deviations when expressed as an effect size. Because the study conducted some analyses at the subgroup level, MDEs were also calculated for a subgroup comprising about half of the schools in the sample for which a minimum detectable effect equals about 2 or 1.4 times the minimum detectable effect for the full sample.23
21 See Appendix B for a detailed discussion of the study’s approach to multiple hypothesis testing. 22 See Gamse et al. (2004). 23 See Appendix B, Exhibit B.16, for a table of MDEs for the study’s key outcome measures by grade.

Interim Report: Study Sample and Methods 15
Exhibit 2.3: Minimal Detectable Effects for Full Sample Impact Estimates
Grade Level Grade 1 Grade 2 Grade 3
Panel 1
Student Reading Comprehension Mean Scaled Score 8.04 6.75 6.08 Effect Size 0.16 0.16 0.15 Percent at or above grade level 7.81 7.28 7.11
Panel 2
Instructional Outcomes Instruction in the five dimensions combined Minutes 7.87 7.98 N/A Effect Size 0.38 0.38 N/A
Notes: The complete RF study sample includes 248 schools from 18 sites (17 school districts and 1 state) located in 13 states. 125 schools are Reading First schools and 123 are non-Reading First schools. For grade 2, one non-RF school could not be included in the analysis because test score data were not available. Minimal detectable effects are based on the standard errors and standard deviations of the impact estimates for the full sample pooled across two school years of follow-up. Impact estimates are statistically adjusted (e.g., take each school's rating, site-specific funding cut-point, and other covariates into account) to reflect the regression discontinuity design of the study.
EXHIBIT READS: The minimal detectable effect of the Reading First program on reading comprehension for a mean scaled score in grade 1 is 8.04 scaled score points. The minimal detectable effect of the Reading First program on reading comprehension for a mean scaled score in grade 2 is 6.75 scaled score points. The minimal detectable effect of the Reading First program on reading comprehension for a mean scaled score in grade 3 is 6.08 scaled score points.
Sources: RFIS SAT 10 administration in the spring of 2005 and 2006, as well as from state/district education agencies in those sites that already use the SAT 10 for their standardized testing (i.e., FL, KS, MD, OR); and RFIS Instructional Practice in Reading Inventory, spring 2005, fall 2005, and spring 2006.
The Study Sample
The initial sample for the Reading First Impact Study contained 258 schools (half in the Reading First program and half in a comparison group) from 17 school districts plus a statewide program. For reasons discussed below, 10 schools dropped out of the study. The 18 study sites are located in 13 states, which received their Reading First grants over a 16-month period, from June 2002 to September 2003. Sites received their sub-grants between April 2003 and August 2004 (Appendix A provides information on award dates by site). The following criteria determined sites’ eligibility for a regression discontinuity analysis of the impacts of Reading First:
• Sites used quantifiable criteria to rate schools eligible for RF funds and had at least three more schools than could be funded, thereby providing a minimum of three comparison schools. Any quantifiable criteria could be used to rate schools.
• Sites’ decisions about school ratings and the determination of their local funding cut-points were made independently of one another.

16 Interim Report: Study Sample and Methods
• Sites’ funding decisions about schools were based only on their ratings and their site’s cut-point. These decisions were not overridden by other considerations.
Exhibit 2.4 indicates that 29 sites met the above criteria. From this pool of 29 candidate sites, a final sample of 18 sites was chosen. The final site selection attempted to balance such factors as: geographic diversity, inclusion of both larger and moderate-size districts (small districts would not contribute adequately to overall sample size), and a desire to avoid districts that were participating in other major evaluation studies. As noted previously, the study team selected 17 regression discontinuity sites and one additional site agreed to conduct a group-randomized experiment. Once sites were identified, local schools were chosen as follows:
• From each site, a sample of schools located as close as possible to just above and just below the local cut-point were selected. This was done to minimize pre-existing differences among schools. Half of the schools chosen were Reading First schools and half were non-Reading First schools.
• Reading First and non-Reading First schools from a given site were chosen to have as similar a range of ratings as possible above and below the local cut-point. This was done in order to avoid asymmetries between the treatment group and comparison group. In addition, schools were chosen to avoid large gaps in the rating distribution, which could mask non-linearities.
Information about the ratings, cut-points, and numbers of schools rated and funded from each of the 17 RDD sites is presented in Exhibit 2.5.24 Ratings were based mainly on measures of student reading performance (standardized test scores) and/or poverty (eligibility for free or reduced price lunch) (Gamse et al., 2004). In two sites, eligible schools submitted proposals for funding that were rated according to locally determined criteria. The criteria that sites used to rate and fund Reading First schools reflect Reading First programmatic emphases, i.e., to serve the lowest performing and/or the neediest schools.25 The exhibit’s first column indicates, for each site, which criteria were used. The second column presents the number of schools that were rated, and, in parentheses, funded. The cut-point score for each site is presented in the box in the center of each shaded bar. The numbers in the shaded bars represent the numbers of RF and non-RF schools for each site (non-RF in the left, RF in the right side of each shaded bar). The numbers to the far left of each shaded bar represent the lowest rating for all non-funded (i.e., non-Reading First) schools, and then the rating for the lowest-rated school in the study sample. The numbers to the far right of each shaded bar represent the highest rating for all funded schools, and the highest rating for funded schools in the study sample is immediately to the right of each shaded bar. The 248 schools in the initial sample represent about 37 percent of all rated schools in the 17 RDD sites. (This number does not include the 10 schools in the experimental site.) The 129 Reading First
24 Exhibit 2.5 does not include the one site that agreed to random assignment for its 10 RFIS schools. 25 The site that agreed to random assignment to RF or non-RF status also determined its schools’ eligibility on
the basis of prior student achievement and poverty. In that site, 12 of 17 eligible schools were funded; 5 schools were funded via random assignment, and 7 schools were selected by the site.

Interim Report: Study Sample and Methods 17
Exhibit 2.4: RFIS Sample Selection: From Regression Discontinuity Design Target Sample to Analytic Sample
Sites with sufficient numbers of schools—both large (>8 RF schools) and medium-sized
(3-7 RF schools)N = 250+ Sites
Sites used quantifiable rating or ranking system toprioritize schools for funding
N = 29 Sites
Sites’ ratings independently verified bythe RFIS TeamN = 29 Sites
Site participation securedN = 18 Sites
When RDD recruitment began (5/04): 4250 RF schools in 50 states ~1100 districts
Sites with sufficient numbers of schools—both large (>8 RF schools) and medium-sized
(3-7 RF schools)N = 250+ Sites
Sites with sufficient numbers of schools—both large (>8 RF schools) and medium-sized
(3-7 RF schools)N = 250+ Sites
Sites used quantifiable rating or ranking system toprioritize schools for funding
N = 29 Sites
Sites used quantifiable rating or ranking system toprioritize schools for funding
N = 29 Sites
Sites’ ratings independently verified bythe RFIS TeamN = 29 Sites
Sites’ ratings independently verified bythe RFIS TeamN = 29 Sites
Site participation securedN = 18 Sites
Site participation securedN = 18 Sites
When RDD recruitment began (5/04): 4250 RF schools in 50 states ~1100 districts
No Shows(n = 5)
4 in 2004–051 in 2005–06
Crossovers(n = 4)
1 in 2004–053 in 2006–07
Removed (n = 4)
Refusals, school closings, reconfiguring, or redistricting
Removed (n = 6)
Refusals, school closings, reconfiguring, or redistricting
RF Non-RF
Initial Sample (n = 258)
258 schools = 18 SitesRF
(n = 129)Non-RF(n = 129)
Final Analytic Sample (n = 248)
RF(n = 125)
Non-RF(n = 123)
*The final analytic sample includes 146 schools from 7 sites that have 8 or more RF schools (74 RF, 72 non-RF schools) and 102 schools from 6 sites that have between 3 and 7 RF schools (51 RF, 51 non-RF schools).

18 Interim Report: Study Sample and Methods
Exhibit 2.5: Numbers, Ratings, and Cut-points for Selection of Reading First and Reading First Impact Study Schools, by Site (Initial Sample for 17 Sites, Excluding Random Assignment Site)
No. of Schools Rated (Funded)
1612840481216
144.9 16 16
30.512 12
70.211 11
8811 11
10 10
52.58 8
136.57 7
8 8
96.97 7
866 6
67.16 6
505 5
4.54 4
4.54 4
20.93 3
85.53 3
33.0 …136.7
25.3 … 25.3
36.4 … 57.9
51.0 … 88.0
1.0 … 14.0
90.0 … 58.0
100.0 … 95.0
46.0 … 92.0
85.7 … 93.5
100.0 … 92.0
38.5 … 62.2
40.5 … 40.5
8.0 … 8.0
8.0 … 8.0
14.3 … 14.3
100.0 … 90.0
148.3 … 184.3
37.3 … 48.1
79.7… 97.1
136 … 174.0
22.0 … 29.0
32.0 … 23.0
78.0 … 64.0
153.0 … 177.0
99.7 … 99.7
79.0 … 69.0
75.2 … 95.4
59.5 … 67.4
1.0 … 1.0
1.0 … 1.0
28.0 … 35.6
84 … 67.0
Site 8 1 199 (74)
Site 3 2 31 (16)
Site 7 2 44 (15)
Site 14 1,2 43 (23)
Site 5 2,4 58 (23)
Site 2 2 56 (11)
Site 10 2 34 (16)
Site 9 2 30 (12)
Site 13 2 24 (7)
Site 11 2 19 (12)
Site 16 2 40 (24)
Site 4 2 11 (6)
Site 15 3 8 (4)
Site 12 2 7 (4)
Site 17 2 23 (14)
Site 6 3 8 (4)
Site Cut-pointNumber of Sample Schools Not Funded Number of Sample Schools Funded
144.5 3 3215.0 … 151.0 125.0 … 101.0Site 18 2,4 21 (6)
1 Ratings based upon proposals2 Ratings based on student achievement
and/or poverty3 Rankings based on student achievement
and/or poverty4 Other
Number of Schools
18
86
No. of Schools Rated (Funded)
1612840481216 1612840481216
144.9 16 16
30.512 12
70.211 11
8811 11
10 10
52.58 8
136.57 7
8 8
96.97 7
866 6
67.16 6
505 5
4.54 4
4.54 4
20.93 3
85.53 3
33.0 …136.7
25.3 … 25.3
36.4 … 57.9
51.0 … 88.0
1.0 … 14.0
90.0 … 58.0
100.0 … 95.0
46.0 … 92.0
85.7 … 93.5
100.0 … 92.0
38.5 … 62.2
40.5 … 40.5
8.0 … 8.0
8.0 … 8.0
14.3 … 14.3
100.0 … 90.0
148.3 … 184.3
37.3 … 48.1
79.7… 97.1
136 … 174.0
22.0 … 29.0
32.0 … 23.0
78.0 … 64.0
153.0 … 177.0
99.7 … 99.7
79.0 … 69.0
75.2 … 95.4
59.5 … 67.4
1.0 … 1.0
1.0 … 1.0
28.0 … 35.6
84 … 67.0
Site 8 1 199 (74)
Site 3 2 31 (16)
Site 7 2 44 (15)
Site 14 1,2 43 (23)
Site 5 2,4 58 (23)
Site 2 2 56 (11)
Site 10 2 34 (16)
Site 9 2 30 (12)
Site 13 2 24 (7)
Site 11 2 19 (12)
Site 16 2 40 (24)
Site 4 2 11 (6)
Site 15 3 8 (4)
Site 12 2 7 (4)
Site 17 2 23 (14)
Site 6 3 8 (4)
Site Cut-pointNumber of Sample Schools Not Funded Number of Sample Schools Funded
144.5 3 3215.0 … 151.0 125.0 … 101.0Site 18 2,4 21 (6)
1 Ratings based upon proposals2 Ratings based on student achievement
and/or poverty3 Rankings based on student achievement
and/or poverty4 Other
Number of Schools
18
86
Notes: Ratings varied in directionality and metrics; in some sites, higher scores indicated greater needs; in other sites, lower scores indicated greater needs.
EXHIBIT READS: Site 8 rated 199 schools, and funded 74 schools. The RFIS sample in Site 8 included 32 schools—16 non-Reading First schools and 16 Reading First schools—that were rated from 136.7 to 148.3, shown at the left and right sides of the shaded bar, respectively. The cut-point was at 144.9. The lowest school rating was 33, and the highest school rating was 184.3.
Sources: Interviews with sites’ Reading First coordinators in 2004.
schools in the initial study sample represent 46 percent of all Reading First schools at the study sites.26, 27 Because schools in the RFIS sample are broadly distributed across sites, study findings are unlikely to be dominated by one or two sites. The final analytic sample contains 248 schools (125 Reading First schools and 123 non-Reading First schools). Ten of the original study schools dropped
26 Many states and districts have subsequently held additional grant competitions, and the number of funded
Reading First schools within districts may have since changed as a result. 27 The number of Reading First and non-Reading First schools was initially equivalent; in three sites, the
number is no longer equivalent, reflecting the closing or reconfiguration of several schools after they had been chosen for the study sample.

Interim Report: Study Sample and Methods 19
out because of subsequent closures, reconfigurations, or refusals.28 Only nine of 248 schools in the analytic sample for the present report changed program status after it was determined by their ratings; five schools whose ratings qualified them for funding did not receive it; four schools with ratings that did not qualify them for funding subsequently received funding. No-shows and cross-overs were included, however, in the study’s data collection and analyses. In the analysis, schools are assigned to the group (with or without Reading First) defined by their rating even though their program status may have subsequently changed. The discussion above indicates that the stability of the study sample satisfies the requirements for an internally valid regression discontinuity analysis. The discussion below assesses the sample’s generalizability or external validity. Representativeness of the Sample
Although the RFIS sample is not a national probability sample, it shares many important characteristics with the national Reading First population. One way to examine these characteristics is to compare baseline characteristics of the sample to those of: (1) all Reading First schools in the 18 study sites; (2) all Reading First schools in the sample’s 13 states; and (3) all Reading First schools in the U.S. Exhibit 2.6 illustrates how these groups are related. At the center are the 125 Reading First schools in the final study sample, which is a subset of the 274 Reading First schools in the study sites, and that is a subset of all 1,728 Reading First schools in the 13 states with a study site. The outermost level of the figure represents all 4,793 Reading First schools nationally (as of June 2005).29 Exhibit 2.7 compares baseline characteristics and student reading achievement for the RFIS Reading First schools and the three other groups of Reading First schools. These comparisons are based on information from the national Common Core of Data (CCD) database as well as from a national assessment database maintained by the U.S. Department of Education. The information presented is for the most recent year before Reading First was funded at any RFIS site (2002-03). The exhibit compares student characteristics, school characteristics, and prior third grade reading performance. Visual inspection of the data displayed in this exhibit suggests that, overall, the present sample is similar to the other three groups of Reading First schools. Almost all are eligible for Title I support, they enroll high percentages of students eligible for free or reduced price lunch, and their past third grade reading scores are near their state averages for Reading First schools. The RFIS sample, on average, has proportionally lower percentages of Hispanic students and higher percentages of Black students than Reading First schools in the study states or in the nation; at the same time, RFIS sample schools, on average, have a lower percentage of Black students and a higher percentage of White
28 Ten schools were removed from the initial sample. Three comparison schools refused to participate; all
were in districts (in the same state) that had received no Reading First funding, and the districts asserted that absent any RF funding, they were not obligated to participate in the study. Two RF schools and two comparison schools were subsequently closed; two RF schools were substantially reconfigured (entirely new faculty and staff); and one comparison school merged with a Reading First school.
29 See http://www.sedl.org/readingfirst/ for further information about all Reading First schools nationwide.

20 Interim Report: Study Sample and Methods
Exhibit 2.6: Relevant Groups of Reading First Schools

Interim Report: Study Sample and Methods 21
Exhibit 2.7: Baseline Characteristics of Relevant Groups of Reading First Schools for 2002-2003
Characteristic
RF Schools in Study Sample
RF Schools in Study Districts
RF Schools in Study States
RF Schools in U.S.
Students Male (%) 52.3 52.0 51.7 51.5 Race (%)
Asian 3.1 2.5 1.5 3.5 Black 35.6 41.1 26.4 30.5 Hispanic 26.7 28.6 37.1 34.8 White 34.2 27.4 34.3 28.6 American Indian/Alaskan 0.5 0.4 0.6 2.5
Free Lunch and Reduced Lunch (%) 74.4 75.0 67.8 73.2 Schools Eligible for Title 1(%) 97.6 97.4 96.4 94.8 Locale (%)
Large City 39.2 39.8 26.7 26.8 Mid-size City 36.8 36.5 21.0 19.5 Othera 24.0 23.7 52.3 53.6
Size Total Number of Students 474.8 487.4 502.4 531.4 Number of Students in Grade 3 71.6 75.1 80.2 84.9 Student/Teacher Ratio 15.1 14.8 15.1 16.5 Third Grade Reading Performance Deviation from State RF Mean Proficiency Rate (%)b -1.3 -3.3 0.0 0.0 Number of Schoolsc 125 274 1,728 4,793
Notes: The RF study sample includes 128 schools from 18 sites (17 districts and 1 state) located in 13 states. The RF schools in Study Districts include all RF schools ranked and/or rated on the RF grant application for each of the 18 sites in the study. All RF schools in Study States include all RF schools in the 13 states included in the study. All RF schools nationally include all schools that received RF grants. a Other Locale includes urban fringe of a large city, urban fringe of a mid-sized city, large town, small town, and rural. b A school’s proficiency score is defined as the percentage of third grade students (or fourth or fifth grade when third grade is unavailable) in
the school that score at or above the state-defined proficiency threshold on the state’s reading assessment. The values in this row represent the average percentage point deviation from the mean proficiency score for the Reading First schools in the state. By definition, for a given state, the mean proficiency score for all Reading First schools in the state is the benchmark for comparison. Therefore, in the final two columns, the deviation from the benchmark within each state is zero and the average deviation across states is zero.
c Due to missing values for some variables, the number of schools included varies by characteristic. Sources: Baseline characteristic data are from the Common Core of Data. RF school samples are defined based on information from the
Southwest Educational Development Laboratory.

22 Interim Report: Study Sample and Methods
students than Reading First schools in study districts. A greater proportion of Reading First schools in the study sample are in large or mid-size cities and not other locales than are Reading First schools in the study states or in the nation. Also, the sizes of Reading First schools in the study sample, on average, are somewhat smaller than those in the three other groups. Further, these data cannot provide conclusive evidence that the study sample fully represents the experience of the entire national Reading First program, as the study sample might differ from the Reading First population in other ways that were not observed. Exhibit 2.7 also presents information on the proportion of third grade students’ test scores at or above their state proficiency threshold for reading, using an index that accounts for differences in states’ reading tests’ difficulty and established proficiency standards. The index reflects the mean percentage of third-grade students who performed at or above their state proficiency threshold for the 2002-03 year; a positive value would indicate a school’s proficiency rate is above its statewide average, and a negative value would mean a school’s performance is below the statewide average. The mean for the study’s sample of Reading First schools was -1.3 percentage points, which is below the statewide Reading First mean just before the program began. The RFIS schools’ average proficiency is closer to the statewide Reading First mean than that of other Reading First schools in study districts, because the RFIS sample includes schools that are closer to their respective cut-points, and therefore had somewhat stronger academic performance than did all of the RF schools in study sites. (Recall that RFIS schools were rated on the basis of past student performance, and schools closest to the cut-point had higher academic performance, on average, than schools further away from the cut-point). Exhibit 2.8 provides another way to examine the study sample’s similarity to other Reading First schools nationally. It summarizes responses from surveys administered in spring 2005 to principals, reading coaches, and teachers from RFIS Reading First schools and from the Reading First Implementation Study, which surveyed a large, nationally representative sample of Reading First schools. Visual inspection of the data presented in this exhibit suggests that, overall, survey respondents’ reports from the two studies are similar. The differences include: (1) a smaller percentage of students for whom English is a second language (10.8 percent versus
20.3 percent) for the RFIS sample; (2) a higher percentage of students who read at or above grade level (50.2 percent versus 46.9
percent) for the RFIS sample; and (3) a higher percentage of schools making Adequate Yearly Progress (75.3 percent versus 69.9
percent) for the RFIS sample. The discussion above indicates three important features of the study design and sample. One, the RFIS regression discontinuity design will yield unbiased impact estimates. Two, the RFIS sample size is adequate to detect impacts of less than 0.20 standard deviation units on student reading achievement. Three, although the sample of RF schools in the study was selected opportunistically, it is generally similar to other RF schools in the national program as of September 2004. The next chapter reviews the study data collection activities and describes the measures used to assess the impacts of Reading First.
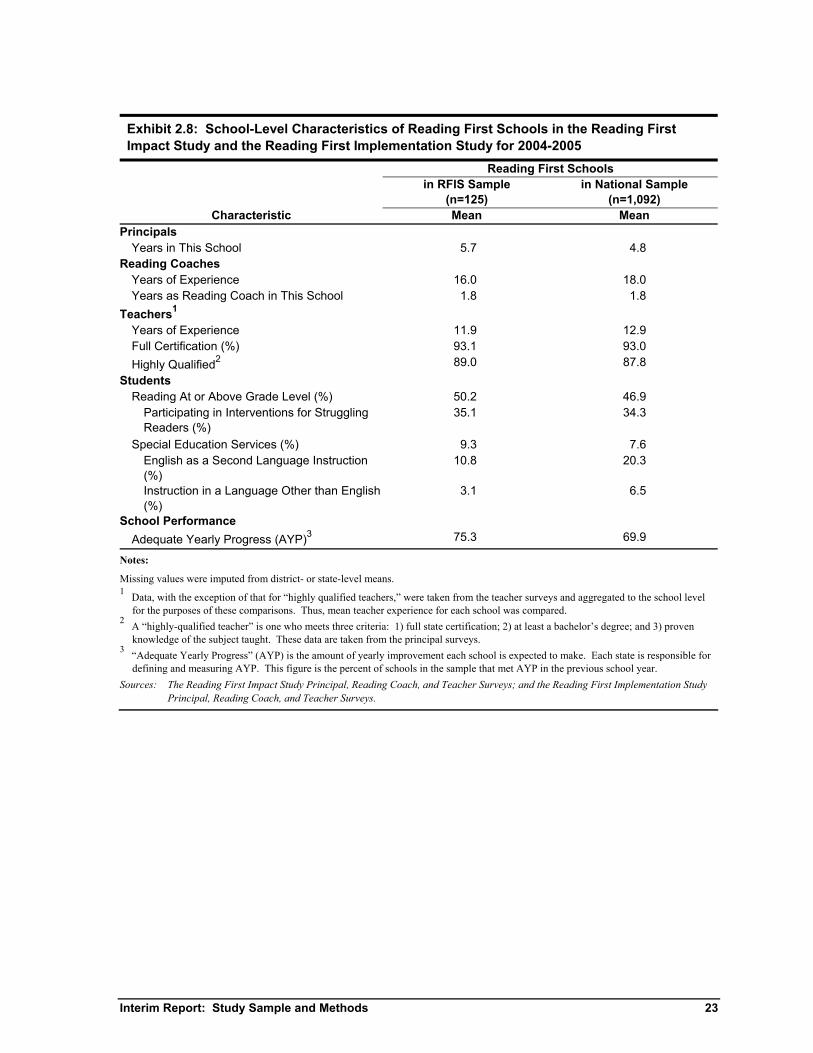
Interim Report: Study Sample and Methods 23
Exhibit 2.8: School-Level Characteristics of Reading First Schools in the Reading First Impact Study and the Reading First Implementation Study for 2004-2005
Reading First Schools
in RFIS Sample
(n=125) in National Sample
(n=1,092) Characteristic Mean Mean
Principals Years in This School 5.7 4.8
Reading Coaches Years of Experience 16.0 18.0 Years as Reading Coach in This School 1.8 1.8
Teachers1 Years of Experience 11.9 12.9 Full Certification (%) 93.1 93.0 Highly Qualified2 89.0 87.8
Students Reading At or Above Grade Level (%) 50.2 46.9
Participating in Interventions for Struggling Readers (%)
35.1 34.3
Special Education Services (%) 9.3 7.6 English as a Second Language Instruction (%)
10.8 20.3
Instruction in a Language Other than English (%)
3.1 6.5
School Performance Adequate Yearly Progress (AYP)3 75.3 69.9
Notes:
Missing values were imputed from district- or state-level means. 1 Data, with the exception of that for “highly qualified teachers,” were taken from the teacher surveys and aggregated to the school level
for the purposes of these comparisons. Thus, mean teacher experience for each school was compared. 2 A “highly-qualified teacher” is one who meets three criteria: 1) full state certification; 2) at least a bachelor’s degree; and 3) proven
knowledge of the subject taught. These data are taken from the principal surveys. 3 “Adequate Yearly Progress” (AYP) is the amount of yearly improvement each school is expected to make. Each state is responsible for
defining and measuring AYP. This figure is the percent of schools in the sample that met AYP in the previous school year. Sources: The Reading First Impact Study Principal, Reading Coach, and Teacher Surveys; and the Reading First Implementation Study
Principal, Reading Coach, and Teacher Surveys.
24 Interim Report: Study Sample and Methods

Interim Report: Measures and Data Collection 25
Chapter Three: Measures and Data Collection
The Reading First program provides resources to states, districts, and schools to improve the effectiveness of reading instruction, and ultimately, to improve students’ reading performance such that by the end of third grade, students will be able to read at or above grade level. The programmatic focus on improved classroom instruction and a clearly articulated reading comprehension goal led the study team to concentrate its data collection activities on teachers’ instructional practices and students’ reading comprehension skills. The study design draws upon a variety of data sources to address its evaluation questions. Exhibit 3.1 summarizes the data collection schedule for the study as a whole: student reading comprehension data (standardized test scores), observations during classroom instruction, surveys of school personnel, and district staff interviews. This interim report is based on data collected during the 2004-05 and 2005-06 school years. Exhibit 3.2 provides information about the number of respondents for each type of data collection activity. Exhibit 3.3 provides a description of the measures utilized in the study. The RFIS draws upon student achievement data from the Stanford Achievement Test, 10th Edition (SAT 10, Harcourt Assessment, Inc., 2004) reading comprehension subtest, administered in the fall of 2004, the spring of 2005 and the spring of 2006.30 The RFIS has tested over 10,000 students in each grade level (grades 1, 2, and 3) in each round of testing.
Exhibit 3.1: Data Collection Schedule for the Reading First Impact Study
2004-2005 2005-2006 2006-2007 Data Collection Elements Fall Spring Fall Spring Fall Spring
Student Testing Classroom Observations Teacher, Principal, Reading Coach Surveys District Staff Interviews
30 Students in two of the RFIS’s 18 sites were excluded from fall 2004 testing as a result of hurricane-related
school closures. Those students were tested in subsequent data collections.

26
Interim R
eport: Measures and D
ata Collection
Exhibit 3.2: Summary of RFIS Data Collection Activities and Respective Response Rates, by Grade Fall 2004 Spring 2005 Fall 2005 Spring 2006 RF Non-RF RF Non-RF RF Non-RF RF Non-RF
N (%) N (%) N (%) N (%) N (%) N (%) N (%) N (%)
Student assessments Grade 1 7,563 (72) 7,492 (69) 9,225 (84) 8,786 (80) 7,552 (86) 6,576 (85) Grade 2 7,289 (71) 7,160 (70) 8,867 (85) 8,611 (82) 7,514 (86) 6,582 (85) Grade 3 7,208 (73) 7,063 (69) 8,748 (84) 8,399 (84) 7,220 (87) 6,953 (87)
Classroom observations (reading instruction)
Grade 1 809 (97) 820 (96) 720 (98) 704 (98) 718 (99) 707 (99) Grade 2 766 (96) 760 (95) 664 (97) 668 (98) 666 (100) 668 (100)
Classroom observations (student engagement)
Grade 1 + 2 683 (98) 678 (99) 677 (97) 677 (98)
Surveys: Teacher Grade 1 396 (73) 363 (67) Grade 2 362 (73) 319 (65) Grade 3 318 (71) 279 (64) Reading Coach 118 (95) 79 (72) Principal 98 (78) 89 (72)
Site/District interviews 18 (100) 18 (100) Notes: Blank cells indicate no data collection for that component at that time period. Response rates shown are for the analytic sample of 248 schools. Active consent (i.e., only students whose parents had signed and returned consent forms) was used in fall 2004. Passive consent (i.e., all eligible students were tested unless their parents submitted forms refusing to allow their children to be tested) was used in subsequent test administrations. Reading instruction in each classroom was observed on two consecutive days in each wave of data collection. Observations of student engagement were scheduled for the same classrooms as observations of teachers’ reading instruction. Observations of student engagement occurred on one of the two days during which reading instruction was observed (see Appendix C for a complete discussion of the observation protocols).
EXHIBIT READS: In fall 2004, 7563 student assessments were completed in Reading First grade 1 classrooms, corresponding to 72 percent of all eligible grade 1 classrooms.

Interim Report: Measures and Data Collection 27
Exhibit 3.3: Description of Measures Utilized in the Reading First Impact Study
Domain Outcome Measure and Description Two outcome variables
Mean scaled scores on the reading comprehension subtest of the Stanford Achievement Test, 10th Edition (SAT 10), represented as a continuous measure of student reading comprehension. Because scaled scores are continuous across grade levels, values for all three grade levels can be shown on a single set of axes.
Student reading comprehension
Percentage of students at or above grade level on the SAT 10, based upon established test norms that correspond to grade level performance, by grade and month. The on or above grade level performance percentages were based on the start of the school year, date of the test and the scaled score, as well as the related grade equivalent.
Eight outcome variables Minutes of instruction in phonemic awareness, or how much instructional time teachers spent on phonemic awareness, from the Instructional Practice in Reading Inventory (IPRI) observational data. Minutes of instruction in decoding, or how much instructional time teachers spent on decoding, from IPRI observational data. Minutes of instruction in fluency building, or how much instructional time teachers spent on fluency building, from IPRI observational data. Minutes of instruction in vocabulary development, or how much instructional time teachers spent on vocabulary development, from IPRI observational data. Minutes of instruction in comprehension, or how much instructional time teachers spent on comprehension of connected text, from IPRI observational data. Minutes of instruction in all five dimensions combined, or how much instructional time teachers spent on all five dimensions combined, from IPRI observational data. Proportion of each observation with highly explicit instruction, or the proportion of time spent within the five dimensions when teachers used highly explicit instruction, from IPRI observational data (e.g., instruction included teacher modeling, clear explanations, and the use of examples).
Classroom reading instruction
Proportion of each observation with high quality student practice, or the proportion of time spent within the five dimensions when teachers provided students with high quality student practice opportunities, from IPRI observational data (e.g., teachers asked students to practice such word learning strategies as context, word structure, and meanings).
One outcome variable Student engagement with print
Percentage of students engaged with print, from the Student Time-on-Task and Engagement with Print (STEP) observational data, represented as the per-classroom average of the percentage of students engaged with print across three sweeps in each classroom during observed reading instruction.
Note: For more information on measures, see Appendix C.
28 Interim Report: Measures and Data Collection
In spring 2005, the RFIS conducted classroom observations of reading instruction in first and second grade classrooms. The RFIS observed reading instruction for two consecutive days in designated classrooms; the response rate for these observations was 96 percent, on average. The RFIS observed in first and second grade classrooms in both fall 2005 and spring 2006, for two consecutive days each. Response rates were 97 percent and above for both Reading First and comparison classrooms. Over 1,400 classrooms were observed at each time point (see Exhibit 3.2). A measure of the percentage of students on-task and engaged with print was added to the RFIS data collection in fall 2005. Over 1,300 classrooms were observed using this measure in both fall 2005 and spring 2006, with a response rate of over 97 percent at each time point. Surveys of teachers, reading coaches, or reading specialists (non-Reading First schools do not universally have reading coaches), and school principals were fielded in spring 2005 with combined RF and non-RF response rates of 69 percent for teachers, 84 percent for reading coaches, and 75 percent for principals.31 Student Reading Comprehension
At the heart of this evaluation is a question about the impact of Reading First on the reading achievement of students. To answer this question, the study must obtain valid and reliable measures of reading performance from students in RF and non-RF schools. The RFIS had initially planned to use a battery of individually-administered tests to assess students across the specific components of reading instruction targeted by the legislation: phonemic awareness, phonics, fluency, vocabulary and comprehension (No Child Left Behind Act, 2001). When the study’s design shifted to a RDD, with a quadrupled number of schools and students in the study sample, the individualized student assessment data collection was no longer practical. The RFIS Team, working with its Technical Work Group and staff from the National Center for Educational Evaluation, Institute of Education Sciences, at the U.S. Department of Education, focused on identifying a single test (or subtests) to measure students’ ability to comprehend text, such as subtests of word reading, vocabulary, listening comprehension, and/or reading comprehension. Reading comprehension was selected, rather than other dimensions of early reading skill, because comprehension is perceived as “the essence of reading” that sets the stage for children’s later academic success (Durkin, 1993, p.12; National Institute of Child Health and Human Development, 2000; Stevens, Slavin, and Farnish, 1991). The priorities in selecting a test for the RFIS included the following:
• direct measurement of skills related to text comprehension; 31 As a condition of approval to collect survey data for this study, the Office of Management and Budget
required the RFIS to conduct a study of the effect of incentives on survey response rates for teachers. Schools within districts were randomly assigned to one of three incentive conditions: $30, $15, and $0. Six sites, representing 39 schools, refused to participate in the incentive sub-study because their labor contracts mandate that district employees be compensated equally for completion of identical tasks, thereby reducing the number of schools in the sub-study from 251 to 215. The results of the incentive sub-study indicated that incentives significantly increased response rates; as a result, in future waves of survey administration, all respondents will be eligible for incentives.

Interim Report: Measures and Data Collection 29
• ease and appropriateness of administration to groups or entire classrooms of students—including modest time demands;
• appropriateness for first, second, and third grade students—including those students just beginning first grade in the fall;
• use of a norm-referenced test—which would provide a national norming sample, thereby allowing the study to ascertain the absolute level of reading comprehension for Reading First and other students;
• consistent reliability and validity data from norming samples and prior research;
• evidence of prior use on a large scale, which therefore would render its use more credible in the research community; and
• selecting an assessment already used by some localities/states, either for statewide testing or for Reading First assessment purposes, in order to minimize additional testing.
The RFIS selected the Stanford Achievement Test, 10th Edition, because it best met the criteria outlined above.32 The outcome measures used to assess reading comprehension are student test scores on the SAT 10, reported in terms of continuous scaled scores as well as in terms of the percentage of students who scored at or above grade level, according to established test norms that correspond to grade level performance, by grade and month.33 The latter metric is also salient for this study, as one of the program’s explicit objectives is to increase the number and percent of students who read at or above grade level (No Child Left Behind Act, 2001). The RFIS administered the following subtests of the SAT 10 to first, second, and third grade students in the spring of 2005 and spring of 2006, respectively: the Primary 1 Reading Comprehension Subtest (40 items), the Primary 2 Reading Comprehension Subtest (40 items), and the Primary 3 Reading Comprehension Subtest (54 items). Where already administered, the RFIS obtained SAT 10 reading comprehension test score data from schools/districts for the grades of interest, which reduced the testing burden for those students and schools.34 Items from the SAT 10 reading comprehension subtests (different versions for first, second, and third grades) are multiple choice. Students must read sentences, paragraphs, or longer passages and select the response that either correctly completes a sentence describing a picture or answers a question
32 See Appendix C for more information on SAT 10 selection, data collection, and response rates. 33 The study team converted mean SAT 10 scaled scores to grade equivalents by using the scaled score to
grade equivalents table in the Stanford Achievement Test Series Fall Multilevel Norms Books (based on 2002 normative data) to match the average scaled score to a grade equivalent (Harcourt Assessment, Inc., 2003, p. 24-26). In order to calculate at or above grade level, a dummy variable was created for each student based on the start of the school year, date of the test, and their scaled score (as well as the related grade equivalent). For more information on the construction and interpretation of grade level performance (percentile ranks and grade equivalents), please see pages 24-26 of the Stanford Achievement Test Series Fall Multilevel Norms Book.
34 In Spring 2007, another assessment, the Test of Silent Word Reading Fluency (TOSWRF), was added for Grade 1 (Mather et al., 2004). Results from this test will be included in the final report.

30 Interim Report: Measures and Data Collection
about the passage. As the grade level increases, the length of passages increases and test items require higher levels of inference. A test proctor first reads aloud standardized instructions and guides students through one or two sample items for practice, giving feedback on the correct answers to sample items to ensure that students understand test directions. Then students complete test items on their own.35 Reading Instruction
A key part of the evaluation is to determine the impact of Reading First on instruction in the targeted grades. Therefore, classroom observations of instructional practices in reading were needed from both RF and non-RF classrooms. Because the Reading First legislation calls for reading instruction to be based on scientifically based reading research findings, the RFIS observational instrument built upon findings describing evidence-based instructional practices such as those in the National Research Council’s (1998) report (Snow, Burns, and Griffin, 1998) and the National Reading Panel report (National Institute of Child Health and Human Development, 2000). The Reading First legislation highlights five essential components of reading instruction. These five components, or dimensions, of reading instruction formed the basis for the development of the RFIS observation instrument. 36 Each dimension is described below.37 Phonemic Awareness Phonemic awareness instruction teaches students to distinguish and manipulate the sounds in words.38 A phoneme is the smallest unit of sound that affects the meaning of a spoken word. Before learning to read print, children must first understand that words are made up of component sounds. For example, changing the first phoneme in the word hat from /h/ to /p/ changes the word from hat to pat. Phonemic awareness instruction improves children’s word reading and helps children learn to spell (e.g., Ball and Blachman, 1991; Bus and van Ijzendoorn, 1999; see also NICHD, 2000). Decoding Decoding (also known as phonics) instruction helps children learn and understand the relationships between the letters of written language and the sounds (phonemes) of spoken language. Instruction in decoding helps children understand that there are predictable relationships between letters and sounds, helps them recognize familiar words, and allows children to “decode” unfamiliar printed words (see Chapter 2, Part II, NICHD, 2000). 35 In Fall 2004, first-graders completed the SESAT2 version of the SAT 10. In this version, students listen to
a test proctor who reads aloud each item (because students cannot necessarily read the printed test item at the start of first grade) and then select the correct response (a picture or word) in the test booklet (Harcourt Assessment, Inc., 2004).
36 For ease of explication, the measures created from IPRI data are referred to as the five dimensions of reading instruction (or “the five dimensions”) throughout the report. References to the programmatic emphases as required by legislation are labeled as the five essential components of reading instruction.
37 See Appendix C, Exhibit C.3 for specific examples of instructional activities associated with each of the five dimensions.
38 Phonemic awareness is a subcategory of phonological awareness. Phonological awareness includes phonemic awareness, but also refers to the ability to recognize and work with larger parts of spoken language, such as syllables and onsets and rimes.

Interim Report: Measures and Data Collection 31
Fluency Building Fluency is the ability to read text accurately and smoothly. The more automatically students can read individual words, the more they can focus on understanding the meaning of whole sentences and passages (NICHD, 2000). Fluency instruction helps students who are learning to read by building a bridge between recognizing words more efficiently and comprehending the meaning of text (e.g., Reutzel and Hollingsworth, 1993; also see Chapter 3, NICHD, 2000). Vocabulary Development Oral vocabulary refers to words used in speaking or recognized in listening. Reading vocabulary refers to words that are recognized or used in print. Instruction for beginning readers uses oral vocabulary to help them make sense of the words they see, and instruction that develops their reading vocabulary allows them to progress to more complex texts (e.g., Beck, Perfetti and McKeown, 1982; McKeown et al., 1983; also see NICHD, 2000). Readers must know what words mean before they can understand what they are reading. Comprehension of Connected Text Comprehension is understanding what is being or has been read. Students will not understand text if they can read individual words, but do not understand what sentences, paragraphs, and longer passages mean. Proficient readers elicit meaning from—or comprehend—text, rather than simply identifying a series of words. Instruction in comprehension strategies provides specific tools for readers to use to make sense of the text they read (see NICHD, 2000). Comprehension strategies are vital to the development of competent readers because they aid in understanding the collective significance of words, sentences, and passages. Development of Classroom Observational Measures
To address the question about the impact of Reading First on classroom instruction, the study team needed to adopt or design a measure of classroom instruction that would allow comparison of RF and non-RF schools. It is important to note that the Reading First program is neither a specific intervention, nor a uniformly implemented program. Rather, Reading First is, at its core, a funding stream. Although the Reading First Program Guidance required schools and districts to implement scientifically based reading instruction, it did not require states or districts or schools to use the same core reading program (U.S. Department of Education, 2002). Consequently, the RFIS team had to identify or develop an instrument sensitive enough to capture observed differences between Reading First and non-Reading First schools, while simultaneously flexible enough to accommodate a variety of instructional programs likely to be used by Reading First as well as by comparison schools. Preliminary reviews of existing instruments began shortly after the

32 Interim Report: Measures and Data Collection
study’s September 2003 start. The study team soon determined that it would need to develop its own instrument, customized to assess the specific components of Reading First.39 The RFIS Team developed an instrument called the Instructional Practice in Reading Inventory (IPRI). The IPRI was designed to capture both pedagogical strategies and content across the five dimensions of reading instruction described above.40 The instrument focuses specifically on teachers, reflecting the Reading First program’s emphasis on changing teachers’ instruction, specifically having teachers incorporate explicit instructional strategies and ample student practice opportunities (U.S. Department of Education, 2002, p. 6) within each of the five dimensions of reading instruction. The RFIS team defined behaviors associated with those pedagogical objectives for each of the five dimensions of reading instruction. Explicitness includes modeling by the teacher as well as clear explanations of strategies, principles, or rules, with sufficient numbers of examples. Explicit teaching includes making relationships overt, emphasizing distinctive features of new concepts, and providing prompts. Adequate practice ensures that all students have multiple opportunities to practice new skills and review recently learned skills and concepts. Teachers need to assess skill mastery and provide ample corrective feedback both to assist students when they encounter difficulty as well as to ensure mastery of skills and strategies. This includes working towards a high level of response accuracy, monitoring student understanding and performance on an ongoing basis, eliciting responses from all students, and providing extra instruction, practice, and review. 41 The instrument can be used for observations of varying lengths, reflecting the fact that schools’ defined reading blocks can vary; most reading blocks are 90 minutes or more. Observers use a booklet containing a series of individual IPRI forms, each of which corresponds to a three-minute interval of observation. The observer watches the teacher for three minutes and records those target instructional behaviors that occur during the three-minute interval. Then, the observer turns the page to a new form and starts another three-minute observation, again recording the presence of targeted behaviors. Therefore, an observation of a reading block yields multiple and sequentially ordered IPRI forms. Observers wear a special wristwatch that vibrates every three minutes, which signals when to turn to a new form for the next three-minute interval. Over the course of the designated reading block, observers record approximately 30-35 separate three-minute intervals, on average, for each day of observation.
39 Among the instruments reviewed were the following: The Instructional Content Emphasis (ICE)
(Edmonds and Briggs, 2003); Foorman and Schatschneider direct observation system and instruments from the Center for Academic and Reading Skills (CARS) (Foorman and Schatschneider, 2003); English Language Learner Classroom Observation Instrument (ELLCOI) (Haager et al., 2003); Teachers’ Instructional Practice (TIP) (Carlisle and Scott, 2003); Utah’s Profile of Scientifically-based Reading Research (Dole et al., 2001); The Classroom Observation Record (Abt Associates and RMC Research, 2002); and Observation Measure of Language and Literacy Instruction (OMLIT), developed by Abt Associates as part of the Even Start Classroom Literacy Interventions and Outcomes (CLIO) Study (Goodson et al., 2004).
40 See Appendix C for a copy of the IPRI as well as a more comprehensive description of its development. See also The Development of the Instructional Practice in Reading Inventory (Dwyer et al., 2007).
41 See, for example, Graves, Gerston, and Haager, 2004; Gunn et al., 2002 for specific examples of highly explicit instruction in phonemic awareness, and Foorman and Torgesen, 2001, Graves, Gerston, and Haager, 2004, for specific examples of highly explicit instruction in phonics. Exhibit C.6 in Appendix C identifies the specific sources of instructional strategies for each of the five dimensions of reading instruction.

Interim Report: Measures and Data Collection 33
The IPRI was designed to be used by field observers with a range of reading-related expertise, and therefore it was deliberately constructed with lower-inference and more behaviorally specific items. The lower-inference items represent discrete behaviors that the research cited in the National Reading Panel report (National Institute of Child Health and Human Development Report, 2000) suggests are important for improving elements of reading instruction, and the behaviors that are hypothesized to differ between RF and non-RF classrooms. Classroom observers had to demonstrate mastery of the IPRI over the course of an intensive week-long training session before they were hired to conduct observations. Mastery was measured by comparing observers’ and master trainers’ ratings of classroom instruction.42 The RFIS team created eight measures of classroom instruction from the IPRI data, which, taken together, represent the essential components of reading instruction emphasized by the Reading First program. This number is deliberately constrained to focus only on the most pivotal aspects of the program and to limit the number of statistical tests required. The instructional measures include:
• Minutes of Instruction in the Five Dimensions Combined. This reflects the number of minutes of instruction summed across the five dimensions of reading instruction: phonemic awareness, decoding, vocabulary, fluency, and comprehension.
• Minutes of Instruction in Each of the Five Dimensions. These five measures reflect the number of minutes of instruction in each of the five dimensions separately: phonemic awareness, decoding, vocabulary, fluency, and comprehension.
• Percentage of Instructional Intervals in the Five Dimensions with Highly Explicit Instruction. This measures “highly explicit instruction” during lessons in the five dimensions. Instruction was considered “highly explicit” if teachers actively taught, modeled, explained, or assisted children in using specific reading strategies. The specific instructional activities comprising “highly explicit instruction” vary across the five dimensions, based on current research on reading instruction. Note that (1) this measure is based only on instruction in four of five dimensions (all except fluency building), and (2) the observations do not record highly explicit instruction in other literacy activities, such as spelling or writing.
• Percentage of Instructional Intervals in the Five Dimensions with High Quality Student Practice. This measures “high quality student practice,” which reflects teachers’ provision of dimension-specific practice opportunities, as based on current research. Note that this measure is based only on instruction in the five dimensions; the observations do not record high quality student practice in other literacy activities, such as spelling or writing.
To create the six analytic variables about time spent in the dimensions of reading instruction, data from classroom observations of instruction were transformed from intervals into minutes. In cases where one instructional behavior/activity was observed, that interval was designated accordingly. In
42 The inter-rater reliability for the IPRI has been calculated using overall percent agreement, occurrence
percent agreement, non occurrence agreement, and generalizability coefficients, all of which yield consistent results. In fall 2005, raters demonstrated overall agreement and non-occurrence agreement of 90 percent or above, and occurrence agreement of approximately 70 percent on average. The least reliable items were those that occurred infrequently. For a more complete discussion of inter-rater reliability, see Appendix C.

34 Interim Report: Measures and Data Collection
cases where multiple instructional behaviors were observed during one three-minute interval, the minutes were distributed across the specific instructional behaviors that had been observed. (See Appendix C for a more detailed discussion of the transformation of intervals into minutes.) To create the last two analytic variables, the data from classroom observations were summed across all the individual three-minute intervals within an observation. The total number of intervals (within each observation) with highly explicit instruction and high quality student practice was then divided by the total number of intervals (within each observation) with instruction in the five dimensions of reading. The IPRI data are used to describe the content of instruction as well as the use of pedagogical strategies hypothesized to improve students’ reading skills. The eight specific outcome measures used in analysis correspond to the amount of instructional time allocated to the each of the five dimensions of reading instruction described above, as well as one outcome representing all five dimensions combined, and one outcome each for the proportion of instructional time allocated to highly explicit instruction and provision of high quality student practice. Student Time-on-Task and Engagement with Print
The Reading First program legislation explicitly articulates a number of goals related to professional development, use of research-based materials and assessments, classroom reading instruction, and students’ reading performance (No Child Left Behind Act, 2001). The Guidance for the Reading First Program (U.S. Department of Education, 2002) indicates that Reading First classrooms should also be characterized by “active student engagement in a variety of reading-based activities” and “high levels of time on task.” There is research indicating that students benefit from more time on reading-related tasks and from instruction that is structured to provide more time on task (see for example, Snow, Burns, and Griffin 1998; Taylor et al, 1999). The RFIS observational instrument, the IPRI, focuses primarily on teacher behaviors, and in order to ensure that the study also collected some data on student behavior during observed reading instruction, the RFIS developed a measure that captures information about students’ time on task and attention to printed material. Student behavior during reading instruction was assessed through structured observations using the Student Time-on-Task and Engagement with Print (STEP) instrument.43 The STEP is designed to record student engagement in instruction and students’ exposure to print materials. Specifically, it is designed to capture the percentage of students in a classroom engaged in productive academic work (i.e., “on task”), and, of those, the percentage who are engaged in either reading or writing print. The STEP is completed by a separate STEP observer during ongoing observations of reading instruction by an IPRI observer. The STEP observer records a time-sampled “snapshot” of student engagement three times in each classroom, e.g., three “sweeps” during the designated reading block in each classroom. Six minutes after entering the classroom during ongoing reading instruction, the STEP observer begins collecting the first of these sweeps. During each sweep, which lasts for approximately three minutes, the observer classifies every student in the classroom as either on- or off-task, and, if on-task, whether the student is: 1) reading connected text (a story or passage); 2) reading isolated text (letters, words, or isolated sentences); and/or 3) writing. The STEP observer waits until six minutes have elapsed between the end of one sweep and the start of the next. After the
43 See Appendix C for a copy of the STEP, as well as more information on data collection, response rates, and
inter-rater reliability.

Interim Report: Measures and Data Collection 35
third and final sweep, the STEP observer leaves the classroom. The STEP observer typically completes STEP observations in three classrooms spending about 25-30 minutes in each classroom. Data collected with the STEP measure are used to create one outcome representing the average percentage of students engaged with print during the designated reading block. It is important to note that the theory of action for Reading First does not specify whether students’ time on task and engagement with print during regular reading instruction would increase or decrease as a result of Reading First. One could hypothesize that well-implemented Reading First classrooms would increase both students’ time-on-task and engagement with print, because teachers would manage time effectively and ensure that students’ assignments are matched to their reading skills, whether those tasks are carried out in whole class, small group, or other grouping arrangements. One could also hypothesize that younger students would spend more time attending to the teacher than focusing directly on print, because they are not yet proficient enough readers to read independently, in which case Reading First could lead to decreases in the percentage of students engaged with print. Chapter Four presents findings on all three of the outcome domains.

36 Interim Report: Measures and Data Collection

Interim Report: Impact Findings 37
Chapter Four: Impact Findings
This chapter presents findings on Reading First’s impact on students’ reading comprehension, teachers’ reading instruction, and student engagement with print during reading instruction. It begins with a discussion of the program’s overall impacts across the 18 study sites, and then explores variation in impacts among the 18 sites. It also explores alternative approaches to weighting that might influence study findings because of potential site-by-site variation. Finally, it assesses the impacts for the two groups of sites the study team had hypothesized would differ based on the length of time they had access to Reading First funding during the study’s follow-up period. The findings in the chapter are based on data collected during the 2004-2005 and 2005-2006 school years, which represent between one and three years of Reading First funding across the sites. The key findings include the following:
• On average, across the study sites, estimated impacts on student reading test scores were not statistically significant.
• For teachers in grades one and two, Reading First produced positive and statistically significant increases in the total time spent on the five dimensions of reading instruction. For first grade teachers, these impacts were concentrated in phonemic awareness and phonics. For second grade teachers, these impacts were concentrated in phonics, vocabulary, and comprehension.
• Impacts on the percentage of students engaged with print were mixed. For second grade classrooms, Reading First produced a statistically significant reduction in the percentage of students engaged with print. For first grade classrooms, the estimated impact on the percentage of students engaged with print was not statistically significant.
• The overall variation in impacts among the 18 sites was not statistically significant. Estimated impacts varied by more than one standard deviation on reading comprehension test scores, and by more than two standard deviations on the instructional time teachers spent in the five dimensions of reading instruction.
• Study sites that received their Reading First grants later in the federal funding process (between January and August 2004) experienced positive and statistically significant impacts both on the time first and second grade teachers spent on the five essential components of reading instruction, and on first and second grade student reading comprehension. Time spent on the five essential components was not assessed for third grade, and impacts on third grade reading comprehension were not statistically significant. In contrast, there were no statistically significant impacts on either time spent on the five components of reading instruction or on reading comprehension scores at any grade level among study sites that received their Reading First grants earlier in the federal funding process (between April and December 2003).
• Although there are multiple differences between the sites that received awards earlier and later, there is no way to distinguish which mix of these or other unmeasured factors explains the differences in the observed patterns of estimated impacts.
As described in Chapter 2, all impact estimates are regression-adjusted to control for a linear specification of the rating variable each site used to select its Reading First schools as well as selected

38 Interim Report: Impact Findings
teacher and /or student background characteristics used in the analysis.44 The impacts have been estimated using multi-level models to account for the clustering of students within classrooms, classrooms within schools, and schools within sites. In the exhibits that follow, values in the “Actual Mean with Reading First” column are actual, unadjusted values for Reading First schools; values in the “Estimated Mean without Reading First” column represent the best estimates of what would have happened in RF schools absent RF funding and are calculated by subtracting the impact estimates from the RF schools’ actual mean values. Average Impacts for the Study Sites
This section presents estimates of the average impacts of Reading First on student reading comprehension, classroom reading instruction, and student engagement with print for the 18 study sites. The impact estimates are based on two school years: 2004-2005 and 2005-2006, and they pool results from students, teachers, and classrooms across the two school years. The study pools estimates both to improve statistical power and to be more parsimonious with respect to findings. The differences in impacts between the two years are not statistically significant for data collected in both years.45,46 (Appendix D presents impact estimates separately for each follow-up year.) Reading Comprehension
Impacts on reading comprehension are based on student scores on the Stanford Achievement Test, 10th Edition (SAT 10). The analysis used both a continuous measure and a dichotomous measure of student scores. The continuous measure was mean student scaled score. To facilitate interpretation of the average scaled score, Exhibit 4.1 also includes the grade equivalent and national percentile, which corresponds to the averages for schools with Reading First and estimated averages of how these schools would have performed in the absence of Reading First, respectively. Impacts were not estimated for grade equivalents or national percentile ranks because these metrics are not equal-interval measures and should not be used in arithmetic calculations. The dichotomous measure was the percentage of students who scored at or above grade level. Exhibit 4.1, Panel 1, presents estimates of the overall impacts of Reading First on mean reading comprehension scores for all study sites during spring 2005 and spring 2006, separately for students in grades one, two, and three. Specifically:
• The impact on reading comprehension in first grade was not statistically significant. The average scaled score for first grade students in schools with Reading First was estimated to be 3.6 points higher than their scores would have been without Reading First. This is equivalent to a mean effect size of 0.07 standard deviations.
44 See Appendix B for a description of the background characteristics used in the estimation of impacts. 45 P-values for reading comprehension outcomes range across grades from 0.472 to 0.910, and range from
0.669 to 0.940 for outcomes in the instruction domain. 46 To account for possible modeling differences associated with the year of data collection, impact estimation
models include indicator variables for each data collection period and interactions between these and all other covariates. The indicator variables account for year-to-year variation in the levels of the outcome measures as well as in the relationship between covariates and outcome measures.

Interim Report: Impact Findings 39
Exhibit 4.1: Estimated Impacts on Student Achievement: Spring 2005 and 20061
Actual Mean with
Reading First
Estimated Mean
without Reading
First Impact
Effect Size of Impact
Statistical Significance
of Impact (p-value)
Panel 1
All Sites Reading Comprehension Grade 1 Scaled Score 543.1 539.6 3.57 0.07 (0.215) Corresponding Grade Equivalent 1.7 1.7 2.87 Corresponding Percentile 44 41 Grade 2 Scaled Score 584.3 582.9 1.41a 0.03 (0.559) Corresponding Grade Equivalent 2.5 2.4 2.41 Corresponding Percentile 39 38 Grade 3 Scaled Score 608.4 610.0 -1.63 -0.04 (0.455) Corresponding Grade Equivalent 3.3 3.3 2.17 Corresponding Percentile 39 39
Panel 2 All Sites Percent Reading At or Above Grade Level Grade 1 45.4 42.2 3.15 N/A2 (0.260) Grade 2 38.9 38.8 0.12 N/A (0.965) Grade 3 37.9 40.1 -2.22 N/A (0.383)
Notes:
The complete Reading First Impact Study (RFIS) sample includes 248 schools from 18 sites (17 school districts and 1 state) located in 13 states. 125 schools are Reading First schools and 123 are non-Reading First schools. For grade 2, one non-RF school could not be included in the analysis because test scores were not available. The effect size of the impact is the impact divided by the actual standard deviation of the outcome for the non-Reading First Schools pooled across the spring 2005 and 2006 SAT-10 test scores (by grade). Values in the “Actual Mean with Reading First” column are actual, unadjusted values for Reading First schools; values in the “Estimated Mean without Reading First” column represent the best estimates of what would have happened in RF schools absent RF funding and are calculated by subtracting the impact estimates from the RF schools’ actual mean values.
A two-tailed test of significance was used, and where applicable, statistically significant findings at the p≤.05 level are indicated by *. 1 95 percent confidence intervals for main impacts can be found in Appendix E. 2 The “at or above grade level” variable is dichotomous; therefore effect sizes are not appropriate. a Due to estimation variation and rounding, the estimated pooled sample impact can be slightly larger than for 2005 and 2006 separately.
EXHIBIT READS: The observed mean reading comprehension score for first-graders with Reading First was 543.1 scaled score points. The estimated mean without Reading First was 539.6 scaled score points. The impact of Reading First was 3.6 scaled score points (or 0.07 standard deviations), which was not statistically significant at the p<.05 level (p=0.215). The observed average percent of first-graders reading at or above grade level with Reading First was 45.4 percentage points. The estimated average percent without Reading First was 42.2 percentage points. The impact of Reading First on the percent of first grade students reading at or above grade level was 3.2 percentage points, which was not statistically significant at the p<.05 level (p=.260).
Sources: RFIS SAT 10 administration in the spring of 2005 and 2006, as well as from state/district education agencies in those sites that already used the SAT 10 for their standardized testing (i.e., FL, KS, MD, OR).

40 Interim Report: Impact Findings
The average first grade score with or without Reading First was equivalent to the seventh month (of a nine-month school year) of first grade, based on national norms. The corresponding national percentile ranks for the scaled score means were 44 and 41, respectively.
• The impact on reading comprehension in second grade was not statistically significant. The average scaled score for second grade students in schools with Reading First was estimated to be 1.4 points higher than their scores would have been without Reading First, which is equivalent to an effect size of 0.03 standard deviations.
Average second grade scores with or without Reading First were equivalent to the fifth month and fourth month of second grade, respectively. The corresponding percentile ranks were 39 with Reading First and 38 in the absence of the program.
• The impact on reading comprehension in third grade was not statistically significant. The average scaled score for third grade students in schools with Reading First was estimated to be 1.6 points below what their scores would have been without Reading First. This is equivalent to an effect size of -0.04 standard deviations.
The average score with or without Reading First was equivalent to the third month of third grade, and the percentile rank was 39 in both cases. Exhibit 4.1, Panel 2, reports estimates of the impacts of Reading First on the percentage of students who scored at or above grade level in reading comprehension. Grade level was defined as the grade equivalent score that matches the grade and month in which a student was tested. Thus, for example, students tested in the seventh month of second grade were judged to read at or above grade level if the grade equivalent of their scaled score was 2.7 or higher. Findings indicate that:
• Estimated impacts on the percentage of students reading at or above grade level for grades one, two, and three were not statistically significant.
Panel 2 in Exhibit 4.1 indicates that, on average, across all three grade levels, fewer than half of the students in schools with Reading First scored at or above grade level. Exhibit 4.1 includes six statistical tests of program impacts on reading comprehension—one for each combination of grade and reading comprehension measure. A composite test of these estimates (using an index that combines measures and pools the sample across grades) was not statistically significant. The estimated effect size of the impact of Reading First on the composite reading comprehension index was 0.02 standard deviations and its p-value was 0.668. Exhibit 4.2 presents these findings in visual terms, using effect sizes to display the impact estimates as well as the 95 percent confidence intervals.47 The exhibit displays reading comprehension impact estimates as well as instructional outcome impact estimates. Because instructional data were collected in grades one and two only, the bottom panel includes only an impact estimate for reading comprehension. The exhibit presents separate graphs for each of the three grades. Each graph plots the estimated mean impact, represented by a small square, and the 95 percent confidence interval for
47 See Appendix E for 95 percent confidence intervals for main impact estimates in relevant metrics.

Interim Report: Impact Findings 41
each estimate, represented by a line extending outward from the mean. The confidence intervals indicate the margin of error for each estimate; the wider the confidence interval, the broader the margin of error, and the more uncertainty about the estimate. If a 95 percent confident interval does not include zero, the estimated impact was statistically significant (p-value less than or equal to 0.05). The display indicates that the impact estimates and associated confidence intervals for reading comprehension are close to or cover zero. Reading Instruction
Measures of reading instructional practice for grades one and two are based on classroom observations conducted by trained observers. Limitations of resources precluded such observations for grade three. The impacts on classroom instruction are based upon continuous measures of the amount of instructional time teachers spent on the five dimensions of reading instruction (for all five dimensions combined and separately) as well as measures of the proportion of observational intervals that included highly explicit instruction and high quality student practice. Exhibit 4.3 summarizes resulting estimates of the impacts of Reading First on instructional practices. The top panel in the exhibit presents estimates of program impacts on the average number of minutes per day spent on the five dimensions of reading instruction combined (phonemic awareness, phonics, vocabulary, fluency, and comprehension).
• For first grade classrooms, Reading First produced an increase of 8.6 minutes per daily reading block, which is statistically significant; this is equivalent to an effect size of 0.41 standard deviations. This impact represents roughly 45 minutes of additional instruction in the five dimensions per week.
• For second grade classrooms, Reading First produced an additional 12.1 minutes per daily reading block. This impact estimate is equivalent to an effect size of 0.57 standard deviations, and it is statistically significant. This represents about 60 minutes of additional instruction in the five dimensions per week.
The bottom panel of Exhibit 4.3 presents estimates of Reading First impacts on two other instructional outcomes. One represents the percentage of three-minute classroom observation intervals in which teachers used highly explicit instructional strategies associated with the five dimensions. The second outcome captures the percentage of three-minute classroom observation

42 Interim Report: Impact Findings
Exhibit 4.2: Estimated Impacts and Confidence Intervals for Key Outcomes, in Effect Size, by Grade
-1-0.8-0.6-0.4-0.2
00.20.40.60.8
1
ReadingComprehension
Minutes in 5Dimensions
Highly ExplicitInstruction
High-Qual StudPractice
Pct Engaged w/Print
Effe
ct S
ize
-1-0.8-0.6-0.4-0.2
00.20.40.60.8
1
ReadingComprehension
Minutes in 5Dimensions
Highly ExplicitInstruction
High-Qual StudPractice
Pct Engaged w/Print
Effe
ct S
ize
-1-0.8-0.6-0.4-0.2
00.20.40.60.8
1
ReadingComprehension
Effe
ct S
ize
Notes: The complete RF study sample includes 248 schools from 18 sites (17 school districts and 1 state) located in 13 states. 125 schools are Reading First schools and 123 are non-Reading First schools. For grade 2, one non-RF school could not be included in the analysis because test score data were not available. The outcome measure depicted for reading comprehension is the SAT 10 scaled score. Impact estimates are statistically adjusted (e.g., take each school's rating, site-specific funding cut-point, and other covariates into account) to reflect the regression discontinuity design of the study. The effect size of the impact is the impact divided by the actual standard deviation of the outcome for the non-Reading First Schools pooled across the spring 2005 and 2006 SAT-10 test scores; spring 2005, fall 2005, and spring 2006 IPRI data and fall 2005 and spring 2006 STEP data (by grade).
For each outcome and grade level, impact estimates and 95 percent confidence intervals are presented in effect size terms. (See Exhibits 4.1, 4.4, and 4.6 for actual impact estimates.) Source: RFIS SAT 10 administration in the spring of 2005 and 2006, as well as from state/district education agencies in those sites that already use the SAT 10 for their standardized testing (i.e., FL, KS, MD, OR); RFIS Instructional Practice in Reading Inventory, spring 2005, fall 2005, and spring 2006; and RFIS Student Time-on-Task and Engagement with Print, fall 2005 and spring 2006.
Grade 3
Grade 2
Grade 1

Interim Report: Impact Findings 43
Exhibit 4.3: Estimated Impacts on Instructional Outcomes: Spring 2005, Fall 2005, and Spring 20061
Actual Mean with
Reading First
Estimated Mean
without Reading
First Impact
Effect Size of Impact
Statistical Significance
of Impact (p-value)
Panel 1
Number of minutes of instruction in the five dimensions combined
Grade 1 59.41 50.85 8.56* 0.41* (0.003) Grade 2 59.53 47.44 12.09* 0.57* (<0.001)
Panel 2
Percentage of intervals in five dimensions with Highly Explicit Instruction Grade 1 29.78 26.13 3.65* 0.20* (0.023) Grade 2 31.55 24.57 6.98* 0.36* (<0.001) High Quality Student Practice Grade 1 19.21 18.35 0.86 0.05 (0.559) Grade 2 18.78 15.11 3.67* 0.20* (0.012) Notes: The complete RFIS sample includes 248 schools from 18 sites (17 districts and 1 state) located in 13 states. 125 schools are Reading First schools and 123 are non-Reading First schools. The effect size of the impact is the impact divided by the actual standard deviation of the outcome for the non-Reading First Schools pooled across the spring 2005, fall 2005, and spring 2006 IPRI data (by grade).
Values in the “Actual Mean with Reading First” column are actual, unadjusted values for Reading First schools; values in the “Estimated Mean without Reading First” column represent the best estimates of what would have happened in RF schools absent RF funding and are calculated by subtracting the impact estimates from the RF schools’ actual mean values.
A two-tailed test of significance was used, and where applicable, statistically significant findings at the p≤.05 level are indicated by *. 1 95 percent confidence intervals for main impacts can be found in Appendix E.
EXHIBIT READS: The observed mean amount of time spent in instruction in the five dimensions (phonemic awareness, phonics, vocabulary, fluency, and comprehension) in first grade classrooms with Reading First was 59.41 minutes. The estimated mean amount of time without Reading First was 50.85 minutes. The impact of Reading First on the amount of time spent in instruction in the five dimensions was 8.56 minutes (or 0.41 standard deviations), which was statistically significant at the p≤.05 level (p=.003). Sources: RFIS, Instructional Practice in Reading Inventory, spring 2005, fall 2005, and spring 2006
intervals in which students were provided with high quality practice opportunities focused on skills within the five dimensions. These findings include the following:
• Reading First increased the incidence of highly explicit instruction by 3.65 percentage points for grade one, and by 6.98 percentage points for grade two, corresponding to effect sizes of 0.20 and 0.36, respectively. Both estimates are statistically significant.
• The impact of Reading First on high quality student practice is statistically significant in grade two but not in grade one. In grade two, Reading First increased the incidence of high quality student practice by 3.67 percentage points, corresponding to an effect size of 0.20. In grade one, Reading First increased the incidence of high quality student practice by 0.86 percentage points, corresponding to an effect size of 0.05.

44 Interim Report: Impact Findings
Exhibit 4.2 (above) graphs the impact estimates and 95 percent confidence intervals for the instructional outcomes, by grade. The exhibit indicates positive and statistically significant impacts for two of the three instructional outcomes in Grade 1 and all three instructional outcomes in Grade 2. As was the case for the reading comprehension impact estimates, a composite test of the six impact estimates in Exhibit 4.3 was conducted using an index consisting of the average of the three instructional outcomes and pooling the sample across grades. The composite test indicates a statistically significant overall impact of Reading First on instructional practice. The estimated effect size of the impact of Reading First on the composite index of reading instruction is 0.44 standard deviations and its p-value was less than 0.0001. This composite test also holds for the findings presented next in Exhibit 4.4, because they represent subdivisions of the preceding results. Exhibit 4.4 presents separate estimates for each of the five dimensions of reading instruction. These findings illustrate the relative emphasis placed by Reading First schools on each dimension, how this emphasis differs by grade, and how the impacts of Reading First are distributed across the five dimensions. The majority of instructional time spent by Reading First teachers was focused on comprehension and phonics.
• In first grade classrooms, the impact on phonics was statistically significant, while the impact on comprehension was not statistically significant. First grade classroom instruction in schools with Reading First included about 21.4 minutes on phonics and about 23.6 minutes on comprehension per daily reading block. This reflects an estimated daily impact of 3.9 additional minutes for phonics and 2.3 more minutes for comprehension.
• Second grade classroom instruction in schools with Reading First included about 29.2 minutes per daily reading block on comprehension, and about 14.0 minutes on phonics. This reflects an estimated daily impact of 5.3 extra minutes for comprehension and 3.9 extra minutes for phonics, both of which were statistically significant.
Classroom instruction in both first and second grade in schools with Reading First included less time per daily reading block on other dimensions of reading than on comprehension and phonics, as follows: vocabulary (7.8 and 11.6 minutes, respectively), fluency (4.5 and 4.3 minutes, respectively), and phonemic awareness (2.1 and 0.4 minutes, respectively). Impacts on phonemic awareness in grade one and on vocabulary in grade two were statistically significant.

Interim Report: Impact Findings 45
Exhibit 4.4: Estimated Impacts on Instructional Outcomes: Spring 2005, Fall 2005, and Spring 20061
Actual Mean with
Reading First
Estimated Mean
without Reading
First Impact
(minutes)
Effect Size of Impact
Statistical Significance
of Impact (p-value)
Number of minutes of instruction in: Phonemic Awareness
Grade 1 2.07 1.35 0.72* 0.27* (0.016) Grade 2 0.42 0.28 0.15 0.12 (0.167)
Phonics Grade 1 21.36 17.46 3.90* 0.29* (0.015) Grade 2 14.01 10.16 3.85* 0.36* (0.004)
Vocabulary Grade 1 7.80 7.16 0.65 0.10 (0.378) Grade 2 11.63 9.49 2.14* 0.25* (0.031)
Fluency Grade 1 4.54 3.46 1.09 0.18 (0.112) Grade 2 4.25 3.60 0.65 0.12 (0.287)
Comprehension Grade 1 23.63 21.35 2.29 0.16 (0.204) Grade 2 29.22 23.96 5.26* 0.32* (0.008)
Notes: The complete RFIS sample includes 248 schools from 18 sites (17 districts and 1 state) located in 13 states. 125 schools are Reading First schools and 123 are non-Reading First schools. The effect size of the impact is the impact divided by the actual standard deviation of the outcome for the non-Reading First Schools pooled across the spring 2005, fall 2005, and spring 2006 IPRI data (by grade). Values in the “Actual Mean with Reading First” column are actual, unadjusted values for Reading First schools; values in the “Estimated Mean without Reading First” column represent the best estimates of what would have happened in RF schools absent RF funding and are calculated by subtracting the impact estimates from the RF schools’ actual mean values. A two-tailed test of significance was used, and where applicable, statistically significant findings at the p≤.05 level are indicated by *. 1 95 percent confidence intervals for main impacts can be found in Appendix E.
EXHIBIT READS: The observed mean amount of time spent per daily reading block in instruction in phonemic awareness for first grade classrooms with Reading First was 2.07 minutes. The estimated mean amount of time without Reading First was 1.35 minutes. The impact of Reading First on the amount of time spent in instruction in phonemic awareness was 0.72 minutes (or 0.27 standard deviations), which was statistically significant at the p≤.05 level (p=.016). Sources: RFIS, Instructional Practice in Reading Inventory, spring 2005, fall 2005, and spring 2006
Student Engagement with Print
Measures of student engagement with print were obtained from direct observation of classrooms by trained observers. The measure of student engagement used in impact analyses is the per-classroom average of the percentage of students engaged with print across three sweeps in each classroom.

46 Interim Report: Impact Findings
Estimates of the impacts of Reading First on this outcome are presented in Exhibit 4.5. Findings in the exhibit indicate that at particular points in time during the observation, about half of the first and second grade students in schools with Reading First were engaged with print (46.9 percent of first-graders and 49.7 percent of second-graders, on average). For second grade in schools with Reading First, this represents a statistically significant decrease of 8.4 percentage points, relative to what is estimated to occur without Reading First. For first grade, this represents an impact that was not statistically significant. The percentage of students engaged with print was 4.6 points greater for schools with Reading First relative to what was estimated to occur without Reading First. Referring back to Exhibit 4.2, the impact estimates and their 95 percent confidence intervals are displayed visually, in effect size terms, for student engagement with print. As with other outcomes, a composite test was conducted that pools findings across grades; it was not statistically significant. The estimated effect size of the impact of Reading First on the index of percentage of students engaged with print is 0.07 standard deviations and its p-value is 0.710. The statistically significant impact for second grade classrooms should therefore be interpreted with caution.
Exhibit 4.5: Estimated Impacts on the Percentage of Students Engaged with Print: Fall 2005 and Spring 20061
Construct
Actual Mean with
Reading First
Estimated Mean
without Reading
First
Impact (percentage
points)
Effect Size of Impact
Statistical Significance
of Impact (p-value)
Percentage of students engaged with print Grade 1 46.92 42.29 4.63 0.16 (0.216)
Grade 2 49.72 58.14 -8.42* -0.29* (0.030)
Notes: The complete RFIS sample includes 248 schools from 18 sites (17 districts and one state) located in 13 states. 125 schools are Reading First schools and 123 are non-Reading First schools. The effect size of the impact is the impact divided by the actual standard deviation of the outcome for the non-Reading First Schools pooled across the fall 2005 and spring 2006 STEP data (by grade). Values in the “Actual Mean with Reading First” column are actual, unadjusted values for Reading First schools; values in the “Estimated Mean without Reading First” column represent the best estimates of what would have happened in RF schools absent RF funding and are calculated by subtracting the impact estimates from the RF schools’ actual mean values. A two-tailed test of significance was used, and where applicable, statistically significant findings at the p≤.05 level are indicated by *. 1 95 percent confidence intervals for main impacts can be found in Appendix E.
EXHIBIT READS: The observed average percentage of students engaged with print in first grade classrooms with Reading First was 46.92 percent. The estimated average percentage without Reading First was 42.29 percent. The impact of Reading First on the average percentage of student engagement with print was 4.63 percentage points (or 0.16 standard deviations), which was not statistically significant at the p≤.05 level (p=.216).
Source: RFIS, Student Time-on-Task and Engagement with Print, fall 2005 and spring 2006.

Interim Report: Impact Findings 47
Variation in Impacts Across Sites
As discussed in Chapter 2, the impacts presented above reflect an average aggregated across the 18 study sites. To the degree that there is variation in impacts across the sites, the overall average may be masking important differences in the effectiveness (or lack of effectiveness) of Reading First under some conditions. For example, the participating sites differ in terms of the amount of Reading First program funds allocated per school or student as well as when they could first access Reading First grant funding. While the study is not designed to establish causal relationships between differences across sites in Reading First impacts and differences in site characteristics, an assessment of variation provides a context for interpreting the overall average impacts. Variation in Impacts on Reading Comprehension
Exhibit 4.6 illustrates the variation across sites of estimated program impacts on reading comprehension scaled scores.48 This exhibit presents separate graphs for each grade, and it displays mean impact estimates and 95 percent confidence intervals for each site. Here, too, the wider the confidence interval, the broader the margin of error and the greater the uncertainty about the estimate. For first grade, for example, the site-by-site estimates range from a decrease of 0.5 standard deviations to an increase of 0.7 standard deviations; 13 estimates are positive and five are negative. On balance, for grade one, confidence intervals for all negative impact estimates and all but three positive impact estimates include zero. Note that the RFIS was not designed to be able to detect differences at the site level. To examine cross-site variability in impacts more systematically, a composite F-test was used to assess the null hypothesis that there were no statistically significant differences across the site-level impacts on reading comprehension test scores. This test was conducted for each grade separately and then with all grades pooled together (see Exhibit 4.7). The exhibit shows that the p-value for the grade one F-test was 0.06; the null hypothesis cannot be rejected and thus, site-to-site variation was not statistically significant, and cannot be distinguished from zero reliably. The statistical tests of site-to-site variation in impacts on reading comprehension test scores for grades two and three follow a similar pattern. For all three grades, the estimated variation in impacts on test scores across sites was not systematically different from the variations that could occur by chance. Even though the observed variation encompasses more than one full standard deviation of the reading test score measure, the variation was not statistically significant. The lack of significance is not surprising, given the limited statistical power for estimating variation across sites, due to the small number of sites (18) and to the weak precision of impact estimates by site (an average of 14 schools per site). As a result, it is not possible to determine the true extent to which program impacts vary across study sites with confidence.
48 Each grade-specific graph presents impact estimates in numerical (ascending) order; therefore each graph
(by grade and by outcome) presents sites in a different order.
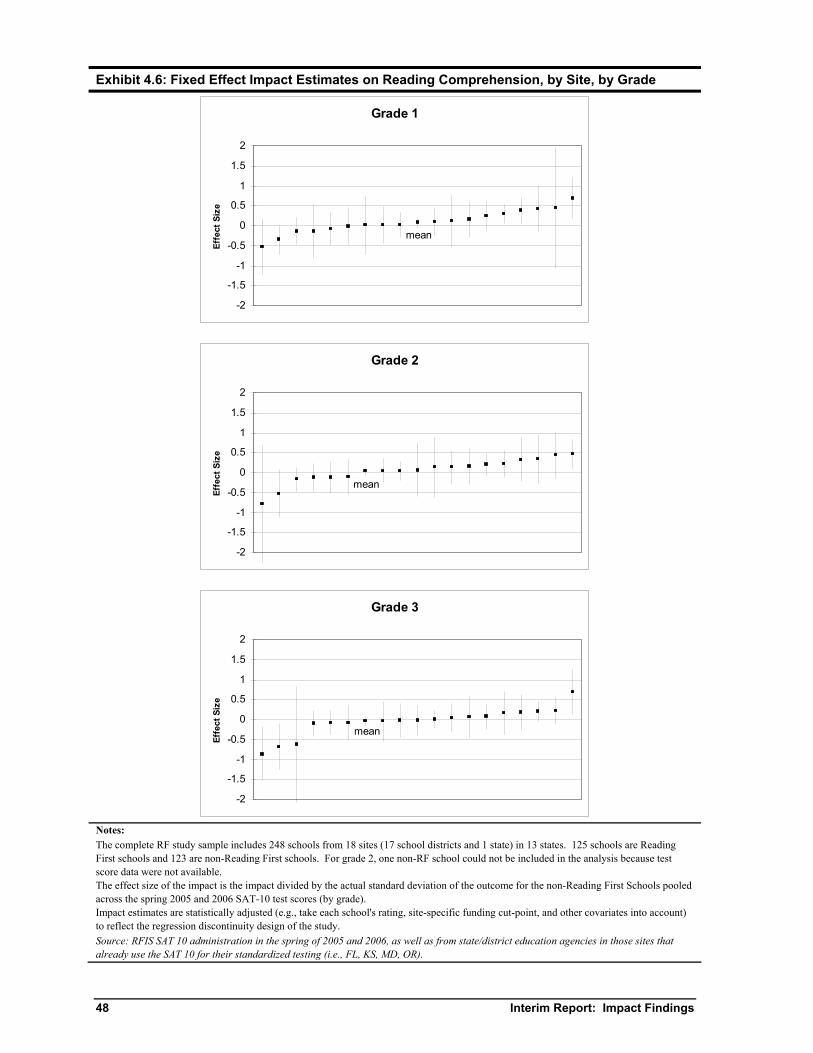
48 Interim Report: Impact Findings
Exhibit 4.6: Fixed Effect Impact Estimates on Reading Comprehension, by Site, by Grade
Grade 1
mean
-2
-1.5
-1
-0.5
0
0.5
1
1.5
2
Effe
ct S
ize
Grade 2
mean
-2
-1.5
-1
-0.5
0
0.5
1
1.5
2
Effe
ct S
ize
Grade 3
mean
-2
-1.5
-1
-0.5
0
0.5
1
1.5
2
Effe
ct S
ize
Notes: The complete RF study sample includes 248 schools from 18 sites (17 school districts and 1 state) in 13 states. 125 schools are Reading First schools and 123 are non-Reading First schools. For grade 2, one non-RF school could not be included in the analysis because test score data were not available. The effect size of the impact is the impact divided by the actual standard deviation of the outcome for the non-Reading First Schools pooled across the spring 2005 and 2006 SAT-10 test scores (by grade). Impact estimates are statistically adjusted (e.g., take each school's rating, site-specific funding cut-point, and other covariates into account) to reflect the regression discontinuity design of the study. Source: RFIS SAT 10 administration in the spring of 2005 and 2006, as well as from state/district education agencies in those sites that already use the SAT 10 for their standardized testing (i.e., FL, KS, MD, OR).

Interim Report: Impact Findings 49
Exhibit 4.7: Results of Composite F-Test for Variation in Site Level Impacts
Outcome p-value Reading Comprehension Scaled Score Grade 1 (0.063) Grade 2 (0.294) Grade 3 (0.102) All Grades (0.096) Minutes in Five Dimensions Grade 1 (0.518) Grade 2 (0.129) All Grades (0.244) Percentage of Student Engagement with Print Grade 1 (0.007)* Grade 2 (0.212) All Grades (0.009)*
Notes:
The complete RFIS sample includes 248 schools from 18 sites (17 school districts and 1 state) located in 13 states. 125 schools are Reading First schools and 123 are non-Reading First schools. For grade 2, one non-RF school could not be included in the analysis because test score data were not available. Impact estimates are statistically adjusted (e.g., take each school's rating, site-specific funding cut-point, and other covariates into account) to reflect the regression discontinuity design of the study. A two-tailed test of significance was used, and where applicable, statistically significant findings at the p≤.05 level are indicated by *. EXHIBIT READS: The p-value for the joint F-test that tests whether the program impact is the same across all sites for first grade reading comprehension is 0.063, which is not statistically significant at the p≤.05 level.
Sources: RFIS SAT 10 administrations in the spring of 2005 and 2006, as well as from state/district education agencies in those sites that already used the SAT 10 for their standardized testing (i.e., FL, KS, MD, OR); RFIS Instructional Practice in Reading Inventory, spring 2005, fall 2005, and spring 2006; and RFIS Student Time-on-Task and Engagement with Print, fall 2005 and spring 2006.
Variation in Impacts on Reading Instruction
The site-by-site variation in estimated program impacts on minutes of instruction in the five dimensions is illustrated in graphs similar to those shown in Exhibit 4.6 (see Appendix F). For first grade, for example, the site-by-site estimates range from a decrease of 17 minutes (an effect size of -0.81 standard deviations) to an increase of 27 minutes (an effect size of 1.29 standard deviations) per daily reading block; three estimates were negative and 15 were positive. The middle rows in Exhibit 4.7 show the results of statistical tests of the site-to-site variation in impacts on instructional time in the five dimensions of reading instruction. The p-values of the F-tests (0.52 for grade one and 0.13 for grade two) indicate that the variation in estimated impacts for grade one and grade two was not statistically significant, even though the observed differences among impact estimates across sites covers more than two standard deviations of the instructional time measure. The lack of statistical significance is due to lack of statistical power for estimating cross-site variation in impacts on instructional behaviors, as was the case for estimating cross-site variation in impacts on reading comprehension, noted earlier. Variation in Impacts on Student Engagement with Print
Appendix F also presents graphs that are similar to Exhibit 4.6 to illustrate the site-by-site variation of estimated program impacts on percentage of students engaged with print. For second grade, for

50 Interim Report: Impact Findings
example, the estimates range from a decrease of 71 percentage points to an increase of nearly 28 percentage points; 12 estimates are negative and six are positive. Corresponding findings in the third set of numbers in Exhibit 4.7 show that the p-values for these F-tests of cross-site variation in impacts on student engagement with print were 0.01 for grade one and 0.21 for grade two. This suggests that the variation for grade one was statistically significant while it was not for grade two. When samples were combined across grades one and two, the test for site-to-site variation in impacts was also statistically significant. Alternative Approaches to Weighting: Implications of Variation in Impacts Across Sites
To the extent that overall average impacts vary across sites, alternative approaches to weighting can yield different results. Recall that this study is using a weighting strategy that weights each site estimate in proportion to the number of RF schools in that site; this approach yields impact estimates for the average RF school in the study sample. To gauge the sensitivity of the impacts to weighting, the average impacts were re-estimated using two weighting strategies that had initially been considered for the study. One alternative is to weight site-specific impact estimates in proportion to each site’s number of Reading First students (rather than its number of Reading First schools), which produces impact estimates for the average Reading First student in the study sample. The second alternative is to specify one treatment indicator for all sites, instead of specifying site-specific treatment indicators and then averaging their coefficients. This is called a pooled estimator rather than a weighted estimator, because it pools data for the full sample directly into a single average impact estimate. It should be noted, however, that the pooled estimator, like any other, represents a weighting of impact estimates across sites. The implicit weights for this strategy were approximately proportional to the precision of impact estimates for each site, which in turn reflect the site’s sample size and study design.49 Appendix B compares estimates of the average impacts of Reading First produced by the weighting strategy used in this study and two other alternative approaches to weighting. Results are presented for estimates of impacts on reading comprehension, instruction in the five dimensions, and percentage of students engaged with print. For reading comprehension (in effect size terms), the alternative estimates range from 0.03 to 0.11 standard deviations for grade one, from 0.00 to 0.07 standard deviations for grade two, and from -0.04 to 0.02 standard deviations for grade three. Estimates using the weighting strategy chosen for this study were generally between those for the other two strategies. Only the pooled estimate for grade one was statistically significant.
49 This alternative strategy weights each site’s impact estimate in proportion to its total amount of “free”
(non-collinear) variation in treatment status across schools, which is the major factor that determines the precision of these estimates. For detailed explanation and an application of this approach for an experiment, see Cullen, Jacob and Levitt, 2006).

Interim Report: Impact Findings 51
For instruction in the five dimensions, alternative estimates range from estimated increases of 8.52 minutes to 8.79 minutes per daily reading block for grade one and 11.75 minutes to 12.38 minutes per daily reading block for grade two. All of these estimates were statistically significant. For student engagement with print, alternative estimates ranged from 3.39 to 4.63 percentage points for grade one (none of which were statistically significant) and from -5.82 to -8.42 percentage points for grade two (the larger two of which were statistically significant). In summary, there is some fluctuation due to weighting approaches used to average findings across sites. The overall conclusions of the findings reported here would not change, however, as a function of the approach to weighting. Differences in Impacts by Length of Time That Reading First Funding Was Available
Study sites received their Reading First grants between April, 2003 and August, 200450 and the follow-up data available for this report encompass the 2004-2005 and 2005-2006 school years. Hence, the follow-up periods for this report represent different lengths of time during which sites (and schools within sites) had access to Reading First funds, and therefore had different amounts of time to use those funds to work with teachers and students. Prior research suggests that complex educational initiatives take time to implement fully and that program effectiveness may improve as the program matures (Aladjem et al., 2006; Bloom, 2001; Borman et al., 2003). Consequently, the study team hypothesized that Reading First implementation would mature over time, and that the impact of Reading First on teachers’ classroom instruction and students’ reading comprehension would increase. In addition, the longer Reading First funds were used within schools, the more likely it is that individual students would experience cumulative exposure to Reading First-funded activities across grades. The study team recognized that an overall average impact estimate might mask differences in impacts, if the findings suggested that the amount of time Reading First funds had been available was related to differences in impacts. Schools that received Reading First funds in 2003, for example, could have had up to three full school years to implement Reading First activities by the end of 2005-2006, whereas schools funded in 2004 could have had up to two full years to implement Reading First-funded activities. The study team sought to account for the variation in the length of time that sites had access to Reading First funds by designating two groups of sites: those for which funding was first made available between April and December 2003 (early award sites) and those whose funding became available between January and August 2004 (late award sites). There are 10 sites and 111 schools in
50 Information about the public announcement of the grant awards was compiled by SEDL (2004).
Information about when funds were available to sites was confirmed by telephone with state and district Reading First Coordinators. The study relies on the dates when sites first had access to their Reading First funding grants, because those signify when sites could access Reading First funds from their grants to purchase materials and to support professional development activities associated with the implementation of their reading programs. In some cases, the public announcement of the grant awards came several months earlier.

52 Interim Report: Impact Findings
the early award group, and 8 sites and 137 schools in the late award group. As of May 2005 (the end of the first wave of data collection for the RFIS), early and late award sites had had Reading First funding available for an average of 22 and 13 months, respectively. As of May 2006 (the end of the second data collection period for the study), early and late award sites had had access to Reading First grants for an average of 34 and 25 months, respectively. Analyses were conducted to examine the relationship between how long sites had had access to Reading First funding and observed impacts on instructional and achievement outcomes. Observed changes in impacts from the first to second year of RF funding can be reported for late award sites only, given the study’s data collection schedule, which began in school year 2004-05 and continued through 2006-07. The early award sites received their first year of funding in the 2003-04 school year, when the study had not yet begun to collect data. Therefore, for the early award sites the study can observe changes in impacts from the second to the third year of funding only. The study will be able to report on changes from the second to third year of funding for late award sites in the final report, which will include data from 2006-07. Exhibit 4.8 summarizes the findings for these analyses by displaying the impacts for Implementation Years 1 and 2, which correspond to calendar years 2005 and 2006, for late award sites (Panel 1) and for Implementation Years 2 and 3 (or 2005 and 2006) for early award sites (Panel 2).51 None of the year-to-year differences in impacts was statistically significant for either the late award sites (Panel 1) or the early award sites (Panel 2). Thus, Reading First’s impacts on student reading comprehension and teachers’ instructional behaviors do not appear to have increased (or decreased) systematically over time as the sites gained more experience with the program. Findings for late award sites indicate statistically significant and positive impacts on the percentage of Grade 1 students reading at or above grade level in Year 2 and the percentage of Grade 2 students reading at or above grade level in Year 1. Also, for late award sites, Reading First produced positive and statistically significant impacts on minutes of instruction in the five dimensions for Grades 1 and 2 in both Year 1 and Year 2. None of the estimated impacts for early award sites was statistically significant, although the direction of (not significant) estimated impacts on the percentage of students reading at or above grade level was negative for all three grades. Also, the (nonsignificant) estimated impacts on instruction in the five dimensions for early award sites were positive. On balance, the findings in Exhibit 4.8 do not support the hypothesis that program impacts increased with program maturity.
51 This table does not include impacts on the percentage of students engaged with print because these data are
available for one year only. Impacts for all outcomes by subgroup by year can be found in Appendix G.

Interim Report: Impact Findings 53
Exhibit 4.8: Estimated Impacts on Reading Comprehension and Minutes in the Five Dimensions, by Implementation Year, Calendar Year, and Award Status
Implementation Year Year 1 Year 2 Year 3 Impact (p-value) Impact (p-value) Impact (p-value)
Panel 1 Late Award Sites 2005 2006 2007 Grade 1 Percent reading at or above
grade level (%) 6.3 (0.077) 9.4* (0.024) N/A N/A
Instruction in five dimensions (minutes)
11.51* (0.001) 12.03* (0.004) N/A N/A
Grade 2 Percent reading at or above
grade level (%) 6.3* (0.028) 5.7 (0.155) N/A N/A
Instruction in five dimensions (minutes)
14.84* (<0.001) 16.11* (<0.001) N/A N/A
Grade 3 Percent reading at or above
grade level (%) 1.7 (0.537) 4.2 (0.269) N/A N/A
Instruction in five dimensions (minutes)
N/A N/A N/A N/A N/A N/A
Panel 2 Early Award Sites 2004 2005 2006 Grade 1 Percent reading at or above
grade level (%) N/A N/A -2.6 (0.708) -1.9 (0.751)
Instruction in five dimensions (minutes)
N/A N/A 5.49 (0.376) 4.16 (0.457)
Grade 2 Percent reading at or above
grade level (%) N/A N/A -8.2 (0.163) -6.8 (0.303)
Instruction in five dimensions (minutes)
N/A N/A 10.93 (0.083) 4.56 (0.410)
Grade 3 Percent reading at or above
grade level (%) N/A N/A -9.9 (0.110) -7.7 (0.225)
Instruction in five dimensions (minutes)
N/A N/A N/A N/A N/A N/A
Notes: The complete RF study sample includes 248 schools from 18 sites (17 school districts and 1 state) located in 13 states. 125 schools are Reading First schools and 123 are non-Reading First schools. For grade 2, one non-RF school could not be included in the analysis because test score data were not available. Implementation year represents the number of years since sites received notice of their Reading First grants. For early award sites, this occurred in 2003, and Year 1, 2, and 3 refer to the 2003-2004, 2004-2005, and 2005-2006 school years, respectively. For late award sites, notification of funding occurred in 2004, and Years 1 and 2 refer to the 2004-2005 and 2005-2006 school years, respectively (data are available for the 2004-2005 and 2005-2006 school years only). Impact estimates are statistically adjusted (e.g., take each school's rating, site-specific funding cut-point, and other covariates into account) to reflect the regression discontinuity design of the study. A two-tailed test of significance was used, and where applicable, statistically significant findings at the p≤.05 level are indicated by *. EXHIBIT READS: The impact of Reading First on the percent of students reading at or above grade level in grade one, for late award sites, in implementation Year 1 and Calendar Year 2005, was 6.3 percentage points, which was not statistically significant at the p≤.05 level (p=.077).
Sources: RFIS SAT 10 administration in the spring of 2005 and 2006, as well as from state/district education agencies in those sites that already use the SAT 10 for their standardized testing (i.e., FL, KS, MD, OR); and RFIS Instructional Practice in Reading Inventory, spring 2005, fall 2005, and spring 2006.

54 Interim Report: Impact Findings
The following sections examine the unexpected pattern of differences across groups of sites more systematically. First, impacts were estimated with data pooled across follow-up periods to increase precision. Next, the discussion describes other differences between the two groups of sites and explores whether impacts varied systematically with these differences. Differences in Impacts for Early and Late Award Sites
Exhibit 4.9 presents estimates of Reading First impacts on reading comprehension scores. None of the estimated impacts for early award sites were statistically significant; estimated impacts for the early award sites were negative— - 0.2, - 4.8, and - 7.0 scaled score points—equivalent to effect sizes of 0.00, - 0.11, and - 0.17 standard deviations, respectively. In contrast, estimates for late award sites were positive for all three grades (6.6, 6.1, and 2.4 scaled score points) and were statistically significant for grades one and two. These findings were equivalent to effect sizes of 0.13, 0.14, and 0.06 standard deviations, respectively. Exhibit 4.9 illustrates a similar pattern of findings for program impacts on the percentage of students reading at or above grade level. Differences in impacts on reading comprehension test scores between early and late award sites were statistically significant for grades two and three, and not statistically significant for grade one (see bottom panel, Exhibit H.1). As with the full sample impact analysis, a composite test was conducted to assess the overall difference in program impacts on student reading comprehension by creating an index which combines scaled scores with indicators of student performance at or above grade level and which pools the data for all three grades. The test demonstrates that overall, Reading First produced a positive and statistically significant impact on reading test scores for the late award sites, and that the estimated impact for the early award sites was negative but not statistically significant. The test also indicates that the overall difference in impacts on test scores between the two groups of sites was statistically significant.

Interim Report: Impact Findings 55
Exhibit 4.9: Estimated Impacts on Reading Comprehension: Spring 2005 and 2006, by Award Status
Actual Mean with
Reading First
Estimated Mean
without Reading
First Impact
Effect Size of Impact
Statistical Significance
of Impact (p-value)
Early Award Sites Scaled Score Grade 1 546.7 547.0 -0.22 0.00 (0.966) Grade 2 587.3 592.0 -4.78 -0.11 (0.290) Grade 3 612.2 619.1 -6.98 -0.17 (0.101) Percent Reading At or Above Grade Level Grade 1 48.0 50.4 -2.34 N/A (0.665) Grade 2 41.0 48.7 -7.69 N/A (0.140) Grade 3 41.8 50.9 -9.04 N/A (0.081)
Late Award Sites
Scaled Score Grade 1 540.3 533.7 6.58* 0.13* (0.039) Grade 2 582.0 575.9 6.09* 0.14* (0.021) Grade 3 605.5 603.0 2.43 0.06 (0.283) Percent Reading At or Above Grade Level Grade 1 43.3 35.8 7.55* N/A (0.011) Grade 2 37.2 31.1 6.10* N/A (0.023) Grade 3 34.8 31.8 2.97 N/A (0.245) Notes: The complete RF study sample includes 248 schools from 18 sites (17 school districts and 1 state) located in 13 states. 125 schools are Reading First schools and 123 are non-Reading First schools. For grade 2, one non-RF school could not be included in the analysis because test score data were not available. There are 8 late award sites, with 137 schools, and 10 early award sites, with 111 schools. The effect size of the impact is the impact divided by the actual standard deviation of the outcome for the non-Reading First Schools pooled across the spring 2005 and 2006 SAT-10 test scores (by grade). Values in the “Actual Mean with Reading First” column are actual, unadjusted values for Reading First schools; values in the “Estimated Mean without Reading First” column represent the best estimates of what would have happened in RF schools absent RF funding and are calculated by subtracting the impact estimates from the RF schools’ actual mean values. A two-tailed test of significance was used, and where applicable, statistically significant findings at the p≤.05 level are indicated by *. EXHIBIT READS: The observed mean reading comprehension score for first-graders with Reading First in the early award sites was 546.7 scaled score points. The estimated mean without Reading First was 547.0 scaled score points. The impact of Reading First was -0.2 scaled score points (or 0.00 standard deviations), which was not statistically significant at the p≤.05 level (p=.966). The observed average percent reading at or above grade level for first-graders with Reading First in the early award sites was 48.0 percentage points. The estimated average percent without Reading First was 50.4 percentage points. The impact of Reading First on the percent of first grade students reading at grade level was -2.3 percentage points, which was not statistically significant at the p≤.05 level (p=.665).
Sources: RFIS SAT 10 administration in the spring of 2005 and 2006, as well as from state/district education agencies in those sites that already use the SAT 10 for their standardized testing (i.e., FL, KS, MD, OR).

56 Interim Report: Impact Findings
Exhibit 4.10 presents estimates of Reading First impacts on classroom instruction. For early award sites, estimated impacts on the number of minutes of instruction in the five dimensions of reading instruction were not statistically significant. In Grade 2, Reading First increased the incidence of high quality student practice. For late award sites, the findings indicate that Reading First produced positive and statistically significant impacts on teachers’ instructional behavior, increasing time in the five dimensions by 11.6 minutes per daily reading block for Grade 1 and 15.6 minutes for Grade 2. These results were equivalent to effect sizes of 0.56 and 0.74 standard deviations, respectively. There was no clear pattern in Exhibit 4.10 for differences in program impacts in grades 1 and 2 across the two award groups on highly explicit instruction or high quality student practice. With one exception, the differences in impacts between early and late award sites were not statistically significant. In Grade 2, however, the difference between the estimated impact in early award sites and the estimated impact in late award sites on the highly explicit instruction measure was statistically significant. The impact was greater in the late award sites. The differences in estimated impacts on student engagement with print across the award subgroups were not statistically significant. These differences were consistent with observed differences in impacts on test scores. Exhibit 4.11 indicates that estimated impacts on student engagement with print for the early award sites were negative, while those for the late award sites were either positive or less negative. The overall difference in impacts on classroom instruction was evaluated using a composite test using an index that combines the three instructional outcomes and pools data from first and second grades. The composite test suggests that overall, Reading First produced a positive and statistically significant impact on reading instruction in the late award sites, and that the estimated impact in the early award sites was positive but not statistically significant. The overall difference in impacts on instruction between the two groups of sites was not statistically significant.

Interim Report: Impact Findings 57
Exhibit 4.10: Estimated Impacts on Reading Instruction, by Award Status
Instructional Outcomes
Actual Mean with
Reading First
Estimated Mean
without Reading
First Impact
Effect Size of Impact
Statistical Significance
of Impact (p-value)
Early Award Sites
Number of minutes of instruction in five dimensions combined
Grade 1 62.6 57.8 4.73 0.23 (0.336) Grade 2 64.0 56.5 7.49 0.35 (0.149) Percent of intervals in five dimensions with highly explicit instruction
Grade 1 30.8 26.4 4.32 0.24 (0.080) Grade 2 31.7 29.3 2.39 0.12 (0.391) Percent of intervals in five dimensions with high quality student practice
Grade 1 19.3 20.1 -0.85 -0.05 (0.720) Grade 2 18.6 13.3 5.26* 0.29* (0.022)
Late Award Sites
Number of minutes of instruction in five dimensions combined
Grade 1 56.9 45.4 11.57* 0.56* (0.001) Grade 2 56.2 40.5 15.63* 0.74* (<0.001) Percent of intervals in five dimensions with highly explicit instruction
Grade 1 29.0 25.9 3.14 0.18 (0.135) Grade 2 31.4 21.0 10.46* 0.54* (<0.001) Percent of intervals in five dimensions with high quality student practice
Grade 1 19.2 16.9 2.27 0.14 (0.223) Grade 2 18.9 16.3 2.61 0.15 (0.162)
Notes: The complete RF study sample includes 248 schools from 18 sites (17 school districts and 1 state) located in 13 states. 125 schools are Reading First schools and 123 are non-Reading First schools. There are 8 late award sites, with 137 schools, and 10 early award sites, with 111 schools. The effect size of the impact is the impact divided by the actual standard deviation of the outcome for the non-Reading First Schools pooled across the spring 2005, fall 2005, and spring 2006 IPRI data (by grade). Values in the “Actual Mean with Reading First” column are actual, unadjusted values for Reading First schools; values in the “Estimated Mean without Reading First” column represent the best estimates of what would have happened in RF schools absent RF funding and are calculated by subtracting the impact estimates from the RF schools’ actual mean values. A two-tailed test of significance was used, and where applicable, statistically significant findings at the p≤.05 level are indicated by *. EXHIBIT READS: The observed mean amount of time spent in instruction in the five dimensions (phonemic awareness, phonics, vocabulary, fluency, and comprehension) in first grade classrooms with Reading First in early award sites was 62.6 minutes. The estimated mean amount of time without Reading First was 57.8 minutes. The impact of Reading First on the amount of time spent in instruction in the five dimensions was 4.73 minutes (or 0.23 standard deviations), which was not statistically significant at the p≤.05 level (p=.336).
Sources: RFIS Instructional Practice in Reading Inventory, spring 2005, fall 2005, and spring 2006.

58 Interim Report: Impact Findings
Exhibit 4.11: Estimated Impacts on the Percentage of Students Engaged with Print: Fall 2005 and Spring 2006, by Award Status
Construct
Actual Mean with
Reading First
Estimated Mean
without Reading
First
Impact (percentage
points)
Effect Size of Impact
Statistical Significance
of Impact (p-value)
Grade 1 Early award schools 48.24 51.34 -3.10 -0.11 (0.622)
Late award schools 45.88 35.10 10.78* 0.37* (0.019)
Grade 2 Early award schools 50.76 66.53 -15.77* -0.55* (0.008)
Late award schools 48.93 52.18 -3.24 -0.11 (0.523)
Notes: The complete RF study sample includes 248 schools from 18 sites (17 school districts and 1 state) located in 13 states. 125 schools are Reading First schools and 123 are non-Reading First schools. The effect size of the impact is the impact divided by the actual standard deviation of the outcome for the non-Reading First Schools pooled across the fall 2005 and spring 2006 STEP data (by grade). Values in the “Actual Mean with Reading First” column are actual, unadjusted values for Reading First schools; values in the “Estimated Mean without Reading First” column represent the best estimates of what would have happened in RF schools absent RF funding and are calculated by subtracting the impact estimates from the RF schools’ actual mean values. A two-tailed test of significance was used, and where applicable, statistically significant findings at the p≤.05 level are indicated by *. EXHIBIT READS: The observed average percentage of students engaged with print in first grade classrooms with Reading First in early award sites was 48.24 percent. The estimated average percentage without Reading First was 51.34 percent. The impact of Reading First on the percentage of first grade students engaged with print in early award sites was –3.10 percentage points (or -0.11 standard deviations), which was not statistically significant at the p≤.05 level (p=.622). Sources: RFIS Student Time-on-Task and Engagement with Print, fall 2005 and spring 2006.
Exhibit 4.12 provides a visual representation of the preceding impact analyses for early and late award sites. There are three panels in the exhibit, one for each grade. Impact estimates (in effect size) for early award sites are represented by small squares, and their 95 percent confidence intervals are represented by vertical lines above and below each square; late award sites are represented by small circles. The wider the confidence interval, the less reliable the impact estimate. If a 95 percent confidence interval does not include zero, the estimated impact is statistically significant (p-value less than or equal to 0.05). These findings illustrate that for Grades 1 and 2, impacts for late award sites were consistently statistically significant and positive for both classroom instruction in the five dimensions of reading and student reading comprehension. The impacts on these outcomes were not statistically significant for the early award sites, and the pattern of impacts reflects a mix of positive and negative estimates.

Interim Report: Impact Findings 59
Exhibit 4.12: Estimated Impacts and Confidence Intervals for Key Outcomes, in Effect Size, by Grade, by Award Status
-1-0.8-0.6-0.4-0.2
00.20.40.60.8
1
Effe
ct S
ize
-1-0.8-0.6-0.4-0.2
00.20.40.60.8
1
Effe
ct S
ize
-1-0.8-0.6-0.4-0.2
00.20.40.60.8
1
Effe
ct S
ize
Notes: The complete RF study sample includes 248 schools from 18 sites (17 school districts and 1 state) located in 13 states. 125 schools are Reading First schools and 123 are non-Reading First schools. There are 10 early award sites, with 111 schools, and 8 late award sites, with 137 schools. For grade 2, one non-RF school could not be included in the analysis because test score data were not available. Impact estimates are statistically adjusted (e.g., take each school's rating, site-specific funding cut-point, and other covariates into account) to reflect the regression discontinuity design of the study. The effect size of the impact is the impact divided by the actual standard deviation of the outcome for the non-Reading First Schools pooled across the spring 2005 and 2006 SAT 10 test scores; spring 2005, fall 2005, and spring 2006 IPRI data; and fall 2005 and spring 2006 STEP data (by grade). EXHIBIT READS: For each outcome and grade level, impact estimates and 95 percent confidence intervals are presented in effect size terms. For grade 1, none of the impact estimates across the two award groups are statistically significantly different from each other, although for four of the five outcomes the estimates are (nonsignificantly) lower for the early award sites than for the late award sites. (See Exhibits 4.9, 4.10, and 4.11 for actual impact estimates by award status.) Source: RFIS SAT 10 administration in the spring of 2005 and 2006, as well as from state/district education agencies in those sites that already use the SAT 10 for their standardized testing (i.e., FL, KS, MD, OR); RFIS Instructional Practice in Reading Inventory, spring 2005, fall 2005, and spring 2006; and RFIS Student Time-on-Task and Engagement with Print, fall 2005 and spring 2006.
Early Late
Reading Comprehension
Minutes in 5 Dimensions
Highly Explicit Instruction
High Quality Stud Practice
Pct Engaged w/Print
Reading Comprehension
Minutes in 5 Dimensions
Highly Explicit Instruction
High Quality Stud Practice
Pct Engaged w/Print
Reading Comprehension
Grade 3
Grade 2
Grade 1

60 Interim Report: Impact Findings
The pattern of findings discussed above raises two important questions for the RFIS. First, what characteristics of these two groups of sites might help to explain the observed variation? The next section below attempts to shed some light on this question by describing some of the differences in characteristics, and by examining the relationship between differences in Reading First impacts and related differences in selected characteristics. Note that the analyses presented here are exploratory, and cannot provide definitive evidence about what caused the observed differences in impacts across the two groups. A second question arises when one considers the juxtaposition of impacts for late and early award sites. Specifically, in late award sites, where impacts on teachers’ instruction in the five dimensions were positive and statistically significant, impacts on reading comprehension test scores were consistently positive and statistically significant for Grades 1 and 2. In early award sites, estimated impacts on teachers’ instruction in the five dimensions were positive but not statistically significant, and estimated impacts on student reading comprehension were negative and not statistically significant. The study’s final report will explore the relationship between the magnitude of observed impacts on teachers’ instructional behavior and observed impacts on student reading comprehension. A Preliminary Exploration of Factors That Could Be Related to Program Impacts
This section presents a preliminary exploration of factors that could be related to the differences observed between the impacts of Reading First for early and late award sites. First, the two subgroups of sites are compared on a broad range of characteristics, some of which indicate statistically significant differences. Next, the discussion examines the relationship between program impacts and two selected characteristics of sites in more detail: (1) the amount of Reading First funding allocated per K-3 student in Reading First schools, and (2) the levels of reading comprehension exhibited by students in non-Reading First schools in fall 2004. It should be noted, however, that it is not possible to provide conclusive evidence about what caused the observed differences between Reading First impacts for early award sites and late award sites, for at least three reasons. First, given the small number of sites in the study sample and the high level of impact estimation error for each site, there is little statistical power to distinguish impact differences, whether across sites or across subgroups of sites. Thus, only large differences can be statistically significant. This is a consequence of the fact that the study was designed to provide valid and reliable estimates of overall average program impacts. A comprehensive examination of variations in impacts across sites or subgroups of sites would require a much larger sample than is represented in the RFIS. Second, there are more potential factors that could differentiate between the two subgroups of sites than there are sites in total; consequently, there are too few degrees of freedom to estimate a precise statistical model of the determinants of impacts by site. Third, holding aside the degrees of freedom issue, any such model can produce biased estimates because it cannot control for potentially important factors that have not been measured. For this set of reasons, the findings presented below can only be considered as suggestive. Nevertheless, the present analysis would be incomplete without having considered empirically which (observable) factors might be related to the differences in observed program impacts for the two subgroups of sites.

Interim Report: Impact Findings 61
Related Differences Between Site Award Subgroups
Other potentially relevant ways in which the two subgroups of sites differ provide a context for interpreting the observed impact differences for early and late award sites. Toward this end, Exhibits 4.13 and 4.14 provide as comprehensive a comparison of the two subgroups as is possible given available data. The information in Exhibit 4.13 indicates that:
• On average, late award sites allocated more Reading First funding per school and per student than did early award sites. Hence, there may have been a greater concentration of resources to produce change in the late award sites.
• On average, third grade students from schools without Reading First in the late award sites were less likely to be reading at grade level than those from the early award sites. There may have been a greater margin for improvement in the late award sites (since the study does not have data from early award sites from before they began their implementation of RF, it is not possible to know definitively that early award sites had more or less room for improvement).
Exhibit 4.13: Characteristics of Early and Late Award Sites
Characteristic Early Award Sites Late Award Sites
Average number of months of Reading First funding (current as of May 2006) 34 months 25 months
Percent of schools in LEA receiving a Reading First grant 35 percent 16 percent
Average Reading First grant amount (per school) $97,776 $143,850
Average Reading First grant amount (per student) $432 $574
Fall 2004 reading performance of comparison schools (percent of students at or above grade level–grades 1, 2, and 3) a
54 percent 43 percent
Notes: The complete RF study sample includes 248 schools from 18 sites (17 school districts and 1 state) located in 13 states. 125 schools are Reading First schools and 123 are non-Reading First schools. There are 10 early award sites, with 111 schools, and 8 late award sites, with 137 schools. a The RFIS SAT 10 administration in fall 2004 occurred an average of 15 months after Reading First funds were made available in early award sites and an average of 5 months after Reading First funds were made available in the late award sites. EXHIBIT READS: Schools in early award sites had received Reading First funding for an average of 34 months (as of May 2006).
Sources: RFIS SAT 10 administration in fall 2004, http://www.sedl.org/readingfirst/welcome.html, http://www.ed.gov/programs/readingfirst/awards.html

62 Interim Report: Impact Findings
Exhibit 4.14 compares baseline characteristics of the two subgroups of sites. The top panel compares their student characteristics, the middle panel compares their school characteristics, and the bottom line compares their prior test performance. Findings indicate that the two groups differ on several characteristics, including percent eligible for free and reduced price lunch, locale, and prior student reading performance.
Exhibit 4.14: Baseline Characteristics of RFIS Reading First Schools, by Award Status
Characteristic
Reading First Schools
(Early award sites)
Reading First Schools
(Late award sites) Differenceb
Statistical Significance of
Difference (p-value)
Students Demographic information Male (%) 52.0 52.5 -0.58 (0.245) Race (%)
Asian 2.0 4.0 -1.99* (0.033) Black 33.0 37.9 -4.87 (0.436) Hispanic 33.3 20.9 12.37* (0.025) White 31.2 36.7 -5.47 (0.327) American Indian/Alaskan 0.5 0.5 -0.04 (0.772)
Free and Reduced Price Lunch 68.3 79.8 -11.54* (0.001)
Schools Eligible for Title 1(%) 94.5 100.0 -5.45* (0.048) Locale (%)
Large City 18.2 55.7 -37.53* (<0.001) Mid-size City 74.5 7.1 67.40* (<0.001) Other 7.3 37.1 -29.87* (<0.001)
Size Total Number of Students 466.3 481.5 -15.20 (0.655) Number of Students in Grade 3 67.1 75.2 -8.11 (0.152) Student/Teacher Ratio 15.0 15.2 -0.23 (0.646)
Third Grade Reading Performance
Deviation from State RF Mean Proficiency Rate (%)a 1.8 -4.0 5.77* (0.009)
Number of Schools 55 70 Notes: The early sites include 111 schools from 10 sites located in 7 states; 55 schools are Reading First and 56 are non-Reading First schools. The late sites include 137 schools from 8 sites located in 8 states; 70 schools are Reading First and 67 are non-Reading First. a A school’s proficiency score is defined as the percentage of third grade students (or fourth or fifth grade when third grade is unavailable) in
the school who scored at or above the state-defined proficiency threshold on the state’s reading assessment. The values in this row represent the average percentage point deviation from the mean proficiency score for the Reading First schools in the state.
b A two-tailed test of significance was used, and where applicable, statistically significant findings at the p≤.05 level are indicated by *.
Sources: Data on baseline characteristics are from the Common Core of Data.

Interim Report: Impact Findings 63
Associations Between Program Impacts and Two Site Characteristics
Several exploratory analyses were conducted to examine potential relationships between the impacts of Reading First and the amount of Reading First funding per K-3 student and the fall 2004 reading achievement of students in non-Reading First schools. These analyses illustrate ways that relationships between site characteristics and program impacts can be studied. The analysis for each site characteristic has two parts. First, sites were separated into two subgroups based on the characteristic of interest. These subgroups were as balanced as possible with respect to the number of Reading First schools. Thus, the 18 study sites were split into two roughly equivalent subgroups based on their Reading First funding per K-3 student (after being ordered from lowest to highest per-student allocations). Estimated program impacts for the two subgroups were then compared. A similar analysis was conducted based on two subgroups of sites that were defined in terms of the test scores of students in non-Reading First schools (after being ordered from lowest to highest based on fall 2004 reading performance).52 Results of these analyses (see Exhibits H-4 to H-9, panel 3, in Appendix H) suggest some observed differences in impacts, although none of these differences was statistically significant. Hence, the tests do not provide reliable evidence of an existing relationship between program impacts and either Reading First funding per K-3 student or the fall 2004 student reading achievement in non-Reading First schools. A second part of the analysis was conducted for each of the two site characteristics by estimating an interaction between a continuous measure of the characteristic (at the site-level) and the treatment indicator (for Reading First status) in the statistical model used to estimate program impacts. The sign and size of the coefficient for this interaction reflects the linear relationship that exists between the impact of Reading First and the characteristic (or moderator). Results of these tests (see Appendix H) indicate that sites with higher allocations of Reading First funds per K-3 student had larger program impacts on student achievement than did sites with lower allocations. This relationship was statistically significant for grades one and two. Summary
At its core, Reading First is a federal funding process designed to influence local education policy and teacher behavior with the ultimate goal of improving student reading proficiency. Reading First funding deliberately targets classroom reading instruction as a necessary precursor to improved student reading performance. Yet improving students’ reading performance is a priority for all schools, and particularly for those whose students are reading below grade level. However, after up to three years of funding, the study finds, on average, that Reading First’s impact on student reading achievement was not statistically detectable. Furthermore, the Reading First Impact Study indicates that schools receiving Reading First grants are still well short of the program’s 52 For both analyses, a robustness test was conducted by repeating the analysis after dropping the site from
each subgroup that is closest to the cut-point between them. This was repeated again after dropping the two sites from each subgroup that are closest to the cut-point. The conclusion of each analysis was not highly sensitive to this deletion of sites, although levels of statistical significance declined with the corresponding decline in sample size.

64 Interim Report: Impact Findings
ultimate goal of ensuring that all students are reading at grade level by the end of third grade. Half or more of the third grade students in the study sample’s Reading First schools were performing below grade level three years into the initiative, according to SAT 10 grade level norms (which may differ from states’ definitions of on or above grade level). Yet the findings indicate that Reading First did produce some positive and statistically significant improvements in first and second grade students’ reading comprehension test scores in a group of sites that had received their RF funds between January and August 2004, and those same sites also experienced positive and statistically significant effects from Reading First on the instructional time that first and second grade teachers spent on the five dimensions of reading. The final report will address the question of whether changes in teacher instructional practices are associated with student reading performance. The RFIS has completed its third year of data collection, which will provide considerably more data for the final report, including an additional year of data on students’ reading comprehension, teachers’ classroom instruction (three years in total), and student engagement with print (two years in total). The final report will draw upon additional data collected in the 2006-07 school year, including assessments of first grade students’ decoding skills and surveys of educational personnel. The availability of these additional data will allow the study team to answer questions about the impact of Reading First more definitively, to explore relationships between observed impacts of Reading First on instructional outcomes and reading achievement, and to assess whether there are statistically significant and educationally meaningful variations in impacts. The additional data and analysis of factors that may influence the implementation and impact of the program may shed further light on the ability of Reading First to achieve its ultimate goal.

Interim Report: State and Site Award Data A-1
Appendix A
State and Site Award Data
Appendix A presents additional information on when Reading First Impact Study sample sites first received Reading First awards (Exhibit A.1).
Exhibit A.1: Award Date by Site in Order of Date when Reading First Funds Were First Made Available for Implementation
Date Initial Reading First Award Was
Announced
Date when Reading First Funds Were First
Made Available for Implementation
Site 9 03/2003 04/2003 Site 12 04/2003 05/2003 Site 2 06/2003 06/2003 Site 6 05/2003 06/2003 Site 5 02/2003 07/2003 Site 4 05/2003 07/2003 Site 18 06/2003 08/2003 Site 10* 10/2003 08/2003 Site 11* 10/2003 10/2003 Site 17* 08/2003 12/2003 Site 14 01/2004 02/2004 Site 8 01/2004 03/2004 Site 3 03/2004 04/2004 Site 13 01/2004 04/2004 Site 15 10/2003 05/2004 Site 1 05/2004 06/2004 Site 7 05/2004 06/2004 Site 16 03/2004 08/2004
Note: Sites 10, 11 and 17 “backdated” the point at which schools could begin spending their grant money. It is not an error that the schools appear to have been given their money before their grants were announced. Source: Reading First District Coordinators
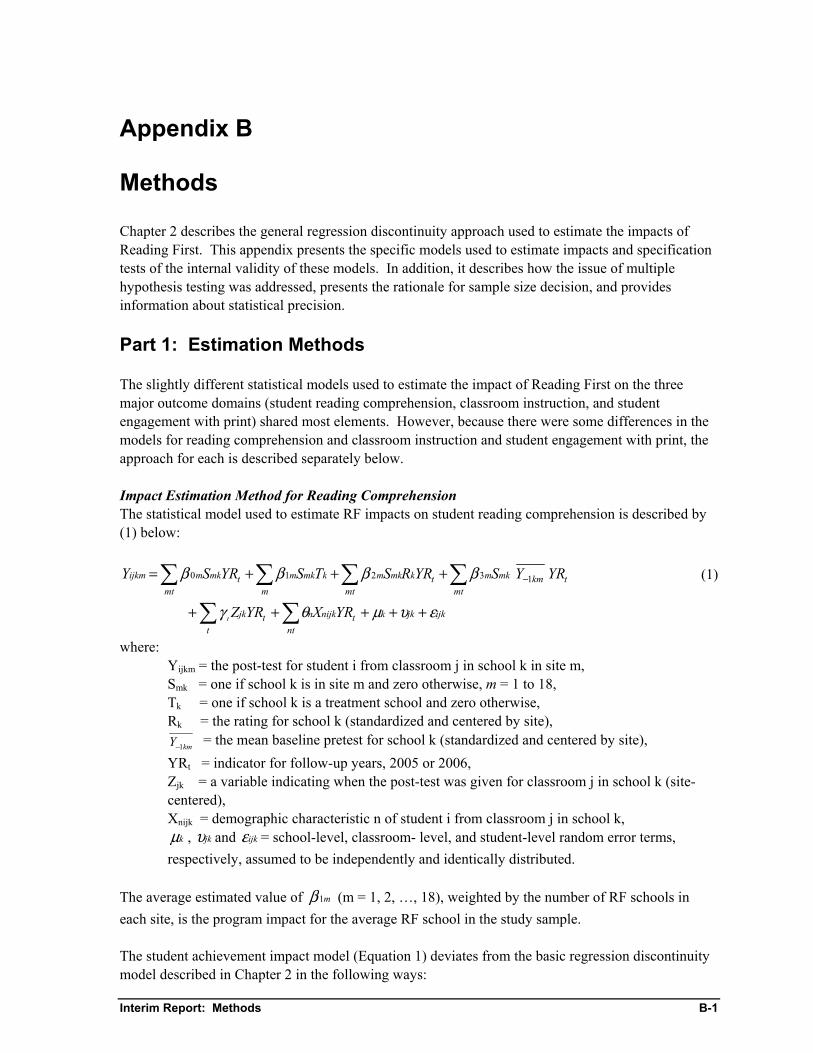
Interim Report: Methods B-1
Appendix B
Methods
Chapter 2 describes the general regression discontinuity approach used to estimate the impacts of Reading First. This appendix presents the specific models used to estimate impacts and specification tests of the internal validity of these models. In addition, it describes how the issue of multiple hypothesis testing was addressed, presents the rationale for sample size decision, and provides information about statistical precision. Part 1: Estimation Methods
The slightly different statistical models used to estimate the impact of Reading First on the three major outcome domains (student reading comprehension, classroom instruction, and student engagement with print) shared most elements. However, because there were some differences in the models for reading comprehension and classroom instruction and student engagement with print, the approach for each is described separately below. Impact Estimation Method for Reading Comprehension The statistical model used to estimate RF impacts on student reading comprehension is described by (1) below:
tkmmt mt mt
mkmtkmkm
m
kmkmtmkmijkm YRYSYRRSTSYRSY 13210 −∑ ∑ ∑∑ +++= ββββ (1)
∑∑ +++++nt
ijkjkktnijkn
ttjk YRXYRZt ευμθγ
where: Yijkm = the post-test for student i from classroom j in school k in site m, Smk = one if school k is in site m and zero otherwise, m = 1 to 18, Tk = one if school k is a treatment school and zero otherwise, Rk = the rating for school k (standardized and centered by site),
kmY 1− = the mean baseline pretest for school k (standardized and centered by site), YRt = indicator for follow-up years, 2005 or 2006, Zjk = a variable indicating when the post-test was given for classroom j in school k (site-centered), Xnijk = demographic characteristic n of student i from classroom j in school k,
kμ , jkυ and ijkε = school-level, classroom- level, and student-level random error terms, respectively, assumed to be independently and identically distributed.
The average estimated value of m1β (m = 1, 2, …, 18), weighted by the number of RF schools in each site, is the program impact for the average RF school in the study sample. The student achievement impact model (Equation 1) deviates from the basic regression discontinuity model described in Chapter 2 in the following ways:

B-2 Interim Report: Methods
• It is a multi-level model that reflects the nested structure of the data by accounting for three
levels of clustering in the estimation of standard errors: clustering of students within classrooms, classrooms within schools, and schools within study sites.
• Baseline covariates are added to the model to improve precision. These covariates include student gender, student age at start of school year,1 date of the post-test at the classroom level, and a school-level pre-program reading performance measure.2, 3
• The rating variable was not included in the model for the one site that assigned schools to Reading First and non Reading First groups randomly.
• In estimating pooled impacts for the combined sample from 2005 and 2006, the covariates for site, rating, pretest, test date, and demographic characteristics were interacted with an indicator for follow-up year (2005 or 2006).
Impacts on Classroom Instruction and Student Engagement with Print The impacts of Reading First on classroom instruction and student engagement with print were estimated using the following three-level model (with observations at level one, classrooms at level two, and schools at level three):
ijkjkkmt mt
tkmkmkm
mkmtmkmijkm YRRSTSYRSY ενμβββ +++++= ∑ ∑∑ 210 (2)
Where: Yijkm = the outcome measure for observation i from classroom j in school k in site m, Smk = one if school k is in site m and zero otherwise, (m= 1,2, …, 18), Tk = one if school k is a treatment school and zero otherwise, Rk = the rating for school k (standardized and centered by site), YRt = an indicator for follow-up waves spring 2005, fall 2005, or spring 2006, μk, νjk and εijk = school-level, classroom-level, and observation-level random error terms,
respectively, assumed to be independently and identically distributed. The impact estimate is the average estimated value of m1β (m = 1, 2, …, 18) weighted by number of treatment schools in each site. The impact estimation model for classroom instruction and student engagement with print described by (2) differs from the basic regression discontinuity model described in Chapter 2 as follows:
1 Age at start of the school year is each student’s age as of September 1 of the given year. For example, age
as of September 1, 2005 for the 2005-2006 school year. 2 Different pre-program performance measures were constructed for early and late award sites. For the 10
early award sites and one late award site (which had no fall 2004 test data due to a hurricane), performance on a state reading test (when available, we used an average of test scores from up to three pre-RF years) was used as a school level pretest measure. For late award sites except for the one without available fall 2004 data, the mean fall 2004 SAT 10 test scores for each school/grade were used as the pretest measure.
3 As a robustness test, the analysis was conducted without some or all of these additional covariates and the impact estimates stayed virtually unchanged. Results for these additional tests are available upon request.

Interim Report: Methods B-3
• It is a multi-level model that reflects the nested structure of the data by accounting for three
levels of clustering in the estimation of standard errors: clustering of observation days within classrooms, classrooms within schools, and schools within sites.
• A rating variable was not included in the model for the one site that assigned schools to Reading First and non Reading First groups randomly.
• In estimating pooled impacts for the combined sample from 2005 and 2006, the covariates for site and rating were interacted with an indicator for follow-up year (2005 or 2006).4
Impact tables throughout the report and appendices contain the actual, unadjusted mean outcomes for Reading First schools in the study sample (“Actual Mean with Reading First”) and the best estimate of what would have happened in RF schools absent RF funding (“Estimated Mean without Reading First”), as well as the impact estimates described above.5 Part 2: Assessing the Study’s Internal Validity
As noted earlier, in developing the study sample, Reading First schools and non-Reading First schools were selected to be as close as possible to their local cut-points for receipt of Reading First funding. This was done to yield two groups of schools that were as similar as possible. Exhibit B.1 presents means for both Reading First and non-Reading First schools included in the study for selected baseline school characteristics. In addition, program impacts were estimated using a linear regression discontinuity model that controls for values of the ratings used to choose schools for program funding. Furthermore, as discussed earlier, estimates of impacts on measures of student reading comprehension control explicitly for school-level baseline measures of reading achievement. This combination of sample design and statistical analysis was expected to provide internally valid estimates of program impacts. Three sets of specification tests were conducted to assess whether this expectation was met. Although none of these tests by itself can prove that internal validity was achieved, in combination they provide evidence that this is most likely the case. Each group of tests is described below.
• Baseline specification tests. These tests compare baseline characteristics of Reading First and non-Reading First schools through the lens of the linear regression discontinuity analysis. The purpose of these comparisons is to determine whether the combination of choosing schools that are close to their local cut-points and analyzing their differences with a linear regression discontinuity model yields estimates of residual differences that generally are not large or statistically significant.
4 Only one year of data are available for Student Engagement with Print, so no interactions with the follow-
up year were included in the estimation model. 5 The estimates of what would have happened in RF schools absent RF funding are calculated by subtracting
the impact estimates from the RF schools’ actual mean values.

B-4 Interim Report: Methods
Exhibit B.1: Observed Differences in Baseline Characteristics of Schools in the Study Sample: 2002-2003
Characteristic
Actual Mean
for Reading
First Schools
Actual Mean
for Non-Reading First Schools Difference
Statistical Significance of
Difference (p-value)
Students Male (%) 52.3 51.6 0.7* (0.049) Race (%)
Asian 3.1 3.3 -0.2 (0.670) Black 35.6 33.9 1.7 (0.532) Hispanic 26.7 22.5 4.1* (0.021) White 34.2 39.8 -5.6* (0.006) American Indian/Alaskan 0.5 0.5 0.0 (0.847)
Free Lunch and Reduced Lunch (%) 74.4 68.9 5.5* (0.002) Schools Eligible for Title I (%) 97.6 90.7 6.9* (0.013) Locale (%)
Large City 39.2 37.4 1.8 (0.476) Mid-size City 36.8 34.6 2.2 (0.434) Othera 24.0 28.0 -4.0 (0.286)
Size Total Number of Students 474.8 488.7 -13.9 (0.462) Number of Students in Grade 3 71.6 76.0 -4.4 (0.162) Student/Teacher Ratio 15.1 15.2 -0.1 (0.613) Third Grade Reading Performance Deviation from State RF Mean Proficiency Rate (%)b -1.3 1.8 -3.0* (0.019) Notes: The complete RF study sample includes 248 schools from 18 sites (17 districts and 1 state) located in 13 states. 125 schools are Reading First schools and 123 are non-Reading First schools. A two-tailed test of significance was used, and where applicable, statistically significant findings at the p ≤ .05 level are indicated by * a Other Locale includes urban fringe of a large city, urban fringe of a mid-sized city, large town, small town, and rural. b A school-’s proficiency score is defined as the percentage of third grade students (or fourth or fifth grade when third grade is unavailable) in
the school that score at or above the state-defined proficiency threshold on the state’s reading assessment. The values in this row represent the average percentage point deviation from the mean proficiency score for the Reading First schools in the state.
EXHIBIT READS: On average, , 52.3 percent of students in Reading First schools and 51.6 percent of students in non-Reading First schools were male. The difference on the percent of male students between Reading First and non-Reading First schools was 0.7 percentage points. The difference was statistically significant at the p≤.05 level (p=.049).
Sources: Data on baseline characteristics are from the Common Core of Data.
Results of the baseline specification tests are presented in Exhibit B.2. These findings were obtained using aggregate school-level baseline characteristics.6 The first column presents adjusted residual differences between Reading First schools and non-Reading First schools for the same selected baseline characteristics presented in Exhibit B.1. The second column presents p-values for each of these residual differences.
6 Baseline data were available at the school level only.

Interim Report: Methods B-5
Exhibit B.2: Estimated Residual Differences in Baseline Characteristics of Schools in the Study Sample: 2002-2003
Characteristic
Estimated Residual
Difference
Statistical Significance of
Difference (p-value)
Students Male (%) 0.9 (0.246) Race (%)
Asian 0.9 (0.363) Black -7.2 (0.199) Hispanic 3.3 (0.345) White 2.8 (0.503) American Indian/Alaskan 0.2 (0.182)
Free Lunch and Reduced Lunch (%) -6.0 (0.073) Schools Eligible for Title I (%) -1.4 (0.802) Locale (%)
Large City 4.3 (0.419) Mid-size City 9.1 (0.108) Othera -13.4 (0.083)
Size Total Number of Students -0.9 (0.982) Number of Students in Grade 3 -3.8 (0.558) Student/Teacher Ratio 0.1 (0.861) Third Grade Reading Performance Deviation from State RF Mean Proficiency Rate (%)b 4.3 (0.085) Notes: The complete RF study sample includes 248 schools from 18 sites (17 districts and 1 state) located in 13 states. 125 schools are Reading First schools and 123 are non-Reading First schools.
The “Estimated Residual Difference” is the adjusted residual difference between Reading First schools and non-Reading First schools estimated using the regression discontinuity model, which controls for each school’s rating. A two-tailed test of significance was used, and where applicable, statistically significant findings at the p≤.05 level are indicated by *. a Other Locale includes urban fringe of a large city, urban fringe of a mid-sized city, large town, small town, and rural. b A school’s proficiency score is defined as the percentage of third grade students (or fourth or fifth grade when third grade is unavailable) in
the school that score at or above the state-defined proficiency threshold on the state’s reading assessment. The values in this row represent the average percentage point deviation from the mean proficiency score for the Reading First schools in the state.
EXHIBIT READS: The estimated residual difference on the percent of male students between Reading First and non-Reading First schools was 0.9 percentage points. The difference was not statistically significant at the p≤.05 level (p=.246).
Sources: Data on baseline characteristics are from the Common Core of Data.
None of the residual differences in the exhibit are statistically significant. Hence, there is little evidence of residual differences in these school-level baseline characteristics. Results shown in the exhibit do not provide statistical evidence of substantial bias in impact estimates for the present report. Also, because impact estimates for student reading comprehension control explicitly for observed differences in school-level mean baseline test scores (typically the strongest predictor of future test scores), they provide further protection against bias. When examining the regression-adjusted baseline residual differences between Reading First schools and non-Reading First schools in Exhibit B.2, refer back to the unadjusted differences in Exhibit B.1. Findings in Exhibit B.1 represent differences that exist even though schools

B-6 Interim Report: Methods
in the two groups were chosen as close as possible to their local cut-points. Six of the 15 observed differences are statistically significant, three of which are larger and three of which are smaller in magnitude than their regression-adjusted counterparts in Exhibit B.2.
• Test of sensitivity to outlying values of the rating. These tests re-estimate program impacts
on student reading comprehension, classroom reading instruction, and student engagement with print, after sequentially setting aside pairs of schools from each site, starting with the highest and lowest ratings,7 then the second highest and lowest ratings, and then the third highest and lowest ratings. If the true conditional relationship between ratings and test scores is nonlinear, the impact estimates would be sensitive to the exclusion of these outermost schools, which have substantial influence on the estimation of slopes for the linear model.
Exhibits B.3, B.4, and B.5 present findings of the specification tests for impacts in the three outcome domains.8 The results indicate that estimates are not highly sensitive to the deletion of schools with especially high and low ratings, which is what would be expected if the regression discontinuity model for the study were specified properly.
• Test of sensitivity to non-linear relationships. These tests re-estimate impacts using: (1) a site-specific interaction model that allows the outcome/rating slope to differ between Reading First schools and non-Reading First schools (Model 2 in Exhibits B.4–B.6) and (2) a site-specific quadratic model that adds a quadratic function of the rating (Model 3 in Exhibits B.6–B.8) that tested whether the conditional relationship between student achievement and school ratings was curvilinear instead of linear.
Exhibits B.6, B.7, and B.8 show the specification test results for the three outcome domains. None of the added quadratic terms is statistically significant. In addition, the resulting estimates of the impacts of Reading First do not change appreciably when different functional forms of the rating are used, which indicates that the simple linear model in Equation 1 provides an adequate representation of the data and produces valid estimates of the impact of Reading First on student achievement.
Baseline specification tests for subgroups of sites. Exhibits B.9 and B.10 show differences in baseline characteristics for schools in the study sample within early award sites and late award sites. The first column in each exhibit presents adjusted residual differences between Reading First schools and non-Reading First schools for the selected baseline characteristics. The second column in each exhibit presents p-values for each of these residual differences.
7 Only the 11 sites that had 12 or more schools were included in the sample used for these tests, thus
allowing up to three pairs of schools to be dropped from analyses. 8 For ease of explication, the measures created from IPRI data are referred to as the five dimensions of
reading instruction (or “the five dimensions”) throughout the report. References to the programmatic emphases as required by legislation are labeled as the five essential components of reading instruction.

Interim Report: Methods B-7
Exhibit B.3: Sensitivity Tests for Reading Comprehension: Dropping Outermost Pair(s) (2005, 2006)
Grade Level 11-Site Sample1 Drop Outermost
Pair Drop Outermost
2 Pairs Drop Outermost
3 Pairs
Grade 1 Impact 0.91 0.46 3.11 4.96 SE 2.89 3.03 3.16 4.72 p-value (0.752) (0.880) (0.326) (0.293) Grade 2 Impact 1.28 0.59 1.50 2.96 SE 2.43 2.67 2.65 3.70 p-value (0.598) (0.824) (0.571) (0.424) Grade 3 Impact -0.85 -2.01 -1.87 -3.26 SE 2.19 2.32 2.60 3.78 p-value (0.699) (0.387) (0.472) (0.390)
Number of Sites 11 11 11 11 Number of Schools 195 173 151 129 Notes: Impact estimates are in scaled score points for the Stanford Achievement Test, 10th Edition (SAT 10).
A two-tailed test of significance was used, and where applicable, statistically significant findings at the p≤.05 level are indicated by *.
Impact estimates are statistically adjusted (e.g., take each school's rating, site-specific funding cut-point, and other covariates into account) to reflect the regression discontinuity design of the study. 1 This sample includes 11 of the 18 study sites, and 198 of the 248 study schools.
EXHIBIT READS: The impact of the Reading First program for grade 1 on reading comprehension was 0.91 scaled score points on average for the sample of 195 schools. The estimated impact was not statistically significant at the p≤.05 level (p=.752). The impact of the Reading First program on reading comprehension was 0.46 scaled score points on average for the sample of 173 schools remaining after one pair of schools furthest from the cut-point of the rating variable in each site was dropped. The estimated impact was not statistically significant at the p≤.05 level (p=.880). The impact of the Reading First program on reading comprehension scaled score was 3.11 scaled score points on average for the sample of 151 schools remaining after two pairs of schools furthest from the cut-point of the rating variable in each site were dropped. The estimated impact was not statistically significant at the p≤.05 level (p=.326). The impact of the Reading First program on reading comprehension was 4.96 scaled score points on average for the sample of 129 schools remaining after three pairs of schools furthest from the cut-point of the rating variable in each site were dropped. The estimated impact was not statistically significant at the p≤.05 level (p=.293).
Sources: RFIS SAT 10 administration in the Spring of 2005 and 2006, as well as from state/district education agencies in those sites that already used the SAT 10 for their standardized testing (i.e., FL, KS, MD, OR).

B-8 Interim Report: Methods
Exhibit B.4: Sensitivity Tests for Instruction: Dropping Outermost Pair(s) (2005, 2006)
Grade Level 11-Site Sample1 Drop Outermost
Pair Drop Outermost
2 Pairs Drop Outermost
3 Pairs
Grade 1 Impact 9.41* 9.57* 9.93* 8.73* SE 3.08 3.06 3.34 3.76 p-value (0.003) (0.002) (0.004) (0.022) Grade 2 Impact 14.34* 14.73* 13.74* 14.83* SE 3.09 3.27 3.56 4.09 p-value (<0.001) (<0.001) (<0.001) (<0.001)
Number of Sites 11 11 11 11 Number of Schools 195 173 151 129
Notes: Impact estimates are calculated using minutes of instruction in the five dimensions. A two-tailed test of significance was used, and where applicable, statistically significant findings at the p≤.05 level are indicated by *. Impact estimates are statistically adjusted (e.g., take each school's rating and site-specific funding cut-point into account) to reflect the regression discontinuity design of the study. 1 This sample includes 11 of the 18 study sites, and 198 of the 248 study schools in grade 1 and 194 of the 247 schools in grade 2.
EXHIBIT READS: The impact of the Reading First program for grade 1 on minutes of instruction in the five dimensions was 9.41 minutes on average for the sample of 195 schools. The estimated impact was statistically significant at the p≤.05 level (p=.003). The impact of the Reading First program on minutes of instruction in the five dimensions was 9.57 minutes on average for the sample of 173 schools remaining after one pair of schools furthest from the cut-point of the rating variable in each site was dropped. The estimated impact was statistically significant at the p≤.05 level (p=.002). The impact of the Reading First program on minutes of instruction in the five dimensions was 9.93 minutes on average for the sample of 151 schools remaining after two pairs of schools furthest from the cut-point of the rating variable in each site were dropped. The estimated impact was statistically significant at the p≤.05 level (p=.004). The impact of the Reading First program on minutes of instruction in the five dimensions was 8.73 minutes on average for the sample of 129 schools remaining after three pairs of schools furthest from the cut-point of the rating variable in each site were dropped. The estimated impact was statistically significant at the p≤.05 level (p=.022).
Sources: RFIS Instructional Practice in Reading Inventory, spring 2005, fall 2005, and spring 2006.

Interim Report: Methods B-9
Exhibit B.5: Sensitivity Tests for Student Engagement with Print: Dropping Outermost Pair(s) (2005, 2006)
Grade Level 11-Site Sample1 Drop Outermost
Pair Drop Outermost
2 Pairs Drop Outermost
3 Pairs
Grade 1 Impact 5.59 2.94 3.33 3.31 SE 4.13 4.30 4.70 4.92 p-value (0.178) (0.495) (0.480) (0.502) Grade 2 Impact -3.84 -3.97 -5.45 -3.00 SE 4.12 4.16 4.24 4.51 p-value (0.352) (0.342) (0.201) (0.508)
Number of Sites 11 11 11 11 Number of Schools 195 173 151 129
Notes: Impact estimates are calculated using percentage of students engaged with print. A two-tailed test of significance was used, and where applicable, statistically significant findings at the p≤.05 level are indicated by *. Impact estimates are statistically adjusted (e.g., take each school's rating and site-specific funding cut-point into account) to reflect the regression discontinuity design of the study. 1 This sample includes 11 of the 18 study sites, and 195 of the 248 study schools in grade 1 and 193 of the 246 schools in grade 2. EXHIBIT READS: The impact of the Reading First program for grade 1 on the percentage of students engaged with print was 5.59 percentage points on average for the sample of 195 schools. The estimated impact was not statistically significant at the p≤.05 level (p=.178). The impact of the Reading First program on the percentage of students engaged with print was 2.94 percentage points on average for the sample of 173 schools remaining after one pair of schools furthest from the cut-point of the rating variable in each site was dropped. The estimated impact was not statistically significant at the p≤.05 level (p=.495). The impact of the Reading First program on the percentage of students engaged with print was 3.33 percentage points on average for the sample of 151 schools remaining after two pairs of schools furthest from the cut-point of the rating variable in each site were dropped. The estimated impact was not statistically significant at the p≤.05 level (p=.480). The impact of the Reading First program on the percentage of students engaged with print was 3.31 percentage points on average for the sample of 129 schools remaining after three pairs of schools furthest from the cut-point of the rating variable in each site were dropped. The estimated impact was not statistically significant at the p≤.05 level (p=.520). Sources: RFIS Student Time-on-Task and Engagement with Print, fall 2005 and spring 2006.

B-10 Interim Report: Methods
Exhibit B.6: Sensitivity Test of Different Functional Forms of Rating Variable for Reading Comprehension (2005, 2006)
Model 1 Model 2 Model 3
Grade 1 Impact Treat Coeff 2.98 0.48 0.17 SE 2.99 3.48 3.42 p-value (0.319) (0.890) (0.960) F-test t*r F-value 0.89 p-value (0.656) r2 F-value 0.96 p-value (0.532)
Grade 2 Impact Treat Coeff 1.09 -0.56 -0.18 SE 2.51 2.77 2.70 p-value (0.663) (0.841) (0.946) F-test t*r F-value 1.14 p-value (0.260) r2 F-value 1.36 p-value (0.079)
Grade 3 Impact Treat Coeff -1.99 -1.84 -1.89 SE 2.25 2.63 2.61 p-value (0.376) (0.484) (0.469) F-test t*r F-value 0.69 p-value (0.910) r2 F-value 0.61 p-value (0.965)
Notes: Impact estimates are in scaled score points for the Stanford Achievement Test, 10th Edition (SAT 10). Sample includes 17 of the 18 study sites and 238 of the 248 study schools. Impact estimates are statistically adjusted (e.g., take each school's rating, site-specific funding cut-point, and other covariates into account) to reflect the regression discontinuity design of the study. A two-tailed test of significance was used, and where applicable, statistically significant findings at the p≤.05 level are indicated by *. MODEL1: Y = treat*sites + sites*rating + sites*pretest + others + site MODEL2: Y = treat*sites + sites*rating + sites*rating*treat + sites*pretest + others + sites MODEL3: Y = treat*sites + sites*rating + sites*r_sqr + sites*pretest + others + sites EXHIBIT READS: The impact of the Reading First program for grade 1 on reading comprehension as estimated by Model 1 was 2.98 scaled score points on average. The estimated impact had a standard error of 2.99 scaled score points and was not statistically significant at the p≤.05 level (p=.319). The impact of the Reading First program for grade 1 on reading comprehension as estimated by Model 2 was 0.48 scaled score points on average. The estimated impact had a standard error of 3.48 scaled score points and was not statistically significant at the p≤.05 level (p=.890). In Model 2, the coefficients on the site, rating, and treatment interactions were not jointly statistically significant at the p≤.05 level (F=.98, p=.656). The impact of the Reading First program for grade 1 on reading comprehension as estimated by Model 3 was 0.17 scaled score points on average. The estimated impact had a standard error of 3.42 scaled score points and was not statistically significant at the p≤.05 level (p=.960). In Model 3, the coefficients on the sites and squared rating were not jointly statistically significant at the p≤.05 level (F=.96, p=.532). Sources: RFIS SAT 10 administration in the spring of 2005 and 2006, as well as from state/district education agencies in those sites that already used the SAT 10 for their standardized testing (i.e., FL, KS, MD, OR).

Interim Report: Methods B-11
Exhibit B.7: Sensitivity Test of Different Functional Forms of Rating Variable for Instruction (2005, 2006)
Model 1 Model 2 Model 3
Grade 1 Impact Treat Coeff 8.69* 10.59* 9.57* SE 2.94 3.52 3.41 p-value (0.003) (0.003) (0.005) F-test t*r F-value 1.33 p-value (0.095) r2 F-value 1.12 p-value (0.291)
Grade 2 Impact Treat Coeff 12.50* 10.46* 11.24* SE 2.96 3.65 3.56 p-value (<0.001) (0.005) (0.002) F-test t*r F-value 0.67 p-value (0.926) r2 F-value 0.57 p-value (0.980) Notes: Impact estimates are calculated using minutes of instruction in the five dimensions. Sample includes 17 of the 18 study sites and 238 of the 248 study schools in grade 1 and 237 of the 247 schools in grade 2. Impact estimates are statistically adjusted (e.g., take each school's rating and site-specific funding cut-point into account) to reflect the regression discontinuity design of the study. A two-tailed test of significance was used, and where applicable, statistically significant findings at the p≤.05 level are indicated by *. MODEL1: Y = treat*sites + sites*rating + sites*pretest + others + site MODEL2: Y = treat*sites + sites*rating + sites*rating*treat + sites*pretest + others + sites MODEL3: Y = treat*sites + sites*rating + sites*r_sqr + sites*pretest + others + sites EXHIBIT READS: The impact of the Reading First program for grade 1 on instruction as estimated by Model 1 was 8.69 minutes on average. The estimated impact had a standard error of 2.94 minutes and was statistically significant at the p≤.05 level (p=.003). The impact of the Reading First program for grade 1 on instruction as estimated by Model 2 was 10.59 minutes on average. The estimated impact had a standard error of 3.52 minutes and was statistically significant at the p≤.05 level (p=.003). In Model 2, the coefficients on the site, rating, and treatment interactions were not jointly statistically significant at the p≤.05 level (F=1.33, p=.095). The estimated impact of the Reading First program for grade 1 on reading comprehension as estimated by Model 3 was 9.57 minutes on average and had a standard error of 3.41 minutes. The estimated impact was statistically significant at the p≤.05 level (p=.005). In Model 3, the coefficients on the sites and squared rating were not jointly statistically significant at the p≤.05 level (F=1.12, p=.291). Sources: RFIS Instructional Practice in Reading Inventory, spring 2005, fall 2005, and spring 2006.

B-12 Interim Report: Methods
Exhibit B.8: Sensitivity Test of Different Functional Forms of Rating Variable for Student Engagement with Print (2005, 2006)
Model 1 Model 2 Model 3
Grade 1 Impact Treat Coeff 4.79 6.70 5.86 SE 3.88 4.82 4.62 p-value (0.219) (0.167) (0.207) F-test t*r F-value 0.75 p-value (0.745) r2 F-value 0.75 p-value (0.748)
Grade 2 Impact Treat Coeff -8.60* -8.78 -7.73 SE 3.99 4.82 4.64 p-value (0.032) (0.070) (0.098) F-test t*r F-value 1.27 p-value (0.214) r2 F-value 1.17 p-value (0.291) Notes: Impact estimates are calculated using percentage of students engaged with print. Sample includes 17 of the 18 study sites and 238 of the 248 study schools in grade 1 and 236 of the 246 schools in grade 2. Impact estimates are statistically adjusted (e.g., take each school's rating and site-specific funding cut-point into account) to reflect the regression discontinuity design of the study. A two-tailed test of significance was used, and where applicable, statistically significant findings at the p≤.05 level are indicated by *. MODEL1: Y = treat*sites + sites*rating + sites*pretest + others + site MODEL2: Y = treat*sites + sites*rating + sites*rating*treat + sites*pretest + others + sites MODEL3: Y = treat*sites + sites*rating + sites*r_sqr + sites*pretest + others + sites EXHIBIT READS: The impact of the Reading First program for grade 1 on student engagement with print as estimated by Model 1 was 4.79 percentage points on average. The estimated impact had a standard error of 3.88 percentage points and was not statistically significant at the p≤.05 level (p=.219). The impact of the Reading First program for grade 1 on student engagement with print as estimated by Model 2 was 6.70 percentage points on average and had a standard error of 4.82 percentage points. The estimated impact was not statistically significant at the p≤.05 level (p=.167). In Model 2, the coefficients on the site, rating, and treatment interactions were not jointly statistically significant at the p≤.05 level (F=.75, p=.745). The impact of the Reading First program for grade 1 on student engagement with print as estimated by Model 3 was 5.86 percentage points on average and had a standard error of 4.62 percentage points. The estimated impact was not statistically significant at the p≤.05 level (p=.207). In Model 3, the coefficients on the sites and squared rating were not jointly statistically significant at the p≤.05 level (F=.75, p=.748). Sources: RFIS Student Time-on-Task and Engagement with Print, fall 2005 and spring 2006.
Findings from the tests in Exhibits B.9 and B.10 suggest that there are very few statistically significant residual differences in each sample. Composite tests of all 15 baseline characteristics for each subgroup of sites indicate that overall, the estimated residual differences are not statistically significant within early award sites or within late award sites. Hence, the isolated differences observed could have occurred by chance and do not necessarily indicate a bias in the linear regression discontinuity model used to estimate impacts. Furthermore, the single most relevant characteristic (student reading performance) for which a statistically significant baseline difference was observed (in early award sites only) is a covariate in all regression discontinuity models used to estimate impacts on student reading comprehension. This variable, which in principal reflects all past differences among schools that are related to future differences in their student test scores, is controlled for explicitly in the impact analysis. Therefore the regression discontinuity model with this covariate should provide unbiased impact estimates.

Interim Report: Methods B-13
Exhibit B.9: Estimated Residual Differences in Baseline Characteristics of Schools in the Study Sample: Early Award Sites, 2002-2003
Characteristic Estimated Residual
Difference
Statistical Significance of
Difference (p-value)
Students Male (%) 0.6 (0.631) Race (%) Asian 0.4 (0.732) Black -0.3 (0.965) Hispanic -2.8 (0.532) White 2.4 (0.693) Amer Ind/Alaskan 0.2 (0.268) Free Lunch and Reduced Lunch -11.6 (0.050)
Schools Eligible for Title 1 (%) -2.8 (0.830) Locale Large City -0.7 (0.865) Mid-size City 5.3 (0.618) Other a -4.5 (0.691) Size Total Number of Students 57.1 (0.378) Number of Students in Grade 3 3.6 (0.708) Student/Teacher Ratio 0.2 (0.781)
Third Grade Reading Performance Deviation from State RF Mean Proficiency Rate (%)b 11.2* (0.0046)
Number of Schools 111 Notes: The early RF study sample includes 111 schools from 10 sites located in 7 states. 55 schools are Reading First schools and 56 are non-Reading First schools. The “Estimated Residual Difference” is the adjusted residual difference between Reading First schools and non-Reading First schools estimated using the regression discontinuity model, which controls for each school’s rating. A two-tailed test of significance was used, and where applicable, statistically significant findings at the p≤.05 level are indicated by *. a Other Locale includes urban fringe of a large city, urban fringe of a mid-sized city, large town, small town, and rural. b A school-’s proficiency score is defined as the percentage of third grade students (or fourth or fifth grade when third grade is
unavailable) in the school that score at or above the state-defined proficiency threshold on the state’s reading assessment. The values in this row represent the average percentage point deviation from the mean proficiency score for the Reading First schools in the state.
EXHIBIT READS: The estimated residual difference on the percent of male students between Reading First and non-Reading First schools was 0.6 percentage points. The difference was not statistically significant at the p≤.05 level (p=.631). Sources: Data on baseline characteristics are from the Common Core of Data.

B-14 Interim Report: Methods
Exhibit B.10: Estimated Residual Differences in Baseline Characteristics of Schools in the Study Sample: Late Award Sites, 2002-2003
Characteristic
Estimated Residual
Difference
Statistical Significance of
Difference (p-value)
Students Male (%) 1.1 (0.240) Race (%) Asian 1.3 (0.359) Black -13.2 (0.115) Hispanic 8.7 (0.089) White 3.1 (0.577) Amer Ind/Alaskan 0.1 (0.451) Free Lunch and Reduced Lunch -1.1 (0.774)
Schools Eligible for Title 1 (%) -0.3 (0.928) Locale Large City 8.2 (0.320) Mid-size City 12.1 (0.052) Other a -20.3* (0.048) Size Total Number of Students -46.5 (0.338) Number of Students in Grade 3 -9.6 (0.265) Student/Teacher Ratio 0.0 (0.997)
Third Grade Reading Performance Deviation from State RF Mean Proficiency Rate (%)b -1.7 (0.611)
Number of Schools 137 Notes: The late RF study sample includes 137 schools from 8 sites located in 8 states. 70 schools are Reading First schools and 67 are non-Reading First schools. The “Estimated Residual Difference” is the adjusted residual difference between Reading First schools and non-Reading First schools estimated using the regression discontinuity model, which controls for each school’s rating. A two-tailed test of significance was used, and where applicable, statistically significant findings at the p≤.05 level are indicated by *. a Other Locale includes urban fringe of a large city, urban fringe of a mid-sized city, large town, small town, and rural. b A school-’s proficiency score is defined as the percentage of third grade students (or fourth or fifth grade when third grade is
unavailable) in the school that score at or above the state-defined proficiency threshold on the state’s reading assessment. The values in this row represent the average percentage point deviation from the mean proficiency score for the Reading First schools in the state.
EXHIBIT READS: The estimated residual difference on the percent of male students between Reading First and non-Reading First schools was 1.1 percentage points. The difference was not statistically significant at the p≤.05 level (p=.240).
Sources: Data on baseline characteristics are from the Common Core of Data.

Interim Report: Methods B-15
Part 3: Approach to Multiple Hypothesis Testing
This section addresses the issue of multiple hypothesis testing. It first summarizes the five core principles that were used as a guide for addressing the issue in the current study, and then describes a two-stage approach for operationalizing these principles. Principle #1: Qualify tests instead of adjusting them: The present analysis qualifies specific hypothesis tests using composite tests of pooled hypotheses rather than (1) adjusting significance levels (through Bonferroni methods) or (2) adjusting significance thresholds (through Benjamini and Hochberg methods) of specific tests. Principle #2: Address multiple testing differently for the central research questions of the study and for supplemental analyses. The analysis specifies two tiers of hypotheses: Tier I comprises a very small number of hypotheses about the central research questions of the study, and Tier 2 represents supplemental research questions. Multiple testing is treated separately and differently within the two tiers. Statistical tests of Tier I hypotheses are considered confirmatory. To address the issue of multiplicity within Tier I, the present study tested a reduced set of outcomes by conducting pooled tests of composite hypothesis that represent a set of hypotheses that have been tested separately. The Tier 2 hypothesis tests are allowed to be much larger and less confirmatory. It may or may not be necessary to qualify these findings for multiple testing since they are not confirmatory. Principle #3: Delineate separate domains that reflect key clusters of constructs represented by the central research questions of a study. Domains comprise broad clusters of outcome constructs that can contain multiple measures, subgroups, or follow-up observations. Domains are defined conceptually, and do not provide narrow “silos” for collecting findings. The central domains for the present study are student reading comprehension, classroom reading instruction, and student engagement with print. Principle #4: Report analyses to address multiple comparisons in the background of research reports, not in the foreground. For the present study references to the qualifying tests occur in the main text but not in tables. Principle #5: Use tests for interactions as a composite test (and thus a guide) for focusing on subgroup findings. Based on the above five principles, the present study uses the following two-stage approach to address multiple hypothesis testing. The first stage involves prioritizing outcomes and subgroups for the impact analysis. The second stage encompasses strategies for conducting composite tests on pooled key outcomes. The core features of each stage are described below. Stage 1: Creating a Parsimonious List of Outcomes and Subgroups and Prioritizing Key Outcomes
The first stage of the framework involves a process of carefully categorizing and prioritizing the outcomes and subgroups for the impact analysis. The goal of this exercise is to create the shortest possible list of outcomes and subgroups that reflect the most proximal and policy relevant indicators of Reading First’s effectiveness. Analytically, the shorter the list, the less likely it is that one would attribute statistical significance to an impact that did not truly occur. These outcomes and subgroups

B-16 Interim Report: Methods
were selected within distinct measurement domains to correspond to key components of the program’s theory of action and the key research questions posed by the program’s evaluation. The impact analysis focuses on two components of the Reading First theory of action: 1) aligning teachers’ instructional practices and behaviors with the five dimensions of reading instruction, and 2) improving students’ reading achievement.9 The highest priority outcomes within each of these measurement domains would constitute “Tier 1” outcomes for the impact analysis. For each Tier 1 outcome, the RFIS Team specifies a parsimonious set of subgroups for which impacts are estimated. Recognizing that a short list of outcomes will almost certainly exclude important policy-relevant indicators of Reading First’s effectiveness (a form of Type II error), this first stage of the framework also includes the development of a secondary, or “Tier 2,” list of outcomes and subgroups. As discussed below, the present study treats Tier 1 and Tier 2 outcomes and their accompanying subgroups separately, and potentially differently, if or when making adjustments to the standards used for judging statistical significance. Exhibit B.11 provides a list of the Tier 1 and Tier 2 outcomes defined for each measurement domain for this report.10 Also displayed are the grade levels and follow-up periods on which the impact analyses focus. Stage 2: Conducting Composite Tests to Qualify Specific Hypothesis Tests
One approach to qualifying multiple hypothesis tests is to test whether the overall effect of treatment on a family of outcomes is significantly different from zero. For example, a policy maker may be interested in the effect of an intervention on test scores in general, rather than on each subject separately. Measurement of such overall effects has its roots in the literature on clinical trials and on meta-analysis (O’Brien, 1984; Logan and Tamhane, 2002; and Hedges and Olkin, 1985). The present analysis constructs summary indices that aggregate information over multiple treatment effect estimates within each domain for Tier 1 outcomes. See Exhibit B.12.
9 The Reading First theory of action also includes allocating additional resources for districts and schools to
purchase reading curricula, materials, and assessments; exposing teachers to professional development and coaching focused on the five dimensions of effective reading programs; and holding districts and schools accountable for improved reading achievement. The present study was not designed to measure the impact of Reading First on these other elements.
10 Because student engagement with print is an outcome that is distinct from the student reading comprehension or classroom reading instruction domains, it is treated separately.

Interim R
eport: Methods
B
-17
Exhibit B.11: Outcome Tiers for the Reading First Impact Analysis Full Sample Subgroups (Early/Late Award)
Tier Domain Outcome Year Grade Year Grade Scaled Score 2005, 2006 Pooled Separate for Grade 1, 2, 3 2005, 2006 Pooled Separate for Grade 1, 2, 3 Reading Comprehension % At or Above Grade Level 2005, 2006 Pooled Separate for Grade 1, 2, 3 2005, 2006 Pooled Separate for Grade 1, 2, 3
Time on Five Dimensions 2005, 2006 Pooled Separate for Grade 1, 2 2005, 2006 Pooled Separate for Grade 1, 2 Highly Explicit Instruction 2005, 2006 Pooled Separate for Grade 1, 2 2005, 2006 Pooled Separate for Grade 1, 2 Instruction High Quality Practice 2005, 2006 Pooled Separate for Grade 1, 2 2005, 2006 Pooled Separate for Grade 1, 2
Tier 1
Student Engagement with Print
% Students Engaged with Print 2005, 2006 Pooled Separate for Grade 1, 2 2005, 2006 Pooled Separate for Grade 1, 2
Scaled Score 2005 Separate for Grade 1, 2, 3 2005 Separate for Grade 1, 2, 3 2006 Separate for Grade 1, 2, 3 2006 Separate for Grade 1, 2, 3 % At or Above Grade Level 2005 Separate for Grade 1, 2, 3 2005 Separate for Grade 1, 2, 3
Reading Comprehension
2006 Separate for Grade 1, 2, 3 2006 Separate for Grade 1, 2, 3
Time on Five Dimensions 2005 Separate for Grade 1, 2 2005 Separate for Grade 1, 2 (Combined and for Five Dimensions separately) 2006 Separate for Grade 1, 2 2006 Separate for Grade 1, 2 Highly Explicit Instruction 2005 Separate for Grade 1, 2 2005 Separate for Grade 1, 2 2006 Separate for Grade 1, 2 2006 Separate for Grade 1, 2 High Quality Practice 2005 Separate for Grade 1, 2 2005 Separate for Grade 1, 2
Instruction
2006 Separate for Grade 1, 2 2006 Separate for Grade 1, 2
% Students Engaged with Print 2005 Separate for Grade 1, 2 2005 Separate for Grade 1, 2
Tier 2
Student Engagement with Print
2006 Separate for Grade 1, 2 2006 Separate for Grade 1, 2

B-18 Interim Report: Methods
Exhibit B.12: Summary of Impacts and Results of Composite Tests Impact
(p-value) Outcome Measure Grade 1 Grade 2 Grade 3
Result of Composite Test
Reading Comprehension
• Standard scaled score 3.57 (p=0.215)
1.41 (p=0.559)
-1.63 (p=0.455)
• Percent reading at or above grade level 3.15 (p=0.260)
0.12 (p=0.965)
-2.22 (p=0.383)
p=0.668 for composite test across 3 grades and 2 outcomes
Instruction
• Minutes of instruction in 5 reading dimensions 8.56 (p=0.003)
12.09 (p<0.001)
--
• Highly explicit instruction 3.65 (p=0.023)
6.98 (p<0.001)
--
• High quality student practice 0.86 (p=0.559)
3.67 (p=0.012)
--
p<0.001 for composite test across 2 grades and 3 outcomes
Student Engagement with Print
• Percent of students engaged with print 4.63 (p=0.216)
-8.42 (p=0.030)
-- p=0.710 for composite test across 2 grades and 1 outcome
Notes Impact estimates are statistically adjusted (e.g., take each school's rating, site-specific funding cut-point, and other covariates into account) to reflect the regression discontinuity design of the study.
EXHIBIT READS: The results of the composite test for reading comprehension test scores, across three grades and two outcomes, are not statistically significant (p=0.668). Source: RFIS SAT 10 administration in the spring of 2005 and 2006, as well as from state/district education agencies in those sites that already use the SAT 10 for their standardized testing (i.e., FL, KS, MD, OR); RFIS Instructional Practice in Reading Inventory, spring 2005, fall 2005, and spring 2006; and RFIS Student Time-on-Task and Engagement with Print, data collection, fall 2005 and spring 2006.
Reading Comprehension
To qualify the impact estimates for each outcome measure for each grade in the reading comprehension domain, the present analysis ran a composite regression that pooled the sample across grades 1, 2, and 3 and two measures: scaled scores and an indicator of whether or not a student scored at or above grade level. To qualify the six multiple hypotheses tests for these outcomes, the RFIS Team created one parsimonious index. The aggregation improves statistical power to detect effects that go in the same direction within a domain. The summary index is defined to be the equally weighted average of z-score outcome components, with the sign of each measure oriented so that more beneficial outcomes have higher scores.11
11 An alternative is to use seemingly unrelated regression effects for specific outcomes to estimate the covariance
of the effects and then to calculate the mean effect size for groups of estimates in a second step. The average z-score index approach is much simpler to work with. The two approaches yield identical treatment effects when there is no item nonresponse and no regression adjustment (Kling, Liebman, and Katz, 2007).

Interim Report: Methods B-19
Specifically, the present analysis took the following steps in creating a composite index and conducting the analysis:12
1. First, z-scores were created for each outcome component in the reading comprehension domain by subtracting the unadjusted non-RF mean (pooled across years and grade levels) and dividing by its standard deviation (pooled across years and grade levels). Thus, each component of the index has a mean of zero and a standard deviation of one for the non-RF group.
2. If an observation unit has a valid response to at least one component measure of the index, then any missing values of other component measures are imputed as the random assignment group mean. This results in differences between RF and non-RF means of an index being the same as the average of those two groups’ means of the components of that index (when the components are divided by their comparison group standard deviation and have no missing value imputation), so that the index can be interpreted as the average of results for separate measures scaled in standard deviation units.
3. The z-scores from each component were averaged to obtain the index and an impact analysis was run on this index using a sample that pooled both years and all grade levels together.
This regression addresses the question whether overall the program “worked” in terms of improving student achievement. This result serves as a “qualifier” to the small number of specific hypothesis tests shown in impact tables. Classroom Instruction
A similar composite analysis was conducted for the instructional domain. To qualify the impact estimates for each outcome measure for each grade in the instructional domain, the analysis ran a composite regression which pooled the sample across grades and used an index constructed from z-scores for all three instructional outcome measures as the dependent variable. The index of instruction averaged together minutes in the five dimensions of reading instruction, percentage of highly explicit instruction, and percentage of high quality student practice. The results from this analysis help to answer the research question whether overall the Reading First program has an impact on instructional practice. In addition, program impacts for time spent on each of the five dimensions will be reported separately. Since the impact on total time spent on the five dimensions will already have been reported, any additional qualifying test is not necessary for these analyses. Student Engagement with Print
A similar composite analysis was conducted for the student engagement with print outcome domain. For this domain impacts are reported for the full sample in grades 1 and 2 as the percentage of students engaged with print. To qualify the two multiple hypotheses tests for these outcomes, the RFIS Team reports the result from a composite regression which pools two grades together and represents the outcome measure in one parsimonious index, created in the same way that the composite index for reading comprehension and instruction was created (see previous pages). This regression addresses the question 12 The discussion and method presented here draw from Kling, Liebman, and Katz (2007).

B-20 Interim Report: Methods
whether overall the program “worked” in terms of having an impact on the percentage of students engaged with print. This result serves as a “qualifier” to the small number of specific hypothesis tests shown in impact tables. Subgroups (by Site Award Subgroup)
Impact estimates are presented for each grade in the early award sites and late award sites separately. For each domain, there are three qualifying tests to supplement the main award group analyses:
1. A pooled regression to test whether the program has any impact (on reading instruction or reading comprehension) in the early award sites overall (pooled across grades and using the aforementioned outcome index).
2. A pooled regression to test whether the program has any impact (on reading instruction or reading comprehension) in the late award sites overall (pooled across grades and using the aforementioned outcome index).
3. A pooled regression to test whether, overall, the program impact (on reading instruction or reading comprehension) is different between early and late sites (pooled across grades and using the aforementioned outcome index).
The results of the qualifying tests are discussed immediately after the results are presented for each site award subgroup. They help shed light on potential differences or similarities between early and late award sites with regard to program impacts on reading comprehension, instruction, and student engagement with print. For hypothesis tests listed in Tier 2, the RFIS Team did not conduct any additional composite tests to qualify the results. The analyses presented in Tier 1 serve as natural composite tests for these more fine-grained tests. Part 4: Alternative Weighting Approaches
The impact estimation models described in Part 1 produce 18 site-specific impact estimates. For overall impact estimates, the 18 site-specific impacts are averaged to produce the overall mean impact estimate. Appropriate standard errors are calculated to assess the statistical significance of the averages. Each site’s results are weighted in proportion to that site’s number of Reading First schools in the study. This approach was selected to summarize impact estimates as clearly as possible; it produces estimates of impacts for the average Reading First school in the study. Since the study team recognized that there are other legitimate methods for weighting the impact estimates, key impact findings were examined to assess their sensitivity to alternative weighting methods. One alternative is to weight site-specific impact estimates in proportion to each site’s number of Reading First students (rather than its number of Reading First schools), which produces impact estimates for the average Reading First student in the study sample. The second alternative is to specify one treatment indicator for all sites, instead of specifying site-specific treatment indicators and then averaging their coefficients. This is called a pooled estimator rather than a weighted estimator, because it pools data for the full sample directly into a single average impact estimate. It should be noted, however, that the pooled estimator, like any other, represents a weighting of impact

Interim Report: Methods B-21
estimates across sites. The implicit weights for this strategy are approximately proportional to the precision of impact estimates for each site, which in turn reflect the site’s sample size and study design.13 The tables below compare estimates of the average impacts of Reading First produced by the three alternative approaches to weighting. Results are presented for estimates of impacts on reading comprehension, instruction in the five dimensions, and percentage of students engaged with print.
Exhibit B.13: Estimated Impacts on Reading Comprehension, by Weighting Approach (2005, 2006) Weighting Approach
Outcome
Weight by Number of RF
Schools per Site
Weight by Number of RF
Students per Site Weight by Precision
SAT 10 Scaled Score
Grade 1
Impact 3.57 1.42 5.25* Effect size 0.07 0.03 0.11* p-value (0.213) (0.619) (0.031)
Grade 2 Impact 1.41 0.08 3.04 Effect size 0.03 0.00 0.07 p-value (0.557) (0.973) (0.129)
Grade 3 Impact -1.63 -1.79 0.90 Effect size -0.04 -0.04 0.02 p-value (0.454) (0.400) (0.623)
Notes:
The complete RFIS sample includes 248 schools from 18 sites (17 school districts and 1 state) located in 13 states. 125 schools are Reading First schools and 123 are non-Reading First schools. For grade 2, one non-RF school could not be included in the analysis because test score data were not available. The effect size of the impact is the impact divided by the actual standard deviation of the outcome for the non-Reading First schools pooled across the spring 2005, fall 2005, and spring 2006 IPRI data (by grade). Impact estimates are statistically adjusted (e.g., take each school's rating, site-specific funding cut-point, and other covariates into account) to reflect the regression discontinuity design of the study. A two-tailed test of significance was used, and where applicable, statistically significant findings at the p≤.05 level are indicated by *. EXHIBIT READS: The impact of Reading First on reading comprehension in grade one was 3.57 scaled score points (or 0.07 standard deviations) when weighting by the number of Reading First schools per site. The impact was not statistically significant at the p≤.05 level (p=.213).
Sources: RFIS SAT 10 administration in the spring of 2005 and 2006, as well as from state/district education agencies in those sites that already used the SAT 10 for their standardized testing (i.e., FL, KS, MD, OR).
13 This alternative strategy weights each site’s impact estimate in proportion to its total amount of “free” (non-
collinear) variation in treatment status across schools, which is the major factor that determines the precision of these estimates. For detailed explanation and an application of this approach for an experiment, see Cullen et al. (2006).

B-22 Interim Report: Methods
Exhibit B.14: Estimated Impacts on Instructional Outcomes, by Weighting Approach (2005, 2006) Weighting Approach
Outcome
Weight by Number of RF
Schools per Site
Weight by Number of RF
Classrooms per Site Weight by Precision
Minutes of instruction in the five dimensions combined
Grade 1 Impact 8.56* 8.79* 8.52* Effect size 0.41* 0.42* 0.41* p-value (0.003) (0.002) (0.001)
Grade 2 Impact 12.09* 11.75* 12.38* Effect size 0.57* 0.55* 0.58* p-value (<0.001) (<0.001) (<0.001)
Notes: The complete RFIS sample includes 248 schools from 18 sites (17 school districts and 1 state) located in 13 states. 125 schools are Reading First schools and 123 are non-Reading First schools. The effect size of the impact is the impact divided by the actual standard deviation of the outcome for the non-Reading First schools pooled across the spring 2005, fall 2005, and spring 2006 IPRI data (by grade). Impact estimates are statistically adjusted (e.g., take each school's rating and site-specific funding cut-point into account) to reflect the regression discontinuity design of the study. A two-tailed test of significance was used, and where applicable, statistically significant findings at the p≤.05 level are indicated by *. EXHIBIT READS: The impact of the Reading First program for grade 1 on the number of minutes of instruction in the five dimensions (phonemic awareness, phonics, vocabulary, fluency, and comprehension) was 8.56 minutes on average when weighting by the number of Reading First schools per site. This corresponds to an effect size of 0.41. The estimated impact was statistically significant at the p≤.05 level (p=.003).
Sources: RFIS Instructional Practice in Reading Inventory, spring 2005, fall 2005, and spring 2006

Interim Report: Methods B-23
Exhibit B.15: Estimated Impacts on Student Engagement with Print, by Weighting Approach (2005, 2006) Weighting Approach
Outcome
Weight by Number of RF Schools per
Site
Weight by Number of RF
Students per Site Weight by Precision
Percentage of Students Engaged with Print
Grade 1
Impact 4.63 3.51 3.39 Effect size 0.16 0.12 0.11 p-value (0.216) (0.342) (0.332)
Grade 2 Impact -8.42* -7.83* -5.82 Effect size -0.29* -0.27* -0.20 p-value (0.030) (0.041) (0.099)
Notes:
The complete RFIS sample includes 248 schools from 18 sites (17 school districts and 1 state) located in 13 states. 125 schools are Reading First schools and 123 are non-Reading First schools. The effect size of the impact is the impact divided by the actual standard deviation of the outcome for the non-Reading First schools pooled across the fall 2005 and spring 2006 STEP data (by grade). Impact estimates are statistically adjusted (e.g., take each school's rating and site-specific funding cut-point into account) to reflect the regression discontinuity design of the study. A two-tailed test of significance was used, and where applicable, statistically significant findings at the p≤.05 level are indicated by *. EXHIBIT READS: The impact of the Reading First program for grade 1 on the percentage of students engaged with print was 4.63 percentage points on average when weighting by the number of Reading First schools per site. This corresponds to an effect size of 0.16. The estimated impact was not statistically significant at the p≤.05 (p=.216).
Sources: RFIS Student Time-on-Task and Engagement with Print, fall 2005 and spring 2006

B-24 Interim Report: Methods
Part 5: Sample Size
Although regression discontinuity analysis can provide unbiased impact estimates under the conditions met by this study—and thus is comparable to a true experiment in this regard—the quasi-experimental approach requires a much larger sample of schools to provide the same precision as an experiment. To understand this point, consider the following expression for the variance of the regression discontinuity
impact estimator, 0^
β :
∑ −−
−=
iRTTi
RVAR)1()(
)1()(
22
_ 2
21
2
0^ σβ (3)
where: σ 2 = the variance of mean student outcomes across schools within treatment
groups, R2
1 = the square of the correlation between the outcome and rating within treatment groups, R2
2 = the square of the correlation between treatment status and the rating,
∑ −i TTi )(_ 2
= the total variation in treatment status across schools in the sample.
The outcome variance reflects the prevailing heterogeneity of student performance across the sample of schools in the study. The total variation in treatment status depends on the number of schools in the sample, given a balanced 50/50 allocation of program and control schools. The correlation between the outcome and rating in the numerator of Equation 3 reflects how well the rating predicts subsequent student performance. One might label this term a “prediction factor.” Its value depends on what variables are used to create the index that rates schools. As can be seen, the better the rating predicts future outcomes the smaller the variance of the impact estimator will be and thus the greater its precision will be. The best index available for this purpose at the study design stage was a summary of recent past student performance. The correlation between school treatment status and school ratings in the denominator of Equation 3 reflects the underlying structure of the regression discontinuity design (whether it is balanced or unbalanced around the cut-point) and the shape of the distribution of ratings around the cut-point. This term measures the collinearity that exists between treatment status and ratings. Thus including ratings in the impact estimation model, which is necessary in principle to prevent bias, produces collinearity with the treatment indicator. This collinearity reduces the independent variation in treatment status across schools, which, in turn, reduces the precision of program impact estimators. If the rankings of schools (instead of their ratings) are used as the covariate in the impact regression and there are an equal number of schools on each side of the cut-point, then the collinearity correlation squared

Interim Report: Methods B-25
equals 0.75.14 One minus this value equals 0.25, which multiplies the variance of the impact estimator by a factor of four. In experiments the expected correlations between treatment status and rankings or ratings or any other pre-existing characteristics are zero because of randomization. So there is no expected collinearity with treatment status. Thus, if rankings are used as a covariate, the variance of the impact estimator for a regression discontinuity analysis will be four times that for a corresponding experiment. Hence, to achieve the same minimum detectable effect the regression discontinuity analysis would need four times as many schools as the experiment. If the rating of schools is used as the covariate for a regression discontinuity analysis of program impacts (which was what was expected) then the exact amount of collinearity between it and the treatment status indicator is not known. However, if this variable were approximately normally distributed and centered on the cut-point Goldberger (1972) proves that the sample for a regression discontinuity analysis must be 2.75 times that for a corresponding experiment to achieve the same precision.15 In reading through most of the extant literature on regression discontinuity analysis it appears that Goldberger’s work is the sole touchstone for gauging this sample multiplier. Others have used his finding as a point of departure but nobody to our knowledge has independently come to a different conclusion. Rankings are uniformly distributed because they comprise a consecutive set of numbers. Thus a covariate that is uniformly distributed and centered on the cut-point produces a sample size multiplier of four whereas a covariate that is normally distributed and centered on the cut-point produces a sample size multiplier of 2.75. Although there was no way to know at the time when the study was designed exactly how the actual ratings that should be used for a covariate would be distributed, there was no reason to expect that their sample size multiplier would differ markedly from the range of 2.75 to 4.00 established by the two points of reference. Empirical findings presented in Gamse et al. (2004) confirm this expectation. For planning purposes, we chose a design effect of four to help assure adequate statistical power for the RDD. Based on the preceding analyses and extensive discussions among members of the research team, IES staff, and the project’s expert advisory panel, it was decided that a sample of roughly 240 schools was needed, which is four times the sample size planned for the original experimental design. This larger sample size was necessary for the study to achieve a minimum detectable effect size of 0.20 standard deviations. As noted in Chapter 2, initial recruitment efforts produced a sample of 258 schools from one state site and 17 district sites. These 18 sites represent a total of 13 states. Due to refusals, school closings, reconfiguring, or redistricting, 10 schools (4 RF schools and 6 non-RF schools) subsequently dropped out of the study. For results presented in this report, a final analytic sample of 248 schools was used.
14 One can easily confirm this finding and its implications for precision by simulating alternative data structures.
Doing so also indicates that the collinearity correlation declines somewhat but remains quite large for regression discontinuity designs that have unequal numbers of schools on each side of the cut-point. However, such unbalanced designs create other analytic problems that are beyond the scope of the present discussion.
15 Goldberger, Arthur S. (1972). “Selection Bias In Evaluating Treatment Effects: Some Formal Illustrations” (Discussion Paper 129-72, Madison, WI: University of Wisconsin, Institute for Research on Poverty, June).

B-26 Interim Report: Methods
Part 6: Statistical Precision
The statistical precision of an impact estimator is its ability to detect true intervention effects when they exist. A common way to represent statistical precision is a minimum detectable effect. This measure indicates the smallest true effect that an estimator has a “good chance” of detecting. The current analysis uses the common convention of defining a minimum detectable effect as the smallest true program effect (impact) that has an 80 percent chance of being found to be statistically significant (i.e., it has 80 percent statistical power) at the 0.05 level of statistical significance for a two-tailed test of the null hypothesis of no effect. When a minimum detectable effect is expressed as a standardized effect size (in standard deviation units), it is usually referred to as a minimum detectable effect size (MDE). Exhibit B.16 lists the minimum detectable effect (or effect size) for full-sample estimates of program impacts on key study outcomes when the data are pooled across the two school years for which data are currently available. These minimum detectable effects are based on the experience of students and schools in the study sample during the follow-up period to date, and not on the initial assumptions that guided the study design. Hence, the findings in Exhibit B.16 represent the actual precision of the present design as it materialized in the field.16 The three panels in the exhibit present minimum detectable effects for the three outcome domains of the present study. The three columns in the exhibit present minimum detectable effects for grades one, two, and three separately. The top panel focuses on measures of student reading comprehension. Findings in this panel indicate that the present study design and impact estimation model have minimum detectable effects that range from approximately 6 to 8 scaled score points, which corresponds to 0.15 to 0.16 standard deviations or 7 to 8 percentage points. These findings indicate that the present study achieved its goal of providing minimum detectable effect sizes that are no larger than 0.20 standard deviations for estimates of the impacts of Reading First on student reading comprehension.17 These findings also indicate that the corresponding minimum detectable effect size for a subgroup of sites that comprise about half of the schools in the study sample is approximately equal to 0.22 standard deviations. In addition, the findings indicate that the minimum detectable difference in effects for two subgroups (each comprising approximately half the schools in the study sample) is approximately 0.31 standard deviations.18 Thus, the present study has considerably more precision for full-sample estimates of program impacts than for sub-sample estimates or sub-sample differences.
16 Because for the present full sample the number of degrees of freedom for estimating the standard error of an
impact estimator is well beyond 30, the minimum detectable effect of an estimator equals 2.8 times its standard error. For further discussion see Bloom, H. S. (1995) “Minimum Detectable Effects: A Simple Way to Report the Statistical Power of Experimental Designs,” Evaluation Review, Vol. 19, No. 5, pp. 547–556.
17 See Gamse et al. (2004). 18 The minimum detectable effect size for a subsample comprising half of the schools in the study sample is equal
to the square root of two times the minimum detectable effect size for the full study sample. The minimum detectable difference in effect sizes for two subsamples each of which comprises half of the schools in the study sample equals twice the minimum detectable effect size for the full sample.

Interim Report: Methods B-27
Exhibit B.16: Minimal Detectable Effects for Full Sample Impact Estimates
Grade Level Grade 1 Grade 2 Grade 3
Panel 1
Student Reading Comprehension Mean Scaled Score 8.04 6.75 6.08 Effect Size 0.16 0.16 0.15 Percent at or above Grade Level 7.81 7.28 7.11
Panel 2
Instructional Outcomes Instruction in the Five Dimensions Combined Minutes 7.87 7.98 N/A Effect Size 0.38 0.38 N/A Percentage of Intervals in Five Dimensions with Highly Explicit Instruction 4.47 4.80 N/A High Quality Student Practice 4.12 4.06 N/A
Panel 3
Student Engagement with Print Percentage of Students Engaged with Print 10.44 10.81 N/A
Notes: The complete RF study sample includes 248 schools from 18 sites (17 school districts and 1 state) located in 13 states. 125 schools are Reading First schools and 123 are non-Reading First schools. For grade 2, one non-RF school could not be included in the analysis because test score data were not available. Minimal detectable effects are based on the standard errors and standard deviations of the impact estimates for the full sample pooled across two school years of follow-up. Impact estimates are statistically adjusted (e.g., take each school's rating, site-specific funding cut-point, and other covariates into account) to reflect the regression discontinuity design of the study. EXHIBIT READS: The minimal detectable effect of the Reading First program on reading comprehension for a mean scaled score in grade 1 is 8.04 scaled score points. The minimal detectable effect of the Reading First program on reading comprehension for a mean scaled score in grade 2 is 6.75 scaled score points. The minimal detectable effect of the Reading First program on reading comprehension for a mean scaled score in grade 3 is 6.08 scaled score points.
Sources: Data from RFIS SAT 10 administration in the spring of 2005 and 2006, as well as from state/district education agencies in those sites that already use the SAT 10 for their standardized testing (i.e., FL, KS, MD, OR); RFIS Instructional Practice in Reading Inventory, spring 2005, fall 2005, and spring 2006; and RFIS Student Time-on-Task and Engagement with Print, fall 2005 and spring 2006.
Findings in the second panel of the exhibit indicate that the minimum detectable effect for instructional time spent in the five dimensions of reading instruction is about 8 minutes or about 0.38 standard deviations (in effect size). Minimum detectable effects for the percentage of instructional intervals in the five dimensions that exhibited highly explicit instruction or that exhibited high quality student practice ranged from about four to five percentage points. The minimum detectable effect on the percentage of students engaged with print was between 10 and 11 percentage points, roughly twice as large as that for the preceding two measures. On balance, the statistical precision of the present study design and its analytic framework achieve the initial goals of the study’s design. The precision is adequate for full-sample impact estimates, which are the primary focus of the present study, and is less adequate for estimating sub-sample impacts or differences in sub-sample impacts.

Interim Report: Measures C-1
Appendix C: Measures
Appendix C describes the measures selected for each of the three outcome domains assessed in the RFIS. It begins by describing the selection of assessments for measuring students’ reading performance, then describes the development of measures to assess teachers’ instructional behaviors in reading as well as students’ engagement with print. The appendix also includes relevant information on properties of instruments, data collection procedures and response rates, and copies of instruments. Part 1: Reading Comprehension
At the heart of this evaluation is a question about the impact of Reading First on the reading achievement of students. The RFIS had initially planned to use a battery of tests to assess students’ reading skill across the components of reading instruction targeted in the legislation (phonemic awareness, phonics, fluency, vocabulary, and comprehension), but when the study’s design shifted to an RDD, with a much larger number of schools, the planned data collection activities also changed. The RFIS Team, working with its Technical Work Group and staff from the National Center for Education Evaluation/Institute of Education Sciences at the Department of Education, focused its efforts on identifying a single test of reading comprehension. Reading Comprehension Instrument Selection
The team’s priorities in selecting a test for this study included, first, finding a test that directly measured skills related to text comprehension. Other factors included: ease and appropriateness of administration to groups or entire classrooms of students—including appropriateness for fall first grade; modest time demands; use of a norm-referenced test; and consistent reliability and validity. The team also sought a measure that had already been widely used in large-scale studies, and therefore would be more likely to be credible in the research community. At the outset of the test selection and review process, the team identified 47 assessments of text comprehension that either had been proposed for use by states in their Reading First schools or had been proposed for use in other Department of Education-sponsored evaluations involving preschool and the early elementary grades. From this pool of tests, we identified six test batteries with subtests of reading comprehension that could be group-administered and were valid for fall of first grade.19 The six test batteries included: 1. ITBS Total Core Battery Reading Subtest; 2. Terra Nova/CTBS Basic Battery Reading Subtest; 3. Gates/MacGinitie Reading Test-3 (GMRT); 4. GRADE (Group Reading Assessment and Diagnostic Evaluation); 5. Stanford Achievement Test—10th Edition (SAT 10); and 6. Stanford Reading First.
19 See published manuals (Hoover et al., 2003; CTB/McGraw-Hill, 2003; MacGinitie et al., 2000; Williams,
2001; SAT 10, Harcourt Assessment, Inc., 2004; Harcourt Assessment, Inc., 2004).

C-2 Interim Report: Measures
Five of the six tests have reliability coefficients reported in published manuals of close to 0.90 for the majority of subtests. Because the reliability for Terra Nova Grade 1 was 0.76, and data were not available for the other grade levels, that test was eliminated from consideration. The Stanford Reading First Test was also eliminated, because it had been normed on a relatively small sample according to a conversation with a Harcourt representative in 2004 (< 400 students across several grade levels), whereas the remaining five tests had been normed on samples of 1,000 or more students. Next, the team reviewed two related aspects of the tests: the number of items and amount of time required. The number of items varies considerably—from approximately 30 to 80, with fewer items typically required for grade 3 tests (although the amount of time required per item increases by grade level). The tests also vary in amount of time required, from 50 minutes for the Stanford Reading First at all three grade levels to 95 minutes for the GRADE in grade 1. The amount of time required was a consideration, but not the deciding factor. The final consideration was the relative frequency of use for the four remaining assessments in schools in the study sample. Of the states and districts that (in Summer 2004) administered standardized reading assessments to children in grades 1, 2, and 3, more used the SAT 10 than any other test (although none did so in fall of grade 1). The study consequently chose the SAT 10 because it both met all the criteria above and because its use might allow the study to collect extant data, which would reduce the testing burden on students and schools. (Where extant data were not available, the study would administer the SAT 10.) The specific properties of the SAT 10 are summarized in Exhibit C.1 below.
Exhibit C.1: Features of SAT 10: Reading/Listening Comprehension for Spring Administration
Grade Level Grade 1 Grade 2 Grade 3
Spring
(Primary 1) Spring
(Primary 2) Spring
(Primary 3) Number of Items 40 40 54 Time in Minutes 50 50 60 Test-Retest Reliability* .91 .91 .93 Concurrent Validity To SESAT-2:1 .63
Form A to B: .87 To Primary 1: .69
Form A to B: .85 To Primary 2: .80
Form A to B: .83 N in Norming Sample 3,392 3,558 2,160
*Reliability is test-retest Kuder-Richardson formula 20 (KR 20) 1 Stanford Early School Achievement Test. Sources: Harcourt Assessment, Inc. (2004)
Data Collection and Response Rates
In six sites, the RFIS obtained SAT 10 data directly from state and/or district education officials. In 12 sites, the RFIS collected test data directly. The student assessments were administered in grades 1, 2, and 3, at three timepoints: fall 2004, spring 2005, and spring 2006. To conduct the testing, one site assessment coordinator was hired at each district (local), and that coordinator in turn hired a local team of test administrators. Since the SAT 10 is a standardized test, the requirements of the test publisher for administration were followed. Site assessment coordinators also observed each test administrator in the classroom for quality control and technical assistance. In addition, staff from the home office visited districts during the testing for quality control purposes.

Interim Report: Measures C-3
The study team collected classroom rosters prior to administration, and used these rosters to pre-label the student test booklets with the student ID and a strippable name label. Once the test booklet was complete, the test administrator stripped the name label from the booklet (for privacy purposes) and adhered it to a receipt sheet. The test administrator then delivered the completed booklets and the receipt sheet to the site assessment coordinator who was responsible for keeping track of who had been tested and who required make-up testing. A computerized field management system allowed the site coordinators to receive the booklets and also to print out a list by school and grade regarding which students needed makeup testing. Once testing was complete in the district, the site coordinator shipped the hardcopy test booklets to be processed. In fall 2004, there were two main factors in maximizing response rates: obtaining parent permission at more than one timepoint, and administering make-up tests for students who missed the originally scheduled testing sessions. In the initial two weeks of student assessment, the RFIS assessed all students present in the classroom who had returned signed permission slips. Study staff worked with school liaisons prior to the scheduled assessment date to obtain as many permission slips as possible. For those students who returned permission slips after the scheduled assessment day, or were absent, group make-up sessions were held at each school. Students were not eligible for the assessments if they were excluded from testing in accordance with their own school or district policies (generally because they received instruction primarily in a language other than English), and/or needed special accommodations (particularly an exam writer/scribe). The consent rates and resultant response rates were considerably lower than hoped in fall 2004 (75 and 70 percent, respectively, for Reading First and comparison schools). The RFIS obtained a waiver from participating districts and from the Abt Associates IRB to use passive consent in subsequent testing, which increased the effective response rates to 84 and 83 percent, respectively, for Reading First and comparison schools in spring 2005, and to 86 and 85 percent in spring 2006. A flowchart presenting student assessment sample information in the 12 sites in which the RFIS collected test data directly is presented in Exhibit C.2. In the 2004-05 school year, the study team endeavored to test all students within grades 1, 2, and 3 in the participating schools. However, the fact that some schools had as many as 10 or 12 classrooms per grade level led the study team to sample classrooms within grades in subsequent testing, such that the team assessed an average of three classrooms per grade per school in spring 2006 (and spring 2007). Note that the RFIS tested all students as required by local policy in those schools that routinely administered the SAT 10 reading comprehension as part of state- or district-standardized assessment. In all sites, testing procedures were equivalent for Reading First and for comparison schools. Some sites required classroom teachers to administer tests; other sites relied upon RFIS staff to administer assessments. In the latter sites, the RFIS Team worked with district officials to carry out testing in accordance with local guidelines. In fall 2004, assessment data were collected for 30,854 students, who represent 71 percent of eligible students in the sample. The response rates for grades 1, 2, and 3 were 70 percent, 70 percent, and 71 percent, respectively. For spring 2005, assessment data were gathered on 43,769 students, or 83 percent of eligible students. The response rates for grades 1, 2, and 3 were 82 percent, 83 percent, and 84 percent, respectively. For spring 2006, assessment data were collected on 36,500 students, or 86 percent of eligible students. The response rates for grades 1, 2, and 3 were 86 percent, 86 percent, and 87 percent, respectively. (See Exhibit C.2.)

C-4 Interim Report: Measures
Exhibit C.2: Student Assessment Data Collection: Sample Information
Notes: The information presented in the flowchart represents the 12 sites in which the RFIS collected test data directly. For information on the total number of students assessed (including those in the six sites in which the RFIS obtained student test data from state and/or district education officials), see Exhibit 3.2. Students were not eligible for assessments if they were excluded from testing in accordance with their own school or district policies (generally because they received instruction primarily in a language other than English), and/or they needed special accommodations beyond those that could be provided through additional time in a group administered testing situation. Eligible students were not tested if they were absent at the time the test was given and could not be rescheduled, they had transferred out, they had refused to take the test, or the RFIS did not have consent for them to participate in the study. Source: RFIS SAT 10 administration, fall 2004, spring 2005, and spring 2006
Schools in Sample
RF: 91 Non-RF: 89 Total: 180
Schools in Sample
RF: 91 Non-RF: 89 Total: 180
Students in Grades 1 - 3
Fall 2004 Spring 2005 Spring 2006RF: 18,855 19,157 14,616Non-RF: 19,409 19,627 14,689Total: 38,264 38,784 29,305
Students in Grades 1 - 3
Fall 2004 Spring 2005 Spring 2006RF: 18,855 19,157 14,616Non-RF: 19,409 19,627 14,689Total: 38,264 38,784 29,305
Students Eligible to be Tested
Fall 2004 Spring 2005 Spring 2006RF: 17,778 18,136 14,239Non-RF: 18,183 18,380 14,317Total: 35,961 36,516 28,556
Students Eligible to be Tested
Fall 2004 Spring 2005 Spring 2006RF: 17,778 18,136 14,239Non-RF: 18,183 18,380 14,317Total: 35,961 36,516 28,556
Students Tested
Fall 2004 Spring 2005 Spring 2006RF: 12,726 (72%) 14,876 (82%) 11,935 (84%)Non-RF: 12,911 (71%) 14,646 (80%) 12,137 (85%)Total: 25,637 (71%) 29,522 (81%) 24,072 (84%)
Students Tested
Fall 2004 Spring 2005 Spring 2006RF: 12,726 (72%) 14,876 (82%) 11,935 (84%)Non-RF: 12,911 (71%) 14,646 (80%) 12,137 (85%)Total: 25,637 (71%) 29,522 (81%) 24,072 (84%)
Students Not Eligible to be Tested
Fall 2004 Spring 2005 Spring 2006RF: 1,007 1,021 377Non-RF: 1,226 1,247 372Total: 2,303 2,268 749
Students Not Eligible to be Tested
Fall 2004 Spring 2005 Spring 2006RF: 1,007 1,021 377Non-RF: 1,226 1,247 372Total: 2,303 2,268 749
Eligible Students Not Tested
Fall 2004 Spring 2005 Spring 2006RF: 5,052 3,260 2,304Non-RF: 5,272 3,734 2,180Total: 10,324 6,994 4,484
Eligible Students Not Tested
Fall 2004 Spring 2005 Spring 2006RF: 5,052 3,260 2,304Non-RF: 5,272 3,734 2,180Total: 10,324 6,994 4,484
Schools in Sample
RF: 91 Non-RF: 89 Total: 180
Schools in Sample
RF: 91 Non-RF: 89 Total: 180
Students in Grades 1 - 3
Fall 2004 Spring 2005 Spring 2006RF: 18,855 19,157 14,616Non-RF: 19,409 19,627 14,689Total: 38,264 38,784 29,305
Students in Grades 1 - 3
Fall 2004 Spring 2005 Spring 2006RF: 18,855 19,157 14,616Non-RF: 19,409 19,627 14,689Total: 38,264 38,784 29,305
Students Eligible to be Tested
Fall 2004 Spring 2005 Spring 2006RF: 17,778 18,136 14,239Non-RF: 18,183 18,380 14,317Total: 35,961 36,516 28,556
Students Eligible to be Tested
Fall 2004 Spring 2005 Spring 2006RF: 17,778 18,136 14,239Non-RF: 18,183 18,380 14,317Total: 35,961 36,516 28,556
Students Tested
Fall 2004 Spring 2005 Spring 2006RF: 12,726 (72%) 14,876 (82%) 11,935 (84%)Non-RF: 12,911 (71%) 14,646 (80%) 12,137 (85%)Total: 25,637 (71%) 29,522 (81%) 24,072 (84%)
Students Tested
Fall 2004 Spring 2005 Spring 2006RF: 12,726 (72%) 14,876 (82%) 11,935 (84%)Non-RF: 12,911 (71%) 14,646 (80%) 12,137 (85%)Total: 25,637 (71%) 29,522 (81%) 24,072 (84%)
Students Not Eligible to be Tested
Fall 2004 Spring 2005 Spring 2006RF: 1,007 1,021 377Non-RF: 1,226 1,247 372Total: 2,303 2,268 749
Students Not Eligible to be Tested
Fall 2004 Spring 2005 Spring 2006RF: 1,007 1,021 377Non-RF: 1,226 1,247 372Total: 2,303 2,268 749
Eligible Students Not Tested
Fall 2004 Spring 2005 Spring 2006RF: 5,052 3,260 2,304Non-RF: 5,272 3,734 2,180Total: 10,324 6,994 4,484
Eligible Students Not Tested
Fall 2004 Spring 2005 Spring 2006RF: 5,052 3,260 2,304Non-RF: 5,272 3,734 2,180Total: 10,324 6,994 4,484

Interim Report: Measures C-5
Part 2: Classroom Instruction: The Instructional Practice in Reading Inventory (IPRI)
Background
To measure the impact of Reading First on classroom instruction, the RFIS team conducted classroom observations in both Reading First and non-Reading First (non-RF) classrooms. The primary instrument used to assess instruction was the Instructional Practice in Reading Inventory (IPRI).20 The RFIS Team was unable to identify an existing observational instrument that fulfilled all of the study requirements; consequently, the RFIS Team developed the IPRI specifically for the RFIS. The IPRI is designed to measure first- and second-grade teachers’ use of instructional behaviors informed by scientifically-based reading research (SBRR), as described in the National Research Council’s (1998) report (Snow, Burns, and Griffin, 1998) and the National Reading Panel report (National Institute of Child Health and Human Development, 2000). In particular, the IPRI focuses on instruction in the five dimensions of reading instruction emphasized by SBRR (phonemic awareness, decoding/phonics, fluency, vocabulary, and comprehension). Exhibit C.3 gives specific examples of instructional activities associated with each of the five dimensions.
20 A second instrument used in classroom observations, the Student Time-on-Task and Engagement with Print
measure, is described in Appendix C, Part 3.

C-6 Interim Report: Measures
Exhibit C.3: Examples of Instruction in the Five Dimensions of Reading Instruction
The teacher is working with a group of four students. The teacher says, “Listen to me. The word is hat. If I take away the /h/ sound at the beginning, I have the word at. Then if I add a /b/ sound to the beginning I get bat. Now you try. The word is sat. If we take away the /s/ sound what word do we have?” [students respond orally]. “That’s right, at. Now add a /k/ sound to the beginning. What word? That’s right, cat.” Phonemic
awareness The teacher is working with a pair of students. He asks students to identify the final sound in each of a list of 10 words. The students respond orally to each prompt from the teacher: “Crack. What’s the last sound in crack? [students respond orally]. Good. Ok: Take. What’s the last sound? [students respond orally]. Ok, next: kite. What’s the last sound? [students respond orally]. How about flight? [students respond orally]. That’s right, /t/, /t/ is the last sound in flight. “
A group of 16 students has assembled in front of the classroom blackboard. The teacher writes the letters oi on the board and says, “Ok, now today we’re going to be learning about words that have o, i in them. When you see these vowels together, they make the /oy/ sound. Here’s an example.” The teacher writes a sentence on the board: I want Roger to join my club. She underlines the letters oi in the word join. “This word is join. ‘I want Roger to join my club. See that oi? What sound does oi make?” [students respond, some of them incorrectly]. “Ok, listen carefully. Not /eye/… no, oi makes the /oy/ sound. Everyone try that: /oy/.” [students in unison say /oy/]. “Ok, good, now what’s this word [she points to join]?” The students pronounce join correctly. “Excellent, ok, let’s try another one.” She writes the word coin on the board. “Boys and girls, look at that oi in the word. Sound out this word for me.”
Decoding Six students are seated with a teacher. Each student has a set of individual magnetic letters and a metal tray. The teacher is asking students to form words that she dictates orally: “Ok, listen to the word, think about the sounds and what letters go with those sounds. Remember that we’ve been working with the /ō/ sound and its spellings. We know that one way to spell that is with o, a. Try to make the word using your letters. The first word is goat. Use your letters to make the word goat.” Students assemble their letters and the teacher checks each student’s work. “Good. Everyone used o, a to spell goat. Ok, let’s try another word: float.” Students form the word with their letters. “Ok, good! You’re doing very well. Now, we also know another way to spell some words with the long /ō/ sound. Remember the silent e rule? It makes the vowel say its name. So, to spell the word tote, Arthur, tell me how we’d write tote?”
The teacher gives a definition for the word swift and uses it in a sentence: “Swiftly? Something that is swift is moving very fast, rapidly. So, remember when we learned about how fast cheetahs can run over land? Well, we might say, ‘the cheetah ran swiftly across the ground, quickly catching up to the tiger.’”
Vocabulary
As they are reading a story in class, students come across the word debating, and the teacher discovers that they do not know what it means. The teacher defines debating by contrasting it with more familiar words (chatting and talking). The teacher says, “When two people are debating something, it means that they are talking about the reasons to do something and the reasons not to do something⎯so in our story, John and Sara are debating whether or not to go on a picnic. On the one hand, the weather is nice, but on the other hand they are thinking there may be a lot of ants. So they’re debating what to do. Chatting is different than debating. When you’re chatting with someone, you’re usually not trying to decide something, you’re just talking about things that aren’t too serious. You chat more to enjoy the talking, not really to decide something together.”

Interim Report: Measures C-7
Exhibit C.3: Examples of Instruction in the Five Dimensions of Reading Instruction
Roberto is reading orally from a passage about parrots and their habitat. When he reaches the end of the second paragraph, the teacher asks Roberto to read that same passage aloud again. When Roberto finishes, the teacher asks him to read the passage out loud a third time.
Fluency The teacher assigns four students to pairs and distributes a page-long excerpt from a story they have been reading in class that week. Each pair of students also has a one minute timer. “Ok, now you each have a partner, and I want you to time your partner reading this passage out loud. Readers, you try to read as far as you can in one-minute. Timers, you keep track of the time and tell your partner to stop reading when time runs out. Then circle the last word the reader got to in the passage.”
A teacher pauses in the middle of a story about Shackleton’s Antarctic Voyage to ask students to reflect on what they have just read and draw some inferences about how one character might be feeling. “What do you think the captain is feeling? Let’s see. The story doesn’t tell us exactly, but the story says the ship is starting to break apart. I’d certainly be very worried for myself and my crew if my ship were breaking apart! I bet the captain is really worried. Let’s see… the story also says the captain ‘furrowed his brow.’ That means he made his forehead wrinkle or sort of frown. Some people do that when they’re worried. That could be a sign that the captain is worried. He certainly has reason to be worried.” Comprehension
The teacher introduces a comprehension strategy. “One thing you should always do when you read is constantly ask yourself questions about the story. Asking yourself questions is a strategy to help make sure you understand what you just read. Asking questions also helps you think about what might happen next. We’re going to practice using this strategy. At the end of every paragraph today, we’re going to come up with some questions and write them up here on the board. Some questions we’ll be able to answer right away. But we might have other questions, too, and we’ll need to read more of the story before we can find out how to answer those questions.”
The development of the IPRI relied on several sources, including (1) research on the components of effective elementary grade reading instruction (e.g., Kamil, 2004; National Institute of Child Health and Human Development, 2000; Snow, Burns and Griffin, 1998; Stahl, 2004); (2) reviews of existing instruments (among the instruments reviewed were the following: The Instructional Content Emphasis (ICE) [Edmonds and Briggs, 2003]; Foorman and Schatschneider direct observation system and instruments from the Center for Academic and Reading Skills (CARS) [Foorman and Schatschneider, 2003]; English Language Learner Classroom Observation Instrument (ELLCOI) [Haager et al., 2003]; Teachers’ Instructional Practice (TIP) [Carlisle and Scott, 2003]; Utah’s Profile of Scientifically-based Reading Research [Dole, et al., 2001]; The Classroom Observation Record [Abt Associates and RMC Research, 2002]; and Observation Measure of Language and Literacy Instruction (OMLIT), developed by Abt Associates as part of the Even Start Classroom Literacy Interventions and Outcomes (CLIO) Study [Goodson et al., 2004]); and (3) research on the development of classroom observation instruments (Vaughn and Briggs, 2003).21
21 For a comprehensive description of the development of the IPRI, see Dwyer et al., 2007.

C-8 Interim Report: Measures
Overview of the IPRI
The IPRI observation instrument is a booklet containing a series of individual IPRI forms, each of which corresponds to a three-minute observation interval.22 Observation data for a given reading block are collected via sequentially-ordered IPRI forms that span the entire observation period (e.g., a 60-minute observation would be recorded on 20 sequential forms, one for each successive three-minute interval). During each three-minute interval, observers record any of the teacher’s instructional behaviors listed on the IPRI that occur during that interval. At the end of each three-minute interval (signaled by a pre-programmed vibrating wristwatch), observers turn to a new IPRI form and begin another three-minute interval, again recording the presence of targeted behaviors. Within a given three-minute interval, a particular behavior is coded only once, regardless of how often that behavior occurs within an interval. Recurrences of that same behavior are coded in each subsequent interval. If behavior x occurs in interval n, the observer circles the code for behavior x once during interval n. If behavior x occurs in the next interval, n+1, the observer circles the code for behavior x during interval n+1.
22 See Exhibit C.4 for a copy of the IPRI instrument.

Exhibit C.4: Instructional Practice in Reading Inventory (IPRI)
C-9
Interim
Report: M
easures

Interim R
eport: Measures
C
-10

Interim Report: Measures C-11
Structure of the IPRI Instrument
Each IPRI form has four distinct parts: Part A, Part B, Part C, and Part D. Part A is divided into five color-coded sections that correspond to the five dimensions of reading instruction: phonemic awareness, decoding/phonics, fluency, vocabulary, and comprehension, respectively. Within each of these five sections are microcodes, specifically tailored to each of the five dimensions, which denote the following areas of interest:
• the size of the student grouping to which instruction is delivered; • the use of any instructional support materials (e.g, manipulatives, pictures); • the teacher’s use of explicit instruction; • the teacher’s provision of practice opportunities for students; and • the teacher’s delivery of any corrective feedback or expansion of student responses.
For example, within the phonemic awareness row, the IPRI microcodes for grouping are “whole class, large group, small group, pair, or individual”; for the use of various types of instructional supports, “teacher manipulative or kinesthetic, student manipulatives, kinesthetics”; and for corrective feedback, “teacher pinpoints what student(s) did incorrectly with sound(s) and gives correct response with or without students.” For the use of explicit instruction and the provision of practice opportunities for students, these areas of interest are often denoted by the combination of two or more microcodes. So, for example, if a teacher “demonstrates or models oral blending or segmenting with phonemes” in conjunction with “gives student(s) chance to practice oral blending or segmenting with phonemes,” it would be counted as explicit instruction. Part B of the IPRI contains codes to capture instruction or other activity outside the five dimensions, including:
• Oral reading by students; 23 • Oral reading by teacher alone (without student accompaniment); • Silent reading; • Spelling; • Written expression; • Other language arts; • Assessment; • Non-literacy instruction; • Non-instruction; • Academic management; • Transitions between activities; • Interruptions to instruction for the purpose of managing student behavior.
23 Oral reading under Part B is marked when the teacher has not clearly indicated the instructional purpose of
the oral reading. If, however, oral reading is used to advance instruction in one of the five targeted dimensions of reading instruction (e.g., comprehension), then the oral reading is coded within the corresponding row in Part A of the IPRI.

C-12 Interim Report: Measures
Part C records teachers’ instructional errors that are not subsequently self-corrected. Part D records whether the teacher worked with a different small group of students than in any previous part of the observation.24 Training and Inter-rater Reliability of Classroom Observers
Prior to each wave of data collection, field staff based in each of the RFIS sites attended a centralized, multi-day training on the IPRI and associated data collection protocols. The training curriculum included extensive practice coding a series of videotaped clips of real-time and unscripted classroom instruction that were filmed in RF and non-RF classrooms. The film clips were created specifically for the RFIS, and were edited to illustrate the codes included on the IPRI. Candidate observers conducted a live observation in a first or second grade classroom during the training session and received ongoing feedback, multiple opportunities for review, tutoring and other support throughout the training.25 One component of this training was that observers were required to pass two of three formal inter-rater reliability tests; each videotape used for reliability purposes was approximately 30 minutes in length. To calculate observers’ percent agreement with the master coding of each reliability tape, the RFIS Team used a procedure that reduces inflation in inter-rater reliability estimates due to chance agreement (see Kelly, 1977, cited in Suen and Ary, 1989). The inflation due to chance agreement is especially severe when some events (or codes) occur infrequently, as is the case with the IPRI.26 As a result, observers were credited only for codes that occurred at least once in the reliability tape. In sum, if a behavior occurred at all during a 30-minute tape, observers were credited (or penalized) for correctly coding instances of the behavior and for correctly abstaining from coding behaviors that did not occur. Observers were not credited for abstaining from, nor penalized for, marking behaviors that never occurred throughout the entire reliability tape. For each potential observer, percent agreement with the master codes was calculated for each code individually; then agreement was aggregated across codes within the five sections in Part A and across codes within Part B. Finally, an aggregate overall percentage agreement across the five sections in Part A and codes within Part B was calculated. A report summarizing all of these measures of agreement (by individual code, by dimension, and overall) was prepared for each potential observer so that s/he (and the study team) could diagnose which codes had proven particularly troubling. Overall percent agreement was used to judge whether or not each observer had met the criterion for employment on the study. Only observers who successfully coded two of three videotaped reliability tests were hired. The mean overall percent agreement for observers was 88 percent (n=155 observers) in spring 2005 (for spring 2005 data collection). The mean overall percent
24 Minor changes were made to the IPRI after the spring 2005 data collection and prior to the fall 2005 wave
of data collection; these changes included elaborating upon some micro-behaviors within each of the five dimensions.
25 For a detailed description of the classroom observer training, see Dixon et al. (2007). 26 During each observation interval, an IPRI form contains 142 possible codes; typically, only a small subset
of the behaviors occur during a given interval. Thus, most of the possible codes are infrequent within a single interval. Including all 142 codes per interval in the calculation of percent agreement severely inflates inter-rater reliability.

Interim Report: Measures C-13
agreement for observers was 90 percent (n=154 observers) in fall 2005 (for fall 2005 and spring 2006 data collection). Data Collection
Observations were conducted in each of 1,378 to 1,579 or more first- and second-grade classrooms for two consecutive days during each classroom’s designated reading block. During the 2004-05 school year, the RFIS conducted two days of classroom observation in spring 2005. In the following study year, a second round of observations was added, so that observers conducted observations for two consecutive days in the fall, and then again for two consecutive days in the spring. The increased number of observations reflects a decision by the National Center on Education Evaluation/Institute of Education Sciences at the Department of Education to collect more data, both in terms of the number of observations and in terms of when during the year data could be collected. Observation scheduling was arranged by RFIS field supervisors via communication with each participating school’s study liaison.27 Observers coded during the entire scheduled observation period, even when teachers appeared to be offering non-reading-related instruction. In those instances when reading instruction appeared to continue beyond the scheduled reading block, observers observed for up to an additional 30 minutes. Throughout observations, IPRI observers followed the actions and behaviors of classroom teachers. In classrooms with more than one adult present, observers determined beforehand who was the official teacher of record and which adult would be delivering that day’s reading instruction. The individuals responsible for delivering instruction were then followed for the observations whether or not they were the official teacher of record. Observations were rescheduled when the classroom teachers were absent or ill, although long-term substitutes replacing a teacher on an extended leave of absence (e.g., maternity, disability) were observed. The 248 schools in the RFIS study sample included 2,091 first and second grade classrooms in spring 2005, 1,989 classrooms in fall 2005, and 2,008 classrooms in spring 2006. Of these, 1,917 classrooms met eligibility requirements for classroom observations in spring 2005, 1,822 in fall 2005, and 1,827 in spring 2006. Classrooms were considered eligible to be in the study sample if they were not special education or English as a Second Language classes, if more than 75 percent of the students were in the target grades, and if the class was taught by the regular teacher or a long-term substitute. Of the eligible classrooms, the RFIS selected a final sample of 1,639 classrooms in spring 2005, 1,384 in fall 2005, and 1,386 classrooms in spring 2006. Classrooms were sampled within schools, if, within each site as a whole, the number of classrooms exceeded an average of three classrooms per grade. Each classroom in the sample was expected to be observed two times during each of the three waves of data collection. The RFIS completed 96 percent of the expected classroom observations in spring 2005, and 100 percent in fall 2005 and spring 2006. A flow chart of information on the RFIS IPRI sample and response rates is presented in Exhibit C.5.
27 In schools that did not have a designated “reading block,” the RFIS Team asked the school’s study liaison
when observers would be able to see typical reading, literacy, and/or language arts instruction in classrooms. In cases where reading instruction was delivered in two discrete blocks interrupted by other instruction or activities (e.g., lunch, recess, math instruction), field staff observed both blocks.

C-14 Interim Report: Measures
Exhibit C.5: IPRI Data Collection: School, Classroom, and Observation Sample Information
Notes: Classrooms were considered ineligible to be in the study sample if they were special education or English as a Second Language classes, if fewer than 75 percent of the students were in the target grade, or if the class was taught by someone other than the regular teacher or a long-term substitute. Classrooms were sampled within schools if, across a site as a whole, the number of classrooms exceeded an average of three classrooms per grade. Source: RFIS Instructional Practice in Reading Inventory, spring 2005, fall 2005, spring 2006
Schools in Sample
RF: 125 Non - RF: 123 Total: 248
Schools in Sample
RF: 125 Non - RF: 123 Total: 248
Grade 1 & 2 Classrooms in Sample Schools
Spring 2005 Fall 2005 Spring 2006RF: 1,056 1,010 1,022Non - RF: 1,035 979 986Total: 2,091 1,989 2,008
Grade 1 & 2 Classrooms in Sample Schools
Spring 2005 Fall 2005 Spring 2006RF: 1,056 1,010 1,022Non - RF: 1,035 979 986Total: 2,091 1,989 2,008
Classrooms That Met Observation Criteria
Spring 2005 Fall 2005 Spring 2006RF: 961 920 922Non - RF: 956 902 905Total: 1,917 1,822 1,827
Classrooms That Met Observation Criteria
Spring 2005 Fall 2005 Spring 2006RF: 961 920 922Non - RF: 956 902 905Total: 1,917 1,822 1,827
Eligible Classrooms Selected into Sample
Spring 2005 Fall 2005 Spring 2006RF: 816 696 696Non - RF: 823 688 690Total: 1,639 1,384 1,386
Eligible Classrooms Selected into Sample
Spring 2005 Fall 2005 Spring 2006RF: 816 696 696Non - RF: 823 688 690Total: 1,639 1,384 1,386
Classrooms Observed
Spring 2005 Fall 2005 Spring 2006RF: 788 692 692Non - RF: 791 686 688Total: 1,579 1,378 1,380
Classrooms Observed Spring 2005 Fall 2005 Spring 2006
RF: 788 692 692Non - RF: 791 686 688Total: 1,579 1,378 1,380
Observations Completed
Spring 2005 Fall 2005 Spring 2006RF: 1,575 (97%) 1,384 (99%) 1,384 (99%)Non - RF: 1,580 (96%) 1,372 (100%) 1,375 (100%)Total: 3,155 (96%) 2,756 (100%) 2,759 (100%)
Observations Completed
Spring 2005 Fall 2005 Spring 2006RF: 1,575 (97%) 1,384 (99%) 1,384 (99%)Non - RF: 1,580 (96%) 1,372 (100%) 1,375 (100%)Total: 3,155 (96%) 2,756 (100%) 2,759 (100%)
Classrooms that Did Not Meet Criteria
Spring 2005 Fall 2005 Spring 2006RF: 95 90 100Non-RF: 79 77 81Total: 174 167 181
Classrooms that Did Not Meet Criteria
Spring 2005 Fall 2005 Spring 2006RF: 95 90 100Non-RF: 79 77 81Total: 174 167 181
Eligible Classrooms Not Selected into Sample
Spring 2005 Fall 2005 Spring 2006RF: 145 224 226Non-RF: 133 214 215Total: 278 438 441
Eligible Classrooms Not Selected into Sample
Spring 2005 Fall 2005 Spring 2006RF: 145 224 226Non-RF: 133 214 215Total: 278 438 441
Schools in Sample
RF: 125 Non - RF: 123 Total: 248
Schools in Sample
RF: 125 Non - RF: 123 Total: 248
Grade 1 & 2 Classrooms in Sample Schools
Spring 2005 Fall 2005 Spring 2006RF: 1,056 1,010 1,022Non - RF: 1,035 979 986Total: 2,091 1,989 2,008
Grade 1 & 2 Classrooms in Sample Schools
Spring 2005 Fall 2005 Spring 2006RF: 1,056 1,010 1,022Non - RF: 1,035 979 986Total: 2,091 1,989 2,008
Classrooms That Met Observation Criteria
Spring 2005 Fall 2005 Spring 2006RF: 961 920 922Non - RF: 956 902 905Total: 1,917 1,822 1,827
Classrooms That Met Observation Criteria
Spring 2005 Fall 2005 Spring 2006RF: 961 920 922Non - RF: 956 902 905Total: 1,917 1,822 1,827
Eligible Classrooms Selected into Sample
Spring 2005 Fall 2005 Spring 2006RF: 816 696 696Non - RF: 823 688 690Total: 1,639 1,384 1,386
Eligible Classrooms Selected into Sample
Spring 2005 Fall 2005 Spring 2006RF: 816 696 696Non - RF: 823 688 690Total: 1,639 1,384 1,386
Classrooms Observed
Spring 2005 Fall 2005 Spring 2006RF: 788 692 692Non - RF: 791 686 688Total: 1,579 1,378 1,380
Classrooms Observed Spring 2005 Fall 2005 Spring 2006
RF: 788 692 692Non - RF: 791 686 688Total: 1,579 1,378 1,380
Observations Completed
Spring 2005 Fall 2005 Spring 2006RF: 1,575 (97%) 1,384 (99%) 1,384 (99%)Non - RF: 1,580 (96%) 1,372 (100%) 1,375 (100%)Total: 3,155 (96%) 2,756 (100%) 2,759 (100%)
Observations Completed
Spring 2005 Fall 2005 Spring 2006RF: 1,575 (97%) 1,384 (99%) 1,384 (99%)Non - RF: 1,580 (96%) 1,372 (100%) 1,375 (100%)Total: 3,155 (96%) 2,756 (100%) 2,759 (100%)
Classrooms that Did Not Meet Criteria
Spring 2005 Fall 2005 Spring 2006RF: 95 90 100Non-RF: 79 77 81Total: 174 167 181
Classrooms That Did Not Meet Criteria
Spring 2005 Fall 2005 Spring 2006RF: 95 90 100Non-RF: 79 77 81Total: 174 167 181
Eligible Classrooms Not Selected into Sample
Spring 2005 Fall 2005 Spring 2006RF: 145 224 226Non-RF: 133 214 215Total: 278 438 441
Eligible Classrooms Not Selected into Sample
Spring 2005 Fall 2005 Spring 2006RF: 145 224 226Non-RF: 133 214 215Total: 278 438 441

Interim Report: Measures C-15
During each data collection wave (spring 2005, fall 2005, and spring 2006), IPRI experts (from the training staff) served as quality control monitors for questions that arose in the field. Quality control monitors visited each site and accompanied a random selection of observers into scheduled classroom observations. The monitors reviewed the observation coding with the observers, addressing coding discrepancies and questions.28 Throughout the data collection period, observers could direct questions to the monitors and to other RFIS staff. Questions and answers were aggregated and disseminated to all observers via an RFIS observer website and regular mailings. Creation of Analytic Variables
To test whether or not instruction in RF classrooms differed from that in non-RF classrooms, the study team created eight measures of classroom instruction from the IPRI data. The number of measures was deliberately limited so that the analysis would be parsimonious, and would thereby restrict the number of statistical tests required. The measures were:
• Time spent in instruction in each of the five targeted dimensions of reading instruction separately: o phonemic awareness; o phonics/decoding; o vocabulary; o fluency; o comprehension;
• Time spent in instruction in the five dimensions combined;
• Proportion of instruction in the five dimensions that was highly explicit—that includes teacher modeling, clear explanations, and the use of examples;
• Proportion of instruction in the five dimensions that provided students with high quality practice opportunities—that includes, for example, teachers giving students the opportunity to practice word learning strategies (e.g., context, word structure, and meanings).
Before describing these measures in more detail, we first describe the transformation of raw interval data into more meaningful metrics. Transformation of IPRI Observation Intervals Into Minutes The IPRI contains multiple successive three-minute intervals, each of which could potentially record a large number of instructional behaviors, if the behaviors had indeed been observed. Each behavior on the IPRI is deemed to have occurred or not occurred in each observed interval (e.g., behavior was present [checked or coded] or not [unchecked]). Across the entire set of intervals comprising a classroom observation, the IPRI yields raw data in terms of the number (or proportion) of observed intervals in which a given behavior was observed. The raw data do not directly measure the duration of particular instructional activities or behaviors. In order to describe classroom instruction with a more interpretable metric, raw intervals were transformed into minutes of instruction via the process described below.
28 Study protocols required observers to leave as is any codes marked during the observation. This procedure
allowed the RFIS study team to collect a sample of paired observations for use in determining field-based reliability.

C-16 Interim Report: Measures
For each and every interval, observers recorded instruction in one of the five dimensions (hereafter referred to as “dimensions”)29 or in other activity/instruction not in one of the five dimensions (hereafter referred to as “non-dimension activities”). These latter activities are included in “Part B” described above. Consequently, every observation interval contains at least one of the following codes that categorizes the types of instruction the teacher provided during that interval:
• Phonemic awareness; • Phonics/decoding; • Vocabulary; • Fluency; • Comprehension; • Oral reading by children;30 • Oral reading by teacher; • Silent reading; • Spelling; • Written expression; • Other language arts; • Assessment; • Non-literacy instruction; • Non-instruction; • Academic management; and/or • Transitions between instructional activities.
The allocation of time within the three-minute intervals occurred at the broader level—that is, at the level of dimension and non-dimension activities. When only one dimension or non-dimension activity was observed in an interval, the conversion process was straightforward—all three minutes of the interval were assigned to the dimension or non-dimension activity observed. When two activities were recorded in an interval, however, the process of converting intervals into minutes was less straightforward. From the raw data, there was no direct way to determine the proportion of the three minute interval that the teacher had devoted to each of the two recorded activities. Therefore, the study team developed an estimation process to allocate minutes of that interval to each of the two activities. The RFIS collected supplemental data on the actual duration of instructional activities recorded on the IPRI, and used those supplemental data to inform mathematical simulations of the outcomes of different estimation procedures. 29 For purposes of calculating minutes of instruction in a particular dimension, the micro-level codes
corresponding to aspects of instruction within each of the five dimensions were collapsed. For example, a teacher who had exhibited two different “decoding” codes within an interval was designated as having delivered decoding instruction within that interval.
30 Note that the IPRI distinguishes oral reading for its own sake from oral reading in service to a larger instructional purpose. For example, oral reading that occurred to advance a lesson in comprehension was classified as being part of the overarching comprehension instruction and was not counted as oral reading for purpose of analysis. In contrast, oral reading that occurred outside the context of one of the five dimensions of reading instruction was classified for analytic purposes as Oral Reading.

Interim Report: Measures C-17
Dividing the minutes of the interval equally. Initially, the RFIS Team considered allocating one-half of the three-minutes of an interval to each of the two activities observed. Under this procedure, if comprehension and decoding were observed in the same interval, for instance, then each would be assigned 1.5 minutes of the three-minute interval. Although this approach provides a good estimate of the true number of minutes spent in the two activities for intervals in which the two observed activities were of similar duration, for intervals in which activities were of unequal duration, however (e.g., one activity was 2.6 minutes and the other .4 minutes), this approach underestimates the amount of time in the longer activity and overestimates the amount of time spent in the shorter one. Dividing the minutes of the interval according to their relative frequency of occurrence. The study team also explored an estimation method that allocates time to each of two activities within a given interval in direct proportion to the relative frequency with which the two activities occurred, on average, within the school in which the observation had been conducted. If, on average, comprehension was present in 30 percent of the intervals collected across all observations within a school, whereas fluency instruction was present in 10 percent of all intervals collected in the school, then comprehension was three times as likely to occur as fluency instruction. Then for each interval in which comprehension and fluency were the two activities recorded, comprehension would receive 75 percent of the three minutes (or 2.25 minutes) and fluency would receive 25 percent of the three minutes (one-third the amount of time as comprehension, or .75 minutes). The RFIS Team used supplemental data on the true duration of instructional activities to simulate the precision of this estimate. The simulations suggested that the proportionally-weighted approach provided a close estimate of the true minutes spent in activities for intervals in which two activities were of unequal duration, but, conversely, it produced biased estimates of the true minutes spent in activities for intervals in which the two activities observed were of similar duration. Thus, the strengths and drawbacks of this approach were mirror opposites of those in the first approach (i.e., dividing the minutes equally among the two activities in an interval). The RFIS Team decided that an average of the two estimations would minimize the biases introduced by using either of the two transformation approaches in isolation. Dividing the minutes of the interval by taking the average of the equally and proportionally weighted approaches. For each interval with two instructional activities recorded, a three-step estimation process was used:
1. The minutes were allocated equally between the two activities (1.5 minutes to each). 2. The minutes were allocated according to their relative frequency of occurrence across all
observations within school. 3. The average of the two estimates produced was calculated for each of the two activities.
Using the example cited above (an interval with only comprehension and fluency instruction, comprehension would be allocated 1.88 minutes, or the mean of the equally weighted and proportionally weighted approach [1.5 and 2.25, respectively]). Fluency would be allocated 1.12 minutes (the mean of 1.5 and .75 minutes). Three or more activities occurring in the same interval. When three or more instructional activities were observed in a single interval, the three minutes of the interval were divided equally among the activities. This distribution strategy was followed rather than the estimation process used

C-18 Interim Report: Measures
for two-activity intervals because the number of minutes assigned to any given activity type would be limited to one minute or less. Thus, the amount of bias introduced by using this estimation approach was likely to be small. Analytic Variables The study team constructed six variables based on the amount of time devoted to instruction in the five dimensions of reading instruction: one variable for the amount of time spent in each of the five dimensions separately, plus a sixth variable for the total amount of time spent in the five dimensions combined. Also of interest were the degree to which instruction in RF and non-RF schools was highly explicit, and the degree to which instruction offered students meaningful opportunities to practice developing reading skills. To examine these outcomes, two additional variables were constructed: the percentage of instruction in the five dimensions in which at least one instance of highly explicit instruction occurred; and the percentage of instruction in the five dimensions in which at least one instance of high quality student practice occurred. These two variables are defined below. Percentage of intervals of instruction in the five dimensions that included at least one instance of highly explicit instruction. “Highly explicit instruction” is defined differently in each dimension of reading instruction, based on research published in the National Research council report (Snow, Burns, and Griffin, 1998) as well as more recent research (e.g., Graves, Gerston and Haager, 2004; Gunn et al., 2002 for specific examples of highly explicit instruction in phonemic awareness, and Foorman and Torgesen, 2001, Graves, Gerston and Haager, 2004, for specific examples of highly explicit instruction in phonics). Exhibit C.6 lists the specific citations for examples of highly explicit instructional strategies for each of the five components of reading instruction targeted by the legislation.31 The specific instructional strategies, or combinations of strategies used together, that were considered to be “highly explicit” are presented in Exhibit C.6. This variable was created by dividing the number of intervals that included one or more “highly explicit” instructional practices by the number of intervals that included instruction in one or more of the five dimensions. Percentage of intervals of instruction in the five dimensions that included at least one instance of high quality student practice. “High quality student practice” is also defined differently in each dimension of reading instruction, based on research published in the National Reading Panel report (National Institute of Child Health and Human Development, 2000) as well as more recent research (e.g., Armbruster, Lehr and Osborn, 2003 for specific examples of high quality student practice in phonemic awareness, and Rasinski and Oswald, 2005, for specific examples of high quality student practice in phonics). Exhibit C.6 lists the specific citations for examples of high quality student practice for each of the five dimensions of reading instruction targeted by the legislation. The specific instructional strategies, or combinations of strategies used together, that were considered to be “high quality student practice” are presented in Exhibit C.6. This variable was created by dividing the number of intervals that included one or more instance of “high quality student practice” by the number of intervals that included instruction in one or more of the five dimensions. 31 No codes in the fluency dimension were classified as “highly explicit” instruction. Helping beginning
readers build fluency inherently rests on providing students high quality practice opportunities, rather than delivering explicit instruction in how to read fluently. As a result, codes in the fluency section were used only in the construction of the high quality student practice variable.

Interim Report: Measures C-19
Exhibit C.6: Composite of Classroom Constructs
Minutes spent in instruction in each of the five dimensions of reading instruction Number of minutes spent in any teacher instruction or student practice activity on the IPRI that was in the five dimensions of reading instruction emphasized in Reading First:
• Phonemic awareness • Phonics/decoding • Vocabulary • Fluency • Comprehension • All five dimensions combined
Percentage of observation intervals with instruction in the five dimensions of reading instruction with one or more instance of highly explicit instruction An observation interval was coded as containing instruction in the five dimensions of reading instruction and at least one instance of highly explicit instruction if one or more of the following teacher activities (or combination of activities) were observed during instruction in one of the four reading dimensions that included highly explicit instructional activities. Phonemic Awareness:32
• Teacher demonstrates or models oral blending or segmenting with phonemes in conjunction with: − Giving students practice in oral blending or segmenting with phonemes
• Teacher demonstrates or models phoneme isolation in conjunction with: − Giving students practice in phoneme isolation
• Teacher demonstrates or models phoneme categorization/identity (same/different sounds in words) in conjunction with: − Giving students practice in phoneme categorization/identity
• Teacher demonstrates or models phoneme deletion, addition, or substitution in conjunction with: − Giving students practice in phoneme deletion, addition, or substitution
• Teacher contrasts two phonemes to pinpoint a target sound • Teacher pinpoints what students did incorrectly and gives correct response
Phonics/decoding:33 • Teacher identifies words that contrast with or do not follow pattern or rule • Teacher reminds students of pattern or rule and has students produce or repeat correct response, if
a student makes a mistake • Teacher describes, explains, or identifies, or asks students to describe, explain, or identify a sound-
symbol pattern, decoding rule, or a word structure pattern or rule in conjunction with: − Showing students how to apply a rule or pattern to a whole word example, and − Giving students chance to practice decoding words
• Teacher describes, explains, or identifies, or asks students to describe, explain, or identify a sound-symbol pattern, decoding rule, or a word structure pattern or rule in conjunction with: − Showing students how to apply a rule or pattern to a whole word example, and − Giving students practice encoding words by manipulating or writing letters
32 Ball and Blachman (1991); Bus and van Ijzendoorn (1999); Foorman et al. (1998); Graves et al. (2004);
Gunn et al. (2002); Hatcher et al. (2004); McCutchen et al. (2002); Torgesen et al. (1999). 33 Foorman et al. (1998); Foorman and Torgesen (2001); Graves et al. (2004).

C-20 Interim Report: Measures
Exhibit C.6: Composite of Classroom Constructs
Highly explicit instruction (continued)
Vocabulary:34 • Teacher goes beyond synonym with definition and/or examples • Teacher pinpoints word meaning by giving contrasting examples • Teacher pinpoints word meaning by clarifying or extending a partially correct student response • Teacher pinpoints word meaning by clarifying or extending a partially correct student response with a
synonym, definition, example, or contrasting example
Teacher uses a picture, object, or physical demonstration to illustrate word meaning in conjunction with any other vocabulary instructional behaviors including those above and the following:
• Teacher asks students to give meaning of word • Teacher gives synonym • Teacher asks students to apply understanding of word meaning • Teacher gives students opportunity to practice word learning strategies (e.g., using context, word
structure, or root meanings)
Comprehension:35 Before, during, or after reading a text passage, teacher describes or explains, or asks students to describe or explain one or more comprehension strategies by specifying:
• What the comprehension strategy is called, and • Why the comprehension strategy is helpful, and • When in the reading process the comprehension strategy is used
During or after reading a text passage, teacher shows how to apply strategy by modeling how to: • Answer inferential questions based on text • Make predictions based on text • Summarize, retell, sequence text, or identify the main idea(s) • Make text-to-text connections • Generate own questions about text • Answer own questions about text • Review passage to check or clarify understanding • Check accuracy of prediction or inference • Work with story or expository structure
If a student response is incorrect or incomplete, teacher assists student in using strategy(ies)
Percentage of observation intervals with instruction in the five dimensions of reading instruction with one or more instance of high quality student practice
An observation interval was coded as containing instruction in the five dimensions of reading instruction and at least one instance of high quality student practice if one or more of the following teacher activities (or combination of activities) were observed during instruction in one of the five dimensions. Phonemic Awareness:36
• Teacher gives students practice in oral blending or segmenting with phonemes while working with pairs or small groups
• Teacher gives students practice in phoneme isolation while working with pairs or small groups • Teacher gives students practice in phoneme categorization/identity (same/different sounds in words)
while working with pairs or small groups • Teacher gives students practice in phoneme deletion, addition, or substitution while working with
pairs or small groups 34 Brett et al. (1996); Graves et al. (2004); Kamil (2004); McKeown et al. (1985); Tomesen and Aarnoutse
(1998). 35 Crowe (2005); Kamil (2004); Mason (2004); O’Connor et al. (2002); Rosenshine et al. (1996). 36 Ambruster et al. (2003); National Institute of Child Health and Human Development (2000).

Interim Report: Measures C-21
Exhibit C.6: Composite of Classroom Constructs
High quality student practice (continued)
Phonics/decoding:37 • Teacher gives students practice encoding words by manipulating or writing letters
Vocabulary:38 • Teacher gives students the opportunity to practice word learning strategies (e.g. context, word
structure, and root meanings)
Fluency:39 • Teacher gives students the opportunity to repeat oral readings with same text that was modeled by a
fluent reader
Comprehension:40 During or after reading a text passage, teacher gives students practice in applying strategy by having students:
• Generate own questions about text • Answer own questions about text • Review passage to check or clarify understanding • Work with story or expository structure in conjunction with:
− Using a text organizer for support • Check accuracy of prediction or inference • Justify their response with evidence
37 Rasinski and Oswald (2005). 38 Ambruster et al. (2003); National Institute of Child Health and Human Development (2000). 39 Graves et al. (2004); O’Connor et al. (2002); Stahl (2004); Therrien (2004). 40 Kamil (2004); Mason (2004); Reutzek and Hollingsworth (1991); Taylor et al. (2002).

C-22 Interim Report: Measures
Field Reliability of the IPRI
In each wave of data collection, experienced IPRI trainers were paired with a random sample of classroom observers to collect data necessary to measure the field-based reliability of the IPRI.41 In contrast to determining the accuracy of an individual observer for purposes of training and hiring, the purpose of field-based inter-rater reliability (IRR) estimates is to assess the reliability of the instrument itself. Researchers often characterize the reliability of an observation instrument by estimating an intra-class correlation (ICC), defined here as the proportion of variance associated with observers relative to the total variance in the collected data. That is, the team sought to characterize the proportion of variance in the observation data due to each of three sources:
• inter-observer differences • inter-classroom differences • random measurement error
The RFIS Team used several approaches to attempt to capture the degree of error that can be attributed to observers themselves (as opposed to random measurement error or other forms of systematic measurement error). These approaches included: (1)(a) calculating a pseudo intraclass correlation (ICC) by running an unconditional Hierarchical Linear Model (HLM), and (b) correlating Observer A’s and Observer B’s codes across multiple intervals within an observation and then averaging these correlations across pairs of observers, and (2) calculating a generalizability coefficient within the generalizability framework (Cronbach et al., 1972 as cited in Brennan, 2001). Using a Pseudo Intraclass Correlation to Describe Inter-rater Reliability In the context of measuring inter-rater reliability of the IPRI based on paired field observations, consider the following model: crrccrX νννμ +++= (1) In (1), crX is the outcome measure for classroom c, as rated by observer r; μ is the mean outcome across classrooms; and νc, νr, and νc4 are independent error terms associated with the variance across classrooms, systematic measurement error introduced by the observers, and random measurement error; each with a mean of 0 and variances of σc, σr, and σcr. Using this model, we can define the proportion of the total measurement variance that is due to the systematic measurement error introduced by the observers 1ρ and the proportion of the true variance across classrooms 2ρ as follows:
222
2
1crrc
r
σσσσρ
++= (2)
222
2
2crrc
c
σσσσρ
++= (3)
41 Half of the field observers were paired with co-observers in spring 2005. In subsequent waves, field
observers were paired with co-observers either in fall 2005 or in spring 2006; the majority of field observers were paired for observation once during the 2005-06 school year.

Interim Report: Measures C-23
(2) indicates the proportion of error that can be attributed to variation across individual observers (observers may vary in their skill at using the IPRI). An examination of (3) shows that to the extent that variance attributable to observers ( 2
rσ ) is low, the proportion of variance due to true variance across classrooms is high (assuming that random measurement error is small); as 1ρ decreases, 2ρ increases. Thus, the lower the ICC, the higher the reliability of the IPRI. Ideally, intra-class correlations are calculated using a fully crossed design, such that each of a set of R observers observes each of C classrooms. In a fully-crossed design, the variance associated with individual observers can be estimated separately from the systematic error associated with individual classrooms. However, a fully-crossed design was not possible in the context of the RFIS, which used 150 observers to record instruction in approximately 1,400 classrooms during each round of data collection. Instead, joint observations were conducted in a sample of classrooms by two observers, one a master observer and the other a member of the field staff. No individual observed more than a small subset of the total number of classrooms. Thus, these data do not allow separate estimate variation due to rater or classroom alone. The RFIS Team obtained pseudo-ICC estimates using field IRR samples as if they were fully crossed. Such estimates provide a biased estimate of the actual error due to observers, because they also include some of the error associated with inter-classroom differences; however, the estimates are conservative, attributing more error to observers than they would in a fully-crossed design. Therefore, if the pseudo-ICC estimates of inter-observer error are low, despite the fact that they include error associated with the individual classrooms, we can be confident that the true amount of error due to differences between observers is even lower⎯and thus that the IPRI is a reliable instrument. Most study classrooms were jointly observed for about 30 three-minute intervals, although some joint observations covered fewer and others covered more intervals. In order to construct a fully balanced sample, for each wave of the field IRR samples, the study team (i) dropped classrooms that were observed for fewer than 25 intervals; and (ii) included only the first 25 observation intervals from classrooms that were observed for more than 25 intervals.42 As a result, the reliability was calculated with 65 classrooms from spring 2005, 62 classrooms from fall 2005, and 36 classrooms from spring 2006 data collections to assess field-based IRR. (See Exhibit C.7.) For each of the analytic variables created from IPRI data, the team calculated reliability estimates by estimating the variance terms in equations 2 and 3 (σc, σr, and σcr) and by running an unconditional HLM with the field IRR samples for each observation wave. Each HLM was a two-level model with observer (A or B) nested within classroom, for each classroom that had been co-observed. Next 1ρ and 2ρ were calculated using these estimates. Corresponding results are presented in Exhibit C.7 and indicate that ICC-based reliability estimates ( 2ρ ) are consistent across the three observation waves, ranging from 0.868 to 0.91, for example, for the number of minutes spent on the five dimensions combined.
42 The 25-interval threshold attempts to balance two sometimes competing constraints: (i) minimizing the
number of classrooms that would be dropped due to lack of observations and (ii) maximizing the number of observation intervals that could be used to assess IRR.

C-24 Interim Report: Measures
Exhibit C.7: Unconditional HLM Models to Estimate Pseudo-ICCs (ρ1 ) and True Variance Across Classrooms (ρ2)
Spring 2005 (n=65)
Fall 2005 (n=62)
Spring 2006 (n=36)
Outcome ρ1 ρ2 ρ1 ρ2 ρ1 ρ2 Number of Minutes Spent on Decoding 0.046 0.930 0.025 0.959 0.059 0.914 Number of Minutes Spent on Comprehension 0.049 0.927 0.079 0.888 0.025 0.959
Number of Minutes Spent on Vocabulary 0.038 0.941 0.067 0.904 0.049 0.926 Number of Minutes Spent on Phonemic Awareness 0.111 0.849 0.25 0.684 0.030 0.952
Number of Minutes Spent on Fluency Building 0.170 0.779 0.069 0.901 0.075 0.893
Number of Minutes Spent on Five Dimensions Combined 0.061 0.912 0.096 0.868 0.058 0.915
Proportion of Intervals in the 5 Dimensions Containing Highly Explicit Instruction 0.281 0.654 0.327 0.604 0.375 0.551
Proportion of Intervals in the 5 Dimensions Containing High Quality Student Practice 0.265 0.670 0.274 0.662 0.303 0.632
Note: The HLM model utilized for this analysis includes an intercept and three independent random error terms that are associated with the variance across classes, systematic measurement error introduced by the raters, and random measurement error. Definitions of ρ1 and ρ2 can be found in the text.
EXHIBIT READS: The proportion of variance due to differences between observers for Number of Minutes Spent on Decoding was .046 for the 65 co-observed classrooms from spring 2005. The proportion of variance due to differences between classrooms for Number of Minutes Spent on decoding was .930 for the 65 classrooms from spring 2005.
Sources: RFIS Instructional Practice in Reading Inventory, spring 2005, fall 2005, spring 2006
An alternative way of obtaining a pseudo ICC estimate is by simply correlating the two observers’ codes within a given observation and across the multiple intervals with that observation, and averaging these correlations across the pairs of coders. Similar to the unconditional HLM model, using this method with the co-observation data attributes more error to the observers than it should. This method is also complicated when one observer reports that a specific IPRI code never occurred during an entire observation, but the other observer reports that the same code occurred (at least once); in this case, the correlation coefficient is not defined (these observations were not included in this analysis). In contrast, if both observers agreed that a particular IPRI code never occurred, we imputed the correlation coefficient to be one since these cases could be regarded as perfect agreement. Exhibit C.8 presents estimates of this pseudo ICC with the number of observations used for the calculations. As expected, these results are very similar to the ones from the unconditional HLM model in Exhibit C.7.

Interim R
eport: Measures
C
-25
Exhibit C.8: Average Correlation Between Paired Observers’ Codes Across Classrooms Spring 2005 Fall 2005 Spring 2006
Outcome Average Correlation N1
Average Correlation N1
Average Correlation N1
Decoding 0.869 65 0.815 60 0.835 32 Comprehension 0.866 65 0.890 62 0.841 35 Vocabulary 0.829 65 0.836 60 0.811 34 Phonemic Awareness 0.990 55 0.976 60 0.963 34 Fluency Building 0.946 50 0.963 55 0.955 36 Any Instruction in One of the Five Dimensions 0.845 65 0.836 61 0.807 35 Highly Explicit Instruction 0.579 63 0.649 57 0.590 35 High Quality Student Practice 0.679 60 0.764 52 0.710 24
Note: 1 The effective N is shown for the calculation of the average correlation between observer and co-observer codes. Co-observations in which only one of the observers reported that the outcome of
interest occurred in every interval (or did not occur in any of the intervals) are excluded from the analysis as for such cases, the correlation coefficient could not be calculated. Co-observations in which both of the raters reported that the outcome of interest occurred in every interval (or did not occur in any of the intervals) are included in the analysis with a correlation coefficient of 1.
EXHIBIT READS: The average correlation between paired observers’ codes across classrooms for decoding was .869 in spring 2005 (n=65), .815 in fall 2005 (n=60), and .835 in spring 2006 (n=32). Sources: RFIS Instructional Practice in Reading Inventory, spring 2005, fall 2005, spring 2006

C-26 Interim Report: Measures
Using a Generalizability Coefficient to Measure Inter-rater Reliability Recall that the previous approach of using a pseudo-ICC to measure the field-based reliability of the IPRI assumes that the field IRR samples are fully crossed. One way to account for the fact that the field IRR samples are not fully crossed and still be able construct an estimate of field based reliability is to calculate a generalizability coefficient using the generalizability framework. The generalizability framework can be defined as a “theory that liberalizes classical theory by employing ANOVA methods that allow an investigator to untangle multiple sources of error” to describe the reliability of a measurement (Cronbach, et al., 1972, as cited in Brennan 2001.) In field IRR samples, each classroom (c) is observed by a different set of two observers (or raters, [r]) simultaneously during a number of intervals (i). In the generalizability framework, discussed in detail by Brennan (2001), this set-up could be regarded as a G study (r: c) * i design with nc that were observed by 2 observers (nr=2) for 25 intervals (ni=25).43 The main and interaction effects for this model can be depicted as: Let Xcri denote the outcome (an IPRI item) recorded in classroom c by rater r at interval i. Utilizing the effects presented in Exhibit C.9, we can describe this outcome as follows:
cricicriccriX :: νννννμ +++++= (4)
Exhibit C.9: Main and Interaction Effects in a (r: c)*i Design
Model Main Effects Interaction Effects
(r: c) * i i, c, r:c ci, ri:c Here, μ is the grand mean in the population and ν terms represent the five main and interaction effects listed in Exhibit C.9 (i, c, r:c, ci, ri:c). Using (5), one can decompose the total variance observed in the outcome into five independent variance components associated with the effects as follows:
):()():()()(
)()()()()()(22222
:22
:2222
cricicric
X cricicriccri
σσσσσνσνσνσνσνσσ
++++=
++++= (5)
Using this general framework, a measure of the IRR for a single random rater (nr = 1) observing a single fixed classroom (nc = 1) can be calculated using a D-study (R:C) * i design. This design is sufficient if one wants to estimate a general IRR across all possible pairs of raters, such that the correlation between a pair of raters estimates the reliability of a single rater, and it is not necessary to generalize across all classrooms. Under a D-study, the IRR estimate is given by the generalizability coefficient, Eρ2, defined in equation (6):
2c :ri
2ci
2i
2ci
2i
22
22
)()()(
σσσσσ
δστστσρ
+++
=+
=Ε (6)
43 Note that here an interval is regarded as the object of measurement.

Interim Report: Measures C-27
In (6), )(2 τσ and )(2 δσ denote the universe score variance and variance of the relative error respectively. Exhibit C.10 demonstrates the formulas that could be used to calculate the variance components of the generalizability coefficient 2ρΕ . Technically, 2ρΕ can be interpreted as an intra-class correlation coefficient, which approximates the expected value of the squared correlation between the observed outcome and the universe (“true”) outcome for a classroom. In this context, the universe outcome can be defined as the expected value of the mean outcomes for every instance of the measurement procedure (i.e., the mean of the outcomes coded by all possible sets of two observers) of a classroom. Alternatively, 2ρΕ can also be seen as the ratio of variance of the universe outcome to the variance of the observed outcome. The difference between the pseudo ICCs described earlier and the generalizability coefficient 2ρΕ is that 2ρΕ takes into account the fact that each classroom was observed by a different set of two observers during co-observations, whereas the former simply ignores this fact. Exhibit C.11 presents estimates of the generalizability coefficient calculated using the three waves of the IPRI field IRR data. These estimates of reliability are slightly lower than the reliability estimates determined by calculating pseudo ICC estimates shown in Exhibits C.7 and C.8. One possibility for these estimates being slightly lower is that the generalizability coefficient accounts for the fact that the sample is not fully crossed. Overall, the various methods of estimating IRR using observation and co-observation data provide consistent results. The reliability estimates for the five dimensions (decoding, comprehension, vocabulary, phonemic awareness, and fluency building) are consistent across all methods. The estimates for highly explicit instruction and high quality student practice measures are lower, a finding that might reflect the fact these measures attempt to capture micro behaviors that are harder for observers to recognize and code accurately.

C-28
Interim
Report: M
easures
Exhibit C.10: Calculating Variance Components for a (r: c)*i Design
α df(α) T(α) SS(α) MS(α) 22 ˆ)(ˆ ασασ ≡
i ni-1 ∑i
irc Xnn 2 T(i)- T(μ)
rcnnciMSiMS )()( −
c nc-1 ∑c
cri Xnn 2 T(c)- T(μ) ri nn
ciMScrMScMS )():()( +−−
r: c nc(nr-1) ∑∑r
crc
i Xn 2 : T(r: c)- T(c)
)()(
αα
dfSS
in
criMScrMS ):():( −
ci (nc-1)( ni-1) ∑∑i
cic
r Xn 2 T(ci)-T(c)-T(i)+ T(μ)
rncriMSciMS ):()( −
ri: c nc(nr-1) (ni-1) ∑∑∑i
crirc
X 2 T(ri: c)- T(ci) – T(r:c)+ T(c) ):( criMS
Notation: α: any of the main and interaction effects df(α): degrees of freedom for effect α T (α): sum of squared mean scores for effect α
2)( XnnnT icr=μ
SS (α): sum of squares for α MS (α): mean squares for α
)(ˆ 2 ασ : estimated variance component for effect α
criX : outcome of interest for class c as rated by rater r in interval i

Interim Report: Measures C-29
Exhibit C.11: Generalizability Coefficients Estimated from the Co-Observation Data Spring 2005
(n=65) Fall 2005
(n=62) Spring 2006
(n=36) Outcome 2ρΕ 2ρΕ 2ρΕ
Decoding .859 .820 .807
Comprehension .863 .881 .820
Vocabulary .812 .769 .796
Phonemic Awareness .802 .822 .792
Fluency Building .706 .826 .827
Five Dimensions Combined .841 .843 .799
Highly Explicit Instruction .577 .610 .545
High Quality Student Practice .625 .574 .443
EXHIBIT READS: The generalizability coefficients for Decoding are .859 for spring 2005, .820 for fall 2005, and .807 for spring 2006.
Sources: RFIS Instructional Practice in Reading Inventory, spring 2005, fall 2005, spring 2006

C-30 Interim Report: Measures
Part 3: Student Time-on-Task and Engagement with Print (STEP)
The Student Time-on-Task and Engagement with Print (STEP) instrument44 was designed to capture information about student engagement during reading instruction as part of the Reading First Impact Study’s (RFIS) classroom observation data collection. The STEP is focused on student behavior; it complements the Instructional Practice in Reading Inventory (IPRI) measure, which focuses on teacher behaviors. The STEP was designed to collect aggregate, not individual level, data on the percentage of students in classrooms during the scheduled reading block who are on-task and/or interacting with print. The STEP instrument combines a dichotomous “on-task/off-task” rating with additional indicators for student engagement with print. The data collected with the STEP instrument do not measure the amount of time students are on-task or the amount of time students are engaged with print. Rather, across all students in the classroom, the STEP instrument yields data on the percentage of students who, at a particular point in time, are on-task and engaged with print. During each wave of classroom observation data collection, one observer per school was assigned to collect student engagement data in each classroom being observed by IPRI observers. STEP observations took place during the reading block in each classroom. While each classroom was observed twice for the IPRI, each classroom was observed once for the STEP. Each STEP observation consists of data on student engagement from three sweeps of a classroom. Specifically, for each sweep, at an interval of six minutes, an observer classifies every student in the classroom as either on- or off-task, and, if the student is on-task, whether the student is:
a) reading connected text (e.g., a paragraph, story, or longer passage); and/or b) reading isolated text (letters, words, or sentences in isolation); and/or c) writing; or d) none of the above (i.e., not engaged with print).
A student can be marked as on-task without being engaged with print (but a student cannot be off-task and engaged with print). An on-task student can also be engaged with more than one type of print (e.g., the student is writing on a worksheet that contains isolated text, such as a list of words). The observer records student behavior for each student in each observed classroom three times. Between sweeps, the observer waits until six minutes have elapsed before beginning the next sweep. After the third sweep, the observer moves on to the next classroom in the sample. The observation protocol is summarized in Exhibit C.13.
44 See Exhibit C.12 for a copy of the STEP instrument.

Interim Report: Measures C-31
Exhibit C.12: Student Time-on-Task and Engagement with Print (STEP) Instrument

C-32 Interim Report: Measures

Interim Report: Measures C-33

C-34 Interim Report: Measures

Interim Report: Measures C-35
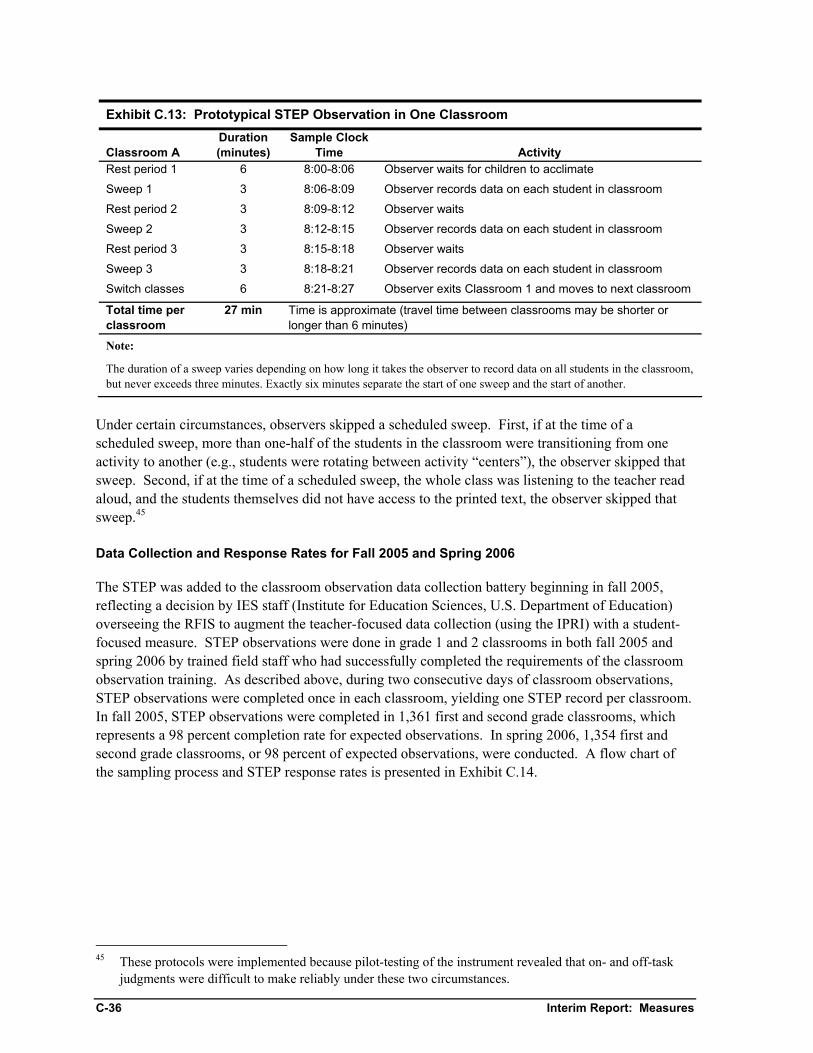
C-36 Interim Report: Measures
Exhibit C.13: Prototypical STEP Observation in One Classroom
Classroom A Duration (minutes)
Sample Clock Time Activity
Rest period 1 6 8:00-8:06 Observer waits for children to acclimate
Sweep 1 3 8:06-8:09 Observer records data on each student in classroom
Rest period 2 3 8:09-8:12 Observer waits
Sweep 2 3 8:12-8:15 Observer records data on each student in classroom
Rest period 3 3 8:15-8:18 Observer waits
Sweep 3 3 8:18-8:21 Observer records data on each student in classroom
Switch classes 6 8:21-8:27 Observer exits Classroom 1 and moves to next classroom
Total time per classroom
27 min Time is approximate (travel time between classrooms may be shorter or longer than 6 minutes)
Note:
The duration of a sweep varies depending on how long it takes the observer to record data on all students in the classroom, but never exceeds three minutes. Exactly six minutes separate the start of one sweep and the start of another.
Under certain circumstances, observers skipped a scheduled sweep. First, if at the time of a scheduled sweep, more than one-half of the students in the classroom were transitioning from one activity to another (e.g., students were rotating between activity “centers”), the observer skipped that sweep. Second, if at the time of a scheduled sweep, the whole class was listening to the teacher read aloud, and the students themselves did not have access to the printed text, the observer skipped that sweep.45 Data Collection and Response Rates for Fall 2005 and Spring 2006
The STEP was added to the classroom observation data collection battery beginning in fall 2005, reflecting a decision by IES staff (Institute for Education Sciences, U.S. Department of Education) overseeing the RFIS to augment the teacher-focused data collection (using the IPRI) with a student-focused measure. STEP observations were done in grade 1 and 2 classrooms in both fall 2005 and spring 2006 by trained field staff who had successfully completed the requirements of the classroom observation training. As described above, during two consecutive days of classroom observations, STEP observations were completed once in each classroom, yielding one STEP record per classroom. In fall 2005, STEP observations were completed in 1,361 first and second grade classrooms, which represents a 98 percent completion rate for expected observations. In spring 2006, 1,354 first and second grade classrooms, or 98 percent of expected observations, were conducted. A flow chart of the sampling process and STEP response rates is presented in Exhibit C.14.
45 These protocols were implemented because pilot-testing of the instrument revealed that on- and off-task
judgments were difficult to make reliably under these two circumstances.

Interim Report: Measures C-37
Exhibit C.14: STEP Data Collection: School, Classroom and Observation Sample Information
Classrooms That Met Observation Criteria
Fall 2005 Spring 2006RF: 920 922Non-RF: 902 905Total: 1,822 1,827
Classrooms That Met Observation Criteria
Fall 2005 Spring 2006RF: 920 922Non-RF: 902 905Total: 1,822 1,827
Schools in Sample
RF: 125 Non-RF: 123 Total: 248
Schools in Sample
RF: 125 Non-RF: 123 Total: 248
All Grade 1 & 2 Classrooms
Fall 2005 Spring 2006RF: 1,010 1,022Non-RF: 979 986Total: 1,989 2,008
All Grade 1 & 2 Classrooms
Fall 2005 Spring 2006RF: 1,010 1,022Non-RF: 979 986Total: 1,989 2,008
Eligible Classrooms Selected into Sample
Fall 2005 Spring 2006RF: 696 696Non-RF: 688 690Total: 1,384 1,386
Eligible Classrooms Selected into Sample
Fall 2005 Spring 2006RF: 696 696Non-RF: 688 690Total: 1,384 1,386
Observations Completed
Fall 2005 Spring 2006RF: 683 (98%) 677 (97%)Non-RF: 678 (99%) 677 (98%)Total: 1,361 (98%) 1,354 (98%)
Observations Completed
Fall 2005 Spring 2006RF: 683 (98%) 677 (97%)Non-RF: 678 (99%) 677 (98%)Total: 1,361 (98%) 1,354 (98%)
Eligible Classrooms Not Selected into Sample
Fall 2005 Spring 2006RF: 224 226Non-RF: 214 215Total: 438 441
Eligible Classrooms Not Selected into Sample
Fall 2005 Spring 2006RF: 224 226Non-RF: 214 215Total: 438 441
Classrooms That Did Not Meet Criteria
Fall 2005 Spring 2006RF: 90 100Non-RF: 77 81Total: 167 181
Classrooms That Did Not Meet Criteria
Fall 2005 Spring 2006RF: 90 100Non-RF: 77 81Total: 167 181
Classrooms That Met Observation Criteria
Fall 2005 Spring 2006RF: 920 922Non-RF: 902 905Total: 1,822 1,827
Classrooms That Met Observation Criteria
Fall 2005 Spring 2006RF: 920 922Non-RF: 902 905Total: 1,822 1,827
Schools in Sample
RF: 125 Non-RF: 123 Total: 248
Schools in Sample
RF: 125 Non-RF: 123 Total: 248
All Grade 1 & 2 Classrooms
Fall 2005 Spring 2006RF: 1,010 1,022Non-RF: 979 986Total: 1,989 2,008
All Grade 1 & 2 Classrooms
Fall 2005 Spring 2006RF: 1,010 1,022Non-RF: 979 986Total: 1,989 2,008
Eligible Classrooms Selected into Sample
Fall 2005 Spring 2006RF: 696 696Non-RF: 688 690Total: 1,384 1,386
Eligible Classrooms Selected into Sample
Fall 2005 Spring 2006RF: 696 696Non-RF: 688 690Total: 1,384 1,386
Observations Completed
Fall 2005 Spring 2006RF: 683 (98%) 677 (97%)Non-RF: 678 (99%) 677 (98%)Total: 1,361 (98%) 1,354 (98%)
Observations Completed
Fall 2005 Spring 2006RF: 683 (98%) 677 (97%)Non-RF: 678 (99%) 677 (98%)Total: 1,361 (98%) 1,354 (98%)
Eligible Classrooms Not Selected into Sample
Fall 2005 Spring 2006RF: 224 226Non-RF: 214 215Total: 438 441
Eligible Classrooms Not Selected into Sample
Fall 2005 Spring 2006RF: 224 226Non-RF: 214 215Total: 438 441
Classrooms That Did Not Meet Criteria
Fall 2005 Spring 2006RF: 90 100Non-RF: 77 81Total: 167 181
Classrooms That Did Not Meet Criteria
Fall 2005 Spring 2006RF: 90 100Non-RF: 77 81Total: 167 181
Notes: Classrooms were considered ineligible to be in the study sample if they were special education or English as a Second Language classes, if fewer than 75 percent of the students were in the target grade, or if the class was taught by someone other than the regular teacher or a long-term substitute. Classrooms were sampled within schools if, across a site as a whole, the number of classrooms exceeded an average of three classrooms per grade.
2,715 STEP observations were completed in fall 2005 and spring 2006; of these, 2,659 had usable data for analyses.
Source: RFIS Student Time-on-Task and Engagement with Print, fall 2005 and spring 2006

C-38 Interim Report: Measures
Analytic Variables
The RFIS Team focused on the percentage of students engaged with print as the primary analytic variable derived from the STEP data to be used in impact analyses. This variable was created for each classroom by first summing the number of students in each sweep who were on-task and who were either reading connected text, reading isolated text, or writing. The percentage of students engaged with print for each sweep was then calculated as the number of students engaged with print divided by the total number of students that the observer rated in the sweep (i.e., the number of students in the classroom at the time the sweep was conducted). The percentage of students engaged with print for each sweep was then averaged across the number of sweeps available for that classroom.46 STEP Reliability
For reasons of parsimony, results from the fall 2006 STEP training are presented below. Observers were trained on the STEP measure using a combination of still photographs and 3-second video clips of first and second grade students during reading instruction.47 Trainees viewed five practice sequences, containing both still photographs and short video clips. A sixth sequence of video clips (hereafter, the “test tape”) was used to assess the average inter-rater reliability of observers’ judgments about student engagement. The test tape was designed to simulate a single “sweep,” and it included three-second clips of 15 first- or second-grade students. Two master coders had viewed and scored the test tape to arrive at a set of master codes for each student on the tape. Percent agreement was calculated for each trainee with the master codes for each code (i.e., On-Task, Reading Connected Text, Reading Isolated Text, Writing), and then a mean percent agreement was calculated across trainees for each code. Next, overall percent agreement was calculated by aggregating across codes. As shown in Exhibit C.15 below, observers achieved an average of 89 percent agreement across all codes appearing in the test tape. Seventy-five percent of the observers scored at least 86 percent overall agreement. Observers had the lowest average agreement about whether or not a student was Reading Isolated Text (77 percent), and they achieved the highest level of agreement when judging that a student was Writing (96 percent).48 These differences reflect that fact that the video cameras could zoom in and capture students’ expressions more effectively than they could discern the specific types of text with which students were engaged. During actual data collection, observers could move around the classrooms to determine whether students were engaged with specific types of text.
46 For the pooled dataset (fall 2005 and spring 2006), 69 percent of classrooms had 3 sweeps of data; 24
percent had 2 sweeps of data; 5 percent had 1 sweep of data; and 2 percent were missing STEP data. 47 Classroom reading instruction was filmed in both Reading First and non-RF classrooms for the purpose of
creating a training resource for the RFIS. 48 In fall 2005, similar results were obtained from the previous group of observers. They achieved, on
average, 87 percent agreement across all codes appearing in the test tape. Seventy-five percent of the trainees scored at least 84 percent overall agreement. Trainees had the lowest average agreement on the Reading Isolated Text code (75 percent), and the highest level of agreement (95 percent) on the Writing code. (The test tape featured only one student who was engaged in Writing.)

Interim Report: Measures C-39
Exhibit C.15: Percent Correct by Code and Overall for STEP Reliability Tape, Fall 2006 Percent Agreement
Student Is …
On Task
Reading Connected
Text Reading
Isolated Text Writing Overall Mean 92 92 77 96 89
Minimum 60 67 50 75 73
25th percentile 87 92 67 92 86
50th percentile 93 92 75 100 90
75th percentile 100 92 83 100 92
Maximum 100 100 100 100 100
Notes: The number of observers tested on this tape is 130.
EXHIBIT READS: Observers in the fall 2006 training achieved an average of 92 percent agreement on whether a student was on-task; 92 percent agreement on whether a student was reading connected text; 77 percent agreement on whether a student was reading isolated text; 96 percent agreement on whether a student was writing; and 89 percent agreement across all codes appearing in the test tape.

Additional Exhibits for Main Impact Analyses D-1
Appendix D: Additional Exhibits for Main Impact Analyses
In the first part of this appendix, separate impact estimates are presented for each follow-up year. (The estimates presented in the main body of the report are for impact estimates pooled across years or data collection waves.) The differences in impacts between the two years are not statistically significant across outcome domains for those data collected in both years. Impact estimates are provided for reading comprehension and instructional outcomes. Student achievement data are reported for each estimated impact in both scaled scores and percent at or above grade level for appropriate years across the nine exhibits in this Appendix. The second part of this appendix presents a brief discussion of student achievement results over time. Part 1: Separate Impact Estimates for Each Follow-up Year
Exhibit D.1: Estimated Impacts on Reading Comprehension: Spring 2005, Scaled Score
Actual Mean with
Reading First
Estimated Mean
without Reading
First Impact Effect Size of Impact
Statistical Significance
of Impact (p-value)
All Sites Grade 1 Average Scaled Score 541.2 538.9 2.2 0.05 (0.524)
Corresponding Grade Equivalent 1.7 1.7 Corresponding Percentile 43 41
Grade 2 Average Scaled Score 583.5 582.4 1.2 0.03 (0.654)
Corresponding Grade Equivalent 2.5 2.4 Corresponding Percentile 38 38
Grade 3 Average Scaled Score 607.4 609.9 -2.5 -0.06 (0.306)
Corresponding Grade Equivalent 3.2 3.3 Corresponding Percentile 38 39
Notes: The complete RF study sample includes 248 schools from 18 sites (17 school districts and 1 state) located in 13 states. 125 schools are Reading First schools and 123 are non-Reading First schools. The effect size of the impact is the impact divided by the actual standard deviation of the outcome for the non-Reading First schools pooled across the spring 2005 and 2006 SAT-10 test scores (by grade). Values in the “Actual Mean with Reading First” column are actual, unadjusted values for Reading First schools; values in the “Estimated Mean without Reading First” column represent the best estimates of what would have happened in RF schools absent RF funding and are calculated by subtracting the impact estimates from the RF schools’ actual mean values. A two-tailed test of significance was used, and where applicable, statistically significant findings at the p≤.05 level are indicated by *. EXHIBIT READS: The observed mean reading comprehension score for first-graders with Reading First was 541.2 scaled score points. The estimated mean without Reading First was 538.9 scaled score points. The impact of Reading First on grade one reading comprehension was 2.2 scaled score points (or 0.05 standard deviations), which was not statistically significant at the p≤.05 level (p=.524).
Sources: RFIS SAT 10 administration in the spring of 2005, as well as from state/district education agencies in those sites that already use the SAT 10 for their standardized testing (i.e., FL, KS, MD, OR).

D-2 Additional Exhibits for Main Impact Analyses
Exhibit D.2: Estimated Impacts on Reading Comprehension: Spring 2005, Percent At or Above Grade Level
Actual Mean with
Reading First
Estimated Mean
without Reading
First Impact
Statistical Significance
of Impact (p-value)
All Sites Percent At or Above Grade Level
Grade 1 43.8 41.6 2.2 (0.529) Grade 2 38.0 38.0 0.0 (0.996) Grade 3 36.0 39.3 -3.3 (0.255)
Notes: The complete RF study sample includes 248 schools from 18 sites (17 school districts and 1 state) located in 13 states. 125 schools are Reading First schools and 123 are non-Reading First schools. Values in the “Actual Mean with Reading First” column are actual, unadjusted values for Reading First schools; values in the “Estimated Mean without Reading First” column represent the best estimates of what would have happened in RF schools absent RF funding and are calculated by subtracting the impact estimates from the RF schools’ actual mean values. A two-tailed test of significance was used, and where applicable, statistically significant findings at the p≤.05 level are indicated by *. EXHIBIT READS: The observed average percent of first-graders reading at or above grade level with Reading First was 43.8 percentage points. The estimated average percent without Reading First was 41.6 percentage points. The impact of Reading First on the percent of first grade students reading at or above grade level was 2.2 percentage points, which was not statistically significant at the p≤.05 level (p=.529).
Sources: Data from RFIS SAT 10 administration in the spring of 2005, as well as from state/district education agencies in those sites that already use the SAT 10 for their standardized testing (i.e., FL, KS, MD, OR).

Additional Exhibits for Main Impact Analyses D-3
Exhibit D.3: Estimated Impacts on Reading Comprehension: Spring 2006, Scaled Score
Actual Mean with
Reading First
Estimated Mean
without Reading
First Impact Effect Size of Impact
Statistical Significance
of Impact (p-value)
All Sites Grade 1 Average Scaled Score 545.7 540.4 5.3 0.11 (0.152)
Corresponding Grade Equivalent 1.8 1.7 Corresponding Percentile 46 42
Grade 2 Average Scaled Score 585.3 583.7 1.6 0.04 (0.620)
Corresponding Grade Equivalent 2.5 2.5 Corresponding Percentile 40 38
Grade 3 Average Scaled Score 609.5 610.0 -0.5 -0.01 (0.860)
Corresponding Grade Equivalent 3.3 3.3 Corresponding Percentile 39 39
Notes: The complete RF study sample includes 248 schools from 18 sites (17 school districts and 1 state) located are in 13 states. 125 schools are Reading First schools and 123 are non-Reading First schools. For grade 2, one non-RF school could not be included in the analysis because test score data were not available. The effect size of the impact is the impact divided by the actual standard deviation of the outcome for the non-Reading First schools pooled across the spring 2005 and 2006 SAT-10 test scores (by grade). Values in the “Actual Mean with Reading First” column are actual, unadjusted values for Reading First schools; values in the “Estimated Mean without Reading First” column represent the best estimates of what would have happened in RF schools absent RF funding and are calculated by subtracting the impact estimates from the RF schools’ actual mean values. A two-tailed test of significance was used, and where applicable, statistically significant findings at the p≤.05 level are indicated by *. EXHIBIT READS: The observed mean reading comprehension score for first-graders with Reading First was 545.7 scaled score points. The estimated mean without Reading First was 540.4 scaled score points. The impact of Reading First on grade one reading comprehension was 5.3 scaled score points (or 0.11 standard deviations), which was not statistically significant at the p≤.05 level (p=.152).
Sources: RFIS SAT 10 administration in the spring of 2006, as well as from state/district education agencies in those sites that already use the SAT 10 for their standardized testing (i.e., FL, KS, MD, OR).

D-4 Additional Exhibits for Main Impact Analyses
Exhibit D.4: Estimated Impacts on Reading Comprehension: Spring 2006, Percent At or Above Grade Level
Actual Mean with
Reading First
Estimated Mean
without Reading
First Impact
Statistical Significance
of Impact (p-value)
All Sites Percent At or Above Grade Level
Grade 1 47.3 43.0 4.3 (0.217) Grade 2 39.9 39.6 0.3 (0.926) Grade 3 39.9 40.8 -0.9 (0.801)
Notes: The complete RF study sample includes 248 schools from 18 sites (17 school districts and 1 state) located in 13 states. 125 schools are Reading First schools and 123 are non-Reading First schools. For grade 2, one non-RF school could not be included in the analysis because test score data were not available. Values in the “Actual Mean with Reading First” column are actual, unadjusted values for Reading First schools; values in the “Estimated Mean without Reading First” column represent the best estimates of what would have happened in RF schools absent RF funding and are calculated by subtracting the impact estimates from the RF schools’ actual mean values. A two-tailed test of significance was used, and where applicable, statistically significant findings at the p≤.05 level are indicated by *. EXHIBIT READS: The observed average percent of first-graders reading at or above grade level with Reading First was 47.3 percentage points. The estimated average percent without Reading First was 43.0 percentage points. The impact of Reading First on the percent of first grade students reading at or above grade level was 4.3 percentage points, which was not statistically significant at the p≤.05 level (p=.217).
Sources: RFIS SAT 10 administration in the spring of 2006, as well as from state/district education agencies in those sites that already use the SAT 10 for their standardized testing (i.e., FL, KS, MD, OR).

Additional Exhibits for Main Impact Analyses D-5
Exhibit D.5: Estimated Impacts on Time Spent in Instruction in Five Dimensions of Reading Instruction: Spring 2005
Construct
Actual Mean with
Reading First
Estimated Mean
without Reading
First Impact
(minutes)
Effect Size of Impact
Statistical Significance
of Impact (p-value)
Number of minutes spent in instruction in:
Five dimensions combined Grade 1 59.23 50.34 8.89* 0.43* (0.007) Grade 2 58.43 45.30 13.13* 0.62* (<0.001)
Each of the five dimensions Phonemic Awareness Grade 1 1.64 0.76 0.88* 0.33* (0.004) Grade 2 0.42 0.30 0.13 0.10 (0.381) Phonics Grade 1 21.02 18.05 2.97 0.22 (0.141) Grade 2 14.01 10.71 3.30* 0.31* (0.042) Vocabulary Grade 1 7.03 5.48 1.55 0.23 (0.072) Grade 2 10.45 8.74 1.71 0.20 (0.130) Fluency Grade 1 5.26 3.72 1.53 0.25 (0.180) Grade 2 5.13 2.81 2.32* 0.42* (0.014) Comprehension Grade 1 24.29 22.19 2.10 0.15 (0.349) Grade 2 28.40 22.86 5.54* 0.34* (0.023) Notes: The complete RFIS sample includes 248 schools from 18 sites (17 districts and 1 state) located in 13 states. 125 schools are Reading First schools and 123 are non-Reading First schools. The effect size of the impact is the impact divided by the actual standard deviation of the outcome for the non-Reading First schools pooled across the spring 2005, fall 2005, and spring 2006 IPRI data (by grade). Values in the “Actual Mean with Reading First” column are actual, unadjusted values for Reading First schools; values in the “Estimated Mean without Reading First” column represent the best estimates of what would have happened in RF schools absent RF funding and are calculated by subtracting the impact estimates from the RF schools’ actual mean values. A two-tailed test of significance was used, and where applicable, statistically significant findings at the p≤.05 level are indicated by *. Due to insufficient variation in the random effects between schools in the three-level RDD model estimating the impact of Reading First on the amount of time spent on phonemic awareness instruction in second grade classrooms, the school-level effects were fixed. EXHIBIT READS: The observed mean amount of time spent in instruction in the five dimensions (phonemic awareness, phonics, vocabulary, fluency, and comprehension) in first grade classrooms with Reading First was 59.23 minutes. The estimated mean amount of time without Reading First was 50.34 minutes. The impact of Reading First on the amount of time spent in instruction in the five dimensions was 8.89 minutes (or 0.43 standard deviations), which was statistically significant at the p≤.05 level (p=.007). Source: RFIS Instructional Practice in Reading Inventory, spring 2005

D-6 Additional Exhibits for Main Impact Analyses
Exhibit D.6: Estimated Impacts on Instructional Outcomes: Spring 2005
Construct
Actual Mean with
Reading First
Estimated Mean
without Reading
First Impact
(percent)
Effect Size of Impact
Statistical Significance
of Impact (p-value)
Percentage of intervals in five dimensions with:
Highly Explicit Instruction Grade 1 29.71 22.38 7.33* 0.41* (0.003) Grade 2 31.97 25.01 6.96* 0.36* (0.007)
High Quality Student Practice Grade 1 21.31 22.05 -0.74 -0.04 (0.749) Grade 2 22.91 18.93 3.98 0.22 (0.079)
Notes: The complete RFIS sample includes 248 schools from 18 sites (17 districts and 1 state) located in 13 states. 125 schools are Reading First schools and 123 are non-Reading First schools. The effect size of the impact is the impact divided by the actual standard deviation of the outcome for the non-Reading First schools pooled across the spring 2005, fall 2005, and spring 2006 IPRI data (by grade). Values in the “Actual Mean with Reading First” column are actual, unadjusted values for Reading First schools; values in the “Estimated Mean without Reading First” column represent the best estimates of what would have happened in RF schools absent RF funding and are calculated by subtracting the impact estimates from the RF schools’ actual mean values. A two-tailed test of significance was used, and where applicable, statistically significant findings at the p≤.05 level are indicated by *. EXHIBIT READS: The observed percentage of observation intervals with instruction in the five dimensions and at least one instance of highly explicit instruction in first grade classrooms with Reading First was 29.71 percent. The estimated percentage without Reading First was 22.38 percent. The impact of Reading First on the percentage of observation intervals with instances of highly explicit instruction was 7.33 percentage points (or 0.41 standard deviations), which was statistically significant at the p≤.05 level (p=.003).
Source: RFIS Instructional Practice in Reading Inventory, spring 2005

Additional Exhibits for Main Impact Analyses D-7
Exhibit D.7: Estimated Impacts on Time Spent in Instruction in Five Dimensions of Reading Instruction: Fall 2005 and Spring 2006
Construct
Actual Mean with
Reading First
Estimated Mean
without Reading
First Impact
(minutes)
Effect Size of Impact
Statistical Significance
of Impact (p-value)
Number of minutes spent in instruction in: Five dimensions combined Grade 1 59.49 50.92 8.57* 0.41* (0.011) Grade 2 60.25 49.11 11.13* 0.52* (0.001) Each of the five dimensions Phonemic Awareness Grade 1 2.32 1.69 0.63 0.24 (0.099) Grade 2 0.42 0.27 0.15 0.12 (0.238) Phonics Grade 1 21.56 16.99 4.57* 0.34* (0.012) Grade 2 14.04 9.97 4.06* 0.38* (0.011) Vocabulary Grade 1 8.22 8.08 0.14 0.02 (0.883) Grade 2 12.29 9.89 2.39 0.27 (0.053) Fluency Grade 1 4.13 3.23 0.90 0.15 (0.170) Grade 2 3.75 4.20 -0.44 -0.08 (0.521) Comprehension Grade 1 23.27 20.92 2.35 0.16 (0.259) Grade 2 29.75 24.81 4.95* 0.30* (0.030) Notes: The complete RFIS study sample includes 248 schools from 18 sites (17 districts and 1 state) located in 13 states. 125 schools are Reading First schools and 123 are non-Reading First schools. The effect size of the impact is the impact divided by the actual standard deviation of the outcome for the non-Reading First schools pooled across the spring 2005, fall 2005, and spring 2006 IPRI data (by grade). Values in the “Actual Mean with Reading First” column are actual, unadjusted values for Reading First schools; values in the “Estimated Mean without Reading First” column represent the best estimates of what would have happened in RF schools absent RF funding and are calculated by subtracting the impact estimates from the RF schools’ actual mean values. A two-tailed test of significance was used, and where applicable, statistically significant findings at the p≤.05 level are indicated by *. EXHIBIT READS: The observed mean amount of time spent in instruction in the five dimensions (phonemic awareness, phonics, vocabulary, fluency, and comprehension) in first grade classrooms with Reading First was 59.49 minutes. The estimated mean amount of time without Reading First was 50.92 minutes. The impact of Reading First on the amount of time spent in instruction in the five dimensions was 8.57 minutes (or 0.41 standard deviations), which was statistically significant at the p≤.05 level (p=.011). Sources: RFIS Instructional Practice in Reading Inventory, fall 2005 and spring 2006

D-8 Additional Exhibits for Main Impact Analyses
Exhibit D.8: Estimated Impacts on Instructional Outcomes: Fall 2005 and Spring 2006
Construct
Actual Mean with
Reading First
Estimated Mean
without Reading
First Impact
(percent)
Effect Size of Impact
Statistical Significance
of Impact (p-value)
Percentage of intervals in five dimensions with: Highly explicit instruction Grade 1 29.76 27.86 1.90 0.11 (0.316) Grade 2 31.33 24.11 7.22* 0.37* (<0.001) High quality student practice Grade 1 17.99 16.21 1.79 0.11 (0.284) Grade 2 16.44 12.94 3.50* 0.19* (0.035)
Notes: The complete RFIS study sample includes 248 schools from 18 sites (17 districts and 1 state) located in 13 states. 125 schools are Reading First schools and 123 are non-Reading First schools. The effect size of the impact is the impact divided by the actual standard deviation of the outcome for the non-Reading First schools pooled across the spring 2005, fall 2005, and spring 2006 IPRI data (by grade). Values in the “Actual Mean with Reading First” column are actual, unadjusted values for Reading First schools; values in the “Estimated Mean without Reading First” column represent the best estimates of what would have happened in RF schools absent RF funding and are calculated by subtracting the impact estimates from the RF schools’ actual mean values. A two-tailed test of significance was used, and where applicable, statistically significant findings at the p≤.05 level are indicated by *.
EXHIBIT READS: The observed percentage of observation intervals with instruction in the five dimensions and at least one instance of highly explicit instruction in first grade classrooms with Reading First was 29.76 percent. The estimated percentage without Reading First was 27.86 percent. The impact of Reading First on the percentage of observation intervals with instances of highly explicit instruction was 1.90 percentage points (or 0.11 standard deviations), which was not statistically significant at the p≤.05 level (p=.316). Sources: RFIS Instructional Practice in Reading Inventory, fall 2005 and spring 2006

Additional Exhibits for Main Impact Analyses D-9
Exhibit D.9: Differences Across Study Years for Reading Comprehension and Instructional Outcomes: 2004-2005 to 2005-20061
Outcome Domain Outcome Grade p-value
Reading Comprehension SAT 10 Scaled Score Grade 1 (0.472) Grade 2 (0.910) Grade 3 (0.568)
Percent Reading At or Above Grade Level
Grade 1 (0.642)
Grade 2 (0.953) Grade 3 (0.555)
Index Grade 1 (0.541) Grade 2 (0.936) Grade 3 (0.549)
Instruction Minutes in Five Dimensions Grade 1 (0.945) Grade 2 (0.669) Highly Explicit Instruction Grade 1 (0.082) Grade 2 (0.937) High Quality Student Practice Grade 1 (0.376) Grade 2 (0.863) Index Grade 1 (0.725) Grade 2 (0.810)
Notes: The complete RFIS study sample includes 248 schools from 18 sites (17 districts and 1 state) located in 13 states. 125 schools are Reading First schools and 123 are non-Reading First schools. For grade 2, one non-RF school could not be included in the analysis because test score data were not available. Because the RFIS collected data on student engagement with print only in 2005-06, there are no year-to-year differences. Impact estimates are statistically adjusted (e.g., take each school's rating, site-specific funding cut-point, and other covariates into account) to reflect the regression discontinuity design of the study. A two-tailed test of significance was used, and where applicable, statistically significant findings at the p≤.05 level are indicated by *. 1 For reading comprehension, 2004-2005 data included SAT 10 scores from spring 2005; 2005-2006 data included SAT 10 scores from spring 2006. For instructional outcomes, 2004-2005 data included IPRI scores from spring 2005; 2005-2006 data included IPRI scores from fall 2005 and spring 2006. EXHIBIT READS: The difference in reading comprehension between grade 1 SAT 10 scaled scores in 2005 and 2006 was not statistically significant at the p≤.05 level (p=0.472).
Sources: RFIS SAT 10 administration in the spring of 2005, as well as from state/district education agencies in those sites that already use the SAT 10 for their standardized testing (i.e., FL, KS, MD, OR); RFIS Instructional Practice in Reading Inventory, spring 2005, fall 2005, and spring 2006.

D-10 Additional Exhibits for Main Impact Analyses
Part 2: Student Achievement Trends Over Time
Exhibits D.10 and D.11 present student achievement trends over time for schools in the RFIS study sample. Data on mean SAT 10 scores are presented at two time points—spring 2005 and spring 2006—separately for Reading First and non-Reading First schools across the 248 schools in the 18 sites in the RFIS study sample. For each year and grade, three mean scaled score values were calculated. The Actual Mean with Reading First value is simply that; it is the actual unadjusted mean for the Reading First schools in the study sample. The Estimated Mean without Reading First value represents the best estimate of what would have happened in Reading First schools absent Reading First funding. The Actual Mean for Non-Reading First schools value is the unadjusted mean for the non-Reading First schools in the study sample.49 The Estimated Mean without Reading First is the counterfactual and in the absence of Reading First represents the best estimate of what would have happened in the treatment schools—if they had not been selected as Reading First schools. The Actual Mean with Reading First and the Estimated Mean without Reading First values are identical to the values shown in the impact tables in Chapter 4 and appendices D and G. Calculation of the counterfactual accounts for each school’s rating and prior achievement, both of which were generally higher in non-RF schools, as RF grants were awarded to schools with greatest need within each site. The Actual Mean for Non-Reading First schools value does not take into account either (1) the criteria (or rating) used to determine their RF status or (2) any pre-RF differences in student achievement. In Exhibit D.10, the first row shows mean scaled scores on the SAT 10 for grade 1 in spring 2005. From left to right, the table displays the actual (or unadjusted) mean for RF schools (541.2), then the estimated mean in the absence of RF (538.9), and in the third column, the actual (or unadjusted) mean for non-RF schools, (542.5). Note that this exhibit does not display the estimated impact of Reading First, which is the presented in the main body of the report (i.e., 2.2 scaled score points, representing the difference between the values in columns 1 and 2). Exhibit D.10 also includes the corresponding grade equivalent and national percentile for each scaled score mean value.50 The remaining rows in the table show values for grade 1 (spring 2006), grade 2 (spring 2005 and spring 2006), and grade 3 (spring 2005 and spring 2006). The scaled score means displayed in Exhibit D.10 are graphed in Exhibit D.11. Because the SAT 10 scaled score range is continuous across grades, all values can be shown on a single set of axes. For each grade, the vertical bars represent the average scaled score for RF schools (unadjusted), schools in the absence of RF (estimated), and non-RF schools (unadjusted); a light bar represents the mean for spring 2005, and a darker shaded bar represents the mean for spring 2006. Mean values for grade one are the first set of vertical bars, mean values for grade two are the middle set of bars, and mean values
49 All means are weighted by the number of Reading First schools in each site, which is the same weighting
scheme used for the impact estimates presented in the interim report. 50 Calculations of mean values were done for scaled scores only. Average scaled scores for Reading First
schools and non-Reading First schools were converted to grade equivalents and national percentiles. It is not appropriate to perform arithmetic calculations with grade equivalents or percentiles.

Additional Exhibits for Main Impact Analyses D-11
for grade three are the last set of bars. In all but one case, scaled score means improved from spring 2005 to spring 2006 for each grade and for each group of schools.51
Exhibit D.10: SAT 10 Reading Comprehension Means: Spring 2005 and Spring 2006
Actual Mean with
Reading First
Estimated Mean
without Reading
First
Actual Mean
for Non- Reading
First Schools
All Sites Grade 1 Spring 2005 Scaled Score 541.2 538.9 542.5 Corresponding Grade Equivalent 1.7 1.7 1.7 Corresponding Percentile 43 41 44
Spring 2006 Scaled Score 545.7 540.4 545.8 Corresponding Grade Equivalent 1.8 1.7 1.8 Corresponding Percentile 46 42 46 Grade 2 Spring 2005 Scaled Score 583.5 582.4 586.7 Corresponding Grade Equivalent 2.5 2.4 2.5 Corresponding Percentile 38 38 41
Spring 2006 Scaled Score 585.3 583.7 586.0 Corresponding Grade Equivalent 2.5 2.5 2.5 Corresponding Percentile 40 38 40 Grade 3 Spring 2005 Scaled Score 607.4 609.9 610.7 Corresponding Grade Equivalent 3.2 3.3 3.4 Corresponding Percentile 38 39 40
Spring 2006 Scaled Score 609.5 610.0 613.9 Corresponding Grade Equivalent 3.3 3.3 3.5 Corresponding Percentile 39 39 43
Notes: The complete Reading First Impact Study (RFIS) sample includes 248 schools from 18 sites (17 school districts and 1 state) located in 13 states. 125 schools are Reading First schools and 123 are non-Reading First schools. For grade 2, one non-RF school could not be included in the analysis because test scores were not available. Values in the “Actual Mean with Reading First” column are actual, unadjusted values for Reading First schools; values in the “Estimated Mean without Reading First” column represent the best estimates of what would have happened in RF schools absent RF funding and are calculated by subtracting the impact estimates from the RF schools’ actual mean values. The actual mean for non-Reading First schools is the observed average for non-Reading First schools in the study sample. EXHIBIT READS: On average, for first-graders in the spring of 2005, the observed mean reading comprehension score with Reading First was 541.2 scaled score points. The estimated mean without Reading First was 538.9 scaled score points. The observed mean in non-Reading First schools was 542.5 scaled score points.
Sources: RFIS SAT 10 administration in the spring of 2005 and 2006, as well as from state/district education agencies in those sites that already used the SAT 10 for their standardized testing (i.e., FL, KS, MD, OR).
51 Mean scaled score values for second grade in Non-Reading First Schools (unadjusted) declined from 586.7
to 586.0 scaled score points.

D-12 Additional Exhibits for Main Impact Analyses
Exhibit D.11: SAT 10 Reading Comprehension Means: Spring 2005 and Spring 2006
530
540
550
560
570
580
590
600
610
620
RF(u) Non-RF(c)
Non-RF(u)
RF(u) Non-RF(c)
Non-RF(u)
RF(u) Non-RF(c)
Non-RF(u)
Grade 1 Grade 2 Grade 3
Aver
age
Scal
ed S
core
Spring 2005 Spring 2006
Notes: The complete Reading First Impact Study (RFIS) sample includes 248 schools from 18 sites (17 school districts and 1 state) located in 13 states. 125 schools are Reading First schools and 123 are non-Reading First schools. For grade 2, one non-RF school could not be included in the analysis because test scores were not available. For each grade, the vertical bars represent the average scaled score for RF schools (unadjusted), schools in the absence of RF (estimated), and non-RF schools (unadjusted). Sources: RFIS SAT 10 administration in the spring of 2005 and 2006, as well as from state/district education agencies in those sites that already used the SAT 10 for their standardized testing (i.e., FL, KS, MD, OR).
(e) (e) (e)

Confidence Intervals for Main Impact Estimates E-1
Appendix E: Confidence Intervals for Main Impact Estimates
Appendix E presents 95 percent confidence intervals for main impacts in relevant metrics. (Confidence intervals are reported for all main impact estimates in the body of the text in effect sizes only.) Confidence intervals for estimated impacts are reported for reading comprehension, instructional outcomes, and student engagement with print. Data are reported across these areas for pertinent study years.
Exhibit E.1: Confidence Intervals for Estimated Impacts on Reading Comprehension: Spring 2005 and 2006; Scaled Score
Impact
Standard Error
Confidence Interval
All Sites Reading Comprehension Scaled Score
Grade 1 3.57 2.87 -2.06 – 9.20 Grade 2 1.41a 2.41 -3.31 – 6.13 Grade 3 -1.63 2.17 -5.89 – 2.63
Notes: The complete Reading First Impact Study (RFIS) sample includes 248 schools from 18 sites (17 school districts and 1 state) located in 13 states. 125 schools are Reading First schools and 123 are non-Reading First schools. For grade 2, one non-RF school could not be included in the analysis because test score data were not available. Impact estimates are statistically adjusted (e.g., take each school's rating, site-specific funding cut-point, and other covariates into account) to reflect the regression discontinuity design of the study. A two-tailed test of significance was used, and where applicable, statistically significant findings at the p≤.05 level are indicated by *. A 95% confidence interval was used. a Due to estimation variation and rounding, the estimated pooled sample impact is sometimes slightly bigger than the impacts for 2005 and 2006 separately.
EXHIBIT READS: The estimated impact of the Reading First program for grade 1 on reading comprehension scaled scores was 3.57 points with a standard error of 2.87 scaled score points. The 95% confidence interval for the estimated impact ranged from -2.06 points to 9.20 points.
Sources: RFIS SAT 10 administration in the spring of 2005 and 2006, as well as from state/district education agencies in those sites that already used the SAT 10 for their standardized testing (i.e., FL, KS, MD, OR).

E-2 Confidence Intervals for Main Impact Estimates
Exhibit E.2: Confidence Intervals for Estimated Impacts on Reading Comprehension: Spring 2005 and 2006; Percent At or Above Grade Level
Impact
Standard Error
Confidence Interval
All Sites Percent Reading At or Above Grade Level
Grade 1 3.15 2.79 -2.32 – 8.62 Grade 2 0.12 2.60 -4.98 – 5.22 Grade 3 -2.22 2.54 -7.20 – 2.76
Notes: The complete Reading First Impact Study (RFIS) sample includes 248 schools from 18 sites (17 school districts and 1 state) located in 13 states. 125 schools are Reading First schools and 123 are non-Reading First schools. For grade 2, one non-RF school could not be included in the analysis because test score data were not available. Impact estimates are statistically adjusted (e.g., take each school's rating, site-specific funding cut-point, and other covariates into account) to reflect the regression discontinuity design of the study. A two-tailed test of significance was used, and where applicable, statistically significant findings at the p≤.05 level are indicated by *. A 95% confidence interval was used. a Due to estimation variation and rounding, the estimated pooled sample impact is sometimes slightly bigger than the impacts for 2005 and 2006 separately.
EXHIBIT READS: The estimated impact of the Reading First program for grade 1 on the percentage of students reading at or above grade level was 3.15 percentage points with a standard error of 2.79 percentage points. The 95% confidence interval for the estimated impact ranged from -2.32 percentage points to 8.62 percentage points.
Sources: RFIS SAT 10 administration in the spring of 2005 and 2006, as well as from state/district education agencies in those sites that already used the SAT 10 for their standardized testing (i.e., FL, KS, MD, OR).

Confidence Intervals for Main Impact Estimates E-3
Exhibit E.3: Confidence Intervals for Estimated Impacts on Instructional Outcomes: Spring 2005, Fall 2005, and Spring 2006
Impact Standard
Error Confidence
Interval Panel 1
(minutes)
Number of minutes of instruction in five dimensions combined
Grade 1 8.56* 2.81 3.05 – 14.08 Grade 2 12.09* 2.85 6.50 – 17.68 Panel 2
(percent)
Percentage of intervals in five dimensions with
Highly Explicit Instruction
Grade 1 3.65* 1.60 0.52 – 6.77 Grade 2 6.98* 1.72 3.62 – 10.34
High Quality Student Practice
Grade 1 0.86 1.47 -2.02 – 3.75 Grade 2 3.67* 1.45 0.83 – 6.50 Notes: The complete RFIS sample includes 248 schools from 18 sites (17 districts and 1 state) located in 13 states. 125 schools are Reading First schools and 123 are non-Reading First schools. Impact estimates are statistically adjusted (e.g., take each school's rating and site-specific funding cut-point into account) to reflect the regression discontinuity design of the study. A two-tailed test of significance was used, and where applicable, statistically significant findings at the p≤.05 level are indicated by *. A 95% confidence interval was used. EXHIBIT READS: The estimated impact of the Reading First program for grade 1 on the amount of time spent in instruction in the five dimensions was 8.56 minutes with a standard error of 2.81 minutes. The estimated impact was statistically significant at the p≤.05 level. The 95% confidence interval for the estimated impact ranged from 3.05 minutes to 14.08 minutes. Sources: RFIS Instructional Practice in Reading Inventory, spring 2005, fall 2005, and spring 2006

E-4 Confidence Intervals for Main Impact Estimates
Exhibit E.4: Confidence Intervals for Estimated Impacts on Time Spent in Instruction in the Five Dimensions: Spring 2005, Fall 2005, and Spring 2006
Impact
(minutes) Standard
Error Confidence
Interval Number of minutes of instruction in:
Phonemic Awareness Grade 1 0.72* 0.30 0.14 – 1.30 Grade 2 0.15 0.11 -0.06 – 0.35
Phonics Grade 1 3.90* 1.59 0.79 – 7.02 Grade 2 3.85* 1.33 1.23 – 6.47
Vocabulary Grade 1 0.65 0.73 -0.79 – 2.09 Grade 2 2.14* 0.99 0.21 – 4.07
Fluency Grade 1 1.09 0.68 -0.25 – 2.42 Grade 2 0.65 0.61 -0.55 – 1.86
Comprehension Grade 1 2.29 1.79 -1.23 – 5.80 Grade 2 5.26* 1.96 1.42 – 9.10
Notes: The complete RFIS sample includes 248 schools from 18 sites (17 districts and 1 state) located in 13 states. 125 schools are Reading First schools and 123 are non-Reading First schools. Impact estimates are statistically adjusted (e.g., take each school's rating and site-specific funding cut-point into account) to reflect the regression discontinuity design of the study. A two-tailed test of significance was used, and where applicable, statistically significant findings at the p≤.05 level are indicated by *. A 95% confidence interval was used. EXHIBIT READS: The estimated impact of the Reading First program for grade 1 on the amount of time spent in instruction in phonemic awareness was 0.72 minutes with a standard error of 0.30 minutes. The estimated impact was statistically significant at the p≤.05 level. The 95% confidence interval for the estimated impact ranged from 0.14 minutes to 1.30 minutes. Sources: RFIS Instructional Practice in Reading Inventory, spring 2005, fall 2005, and spring 2006

Confidence Intervals for Main Impact Estimates E-5
Exhibit E.5: Confidence Intervals for Estimated Impacts on Student Engagement with Print: Fall 2005 and Spring 2006
Construct Impact
(percent) Standard Error Confidence
Interval
Percentage of student engagement with print
Grade 1 4.63 3.73 -2.69 – 11.94
Grade 2 -8.42* 3.86 -15.98 – -0.86
Notes: The complete RFIS sample includes 248 schools from 18 sites (17 districts and one state) located in 13 states. 125 schools are Reading First schools and 123 are non-Reading First schools. Impact estimates are statistically adjusted (e.g., take each school's rating and site-specific funding cut-point into account) to reflect the regression discontinuity design of the study. A two-tailed test of significance was used, and where applicable, statistically significant findings at the p≤.05 level are indicated by *. A 95% confidence interval was used. EXHIBIT READS: The estimated impact of the Reading First program for grade 1 on the percentage of students engaged with print was 4.63 percentage points with a standard error of 3.73 percentage points. The 95% confidence interval for the estimated impact ranged from -2.69 percentage points to 11.94 percentage points. Source: RFIS Student Time-on-Task and Engagement with Print, fall 2005 and spring 2006

Graphs of Site-By-Site Impact Estimates F-1
Appendix F: Graphs of Site-By-Site Impact Estimates
Appendix F provides the site-by-site variation in estimated program impacts on minutes of instruction in the five dimensions and student engagement with print (impact estimates in the main body of the report are presented only for reading comprehension outcomes and not for other outcome domains). The two exhibits herein are entitled "Fixed Effect Impact Estimates for Instruction, by Site, by Grade" and "Fixed Effect Impact Estimates for Student Engagement with Print, by Site, by Grade" respectively.
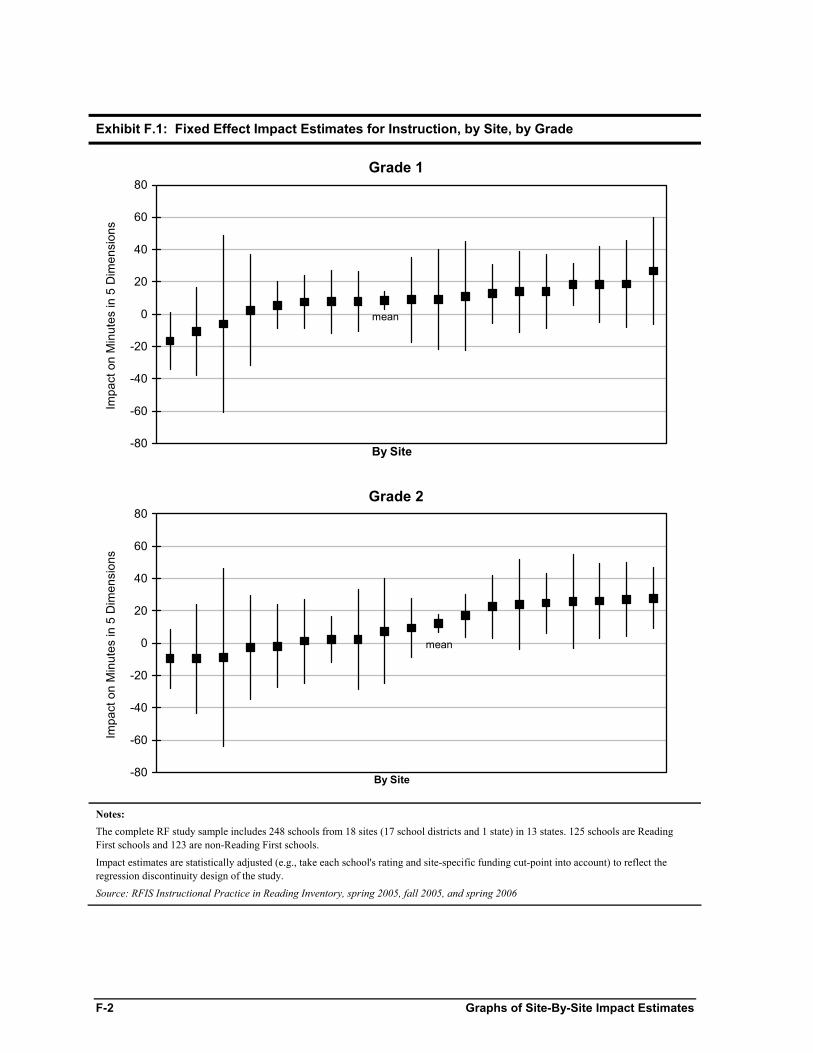
F-2 Graphs of Site-By-Site Impact Estimates
Exhibit F.1: Fixed Effect Impact Estimates for Instruction, by Site, by Grade
Grade 1
mean
-80
-60
-40
-20
0
20
40
60
80
By Site
Impa
ct o
n M
inut
es in
5 D
imen
sion
s
Grade 2
mean
-80
-60
-40
-20
0
20
40
60
80
By Site
Impa
ct o
n M
inut
es in
5 D
imen
sion
s
Notes: The complete RF study sample includes 248 schools from 18 sites (17 school districts and 1 state) in 13 states. 125 schools are Reading First schools and 123 are non-Reading First schools.
Impact estimates are statistically adjusted (e.g., take each school's rating and site-specific funding cut-point into account) to reflect the regression discontinuity design of the study.
Source: RFIS Instructional Practice in Reading Inventory, spring 2005, fall 2005, and spring 2006

Graphs of Site-By-Site Impact Estimates F-3
Exhibit F.2: Fixed Effect Impact Estimate for Student Engagement with Print, by Site, by Grade
Grade 1
mean
-100
-80
-60
-40
-20
0
20
40
60
80
100
By Site
Impa
ct o
n P
erce
ntag
e of
Stu
dent
s E
ngag
ed w
ith P
rint
Grade 2
mean
-100
-80
-60
-40
-20
0
20
40
60
80
100
By Site
Impa
ct o
n P
erce
ntag
e of
Stu
dent
s E
ngag
ed w
ith P
rint
Notes: The complete RF study sample includes 248 schools from 18 sites (17 school districts and 1 state) in 13 states. 125 schools are Reading First schools and 123 are non-Reading First schools. Impact estimates are statistically adjusted (e.g., take each school's rating and site-specific funding cut-point into account) to reflect the regression discontinuity design of the study.
Source: RFIS Student Time-on-Task and Engagement with Print, fall 2005 and spring 2006

Additional Exhibits for Subgroup Analyses G-1
Appendix G: Additional Exhibits for Subgroup Analyses
This appendix provides impact estimates for all outcomes separately by award group across follow-up years for all three outcome domains (impact estimates presented in the main body of the report are for the pooled full sample and not by award group). Reported data include award group differences in estimated impacts as well as estimated impacts by award group across relevant years for reading comprehension, instructional outcomes, and student engagement with print. Results for reading comprehension are reported in both scaled scores and percent at or above grade level.

G-2 Additional Exhibits for Subgroup Analyses
Exhibit G.1: Estimated Impacts on Reading Comprehension by Award Group: Spring 2005; Scaled Score
Actual Mean with
Reading First
Estimated Mean
without Reading
First Impact Effect Size of Impact
Statistical Significance
of Impact (p-value)
Early Award Sites Grade 1 Average Scaled Score 544.2 544.8 -0.6 -0.01 (0.931)
Corresponding Grade Equivalent 1.7 1.7 6.55 Corresponding Percentile 45 45
Grade 2 Average Scaled Score 586.1 590.8 -4.6 -0.11 (0.350)
Corresponding Grade Equivalent 2.5 2.6 4.92 Corresponding Percentile 41 44
Grade 3 Average Scaled Score 610.2 618.1 -7.9 -0.20 (0.129)
Corresponding Grade Equivalent 3.4 3.7 5.11 Corresponding Percentile 40 48
Late Award Sites
Grade 1 Average Scaled Score 538.8 534.0 4.8 0.10 (0.194)
Corresponding Grade Equivalent 1.7 1.6 3.65 Corresponding Percentile 41 37
Grade 2 Average Scaled Score 581.5 575.9 5.6* 0.13* (0.044)
Corresponding Grade Equivalent 2.4 2.3 2.76 Corresponding Percentile 37 32
Grade 3 Average Scaled Score 605.2 603.6 1.6 0.04 (0.502)
Corresponding Grade Equivalent 3.1 3.1 2.33 Corresponding Percentile 36 35
Notes: The complete RF study sample includes 248 schools from 18 sites (17 school districts and 1 state) located in 13 states. 125 schools are Reading First schools and 123 are non-Reading First schools. There are 8 late award sites, with 137 schools, and 10 early award sites, with 111 schools. The effect size of the impact is the impact divided by the actual standard deviation of the outcome for the non-Reading First schools pooled across the spring 2005 and 2006 SAT-10 test scores (by grade). Values in the “Actual Mean with Reading First” column are actual, unadjusted values for Reading First schools; values in the “Estimated Mean without Reading First” column represent the best estimates of what would have happened in RF schools absent RF funding and are calculated by subtracting the impact estimates from the RF schools’ actual mean values. A two-tailed test of significance was used, and where applicable, statistically significant findings at the p≤.05 level are indicated by *. EXHIBIT READS: The observed mean reading comprehension score for first-graders with Reading First in the early award sites was 544.2 scaled score points. The estimated mean without Reading First was 544.8 scaled score points. The impact of Reading First was -0.6 scaled score points (or -0.01 standard deviations), which was not statistically significant at the p≤.05 level (p=.931).
Sources: RFIS SAT 10 administration in the spring of 2005, as well as from state/district education agencies in those sites that already use the SAT 10 for their standardized testing (i.e., FL, KS, MD, OR).

Additional Exhibits for Subgroup Analyses G-3
Exhibit G.2: Award Group Differences in Estimated Impacts on Reading Comprehension: Spring 2005; Scaled Score
Difference in Impact
(Early - Late) Effect Size of
Difference
Statistical Significance of
Differences (p-values)
All Sites Average Scaled Score
Grade 1 -5.3 -0.11 (0.478) Grade 2 -10.2 -0.24 (0.071) Grade 3 -9.4 -0.24 (0.095)
Notes: The complete RF study sample includes 248 schools from 18 sites (17 school districts and 1 state) located in 13 states. 125 schools are Reading First schools and 123 are non-Reading First schools. There are 8 late award sites, with 137 schools, and 10 early award sites, with 111 schools. The effect size of the impact is the impact divided by the actual standard deviation of the outcome for the non-Reading First schools pooled across the spring 2005 and 2006 SAT-10 test scores (by grade). Impact estimates are statistically adjusted (e.g., take each school's rating, site-specific funding cut-point, and other covariates into account) to reflect the regression discontinuity design of the study. A two-tailed test of significance was used, and where applicable, statistically significant findings at the p≤.05 level are indicated by *. EXHIBIT READS: The estimated difference in impact between early and late award sites in grade 1 was -5.3 scaled score points. The effect size of the difference was -0.11 standard deviations. The estimated difference was not statistically significant at the p≤.05 level (p=.478).
Sources: RFIS SAT 10 administration in the spring of 2005, as well as from state/district education agencies in those sites that already use the SAT 10 for their standardized testing (i.e., FL, KS, MD, OR).

G-4 Additional Exhibits for Subgroup Analyses
Exhibit G.3: Estimated Impacts on Reading Comprehension by Award Group: Spring 2005; Percent At or Above Grade Level
Actual Mean with
Reading First
Estimated Mean
without Reading
First Impact
Statistical Significance
of Impact (p-value)
Early Award Sites Percent At or Above Grade Level
Grade 1 45.9 48.5 -2.6 (0.708) Grade 2 40.4 48.6 -8.2 (0.163) Grade 3 39.1 49.0 -9.9 (0.110)
Late Award Sites Percent At or Above Grade Level
Grade 1 42.2 35.9 6.3 (0.077) Grade 2 36.2 29.9 6.3* (0.028) Grade 3 33.6 31.9 1.7 (0.537)
Notes: The complete RF study sample includes 248 schools from 18 sites (17 school districts and 1 state) located in 13 states. 125 schools are Reading First schools and 123 are non-Reading First schools. There are 8 late award sites, with 137 schools, and 10 early award sites, with 111 schools. Values in the “Actual Mean with Reading First” column are actual, unadjusted values for Reading First schools; values in the “Estimated Mean without Reading First” column represent the best estimates of what would have happened in RF schools absent RF funding and are calculated by subtracting the impact estimates from the RF schools’ actual mean values. A two-tailed test of significance was used, and where applicable, statistically significant findings at the p≤.05 level are indicated by *. EXHIBIT READS: The observed average percent of first-graders reading at or above grade level with Reading First in the early award sites was 45.9 percentage points. The estimated average percent without Reading First was 48.5 percentage points. The impact of Reading First on the percent of students reading at or above grade level was -2.6 percentage points, which was not statistically significant at the p≤.05 level (p=.708).
Sources: RFIS SAT 10 administration in the spring of 2005, as well as from state/district education agencies in those sites that already use the SAT 10 for their standardized testing (i.e., FL, KS, MD, OR).

Additional Exhibits for Subgroup Analyses G-5
Exhibit G.4: Award Group Differences in Estimated Impacts on Reading Comprehension: Spring 2005; Percent At or Above Grade Level
Difference in Impact
(Early - Late)
Statistical Significance of
Difference (p-value)
All Sites Percent At or Above Grade Level
Grade 1 -8.8 (0.251) Grade 2 -14.5* (0.026) Grade 3 -11.6 (0.086)
Notes: The complete RF study sample includes 248 schools from 18 sites (17 school districts and 1 state) located in 13 states. 125 schools are Reading First schools and 123 are non-Reading First schools. There are 8 late award sites, with 137 schools, and 10 early award sites, with 111 schools. Impact estimates are statistically adjusted (e.g., take each school's rating, site-specific funding cut-point, and other covariates into account) to reflect the regression discontinuity design of the study. A two-tailed test of significance was used, and where applicable, statistically significant findings at the p≤.05 level are indicated by *. EXHIBIT READS: The estimated difference in impact between early award and late award sites for the grade 1 was -8.8 percentage points. The difference was not statistically significant at the p≤.05 level (p=.251).
Sources: RFIS SAT 10 administration in the spring of 2005, as well as from state/district education agencies in those sites that already use the SAT 10 for their standardized testing (i.e., FL, KS, MD, OR).

G-6 Additional Exhibits for Subgroup Analyses
Exhibit G.5: Estimated Impacts on Reading Comprehension by Award Group: Spring 2006; Scaled Score
Actual Mean with
Reading First
Estimated Mean
without Reading
First Impact Effect Size of Impact
Statistical Significance
of Impact (p-value)
Early Award Sites Grade 1 Average Scaled Score 549.6 550.0 -0.4 -0.01 (0.944)
Corresponding Grade Equivalent 1.8 1.8 6.14 Corresponding Percentile 50 50
Grade 2 Average Scaled Score 588.4 593.5 -5.1 -0.12 (0.376)
Corresponding Grade Equivalent 2.6 2.7 5.68 Corresponding Percentile 42 46
Grade 3 Average Scaled Score 614.2 619.9 -5.7 -0.14 (0.254)
Corresponding Grade Equivalent 3.5 3.8 4.92 Corresponding Percentile 44 49
Late Award Sites Grade 1 Average Scaled Score 542.7 533.0 9.7* 0.20* (0.031)
Corresponding Grade Equivalent 1.7 1.6 4.44 Corresponding Percentile 44 37
Grade 2 Average Scaled Score 582.8 576.3 6.5 0.15 (0.078)
Corresponding Grade Equivalent 2.4 2.3 3.65 Corresponding Percentile 38 33
Grade 3 Average Scaled Score 605.7 602.4 3.4 0.08 (0.314)
Corresponding Grade Equivalent 3.1 3.0 3.33 Corresponding Percentile 36 34
Notes: The complete RF study sample includes 248 schools from 18 sites (17 school districts and 1 state) located in 13 states. 125 schools are Reading First schools and 123 are non-Reading First schools. For grade 2, one non-RF school could not be included in the analysis because test score data were not available. There are 8 late award sites, with 137 schools, and 10 early award sites, with 111 schools. The effect size of the impact is the impact divided by the actual standard deviation of the outcome for the non-Reading First schools pooled across the spring 2005 and 2006 SAT-10 test scores (by grade). Values in the “Actual Mean with Reading First” column are actual, unadjusted values for Reading First schools; values in the “Estimated Mean without Reading First” column represent the best estimates of what would have happened in RF schools absent RF funding and are calculated by subtracting the impact estimates from the RF schools’ actual mean values. A two-tailed test of significance was used, and where applicable, statistically significant findings at the p≤.05 level are indicated by *. EXHIBIT READS: The observed mean reading comprehension score for first-graders with Reading First in the early award sites was 549.6 scaled score points. The estimated mean without Reading First was 550.0 scaled score points. The impact of Reading First was -0.4 scaled score points (or -0.01 standard deviations), which was not statistically significant at the p≤.05 level (p=.944).
Sources: RFIS SAT 10 administration in the spring of 2006, as well as from state/district education agencies in those sites that already use the SAT 10 for their standardized testing (i.e., FL, KS, MD, OR).

Additional Exhibits for Subgroup Analyses G-7
Exhibit G.6: Award Group Differences in Estimated Impacts on Reading Comprehension: Spring 2006; Scaled Score
Difference in Impact
(Early - Late) Effect Size of
Difference
Statistical Significance of
Difference (p-value)
All Sites Average Scaled Score
Grade 1 -10.2 -0.21 (0.181) Grade 2 -11.6 -0.27 (0.089) Grade 3 -9.0 -0.23 (0.130)
Notes: The complete RF study sample includes 248 schools from 18 sites (17 school districts and 1 state) located in 13 states. 125 schools are Reading First schools and 123 are non-Reading First schools. For grade 2, one non-RF school could not be included in the analysis because test score data were not available. There are 8 late award sites, with 137 schools, and 10 early award sites, with 111 schools. The effect size of the impact is the impact divided by the actual standard deviation of the outcome for the non-Reading First schools pooled across the spring 2005 and 2006 SAT-10 test scores (by grade). Impact estimates are statistically adjusted (e.g., take each school's rating, site-specific funding cut-point, and other covariates into account) to reflect the regression discontinuity design of the study. A two-tailed test of significance was used, and where applicable, statistically significant findings at the p≤.05 level are indicated by *. EXHIBIT READS: The estimated difference in impact between early and late cohorts for grade 1 was -10.2 scaled score points. The difference in effect size was -0.21 standard deviations. The estimated difference was not statistically significant at the p≤.05 level (p=.181).
Sources: RFIS SAT 10 administration in the spring of 2006, as well as from state/district education agencies in those sites that already use the SAT 10 for their standardized testing (i.e., FL, KS, MD, OR).

G-8 Additional Exhibits for Subgroup Analyses
Exhibit G.7: Estimated Impacts on Reading Comprehension by Award Group: Spring 2006; Percent At or Above Grade Level
Actual Mean with
Reading First
Estimated Mean
without Reading
First Impact
Statistical Significance
of Impact (p-value)
Early Award Sites Percent At or Above Grade Level
Grade 1 50.4 52.3 -1.9 (0.751) Grade 2 41.8 48.6 -6.8 (0.303) Grade 3 44.7 52.4 -7.7 (0.225)
Late Award Sites Percent At or Above Grade Level
Grade 1 44.9 35.5 9.4* (0.024) Grade 2 38.5 32.8 5.7 (0.155) Grade 3 36.2 32.0 4.2 (0.269)
Notes: The complete RF study sample includes 248 schools from 18 sites (17 school districts and 1 state) located in 13 states. 125 schools are Reading First schools and 123 are non-Reading First schools. For grade 2, one non-RF school could not be included in the analysis because test score data were not available. There are 8 late award sites, with 137 schools, and 10 early award sites, with 111 schools. Values in the “Actual Mean with Reading First” column are actual, unadjusted values for Reading First schools; values in the “Estimated Mean without Reading First” column represent the best estimates of what would have happened in RF schools absent RF funding and are calculated by subtracting the impact estimates from the RF schools’ actual mean values. A two-tailed test of significance was used, and where applicable, statistically significant findings at the p≤.05 level are indicated by *. EXHIBIT READS: The observed average percent of first-graders reading at or above grade level with Reading First in the early award sites was 50.4 percentage points. The estimated average percent without Reading First was 52.3 percentage points. The impact of Reading First on the percent of students reading at or above grade level was -1.9 percentage points, which was not statistically significant at the p≤.05 level (p=.751). Sources: RFIS SAT 10 administration in the spring of 2006, as well as from state/district education agencies in those sites that already use the SAT 10 for their standardized testing (i.e., FL, KS, MD, OR).

Additional Exhibits for Subgroup Analyses G-9
Exhibit G.8: Award Group Differences in Estimated Impacts on Reading Comprehension: Spring 2006; Percent At or Above Grade Level
Difference in Impact
(Early – Late)
Statistical Significance of
Difference (p-value)
All Sites Percent At or Above Grade Level
Grade 1 -11.3 (0.123) Grade 2 -12.4 (0.105) Grade 3 -11.8 (0.107)
Notes: The complete RF study sample includes 248 schools from 18 sites (17 school districts and 1 state) located in 13 states. 125 schools are Reading First schools and 123 are non-Reading First schools. For grade 2, one non-RF school could not be included in the analysis because test score data were not available. There are 8 late award sites, with 137 schools, and 10 early award sites, with 111 schools. Impact estimates are statistically adjusted (e.g., take each school's rating, site-specific funding cut-point, and other covariates into account) to reflect the regression discontinuity design of the study. A two-tailed test of significance was used, and where applicable, statistically significant findings at the p≤.05 level are indicated by *. EXHIBIT READS: The estimated difference in impact between early award and late award sites for the grade 1 is -11.3 percentage points. The estimated difference was not statistically significant at the p≤.05 level (p=.123).
Sources: RFIS SAT 10 administration in the spring of 2006, as well as from state/district education agencies in those sites that already use the SAT 10 for their standardized testing (i.e., FL, KS, MD, OR).

G-10 Additional Exhibits for Subgroup Analyses
Exhibit G.9: Estimated Impacts on Instructional Outcomes by Award Group: Spring 2005
Actual Mean with
Reading First
Estimated Mean
without Reading
First Impact
Effect Size of Impact
Statistical Significance
of Impact (p-value)
Early award sites Number of minutes of instruction in five dimensions combined Grade 1 62.69 57.20 5.49 0.26 (0.376) Grade 2 62.82 51.89 10.93 0.51 (0.083)
Percentage of intervals in five dimensions with Highly Explicit Instruction Grade 1 30.88 21.82 9.06* 0.50* (0.035) Grade 2 32.06 26.40 5.66 0.29 (0.176) High Quality Student Practice Grade 1 21.68 20.25 1.43 0.09 (0.717) Grade 2 22.41 17.72 4.68 0.26 (0.199)
Late award sites Number of minutes of instruction in five dimensions combined
Grade 1 56.51 45.00 11.51* 0.55* (0.001) Grade 2 55.10 40.25 14.84* 0.70* (<0.001)
Percentage of intervals in five dimensions with Highly Explicit Instruction Grade 1 28.80 22.79 6.00* 0.33* (0.040) Grade 2 31.90 23.95 7.94* 0.41* (0.016) High Quality Student Practice Grade 1 21.02 23.27 -2.25 -0.13 (0.417) Grade 2 23.30 19.69 3.61 0.20 (0.206) Notes: The complete RFIS study sample includes 248 schools from 18 sites (17 districts and 1 state) located in 13 states. 125 schools are Reading First schools and 123 are non-Reading First schools. There are 8 late award sites, with 137 schools, and 10 early award sites, with 111 schools. The effect size of the impact is the impact divided by the actual standard deviation of the outcome for the non-Reading First schools pooled across the spring 2005, fall 2005, and spring 2006 IPRI data (by grade). Values in the “Actual Mean with Reading First” column are actual, unadjusted values for Reading First schools; values in the “Estimated Mean without Reading First” column represent the best estimates of what would have happened in RF schools absent RF funding and are calculated by subtracting the impact estimates from the RF schools’ actual mean values. A two-tailed test of significance was used, and where applicable, statistically significant findings at the p≤.05 level are indicated by *.
EXHIBIT READS: The observed mean amount of time spent in instruction in the five dimensions (phonemic awareness, phonics, vocabulary, fluency, and comprehension) in first grade classrooms with Reading First in early award sites was 62.69 minutes. The estimated mean amount of time without Reading First was 57.20 minutes. The impact of Reading First on the amount of time spent in instruction in the five dimensions was 5.49 minutes (or 0.26 standard deviations), which was not statistically significant at the p≤.05 level (p=.376).
Source: RFIS Instructional Practice in Reading Inventory, spring 2005

Additional Exhibits for Subgroup Analyses G-11
Exhibit G.10: Award Group Differences in Estimated Impacts on Instructional Outcomes: Spring 2005
Difference in Impact
(Early - Late) Effect Size of
Difference
Statistical Significance of
Difference (p-value)
Number of minutes spent in instruction in five dimensions combined Grade 1 -6.02 -0.29 (0.398) Grade 2 -3.91 -0.18 (0.590)
Percentage of observation intervals in five dimensions with Highly Explicit Instruction Grade 1 3.05 0.17 (0.552) Grade 2 -2.28 -0.12 (0.665)
High Quality Student Practice Grade 1 3.68 0.22 (0.445) Grade 2 1.08 0.06 (0.815)
Notes: The complete RFIS sample includes 248 schools from 18 sites (17 districts and 1 state) located in 13 states. 125 schools are Reading First schools and 123 are non-Reading First schools. There are 8 late award sites, with 137 schools, and 10 early award sites, with 111 schools. The effect size of the impact is the impact divided by the actual standard deviation of the outcome for the non-Reading First schools pooled across the spring 2005, fall 2005, and spring 2006 IPRI data (by grade). Impact estimates are statistically adjusted (e.g., take each school's rating and site-specific funding cut-point into account) to reflect the regression discontinuity design of the study. A two-tailed test of significance was used, and where applicable, statistically significant findings at the p≤.05 level are indicated by *. EXHIBIT READS: The estimated difference between the early and late award sites in the impact of Reading First on instructional time spent in the five dimensions (phonemic awareness, phonics, vocabulary, fluency, and comprehension) for grade 1 was –6.02 minutes. This translates into an effect size of -.29 standard deviations. The estimated difference was not statistically significant at the p≤.05 level (p=.398). Sources: RFIS Instructional Practice in Reading Inventory, spring 2005

G-12 Additional Exhibits for Subgroup Analyses
Exhibit G.11: Estimated Impacts on Instructional Outcomes, by Award Group: Fall 2005 and Spring 2006
Actual Mean with
Reading First
Estimated Mean
without Reading
First Impact
Effect Size of Impact
Statistical Significance
of Impact (p-value)
Early award sites Number of minutes of instruction in five dimensions combined Grade 1 62.51 58.35 4.16 0.20 (0.457) Grade 2 64.77 60.21 4.56 0.21 (0.410) Percentage of intervals in five dimensions with Highly Explicit Instruction Grade 1 30.68 28.37 2.30 0.13 (0.455) Grade 2 31.51 30.84 0.67 0.03 (0.845) High Quality Student Practice Grade 1 17.86 19.92 -2.05 -0.12 (0.462) Grade 2 16.33 10.63 5.70* 0.32* (0.041)
Late award sites Number of minutes of instruction in five dimensions combined
Grade 1 57.12 45.09 12.03* 0.58* (0.004) Grade 2 56.82 40.71 16.11* 0.76* (<0.001) Percentage of intervals in five dimensions with Highly Explicit Instruction Grade 1 29.04 27.42 1.62 0.09 (0.495) Grade 2 31.19 19.00 12.19* 0.63* (<0.001) High Quality Student Practice Grade 1 18.10 13.28 4.82* 0.29* (0.020) Grade 2 16.52 14.65 1.87 0.10 (0.357) Notes: The complete RFIS study sample includes 248 schools from 18 sites (17 districts and 1 state) located in 13 states. 125 schools are Reading First schools and 123 are non-Reading First schools. There are 8 late award sites, with 137 schools, and 10 early award sites, with 111 schools. The effect size of the impact is the impact divided by the actual standard deviation of the outcome for the non-Reading First schools pooled across the spring 2005, fall 2005, and spring 2006 IPRI data (by grade). Values in the “Actual Mean with Reading First” column are actual, unadjusted values for Reading First schools; values in the “Estimated Mean without Reading First” column represent the best estimates of what would have happened in RF schools absent RF funding and are calculated by subtracting the impact estimates from the RF schools’ actual mean values. A two-tailed test of significance was used, and where applicable, statistically significant findings at the p≤.05 level are indicated by *.
EXHIBIT READS: The observed mean amount of time spent in instruction in the five dimensions (phonemic awareness, phonics, vocabulary, fluency, and comprehension) in first grade classrooms with Reading First in early award sites was 62.51 minutes. The estimated mean amount of time without Reading First was 58.35 minutes. The impact of Reading First on the amount of time spent in instruction in the five dimensions was 4.16 minutes (or 0.20 standard deviations), which was not statistically significant at the p≤.05 level (p=.457).
Sources: RFIS Instructional Practice in Reading Inventory, fall 2005 and spring 2006

Additional Exhibits for Subgroup Analyses G-13
Exhibit G.12: Award Group Differences in Estimated Impacts on Instructional Outcomes: Fall 2005 and Spring 2006
Difference in Impact
(Early – Late) Effect Size of
Difference
Statistical Significance of
Difference (p-value)
Number of minutes spent in instruction in five dimensions combined Grade 1 -7.87 -0.38 (0.254) Grade 2 -11.55 -0.54 (0.088)
Percentage of observation intervals in five dimensions with Highly Explicit Instruction Grade 1 0.68 0.04 (0.860) Grade 2 -11.52* -0.60* (0.007)
High Quality Student Practice Grade 1 -6.87* -0.41* (0.047) Grade 2 3.83 0.21 (0.262)
Notes: The complete RFIS sample includes 248 schools from 18 sites (17 districts and 1 state) located in 13 states. 125 schools are Reading First schools and 123 are non-Reading First schools. There are 8 late award sites, with 137 schools, and 10 early award sites, with 111 schools. The effect size of the impact is the impact divided by the actual standard deviation of the outcome for the non-Reading First schools pooled across the spring 2005, fall 2005, and spring 2006 IPRI data (by grade). Impact estimates are statistically adjusted (e.g., take each school's rating and site-specific funding cut-point into account) to reflect the regression discontinuity design of the study. A two-tailed test of significance was used, and where applicable, statistically significant findings at the p≤.05 level are indicated by *.
EXHIBIT READS: The estimated difference between the early and late award sites in the impact of Reading First on instructional time spent in the five dimensions (phonemic awareness, phonics, vocabulary, fluency, and comprehension) for grade 1 was –7.87 minutes. This translates into an effect size of -.38 standard deviations. The estimated difference was not statistically significant at the p≤.05 level (p=.254).
Sources: RFIS Instructional Practice in Reading Inventory, fall 2005 and spring 2006

G-14 Additional Exhibits for Subgroup Analyses
Exhibit G.13: Award Group Differences in Estimated Impacts on Percentage of Students Engaged with Print: Fall 2005 and Spring 2006
Difference in Impact
(Early – Late) Effect Size of
Difference
Statistical Significance of Difference
(p-value)
All Sites Percentage of students engaged with print Grade 1 -13.9 -0.47 (0.073) Grade 2 -12.5 -0.44 (0.105)
Notes: The complete RF study sample includes 248 schools from 18 sites (17 school districts and 1 state) located in 13 states. 125 schools are Reading First schools and 123 are non-Reading First schools. There are 8 late award sites, with 137 schools, and 10 early award sites, with 111 schools. The effect size of the impact is the impact divided by the actual standard deviation of the outcome for the non-Reading First schools pooled across the fall 2005 and spring 2006 STEP data (by grade). Impact estimates are statistically adjusted (e.g., take each school's rating and site-specific funding cut-point into account) to reflect the regression discontinuity design of the study. A two-tailed test of significance was used, and where applicable, statistically significant findings at the p≤.05 level are indicated by *. EXHIBIT READS: The estimated difference in impact between early and late award sites for grade 1 was –13.9 percentage points. This translates into an effect size of -0.47 standard deviations. The estimated difference was not statistically significant at the p≤.05 level (p=.073).
Sources: RFIS Student Time-on-Task and Engagement with Print, fall 2005 and spring 2006.

Additional Exhibits for Subgroup Analyses G-15
Exhibit G.14: Differences Across Years for Reading Comprehension, Reading Instruction, and Student Engagement with Print: Early Award Sites
Outcome Domain Outcome Grade p-value
Reading Comprehension SAT 10 Scaled Score Grade 1 (0.989) Grade 2 (0.945) Grade 3 (0.783) At or Above Grade Level Grade 1 (0.963) Grade 2 (0.887) Grade 3 (0.786) Index Grade 1 (0.973) Grade 2 (0.967) Grade 3 (0.776) Instructional Outcomes Minutes in Five
dimensions Grade 1 (0.873)
Grade 2 (0.443) HEI Grade 1 (0.198) Grade 2 (0.353) HQSP Grade 1 (0.470) Grade 2 (0.823) Index Grade 1 (0.389) Grade 2 (0.421) Percentage of Students Engaged with Print STEP Grade 1 N/A Grade 2 N/A
The complete RF study sample includes 248 schools from 18 sites (17 school districts and 1 state) located in 13 states. 125 schools are Reading First schools and 123 are non-Reading First schools. For Grade 2, two non-RF schools could not be included in the analysis because no data for grade two were available. There are 8 late award sites, with 137 schools, and 10 early award sites, with 111 schools. Impact estimates are statistically adjusted (e.g., take each school's rating, site-specific funding cut-point, and other covariates into account) to reflect the regression discontinuity design of the study. A two-tailed test of significance was used, and where applicable, statistically significant findings at the p≤.05 level are indicated by *.
EXHIBIT READS: Differences across years in impacts of Reading First on reading comprehension in grade 1, as measured by the SAT 10 scaled score, were not statistically significant at the p≤.05 level (p=.989). Sources: RFIS SAT 10 administration in the spring of 2006, as well as from state/district education agencies in those sites that already use the SAT 10 for their standardized testing (i.e., FL, KS, MD, OR); RFIS Instructional Practice in Reading Inventory, spring 2005, fall 2005, and spring 2006; and RFIS Student Time-on-Task and Engagement with Print, fall 2005 and spring 2006.

G-16 Additional Exhibits for Subgroup Analyses
Exhibit G.15: Differences Across Years for Reading Comprehension, Reading Instruction, and Student Engagement with Print: Late Award Sites
Outcome Domain Outcome Grade p-value
Reading Comprehension SAT 10 Scaled Score Grade 1 (0.310) Grade 2 (0.800) Grade 3 (0.674) At or Above Grade Level Grade 1 (0.531) Grade 2 (0.914) Grade 3 (0.626) Index Grade 1 (0.395) Grade 2 (0.952) Grade 3 (0.637) Instructional Outcomes Minutes in Five
dimensions Grade 1 (0.922)
Grade 2 (0.815) HEI Grade 1 (0.242) Grade 2 (0.304) HQSP Grade 1 (0.040)* Grade 2 (0.619) Index Grade 1 (0.612) Grade 2 (0.666) Percentage of Students Engaged with Print STEP Grade 1 N/A
Grade 2 N/A The complete RF study sample includes 248 schools from 18 sites (17 school districts and 1 state) located in 13 states. 125 schools are Reading First schools and 123 are non-Reading First schools. There are 8 late award sites, with 137 schools, and 10 early award sites, with 111 schools. Impact estimates are statistically adjusted (e.g., take each school's rating, site-specific funding cut-point, and other covariates into account) to reflect the regression discontinuity design of the study. A two-tailed test of significance was used, and where applicable, statistically significant findings at the p≤.05 level are indicated by *.
EXHIBIT READS: Differences across years in impacts of Reading First on reading comprehension in grade 1, as measured by the SAT 10 scaled score, were not statistically significant at the p≤.05 level (p=.310). Sources: RFIS SAT 10 administration in the spring of 2006, as well as from state/district education agencies in those sites that already use the SAT 10 for their standardized testing (i.e., FL, KS, MD, OR); RFIS Instructional Practice in Reading Inventory, spring 2005, fall 2005, and spring 2006; and RFIS Student Time-on-Task and Engagement with Print, fall 2005 and spring 2006.

Alternative Moderators of Reading First Impacts H-1
Appendix H: Alternative Moderators of Reading First Impacts
The discussion in Chapter 4 indicates that the study team had a priori hypotheses about potential differences in sample schools due to award date. There were, in fact, differences in the patterns of Reading First impacts on reading comprehension scores between early and late award sites in first and second grade (see top two panels of Exhibit H.1). In the late award sites in these grades, schools with Reading First had higher reading comprehension scores than they would have had in the absence of Reading First. In early award sites, there was no statistically significant impact of Reading First. In this appendix, we explore the early and late award site differences further, as well as explore two other potential moderating factors, fall 2004 reading performance for non-Reading First schools and Reading First funding per student. The appendix describes the construction of these potential moderating factors and presents results of various tests that were conducted to test the relationship of these moderators to impacts. Award Date
The award date information was obtained from Reading First district coordinators in November 2005. District coordinators were asked to provide the month and year that Reading First money was made available to schools in their respective districts. The continuous award variable was then calculated as the number of months between the month/year the funds became available to each site and January 2003. For example, if the funds became available to a site in April of 2003, the continuous award variable for that site would be 3. Fall 2004 Reading Performance of the non-Reading First Schools
Fall 2004 reading performance for students in the non-RF schools represents the best approximation of existing student reading proficiency in each site. This variable draws on test score data from fall 2004, which is up to 16 months after the RF award date in early award sites, and prior to the RF award date in all late award sites. The percent of students in grades 1-3 at or above grade level variable was constructed using students’ fall 2004 SAT 10 scaled scores,52 as well as the test date at each school. Each student’s scaled score was compared to corresponding grade equivalency norms to determine whether the student was at or above grade level. The percent of non-Reading First students at or above grade level was created by taking the mean of the student-level at or above grade level variable, across all grades within a school, and averaging across all schools within a site.
52 In the fall of 2004, students’ SAT 10 scores were unavailable. For those sites scores from the spring of
2005 were substituted and adjusted by the mean difference of all other students’ spring and fall SAT 10 scores, by grade.

H-2 Alternative Moderators of Reading First Impacts
Reading First Funding Per Student
The amount of the Reading First funding per student was constructed using data from the SEDL database53 (as of October 2004) about award amounts for each site, and the Common Core Data that provided the number of K-3 students within each school. The Reading First funding per pupil was calculated separately for the 2002-2003 and 2003-2004 school years. Since 20 percent of the Reading First grant award to each district was set aside for district Reading First activities, and therefore not used to directly fund Reading First schools, for each of these school years the Reading First award amount per site was multiplied by .80. The award amount was then divided by the number of students in grades K-3 in all Reading First schools per site. The Reading First funding per pupil for the two school years was then averaged by site to create the Reading First per pupil expenditure variable used in analysis. Subgroup Analyses of the Effects of the Moderating Factors
For each of the three moderating factors, sites were ordered by the moderating factor and then separated into two subgroups of sites that are as balanced as possible, with respect to the number of Reading First schools.54 Program impacts were then estimated for one key outcome measure from each of the three domains for the two subgroups. These outcomes included (a) the SAT 10 scaled score for reading comprehension, (b) total minutes in the five dimensions of reading instruction, and (c) percentage of students engaged with print. First, analyses tested the difference between impacts for the two subgroups. Then, to test whether the conclusions were sensitive to the specific cut-point chosen to define the subgroups, average impacts were re-estimated for each subgroup after dropping the two sites closest to the cut-point between the two subgroups. This was repeated again after dropping the next two sites closest to the cut-point between the two subgroups. The exhibits show the detailed results of subgroup analyses based on award dates, fall 2004 student reading performance, and RF funds per student. Each exhibit presents results for one outcome measure, by subgroup and by grade. Exhibits H.1–H.3 show the results for award date. Exhibits H.4–H.6 and Exhibits H.7–H.9 report the subgroup analyses results for fall 2004 performance of non-Reading First school students and RF funds per student, respectively. The results suggest that some differences exist between early and late sites’ impacts both in reading comprehension and instruction; only differences in impacts for reading comprehension in grades two and three are statistically significant. There were no systematic differences in impacts for the two subgroups of sites whose non-RF schools were lower-performing versus higher-performing or for the two subgroups of sites who had lower versus higher amounts of RF funding per student. Findings across all three moderators were not generally sensitive to the omission of borderline sites from the analyses.
53 Southwest Educational Development Laboratory (SEDL) is contracted to maintain the Reading First
Awards database available online at http://www.sedl.org/readingfirst/welcome.html. SEDL lists the amount awarded to each Reading First district in the first year. State Reading First Coordinators are responsible for providing this information to SEDL.
54 For each moderating factor, the order of sites was slightly different. Therefore, the composition of the two subgroups for each moderating factor differed both in the actual sites included and in the total number of schools included.
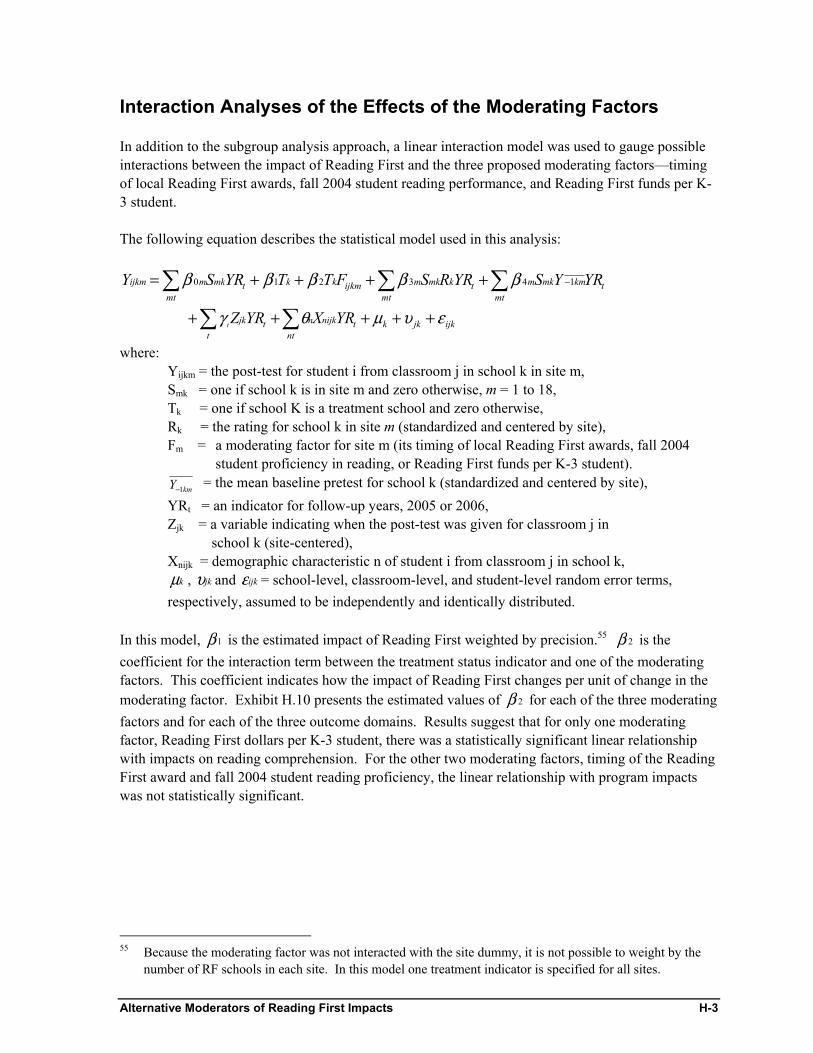
Alternative Moderators of Reading First Impacts H-3
Interaction Analyses of the Effects of the Moderating Factors
In addition to the subgroup analysis approach, a linear interaction model was used to gauge possible interactions between the impact of Reading First and the three proposed moderating factors—timing of local Reading First awards, fall 2004 student reading performance, and Reading First funds per K-3 student. The following equation describes the statistical model used in this analysis:
tmt mt mt
kmmkmtkmkmijkmkktmkmijkm YRYSYRRSFTTYRSY ∑ ∑ ∑ −++++= 143210 βββββ
∑∑ +++++nt
ijkjkktnijknt
tjk YRXYRZt ευμθγ
where: Yijkm = the post-test for student i from classroom j in school k in site m, Smk = one if school k is in site m and zero otherwise, m = 1 to 18, Tk = one if school K is a treatment school and zero otherwise, Rk = the rating for school k in site m (standardized and centered by site), Fm = a moderating factor for site m (its timing of local Reading First awards, fall 2004
student proficiency in reading, or Reading First funds per K-3 student). kmY 1− = the mean baseline pretest for school k (standardized and centered by site),
YRt = an indicator for follow-up years, 2005 or 2006, Zjk = a variable indicating when the post-test was given for classroom j in school k (site-centered), Xnijk = demographic characteristic n of student i from classroom j in school k,
kμ , jkυ and ijkε = school-level, classroom-level, and student-level random error terms, respectively, assumed to be independently and identically distributed.
In this model, 1β is the estimated impact of Reading First weighted by precision.55 2β is the coefficient for the interaction term between the treatment status indicator and one of the moderating factors. This coefficient indicates how the impact of Reading First changes per unit of change in the moderating factor. Exhibit H.10 presents the estimated values of 2β for each of the three moderating factors and for each of the three outcome domains. Results suggest that for only one moderating factor, Reading First dollars per K-3 student, there was a statistically significant linear relationship with impacts on reading comprehension. For the other two moderating factors, timing of the Reading First award and fall 2004 student reading proficiency, the linear relationship with program impacts was not statistically significant.
55 Because the moderating factor was not interacted with the site dummy, it is not possible to weight by the
number of RF schools in each site. In this model one treatment indicator is specified for all sites.

H-4 Alternative Moderators of Reading First Impacts
Summary
Across the alternative moderating factors explored in this appendix, only one (Reading First funding per student) factor was statistically significantly related to student reading achievement. However, when the RFIS sample is divided into two subgroups (on the factors described above), differences between subgroups are not generally significant, with the exception of early and late award subgroups.

Alternative Moderators of Reading First Impacts H-5
Exhibit H.1: Estimated Impacts on Reading Comprehension, by Award Status
SAT 10 Scaled Scores Full Drop 1 Pair Drop 2 Pairs
Early Award Sites Grade 1 Impact -0.22 -0.56 3.42 SE 5.14 5.33 5.69 p-value (0.966) (0.916) (0.547) Grade 2 Impact -4.78 -5.87 -4.02 SE 4.45 4.67 4.65 p-value (0.283) (0.209) (0.387) Grade 3 Impact -6.98 -8.74* -6.12 SE 4.18 4.38 4.28 p-value (0.095) (0.046) (0.153) Late Award Sites Grade 1 Impact 6.58* 5.53 1.99 SE 3.14 3.38 3.82 p-value (0.036) (0.102) (0.602) Grade 2 Impact 6.09* 5.62* 6.97* SE 2.59 2.86 3.48 p-value (0.019) (0.050) (0.045) Grade 3 Impact 2.43 1.38 1.13 SE 2.25 2.43 2.69 p-value (0.280) (0.569) (0.675) Difference Grade 1 Impact -6.80 -6.09 1.43 SE 6.02 6.31 6.86 p-value (0.260) (0.335) (0.835) Grade 2 Impact -10.87* -11.48* -10.99 SE 5.15 5.48 5.81 p-value (0.036) (0.037) (0.059) Grade 3 Impact -9.41* -10.12* -7.24 SE 4.75 5.00 5.05 p-value (0.049) (0.044) (0.153)
Notes: The complete RF study sample includes 248 schools from 18 sites (17 school districts and 1 state) located in 13 states. 125 schools are Reading First schools and 123 are non-Reading First schools. For grade 2, one non-RF school could not be included in the analysis because test score data were not available. There are 8 late award sites totaling 137 schools and 10 early award sites totaling 111 schools. Impact estimates are statistically adjusted (e.g., take each school's rating, site-specific funding cut-point, and other covariates into account) to reflect the regression discontinuity design of the study. A two-tailed test of significance was used, and where applicable, statistically significant findings at the p≤.05 level are indicated by *. EXHIBIT READS: The impact of the Reading First program in early award sites for grade 1 on reading comprehension was -0.22 scaled score points, on average, for the full sample of 18 sites. The impact was not statistically significant at the p≤.05 level (p=.966). The impact of the Reading First program in early award sites for grade 1 on reading comprehension was -0.56 scaled score points, on average, for the sample of 16 sites remaining after one pair of sites closest to the cut-point was dropped. The impact was not statistically significant at the p≤.05 level (p=.916). The impact of the Reading First program in early award sites for grade 1 on reading comprehension scaled score was 3.42 scaled score points, on average, for the sample of 14 sites remaining after two pairs of sites closest to the cut-point were dropped. The impact was not statistically significant at the p≤.05 level (p=.547).
Sources: RFIS SAT 10 administration in the spring of 2005 and 2006, as well as from state/district education agencies in those sites that already use the SAT 10 for their standardized testing (i.e., FL, KS, MD, OR).

H-6 Alternative Moderators of Reading First Impacts
Exhibit H.2: Estimated Impacts on Reading Instruction, by Award Status
Minutes in Five Dimensions Full Drop 1 Pair Drop 2 Pairs
Early Award Sites Grade 1 Impact 4.73 3.46 2.46 SE 4.89 5.14 5.50 p-value (0.336) (0.503) (0.655) Grade 2 Impact 7.49 7.49 8.90 SE 5.16 5.44 5.83 p-value (0.149) (0.171) (0.130) Late Award Sites Grade 1 Impact 11.57* 11.36* 8.83* SE 3.32 3.66 3.91 p-value (0.001) (0.002) (0.027) Grade 2 Impact 15.63* 13.94* 12.72* SE 3.25 3.42 3.91 p-value (<0.001) (<0.001) (0.002) Difference Grade 1 Impact -6.83 -7.89 -6.37 SE 5.91 6.31 6.75 p-value (0.249) (0.212) (0.346) Grade 2 Impact -8.14 -6.44 -3.82 SE 6.09 6.42 7.01 p-value (0.183) (0.317) (0.587)
Notes: The complete RF study sample includes 248 schools from 18 sites (17 school districts and 1 state) located in 13 states. 125 schools are Reading First schools and 123 are non-Reading First schools. There are 8 late award sites totaling 137 schools and 10 early award sites totaling 111 schools. Impact estimates are statistically adjusted (e.g., take each school's rating and site-specific funding cut-point into account) to reflect the regression discontinuity design of the study. A two-tailed test of significance was used, and where applicable, statistically significant findings at the p≤.05 level are indicated by *. EXHIBIT READS: The impact of the Reading First program in early award sites for grade 1 on the number of minutes of instruction in the five dimensions was 4.73 minutes on average for the full sample of 18 sites. The impact was not statistically significant at the p≤.05 level (p=.336). The impact of the Reading First program in early award sites for grade 1 on the number of minutes of instruction in the five dimensions was 3.46 minutes on average for the sample of 16 sites remaining after one pair of sites closest to the cut-point was dropped. The impact was not statistically significant at the p≤.05 level (p=.503). The impact of the Reading First program in early award sites for grade 1 on the number of minutes of instruction in the five dimensions was 2.46 minutes on average for the sample of 14 sites remaining after two pairs of sites closest to the cut-point were dropped. The impact was not statistically significant at the p≤.05 level (p=.655).
Sources: RFIS Instructional Practice in Reading Inventory, spring 2005, fall 2005, and spring 2006.

Alternative Moderators of Reading First Impacts H-7
Exhibit H.3: Estimated Impacts on Percentage of Student Engagement with Print, by Award Status
Percentage of Students Engaged with Print Full Drop 1 Pair Drop 2 Pairs
Early Award Sites Grade 1 Impact -3.10 -2.05 -0.51 SE 6.26 6.46 6.73 p-value (0.622) (0.752) (0.940) Grade 2 Impact -15.77* -15.51* -17.91* SE 5.81 5.87 6.23 p-value (0.008) (0.010) (0.005) Late Award Sites Grade 1 Impact 10.78* 2.48 6.27 SE 4.52 4.78 5.47 p-value (0.019) (0.605) (0.255) Grade 2 Impact -3.24 -8.78 -7.10 SE 5.06 5.08 6.52 p-value (0.522) (0.087) (0.280) Difference Grade 1 Impact -13.88 -4.53 -6.78 SE 7.72 8.04 8.67 p-value (0.073) (0.574) (0.435) Grade 2 Impact -12.53 -6.72 -10.80 SE 7.70 7.76 9.02 p-value (0.105) (0.387) (0.232)
Notes: The complete RF study sample includes 248 schools from 18 sites (17 school districts and 1 state) located in 13 states. 125 schools are Reading First schools and 123 are non-Reading First schools. There are 8 late award sites totaling 137 schools and 10 early award sites totaling 111 schools. Impact estimates are statistically adjusted (e.g., take each school's rating and site-specific funding cut-point into account) to reflect the regression discontinuity design of the study. A two-tailed test of significance was used, and where applicable, statistically significant findings at the p≤.05 level are indicated by *. EXHIBIT READS: The impact of the Reading First program on early award sites for grade 1 on the percentage of student engagement with print was –3.10 percentage points on average for the full sample of 18 sites. The impact was not statistically significant at the p≤.05 level (p=.622). The impact of the Reading First program in early award sites for grade 1 on the percentage of student engagement with print was –2.05 percentage points on average for the sample of 16 sites remaining after one pair of sites closest to the cut-point was dropped. The impact was not statistically significant at the p≤.05 level (p=.752). The impact of the Reading First program in early award sites for grade 1 on the percentage of student engagement with print was –0.51 percentage points on average for the sample of 14 sites remaining after two pairs of sites closest to the cut-point were dropped. The impact was not statistically significant at the p≤.05 level (p=.940).
Sources: RFIS Student Time-on-Task and Engagement with Print, fall 2005 and spring 2006.

H-8 Alternative Moderators of Reading First Impacts
Exhibit H.4: Estimated Impacts on Reading Comprehension, by Fall 2004 Reading Performance of the non-Reading First Schools
SAT 10 Scaled Scores Full Drop 1 Pair Drop 2 Pairs
High Non-RF School Performance Grade 1 Impact 5.87 4.52 8.14* SE 5.02 4.09 4.11 p-value (0.243) (0.269) (0.048) Grade 2 Impact -2.59 0.24 2.70 SE 3.90 3.20 2.97 p-value (0.506) (0.939) (0.364) Grade 3 Impact -3.15 -1.20 2.04 SE 3.79 3.05 2.88 p-value (0.406) (0.693) (0.480) Low Non-RF School Performance Grade 1 Impact 1.02 2.85 3.28 SE 3.22 3.51 3.53 p-value (0.751) (0.418) (0.355) Grade 2 Impact 5.32 6.07 6.21 SE 2.89 3.13 3.14 p-value (0.066) (0.056) (0.051) Grade 3 Impact -0.53 -0.88 2.00 SE 2.45 2.83 2.84 p-value (0.829) (0.756) (0.484) Difference Grade 1 Impact -4.85 -1.66 -4.86 SE 5.97 5.39 5.42 p-value (0.417) (0.758) (0.370) Grade 2 Impact 7.91 5.82 3.51 SE 4.85 4.48 4.32 p-value (0.105) (0.195) (0.418) Grade 3 Impact 2.62 0.32 -0.04 SE 4.51 4.16 4.05 p-value (0.562) (0.938) (0.992)
Notes: The complete RF study sample includes 248 schools from 18 sites (17 school districts and 1 state) located in 13 states. 125 schools are Reading First schools and 123 are non-Reading First schools. For grade 2, one non-RF school could not be included in the analysis because test score data were not available. There are 10 high non-RF comparison school sites totaling 120 schools and 8 low performance non-RF school sites totaling 128 schools. Impact estimates are statistically adjusted (e.g., take each school's rating, site-specific funding cut-point, and other covariates into account) to reflect the regression discontinuity design of the study. A two-tailed test of significance was used, and where applicable, statistically significant findings at the p≤.05 level are indicated by *. EXHIBIT READS: The impact of the Reading First program in high performance non-RF school sites for grade 1 on reading comprehension was 5.87 scaled score points on average for the full sample of 18 sites. The impact was not statistically significant at the p≤.05 level (p=.243). The impact of the Reading First program in high performance non-RF school sites for grade 1 on reading comprehension was 4.52 scaled score points on average for the sample of 16 sites remaining after one pair of sites closest to the cut-point was dropped. The impact was not statistically significant at the p≤.05 level (p=.269). The impact of the Reading First program in high performance non-RF school sites for grade 1 on average reading comprehension scaled score was 8.14 scaled score points on average for the sample of 14 sites remaining after two pairs of sites closest to the cut-point were dropped. The impact was statistically significant at the p≤.05 level (p=.048).
Sources: RFIS SAT 10 administration in the spring of 2005 and 2006, as well as from state/district education agencies in those sites that already use the SAT 10 for their standardized testing (i.e., FL, KS, MD, OR).

Alternative Moderators of Reading First Impacts H-9
Exhibit H.5: Estimated Impacts on Reading Instruction, by Fall 2004 Reading Performance of the Non-Reading First Schools
Minutes in Five Dimensions Full Drop 1 Pair Drop 2 Pairs
High Non-RF School Performance Grade 1 Impact 12.21* 13.85* 14.18* SE 4.53 4.13 4.23 p-value (0.008) (0.001) (0.001) Grade 2 Impact 13.37* 15.39* 17.60* SE 4.47 4.03 4.13 p-value (0.003) (0.002) (<0.001)
Low Non-RF School Performance Grade 1 Impact 5.07 4.60 4.77 SE 3.48 3.82 3.92 p-value (0.148) (0.232) (0.226) Grade 2 Impact 10.86* 8.65* 10.15* SE 3.64 3.99 4.10 p-value (0.003) (0.033) (0.015)
Difference Grade 1 Impact -7.14 -9.25 -9.41 SE 5.71 5.27 5.77 p-value (0.213) (0.101) (0.104) Grade 2 Impact -2.51 -6.74 -7.45 SE 5.76 5.67 5.82 p-value (0.663) (0.236) (0.202)
Notes: The complete RF study sample includes 248 schools from 18 sites (17 school districts and 1 state) located in 13 states. 125 schools are Reading First schools and 123 are non-Reading First schools. There are 10 high performance non-RF school sites totaling 120 schools, and 8 low performance non-RF school sites totaling 128 schools. Impact estimates are statistically adjusted (e.g., take each school's rating and site-specific funding cut-point into account) to reflect the regression discontinuity design of the study. A two-tailed test of significance was used, and where applicable, statistically significant findings at the p≤.05 level are indicated by *. EXHIBIT READS: The impact of the Reading First program in high performance non-RF school sites for grade 1 on the number of minutes of instruction in the five dimensions was 12.21 minutes on average for the full sample of 18 sites. The impact was statistically significant at the p≤.05 level (p=.008). The impact of the Reading First program in high performance non-RF school sites for grade 1 on the number of minutes of instruction in the five dimensions was 13.85 minutes on average for the sample of 16 sites remaining after one pair of sites closest to the cut-point was dropped. The impact was statistically significant at the p≤.05 level (p=.001). The impact of the Reading First program in high performance non-RF school sites for grade 1 on the number of minutes of instruction in the five dimensions was 14.18 minutes on average for the sample of 14 sites remaining after two pairs of sites closest to the cut-point were dropped. The impact was statistically significant at the p≤.05 level (p=.001).
Sources: RFIS Instructional Practice in Reading Inventory, spring 2005, fall 2005, and spring 2006.

H-10 Alternative Moderators of Reading First Impacts
Exhibit H.6: Estimated Impacts on Student Engagement with Print, by Fall 2004 Reading Performance of the Non-Reading First Schools
Percentage of Students Engaged with Print Full Drop 1 Pair Drop 2 Pairs
High Non-RF School Performance Grade 1 Impact -1.33 -4.60 -3.51 SE 5.82 5.51 5.54 p-value (0.819) (0.406) (0.528) Grade 2 Impact -10.08 -4.52 -5.23 SE 5.07 4.53 4.64 p-value (0.050) (0.321) (0.263) Low Non-RF School Performance Grade 1 Impact 10.48* 15.53* 17.32* SE 4.78 5.25 5.33 p-value (0.031) (0.004) (0.002) Grade 2 Impact -7.64 -7.84 -3.93 SE 5.67 6.10 6.36 p-value (0.181) (0.203) (0.538) Difference Grade 1 Impact 11.81 20.14* 20.83* SE 7.53 7.614 7.685 p-value (0.118) (0.009) (0.007) Grade 2 Impact 2.44 -3.32 1.30 SE 7.61 7.60 7.88 p-value (0.748) (0.663) (0.869)
Notes: The complete RF study sample includes 248 schools from 18 sites (17 school districts and 1 state) located in 13 states. 125 schools are Reading First schools and 123 are non-Reading First schools. There are 10 high performance non-RF school sites totaling 120 schools and 8 low performance non-RF school sites totaling 128 schools. Impact estimates are statistically adjusted (e.g., take each school's rating and site-specific funding cut-point into account) to reflect the regression discontinuity design of the study. A two-tailed test of significance was used, and where applicable, statistically significant findings at the p≤.05 level are indicated by *. EXHIBIT READS: The impact of the Reading First program in high performance non-RF school sites for grade 1 on the percentage of student engagement with print was –1.33 percentage points on average for the full sample of 18 sites. The impact was not statistically significant at the p≤.05 level (p=.819). The impact of the Reading First program in high performance non-RF school sites for grade 1 on the percentage of student engagement with print was –4.60 percentage points on average for the sample of 16 sites remaining after one pair of sites closest to the cut-point was dropped. The impact was not statistically significant at the p≤.05 level (p=.406). The impact of the Reading First program in high performance non-RF school sites for grade 1 on the percentage of student engagement with print was –3.51 percentage points on average for the sample of 14 sites remaining after two pairs of sites closest to the cut-point were dropped. The impact was not statistically significant at the p≤.05 level (p=.528).
Sources: RFIS Student Time-on-Task and Engagement with Print, fall 2005 and spring 2006.

Alternative Moderators of Reading First Impacts H-11
Exhibit H.7: Estimated Impacts on Reading Comprehension, by Reading First Funds Per Student
SAT 10 Scaled Score Full Drop 1 Pair Drop 2 Pairs
Low RF Funding Grade 1 Impact 1.11 -3.33 -7.24 SE 4.82 4.71 5.49 p-value (0.817) (0.480) (0.187) Grade 2 Impact 0.55 -4.69 -7.40 SE 4.08 3.84 4.58 p-value (0.892) (0.222) (0.106) Grade 3 Impact 2.25 -2.40 -4.99 SE 3.61 3.43 4.01 p-value (0.533) (0.483) (0.213) High RF Funding Grade 1 Impact 7.89 6.19 5.72 SE 4.50 5.09 5.36 p-value (0.079) (0.223) (0.286) Grade 2 Impact 5.55 6.83 6.42 SE 3.60 4.49 4.76 p-value (0.123) (0.128) (0.178) Grade 3 Impact 0.62 -1.42 -1.67 SE 3.34 3.58 3.86 p-value (0.852) (0.693) (0.666) Difference Grade 1 Impact -6.78 -9.52 -12.96 SE 6.59 6.93 7.67 p-value (0.305) (0.171) (0.093) Grade 2 Impact -4.99 -11.52 -13.82* SE 5.44 5.91 6.61 p-value (0.359) (0.052) (0.038) Grade 3 Impact 1.63 -0.99 -3.33 SE 4.92 4.96 5.57 p-value (0.741) (0.842) (0.550)
Notes: The complete RF study sample includes 248 schools from 18 sites (17 school districts and 1 state) located in 13 states. 125 schools are Reading First schools and 123 are non-Reading First schools. For grade 2, one non-RF school could not be included in the analysis because test score data were not available. There are 9 low RF funding sites totaling 124 schools and 9 high RF funding sites totaling 124 schools. Impact estimates are statistically adjusted (e.g., take each school's rating, site-specific funding cut-point, and other covariates into account) to reflect the regression discontinuity design of the study. A two-tailed test of significance was used, and where applicable, statistically significant findings at the p≤.05 level are indicated by *. EXHIBIT READS: The impact of the Reading First program in low Reading First funding sites for grade 1 on reading comprehension was 1.11 scaled score points on average for the full sample of 18 sites. The impact was not statistically significant at the p≤.05 level (p=.817). The impact of the Reading First program in low Reading First funding sites for grade 1 reading comprehension scaled score was –3.33 scaled score points on average for the sample of 16 sites remaining after one pair of sites closest to the cut-point was dropped. The impact was not statistically significant at the p≤.05 level (p=.480). The impact of the Reading First program in low Reading First funding sites for grade 1 on average reading comprehension scaled score was –7.24 scaled score points on average for the sample of 14 sites remaining after two pairs of sites closest to the cut-point were dropped. The impact was not statistically significant at the p≤.05 level (p=.187).
Sources: RFIS SAT 10 administration in the spring of 2005 and 2006, as well as from state/district education agencies in those sites that already use the SAT 10 for their standardized testing (i.e., FL, KS, MD, OR).

H-12 Alternative Moderators of Reading First Impacts
Exhibit H.8: Estimated Impacts on Reading Instruction, by Reading First Funds Per Student
Minutes in Five Dimensions Full Drop 1 Pair Drop 2 Pairs
Low RF Funding
Grade 1 Impact 4.00 4.74 2.92 SE 4.17 4.28 4.98 p-value (0.340) (0.270) (0.559) Grade 2 Impact 8.63 7.81 3.74 SE 4.43 4.56 5.16 p-value (0.054) (0.089) (0.470)
High RF Funding Grade 1 Impact 13.05* 11.33* 10.88* SE 3.76 4.15 4.49 p-value (0.001) (0.008) (0.0187) Grade 2 Impact 15.40* 14.84* 17.76* SE 3.64 4.28 4.67 p-value (<0.001) (0.001) (<0.001)
Difference Grade 1 Impact -9.05 -6.59 -7.96 SE 5.61 5.96 6.70 p-value (0.108) (0.271) (0.236) Grade 2 Impact -6.77 -7.03 -14.01* SE 5.73 6.25 6.96 p-value (0.239) (0.262) (0.045)
Notes: The complete RF study sample includes 248 schools from 18 sites (17 school districts and 1 state) located in 13 states. 125 schools are Reading First schools and 123 are non-Reading First schools. There are 9 low RF funding sites totaling 124 schools and 9 high RF funding sites totaling 124 schools. Impact estimates are statistically adjusted (e.g., take each school's rating and site-specific funding cut-point into account) to reflect the regression discontinuity design of the study. A two-tailed test of significance was used, and where applicable, statistically significant findings at the p≤.05 level are indicated by *. EXHIBIT READS: The impact of the Reading First program in low Reading First funding sites for grade 1 on the number of minutes of instruction in the five dimensions was 4.00 minutes on average for the full sample of 18 sites. The impact was not statistically significant at the p≤.05 level (p=.340). The impact of the Reading First program in low Reading First funding sites for grade 1 on the number of minutes of instruction in the five dimensions was 4.74 minutes on average for the sample of 16 sites remaining after one pair of sites closest to the cut-point was dropped. The impact was not statistically significant at the p≤.05 level (p=.270). The impact of the Reading First program in low Reading First funding sites for grade 1 on the number of minutes of instruction in the five dimensions was 2.92 minutes on average for the sample of 14 sites remaining after two pairs of sites closest to the cut-point were dropped. The impact was not statistically significant at the p≤.05 level (p=.559).
Sources: RFIS Instructional Practice in Reading Inventory, spring 2005, fall 2005, and spring 2006.

Alternative Moderators of Reading First Impacts H-13
Exhibit H.9: Estimated Impacts on Percentage of Student Engagement with Print, by Reading First Funds Per Student
Percentage of Student Engagement with Print Full Drop 1 Pair Drop 2 Pairs
Low RF Funding Grade 1 Impact 8.42 9.01 -1.49 SE 5.42 5.65 6.26 p-value (0.123) (0.114) (0.813) Grade 2 Impact -8.07 -8.73 -17.32* SE 6.50 6.78 7.21 p-value (0.218) (0.201) (0.019)
High RF Funding Grade 1 Impact 0.78 3.46 3.60 SE 5.11 6.03 6.40 p-value (0.879) (0.568) (0.575) Grade 2 Impact -8.63 -6.96 -6.69 SE 4.46 5.51 5.81 p-value (0.056) (0.211) (0.254)
Difference Grade 1 Impact 7.64 5.55 -5.09 SE 7.45 8.26 8.95 p-value (0.306) (0.502) (0.570) Grade 2 Impact 0.56 -1.77 -10.63 SE 7.88 8.73 9.26 p-value (0.944) (0.839) (0.252)
Notes: The complete RF study sample includes 248 schools from 18 sites (17 school districts and 1 state) located in 13 states. 125 schools are Reading First schools and 123 are non-Reading First schools. There are 9 low RF funding sites totaling 124 schools and 9 high RF funding sites totaling 124 schools. Impact estimates are statistically adjusted (e.g., take each school's rating and site-specific funding cut-point into account) to reflect the regression discontinuity design of the study. A two-tailed test of significance was used, and where applicable, statistically significant findings at the p≤.05 level are indicated by *. EXHIBIT READS: The impact of the Reading First program in low Reading First funding sites for grade 1 on the percentage of student engagement with print was 8.42 percentage points on average for the full sample of 18 sites. The impact was not statistically significant at the p≤.05 level (p=.123). The impact of the Reading First program in low Reading First funding sites for grade 1 on the percentage of student engagement with print was 9.01 percentage points on average for the sample of 16 sites remaining after one pair of sites closest to the cut-point was dropped. The impact was not statistically significant at the p≤.05 level (p=.114). The impact of the Reading First program in low Reading First funding sites for grade 1 on the percentage of student engagement with print was –1.49 percentage points on average for the sample of 14 sites remaining after two pairs of sites closest to the cut-point were dropped. The impact was not statistically significant at the p≤.05 level (p=.813).
Sources: RFIS Student Time-on-Task and Engagement with Print, fall 2005 and spring 2006.

H-14 Alternative Moderators of Reading First Impacts
Exhibit H.10: Change in Impact Associated with One Unit of Change In Continuous Dimensions
Reading Comprehension (SAT 10 scaled
score)
Reading Instruction (min. in 5
Dimensions
Student Engagement with
Print (% of students)
Award Date Grade 1 Impact 0.49 0.57 0.69 SE 0.49 0.50 0.68 p-value (0.318) (0.250) (0.311) Grade 2 Impact 0.56 0.02 0.00 SE 0.40 0.52 0.70 p-value (0.165) (0.964) (0.998) Grade 3 Impact 0.50 N/A N/A SE 0.37 N/A N/A p-value (0.175) N/A N/A Fall 2004 Reading Performance of non-RF Schools
Grade 1 Impact 0.11 0.20 -0.50 SE 0.25 0.26 0.36 p-value (0.670) (0.434) (0.159) Grade 2 Impact -0.29 0.36 0.09 SE 0.21 0.28 0.37 p-value (0.166) (0.188) (0.804) Grade 3 Impact -0.07 N/A N/A SE 0.20 N/A N/A p-value (0.733) N/A N/A Reading First Funding Per Student
Grade 1 Impact 0.03* 0.01 0.02 SE 0.01 0.01 0.01 p-value (0.007) (0.378) (0.207) Grade 2 Impact 0.03* 0.02 0.01 SE 0.01 0.01 0.02 p-value (0.001) (0.078) (0.590) Grade 3 Impact 0.01 N/A N/A SE 0.01 N/A N/A p-value (0.456) N/A N/A
Notes: The complete RF study sample includes 248 schools from 18 sites (17 school districts and 1 state) located in 13 states. 125 schools are Reading First schools and 123 are non-Reading First schools. For grade 2, one non-RF school could not be included in the analysis because test score data were not available. There are 8 late award sites totaling 137 schools and 10 early award sites totaling 111 schools. There are 10 high performance non-RF school sites totaling 120 schools, and 8 low performance non-RF sites totaling 128 schools. There are 9 low RF funding sites totaling 124 schools and 9 high RF funding sites totaling 124 schools. Impact estimates are statistically adjusted (e.g., take each school's rating, site-specific funding cut-point, and other covariates into account) to reflect the regression discontinuity design of the study. A two-tailed test of significance was used, and where applicable, statistically significant findings at the p≤.05 level are indicated by *. EXHIBIT READS: An increase of one month in Reading First award date in grade 1 is associated with an increase of 0.49 scaled score points in reading comprehension, 0.57 minutes of instruction in the five dimensions, and 0.69 percentage points in the percentage of students engaged with print. None of these impacts was statistically significant.
Sources: RFIS SAT 10 administration in the spring of 2005 and 2006, as well as from state/district education agencies in those sites that already use the SAT 10 for their standardized testing (i.e., FL, KS, MD, OR); RFIS Instructional Practice in Reading Inventory, spring 2005, fall 2005, and spring 2006; and RFIS Student Time-on-Task and Engagement with Print, fall 2005 and spring 2006.

Interim Report: References R-1
References
Abt Associates and RMC Research (2002). Classroom Observation Record. Unpublished instrument.
Aladjem, D.K., LeFloch, K.C., Zhang, Z., Kurki. A., Boyle, A., Taylor, J.E., et al. (2006). Models matter—The final report of the National Longitudinal Evaluation of Comprehensive School Reform. Washington DC: American Institutes of Research.
Armbruster, B.B., Lehr, F., and Osborn, J. (2003). Put reading first: The research building blocks for teaching children to read (2nd Ed.). Developed by the Center for the Improvement of Early Reading Achievement (CIERA). Washington, DC: The National Institute for Literacy (NIFL).
Ball, E.W., and Blachman, B.A. (1991). Does phoneme awareness training in kindergarten make a difference in early word recognition and developmental spelling? Reading Research Quarterly, 26, 49–66.
Beck, I.L., Perfetti, C.A., and McKeown, M.G. (1982). Effects of long-term vocabulary instruction on lexical access and reading comprehension. Journal of Educational Psychology, 74, 506-521.
Bloom, H., Kemple, J.K., and Gamse, B.C. (2004). Using regression discontinuity analysis to measure the impacts of Reading First. Paper prepared for the Institute of Education Sciences.
Bloom, H.S. (2001). Measuring the impacts of whole-school reforms: Methodological lessons from an evaluation of accelerated schools. New York: MDRC.
Bloom, H.S. (1995). “Minimum Detectable Effects: A Simple Way to Report the Statistical Power of Experimental Designs,” Evaluation Review, Vol. 19, No. 5, pp. 547–556.
Borman, G.D., Hewes, G.M., Overman, L.T., and Brown, S. (2003). Comprehensive school reform and achievement: A meta-analysis. Review of Educational Research, 73(2), 125–230.
Brennan, R.L. (2001). Generalizability theory. New York, NY: Springer-Verlag.
Brett, A., Rothlein, L., and Hurley, M. (1996). Vocabulary acquisition from listening to stories and explanations of target words. Elementary School Journal, 96, 415–422.
Bus, A.G., and van Ijzendoorn, M.H. (1999). Phonological awareness and early reading: A meta-analysis of experimental training studies. Journal of Educational Psychology, 91, 403–414.
Cain, G. (1975). Regression and Selection Models to Improve Nonexperimental Comparisons. In C. A. Bennet and A.A. Lumsdaine (Eds.), Evaluation and Experiment (pp.297-317). New York: Academic Press. 297-317.
Cappelleri, J.C.; Trochim, W.M.K.; Stanley, T.D.; Reichardt, C.S. Random measurement error does not bias the treatment effect estimate in the regression-discontinuity design: I. The case of no interaction. Evaluation Review 1991; 15:395-419.
Carlisle, J., and Scott, S. (2003). Teachers’ Instructional Practice. Unpublished instrument.

R-2 Interim Report: References
Crowe, L.K. (2005). Comparison of two oral reading feedback strategies in improving reading comprehension of school-age children with low reading ability. Remedial and Special Education, 26, 32–42.
CTB/McGraw-Hill. (2003). Terranova second edition: California Achievement Tests technical report. Monterey, CA: Author.
Cullen, J., Jacob, B. and Levitt, S. (2006). The Effect of School Choice on Student Outcomes: Evidence from Randomized Lotteries. Econometrica. 74(5): 1191-1230.
Dixon, L.Q., Smith, W.C., Dwyer, M.C., Peabody, B.K., and Gamse, B.C. (2007, April). Training
observers to use the Instructional Practice in Reading Inventory. Paper presented at the Annual Meeting of the American Educational Research Association, Chicago, IL
Dole, E., Nelson, D., Fox, D., and Gardner, J. (2001). Utah's Profile of Scientifically-Based Reading Instruction. Salt Lake City, Utah: The Institute for Behavioral Research in Creativity.
Dwyer, M.C., Smith, W.C., Dixon, L.Q., and Gamse, B.C. (2007, April). The development of the Instructional Practice in Reading Inventory. Paper presented at the Annual Meeting of the American Educational Research Association, Chicago, IL.
Edmonds, M.S., and Briggs, K.L. (2003). The instructional content emphasis instrument: Observations of reading instruction. In S. Vaughn and K. L. Briggs (Eds.), Reading in the classroom: Systems for the observation of teaching and learning (pp. 31–52). Baltimore: Paul Brookes.
Foorman, B.R., and Torgesen, J. (2001). Critical Elements of classroom and small-group instruction promote reading success in all children. Learning Disabilities Research & Practice, 16(4), 203–212.
Foorman, B.R., Francis, D.J., Fletcher, J.M., Schatschneider, C., and Mehta, P. (1998). The role of instruction in learning to read: Preventing reading failure in at-risk children. Journal of Educational Psychology, 90(1), 3–55.
Foorman, B. and Schatschneider, C. (2003). Measuring teaching practice during reading/language arts instruction and its relation to student achievement. In S. R. Vaughn and K. L. Briggs (Eds.), Reading in the classroom: Systems for observing teaching and learning. Baltimore: Paul Brookes.
Gamse, B.C., Bloom, H., Celebuski, C., Dwyer, M.C., Gersten, R., Leos-Urbel, J., et al. (2004). Reading First Impact Study: Revised study design. Cambridge, MA: Abt Associates Inc.
Gelman, A. and Stern, H. (2006). The difference between “Significant” and “Not Significant” is not itself statistically significant. The American Statistician, 60(4), 328—331.
Goldberger, A.S. (1972). Selection Bias in Evaluating Treatment Effects: Some Formal Illustrations. Institute for Research on Poverty: Madison, WI, Discussion Paper 123.
Goodson, B., Layzer, J., Smith, C., and Rimdzius, T. (2004). Observation Measure of Language and Literacy Instruction (OMLIT). Developed as part of the Even Start Classroom Literacy

Interim Report: References R-3
Interventions and Outcomes (CLIO) Study, under contract ED-01-CO-0120 as administered by the Institute of Education Sciences, U.S. Department of Education.
Graves, A.W., Gerston, R., and Haager, D. (2004). Literacy instruction in multiple-language first-grade classrooms: Linking student outcomes to observed instructional practice. Learning Disabilities Research & Practice, 19(4), 262–272.
Gunn, B., Smolkowski, K., Biglan, A., and Black, C. (2002). Supplemental instruction in decoding skills for Hispanic and non-Hispanic students in early elementary school: A follow-up study. Journal of Special Education, 36(2), 69–79.
Haager, D., Gersten, R., Baker, S., and Graves, A. (2003). The English-Language Learner Classroom Observation Instrument: Observations of beginning reading instruction in urban schools. In S. R. Vaughn and K. L. Briggs (Eds.), Reading in the Classroom: Systems for Observing Teaching and Learning. Baltimore: Paul Brookes.
Hahn, H., Todd, P., and van der Klaauw, W. (2001). Identification and estimation of treatment effects with a regression-discontinuity design. Econometrica, 69(3), 201–209.
Harcourt Assessment, Inc. (2003). Fall Multilevel Norms Books. United States of American: Harcourt Assessment, Inc., 24-26, B-1-C-22.
Harcourt Assessment, Inc. (2004). Stanford Achievement Test series, Tenth Edition technical data report. San Antonio, TX: Author.
Hatcher, P.J., Hulme, C., and Snowling, M.J. (2004). Explicit phoneme training combined with phonic reading instruction helps young children at risk of reading failure. Journal of Child Psychology and Psychiatry, 45, 338–358.
Hedges, L.V., and Olkin, I. (1985). Statistical methods for meta-analysis. San Diego, CA: Academic Press.
Hoover, H.D., Dunbar, S. B., Frisbie, D. A., Oberley, K. R., Ordman, V. L., Naylor, R. J., Lewis. J.C., Qualls, A, L., Mengeling, M.A., and Shannon, G.P. (2003). The Iowa Tests guide to research and development, Forms A and B. Riverside Publishing, Itasca, IL.
Kamil, M.L. (2004). Vocabulary and comprehension instruction: Summary and implications of national reading panel findings. In P. McCardle and V. Chhabra (Eds.), The voice of evidence in reading research. Baltimore: Paul Brookes.
Kling, J.R., Liebman, J.B., and Katz, L.F. (2007). Experimental analysis of neighborhood effects. Econometrica, 75(1), 83–119.
Logan, A.C. and Tamhane, B. (2002). Accurate critical constants for the one-sided approximate likelihood ratio test of a normal mean vector when the covariance matrix is estimated. Biometrics, 58(3), 650–656.
MacGinitie, W. H., MacGinitie, R. K., Maria, K., and Dreyer, L. G. (2000). Gates-MacGinitie Reading Tests–Manual for scoring and interpretation. Itasca, IL: Riverside.

R-4 Interim Report: References
Mason, L.H. (2004). Explicit self-regulated strategy development versus reciprocal questioning: Effects on expository reading comprehension among struggling readers. Journal of Educational Psychology, 96, 283–296.
Mather, N., Hammill, D.D., Allen, E.A., and Roberts, R. (2004). Test of Silent Word Reading Fluency: Examiner's Manual. Austin, TX: PRO-ED, Inc.
McCutchen, D., Abbott, R.D., Green, L.B., Beretvas, S.N., Cox, S., Potter, N.S., et al. (2002). Beginning literacy: Links among teacher knowledge, teacher practice, and student learning. Journal of Learning Disabilities, 35, 69–86.
McKeown, M.G., Beck, I.L., and Omanson, R.C. (1985). Some effects of the nature and frequency of vocabulary instruction on the knowledge and use of words. Reading Research Quarterly, 20, 522–535.
McKeown, M.G., Beck, I.L., and Omanson, R.C., and Perfetti, C.A. (1983). The effects of long-term vocabulary instruction on reading comprehension: A replication. Journal of Reading Behavior, 15, 3-18.
Michigan Department of Education (2002). Making Reading First in Michigan. Retrieved April 20, 2007 from http://mireadingfirst.org/downloads/mdegrant.pdf. Lansing: Michigan Department of Education.
Mohr, L.B. (1995). Impact Analysis for Program Evaluation. Second Edition. Thousand Oaks, CA: Sage Publications.
National Institute of Child Health and Human Development. (2000). Report of the National Reading Panel. Teaching children to read: An evidence-based assessment of the scientific research literature on reading and its implications for reading instruction (NIH Publication No 00-4769 and 00-4754). Washington, DC: U.S. Government Printing Office.
No Child Left Behind Act of 2001, ESEA, 2001, Title 1, Part B, Subpart 1, Section 1202(c)(7)(A)(IV)(2).
O’Brien, P.C. (1984). Procedures for comparing samples with multiple endpoints. Biometrics, 40(4), 1079–1087.
O’Connor, R.E., Bell, K.M., Harty, K.R., Larkin, L.K., Sackor, S.M., and Zigmond, N. (2002). Teaching reading to poor readers in the intermediate grades: A comparison of text difficulty. Journal of Educational Psychology, 94, 474–485.
Rasinski, T. and Oswald, R. (2005). Making and writing words: Constructivist word learning in a second-grade classroom. Reading & Writing Quarterly, 21, 151–163.
Reading First: Awards. (2004). U.S. Department of Education. Retrieved from http://www.ed.gov/ programs/readingfirst/awards.html.
Reichardt, C.S., Trochim, W.M.K., and Cappelleri, J.C. (1995). Reports of the death of regression-discontinuity analysis are greatly exaggerated. Evaluation Review, 19:39-63.

Interim Report: References R-5
Reutzel, D.R. and Hollingsworth, P.M. (1993). Effects of fluency training on second graders’ reading comprehension. Journal of Educational Research, 86, 325-331.
Reutzel, D.R. and Hollingsworth, P.M. (1991). Using literature webbing for books with predictable narrative: Improving young readers' prediction, comprehension, and story structure knowledge. Reading Psychology, 12(4), 319–333.
Rosenshine, B., Meister, C., and Chapman, S. (1996). Teaching students to generate questions: A review of the intervention strategies. Review of Educational Research, 66(2), 181–221.
Shadish, W.R., Cook, T.D., and Campbell, D.T. (2002). Experimental and quasi-experimental designs for generalized causal inference. Boston: Houghton Mifflin.
Shaffer, J.P. (1995). Multiple hypothesis testing. Annual Review of Psychology, 46, 561-84.
Snow, C.E., Burns, M.S., and Griffin, P. (Eds.) (1998). Preventing reading difficulties in young children (Report of the Committee on the Prevention of Reading Difficulties in Young Children, National Research Council). Washington, DC: National Academies Press.
Southwest Educational Development Laboratory. Summary Report: Awards. Retrieved April 20, 2007 from http://www.sedl.org/readingfirst/report-awards.html.
Stahl, S.A. (2004). What do we know about fluency? Findings of the National Reading Panel. In P. McCardle and V. Chhabra (Eds.), The Voice of Evidence in Reading Research (pp. 187–210). Baltimore: Paul Brookes.
Suen, H.K., and Ary, D. (1989). Reliability: Conventional methods. In H. K. Suen and D. Ary (Eds.), Analyzing Quantitative behavioral observation data (pp. 99–129). Hillsdale, NJ: Lawrence Erlbaum.
Taylor, B.B., Pearson, D.P., Clark, K.F., and Walpole, S. (1999). Beating the odds in teaching all children to read (CIERA Report #2-006). Ann Arbor, MI: Center for the Improvement of Early Literacy Achievement.
Taylor, L.K., Alber, S.R., and Walker, D.W. (2002). The comparative effects of a modified self-questioning strategy and story mapping on the reading comprehension of elementary students with learning disabilities. Journal of Behavioral Education, 11(2), 69–87.
Therrien, W.J. (2004). Fluency and comprehension gains as a result of repeated reading: A meta-analysis. Remedial and Special Education, 25, 252–261.
Thistlethwaite, D.L. and Campbell, D. T. (1960). Regression discontinuity analysis: An alternative to the ex post facto experiment. Journal of Educational Psychology, 51(6): 309–317.
Tomesen, M. and Aarnoutse, C. (1998). Effects of an instructional program for deriving word meanings. Educational Studies, 24, 107–128.
Torgesen, J.K., Wagner, R.K., Rashotte, C.A., Rose, E., Lindamood, P., Conway, T., et al. (1999). Preventing reading failure in young children with phonological processing disabilities: Group and individual responses to instruction. Journal of Educational Psychology, 91, 579–593.

R-6 Interim Report: References
U.S. Department of Education, Office of Elementary and Secondary Education. (2002). Guidance for the Reading First Program. Washington, DC.
Vaughn, S. and Briggs, K.L. (2003). Reading in the classroom: System for the observation of teaching and learning. Baltimore: Brookes Publishing.
Williams, K.T. (2001). Group Reading Assessment and Diagnostic Evaluation: Technical Manual. Circle Pines, MN: American Guidance Service, Inc.
Wisconsin Department of Education (2003). State of Wisconsin Reading First grant proposal: Title I, Part B, Subpart 1. Lansing: Wisconsin Department of Education. Retrieved April 20, 2007 from http://dpi.state.wi.us/titleone/pdf/rdgfrst_grant.pdf.