the namibia labour force survey 2012 report - my · the namibia labour force survey 2012 report. 2...
TRANSCRIPT

NAMIBIA LABOUR FORCE SURVEY 2012 1
The Namibia Labour Force Survey 2012Report

NAMIBIA LABOUR FORCE SURVEY 20122
NAMIBIA LABOUR FORCE SURVEY 2012 i
NAMIBIA LABOUR FORCE SURVEY (NLFS)
2012 REPORT
Published by the Namibia Statistics Agency P.O. Box 2133 Windhoek, www.nsa.org.na
Published: April 2013
Inquiries: +264 61-431-3200
Suggested citation: Namibia Statistics Agency, 2013. Namibia Labour Force Survey 2012 Report. Namibia Statistics Agency, Windhoek.
Namibia Statistics Agency (NSA)April 2013

NAMIBIA LABOUR FORCE SURVEY 2012ii

NAMIBIA LABOUR FORCE SURVEY 2012 iii
MISSION STATEMENT“In a coordinated manner produce and disseminate relevant, quality and timely
statistics that are fit-for-purpose in accordance with international standards and best practice”
VISION STATEMENT“Be a high performance institution in statistics delivery”
CORE VALUESPerformance
Integrity
Service focus
Transparency
Accuracy
Partnership
NAMIBIA LABOUR FORCE SURVEY 2012iv
After independence in 1990, Namibia conducted the first Labour Force Survey in 1997 and thereafter roughly every four years, the last one in 2008. In 2012, the Namibia Statistics Agency (NSA) conducted the fifth Labour Force Survey. This report provides the key findings from the 2012 National Labour Force Survey (NLFS).
For economic and social planning reasons, a clear knowledge and understanding of the size, composition and other characteristics of the labour force is indispensable to national, as well as regional planning. The 2012 Labour Force Survey also presents a major step towards the systematic production of labour force information for meeting the realization of Vision 2030. In addition, timely collection and release of labour force statistics are a priority for Namibia in order to monitor and assess the impact of all policies Government has implemented that affect the labour market.
To ensure high quality data, plans for sample design were developed and extensively analyzed to ensure that the data collected are representative at the national level, as well as for urban and rural areas. Questionnaires were prepared based on the inputs provided by national and international stakeholders that allowed the identification of a number of central topics for inclusion in the survey. Overall, the NLFS 2012 followed the best international practices in terms of design and methods, concepts and classifications.
This report presents key statistics derived from the NLFS. The report presents only the tip of the iceberg of the information that can be derived from the NLFS. The NSA itself plans to conduct further analysis of various aspects of the entire data set. Moreover the NSA will also be making available anonymised micro-level data via its website at http://www.nsa.org.na to enable other agencies and individuals to conduct further analysis of the data. In this way, the country will derive full benefit from the resources that were allocated to conduct the survey.
In conclusion, I would like to address my sincere thanks to the experts from the Statistics South Africa, the International Labour Organisation and the World Bank for their technical inputs. A word of appreciation goes also to the staff of the Ministry of Labour and Social Welfare and the National Statistical System in general and in particular to the sample households for their understanding and co-operation during the data collection.
DR. JOHN STEYTLERSTATISTICIAN GENERAL Windhoek, April 2013
PREFACE
NAMIBIA LABOUR FORCE SURVEY 2012 v
LIST OF ACRONYMS
CI Confidence intervalsCV Coefficient of variationEA Enumeration areaGIS Geographical Information SystemGPS Geographical Positioning SystemILO International Labour OrganisationLFPR Labour force participation rateMoLSW Ministry of Labour and Social WelfareNAD Namibia dollarNLFS Namibia Labour Force SurveyNSA Namibia Statistics AgencyPSU Primary sampling unitRSE Relative standard errorSE Standard error

NAMIBIA LABOUR FORCE SURVEY 2012vi
BASIC CONCEPTS
Total population: All persons living in Namibia during the reference period.
Economically inactive population: All persons below the age of 15 years of age. In addition, all persons over 15 years of age who are not available for work since they are full-time learners or students, homemakers (people involved only in unpaid household duties), ill, disabled or on early retirement.
Economically active population: All persons within the working age group of 15 years of age and above with the exception of the persons defined above as economically inactive.
Labour force: All persons who constitute the working age group population aged 15 years and above and are economically active. The labour force consists of both employed and unemployed persons.
Labour force participation rate (also referred to as the economic activity rate): The labour force participation rate is the proportion of the economically active population in a given population group, i.e. the number of persons in the labour force given as a percentage of the working age population in that population group.
Employed: All persons within the economically active population or working age group who have worked for at least one hour over the reference period for pay (remuneration), profit or family gain.
Employment rate: The proportion of the working age population that is employed. This indicator tends to be more stable than both the LFPR and unemployment rate. It is therefore seen as a useful indicator of long-term conditions in the labour market.
Unemployed in the strict sense: All persons within the economically active population or working age group who meet the following three criteria:
• being without work• being available for work• actively seeking work.
Unemployed in the broad sense: All persons within the economically active population or working age group who meet the following two criteria, irrespective of whether or not they are actively seeking work:
• being without work• being available for work.
NAMIBIA LABOUR FORCE SURVEY 2012 vii
Unemployment rate: Unemployed persons (either in the strict or broad sense) expressed as a percentage of the total number of persons in the labour force.A private household is defined as one or more persons, related or unrelated, who live together in one (or part of one) or more than one dwelling unit and have common catering arrangements. A person who lives alone and caters for himself/herself forms a one-person household.
Age was defined as the number of completed years lived by the respondent, i.e. age at last birthday.
Child dependency ratio is the number of children aged 0 - 14 years divided by the population aged 15 – 64 years, expressed as a percentage.
Aged dependency ratio is the number of persons aged 65 and older divided by the population aged 15 – 64 years, expressed as a percentage.
Overall dependency ratio is the sum of the child dependency ratio and the aged dependency ratio.Sex ratio is the number of males per 100 females.
Educational attainment is defined as the highest standard, grade or years completed. In the NLFS 2012 the educational attainment includes those persons who have completed part or the whole level of education. For instance, primary education includes persons who have completed the last grade or achieved some grades of primary education.
NAMIBIA LABOUR FORCE SURVEY 2012viii
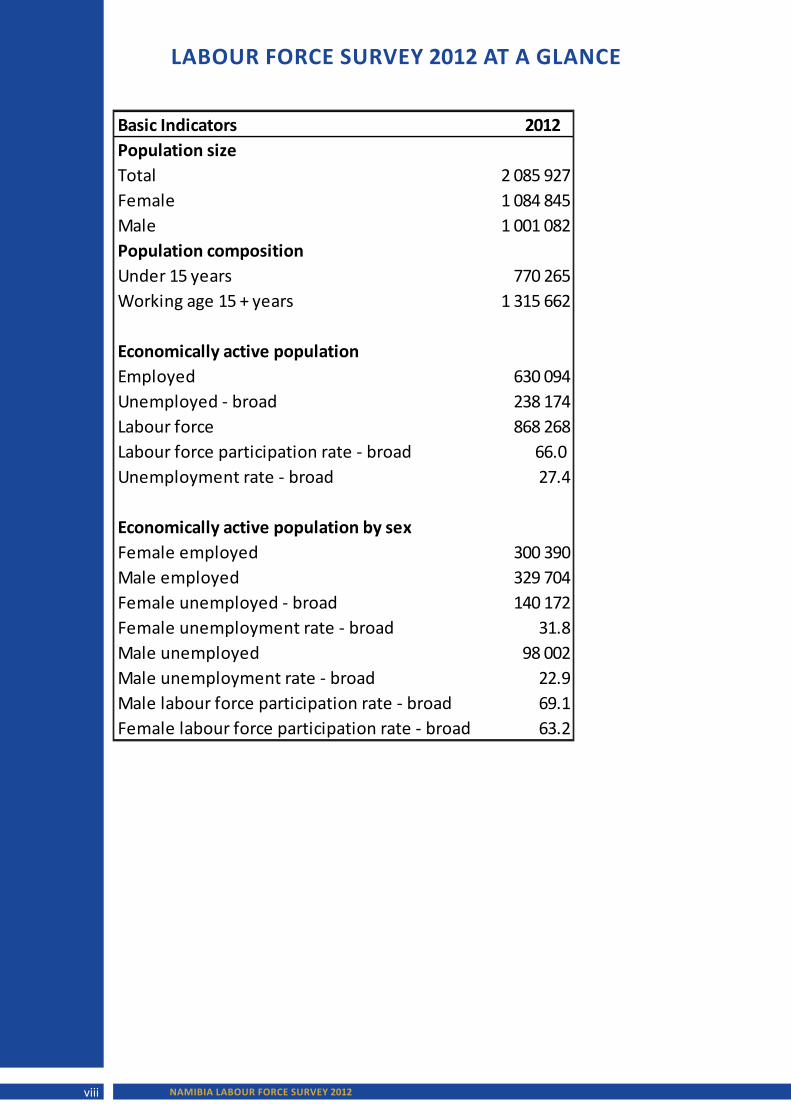
Basic Indicators 2012 Population sizeTotal 2 085 927Female 1 084 845Male 1 001 082Population compositionUnder 15 years 770 265Working age 15 + years 1 315 662
Economically active population Employed 630 094Unemployed - broad 238 174Labour force 868 268Labour force participation rate - broad 66.0
Unemployment rate - broad 27.4
Economically active population by sexFemale employed 300 390Male employed 329 704Female unemployed - broad 140 172Female unemployment rate - broad 31.8Male unemployed 98 002Male unemployment rate - broad 22.9Male labour force participation rate - broad 69.1Female labour force participation rate - broad 63.2
LABOUR FORCE SURVEY 2012 AT A GLANCE
NAMIBIA LABOUR FORCE SURVEY 2012 ix
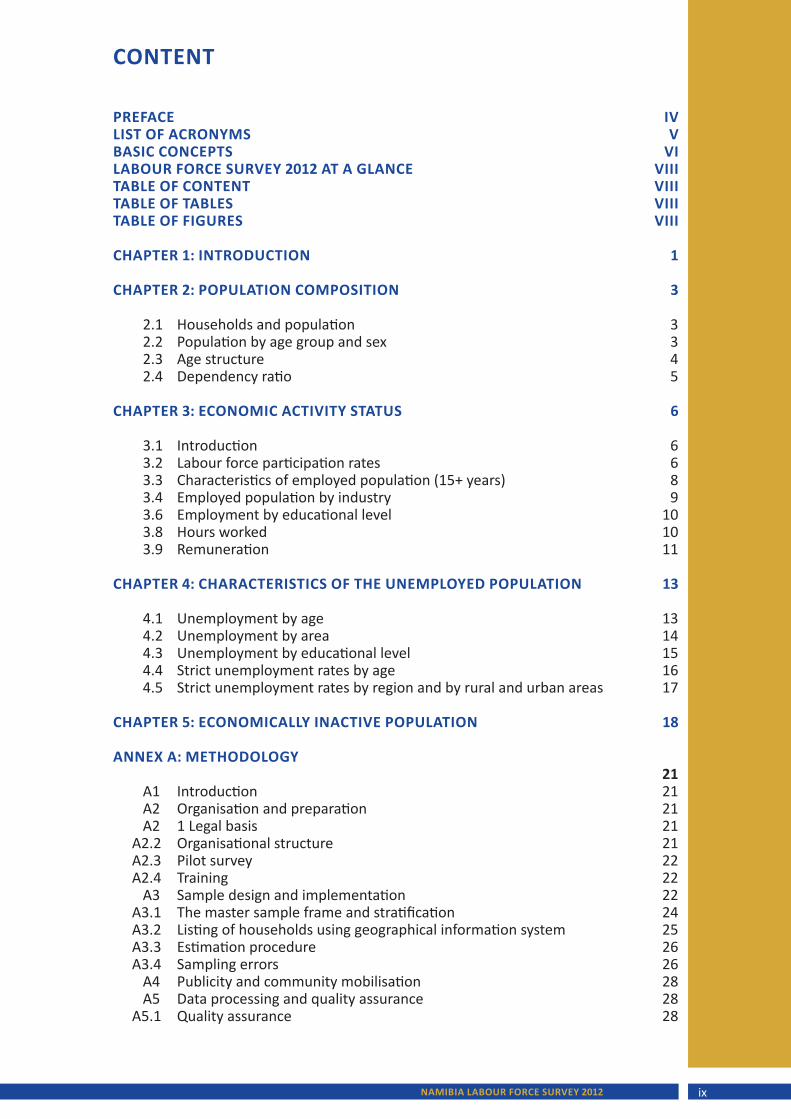
CONTENT
PREFACE IVLIST OF ACRONYMS VBASIC CONCEPTS VILABOUR FORCE SURVEY 2012 AT A GLANCE VIIITABLE OF CONTENT VIIITABLE OF TABLES VIIITABLE OF FIGURES VIII
CHAPTER 1: INTRODUCTION 1
CHAPTER 2: POPULATION COMPOSITION 3
2.1 Households and population 3 2.2 Population by age group and sex 3 2.3 Age structure 4 2.4 Dependency ratio 5
CHAPTER 3: ECONOMIC ACTIVITY STATUS 6
3.1 Introduction 6 3.2 Labour force participation rates 6 3.3 Characteristics of employed population (15+ years) 8 3.4 Employed population by industry 9 3.6 Employment by educational level 10 3.8 Hours worked 10 3.9 Remuneration 11
CHAPTER 4: CHARACTERISTICS OF THE UNEMPLOYED POPULATION 13
4.1 Unemployment by age 13 4.2 Unemployment by area 14 4.3 Unemployment by educational level 15 4.4 Strict unemployment rates by age 16 4.5 Strict unemployment rates by region and by rural and urban areas 17
CHAPTER 5: ECONOMICALLY INACTIVE POPULATION 18
ANNEX A: METHODOLOGY 21
A1 Introduction 21 A2 Organisation and preparation 21 A2 1 Legal basis 21A2.2 Organisational structure 21A2.3 Pilot survey 22A2.4 Training 22 A3 Sample design and implementation 22A3.1 The master sample frame and stratification 24A3.2 Listing of households using geographical information system 25A3.3 Estimation procedure 26A3.4 Sampling errors 26 A4 Publicity and community mobilisation 28 A5 Data processing and quality assurance 28A5.1 Quality assurance 28
NAMIBIA LABOUR FORCE SURVEY 2012x
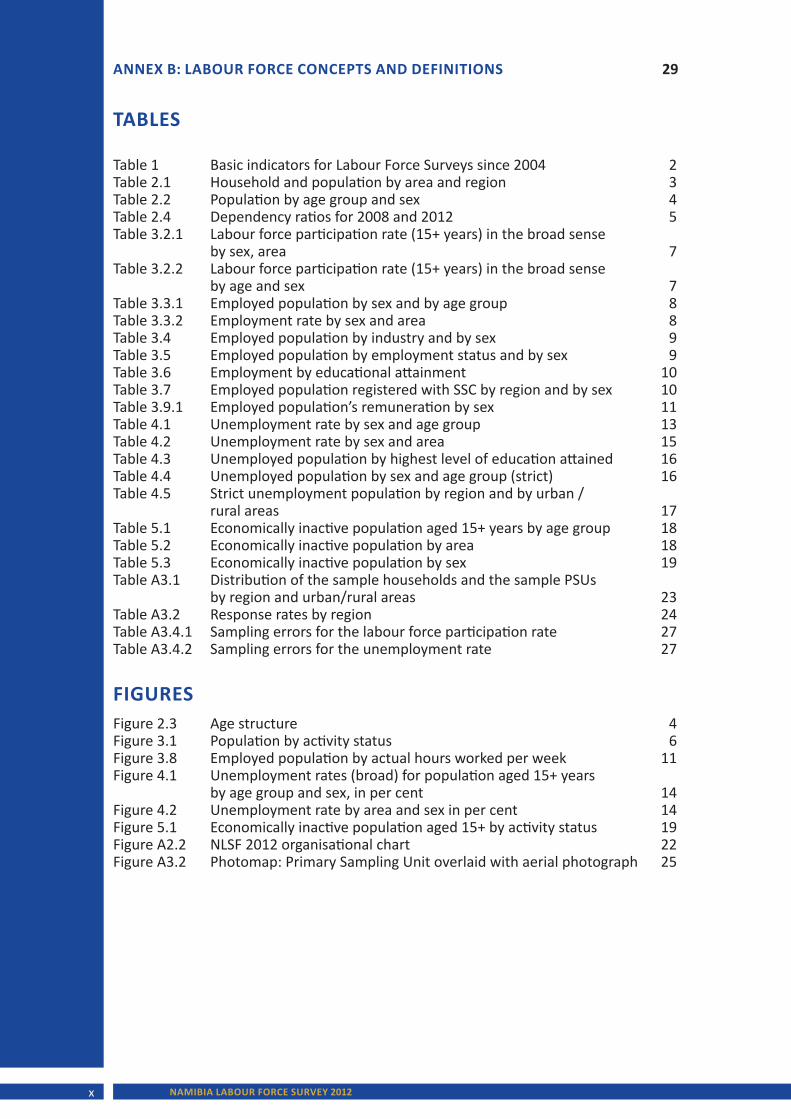
Table 1 Basic indicators for Labour Force Surveys since 2004 2Table 2.1 Household and population by area and region 3Table 2.2 Population by age group and sex 4Table 2.4 Dependency ratios for 2008 and 2012 5Table 3.2.1 Labour force participation rate (15+ years) in the broad sense by sex, area 7Table 3.2.2 Labour force participation rate (15+ years) in the broad sense by age and sex 7Table 3.3.1 Employed population by sex and by age group 8Table 3.3.2 Employment rate by sex and area 8Table 3.4 Employed population by industry and by sex 9Table 3.5 Employed population by employment status and by sex 9Table 3.6 Employment by educational attainment 10Table 3.7 Employed population registered with SSC by region and by sex 10Table 3.9.1 Employed population’s remuneration by sex 11Table 4.1 Unemployment rate by sex and age group 13Table 4.2 Unemployment rate by sex and area 15Table 4.3 Unemployed population by highest level of education attained 16Table 4.4 Unemployed population by sex and age group (strict) 16Table 4.5 Strict unemployment population by region and by urban / rural areas 17Table 5.1 Economically inactive population aged 15+ years by age group 18Table 5.2 Economically inactive population by area 18Table 5.3 Economically inactive population by sex 19Table A3.1 Distribution of the sample households and the sample PSUs by region and urban/rural areas 23Table A3.2 Response rates by region 24Table A3.4.1 Sampling errors for the labour force participation rate 27Table A3.4.2 Sampling errors for the unemployment rate 27
ANNEX B: LABOUR FORCE CONCEPTS AND DEFINITIONS 29
TABLES
Figure 2.3 Age structure 4Figure 3.1 Population by activity status 6Figure 3.8 Employed population by actual hours worked per week 11Figure 4.1 Unemployment rates (broad) for population aged 15+ years by age group and sex, in per cent 14Figure 4.2 Unemployment rate by area and sex in per cent 14Figure 5.1 Economically inactive population aged 15+ by activity status 19Figure A2.2 NLSF 2012 organisational chart 22Figure A3.2 Photomap: Primary Sampling Unit overlaid with aerial photograph 25
FIGURES
NAMIBIA LABOUR FORCE SURVEY 2012 1
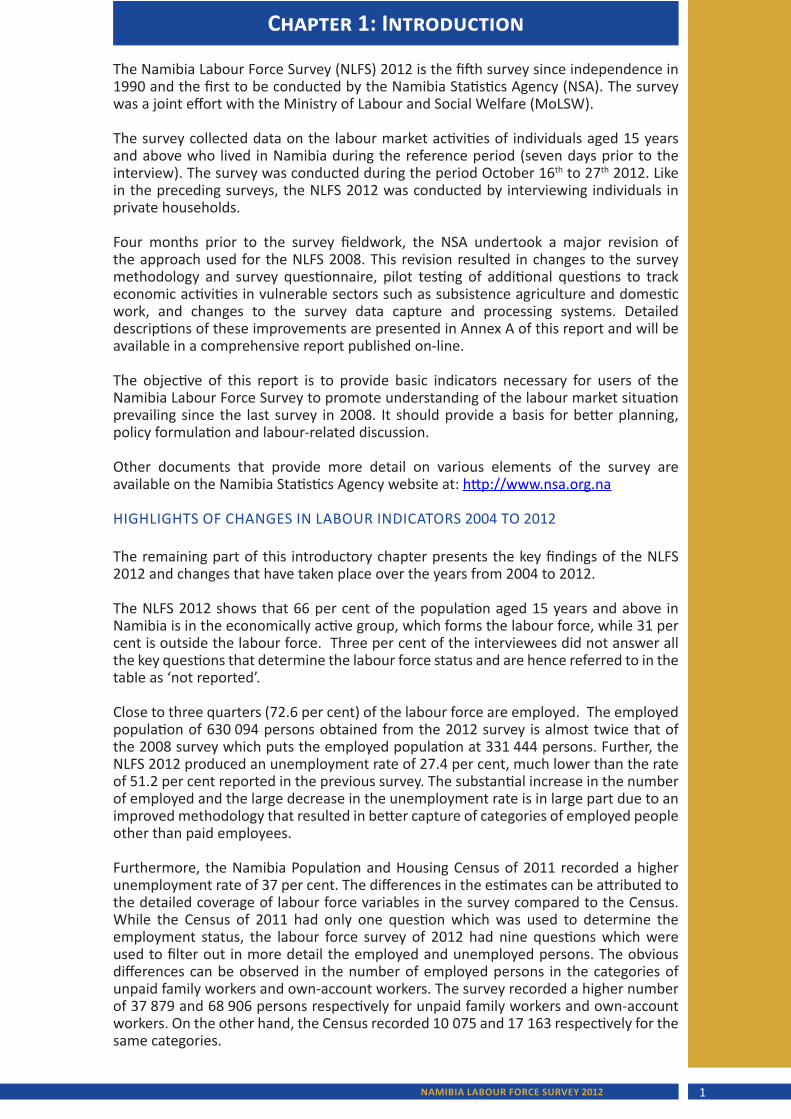
Chapter 1: Introduction
The Namibia Labour Force Survey (NLFS) 2012 is the fifth survey since independence in 1990 and the first to be conducted by the Namibia Statistics Agency (NSA). The survey was a joint effort with the Ministry of Labour and Social Welfare (MoLSW).
The survey collected data on the labour market activities of individuals aged 15 years and above who lived in Namibia during the reference period (seven days prior to the interview). The survey was conducted during the period October 16th to 27th 2012. Like in the preceding surveys, the NLFS 2012 was conducted by interviewing individuals in private households.
Four months prior to the survey fieldwork, the NSA undertook a major revision of the approach used for the NLFS 2008. This revision resulted in changes to the survey methodology and survey questionnaire, pilot testing of additional questions to track economic activities in vulnerable sectors such as subsistence agriculture and domestic work, and changes to the survey data capture and processing systems. Detailed descriptions of these improvements are presented in Annex A of this report and will be available in a comprehensive report published on-line.
The objective of this report is to provide basic indicators necessary for users of the Namibia Labour Force Survey to promote understanding of the labour market situation prevailing since the last survey in 2008. It should provide a basis for better planning, policy formulation and labour-related discussion.
Other documents that provide more detail on various elements of the survey are available on the Namibia Statistics Agency website at: http://www.nsa.org.na
HIGHLIGHTS OF CHANGES IN LABOUR INDICATORS 2004 TO 2012
The remaining part of this introductory chapter presents the key findings of the NLFS 2012 and changes that have taken place over the years from 2004 to 2012.
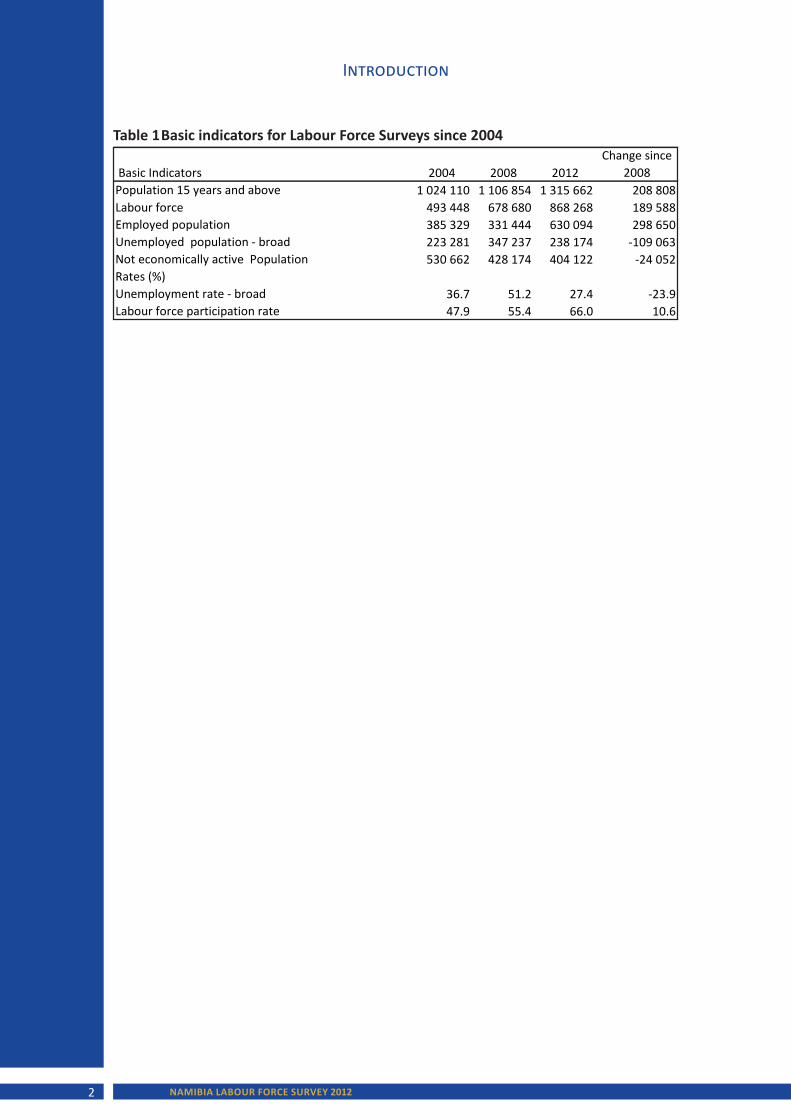
The NLFS 2012 shows that 66 per cent of the population aged 15 years and above in Namibia is in the economically active group, which forms the labour force, while 31 per cent is outside the labour force. Three per cent of the interviewees did not answer all the key questions that determine the labour force status and are hence referred to in the table as ‘not reported’.
Close to three quarters (72.6 per cent) of the labour force are employed. The employed population of 630 094 persons obtained from the 2012 survey is almost twice that of the 2008 survey which puts the employed population at 331 444 persons. Further, the NLFS 2012 produced an unemployment rate of 27.4 per cent, much lower than the rate of 51.2 per cent reported in the previous survey. The substantial increase in the number of employed and the large decrease in the unemployment rate is in large part due to an improved methodology that resulted in better capture of categories of employed people other than paid employees.
Furthermore, the Namibia Population and Housing Census of 2011 recorded a higher unemployment rate of 37 per cent. The differences in the estimates can be attributed to the detailed coverage of labour force variables in the survey compared to the Census. While the Census of 2011 had only one question which was used to determine the employment status, the labour force survey of 2012 had nine questions which were used to filter out in more detail the employed and unemployed persons. The obvious differences can be observed in the number of employed persons in the categories of unpaid family workers and own-account workers. The survey recorded a higher number of 37 879 and 68 906 persons respectively for unpaid family workers and own-account workers. On the other hand, the Census recorded 10 075 and 17 163 respectively for the same categories.
NAMIBIA LABOUR FORCE SURVEY 20122
Introduction
1
Table 1 Basic indicators for Labour Force Surveys since 2004
Basic Indicators 2004 2008 2012Change since
2008Population 15 years and above 1 024 110 1 106 854 1 315 662 208 808Labour force 493 448 678 680 868 268 189 588Employed population 385 329 331 444 630 094 298 650Unemployed population - broad 223 281 347 237 238 174 -109 063Not economically active Population 530 662 428 174 404 122 -24 052Rates (%)Unemployment rate - broad 36.7 51.2 27.4 -23.9Labour force participation rate 47.9 55.4 66.0 10.6
Table 1 Basic indicators for Labour Force Surveys since 2004
NAMIBIA LABOUR FORCE SURVEY 2012 3
chapter 2: POPULATION COMPOSITION
This chapter provides information on demographic characteristics of the population such as age, sex, marital status and citizenship that was collected during the 2012 NLFS. These variables are used to describe the demographic profile of the Namibian households and population.
2.1 Households and population
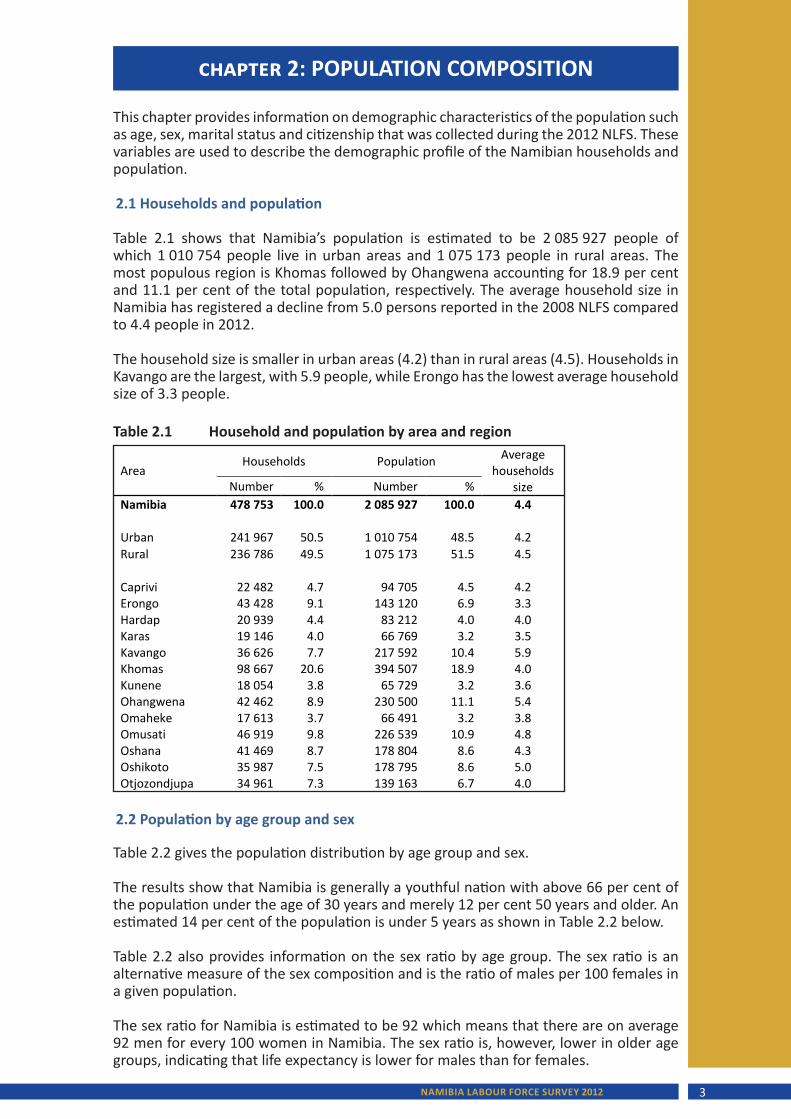
Table 2.1 shows that Namibia’s population is estimated to be 2 085 927 people of which 1 010 754 people live in urban areas and 1 075 173 people in rural areas. The most populous region is Khomas followed by Ohangwena accounting for 18.9 per cent and 11.1 per cent of the total population, respectively. The average household size in Namibia has registered a decline from 5.0 persons reported in the 2008 NLFS compared to 4.4 people in 2012.
The household size is smaller in urban areas (4.2) than in rural areas (4.5). Households in Kavango are the largest, with 5.9 people, while Erongo has the lowest average household size of 3.3 people.
2.2 Population by age group and sex
Table 2.2 gives the population distribution by age group and sex.
The results show that Namibia is generally a youthful nation with above 66 per cent of the population under the age of 30 years and merely 12 per cent 50 years and older. An estimated 14 per cent of the population is under 5 years as shown in Table 2.2 below.
Table 2.2 also provides information on the sex ratio by age group. The sex ratio is an alternative measure of the sex composition and is the ratio of males per 100 females in a given population.
The sex ratio for Namibia is estimated to be 92 which means that there are on average 92 men for every 100 women in Namibia. The sex ratio is, however, lower in older age groups, indicating that life expectancy is lower for males than for females.
2
Table 2.1 Household and population by area and region
Area Households Population Average
households size Number % Number %
Namibia 478 753 100.0 2 085 927 100.0 4.4
Urban 241 967 50.5 1 010 754 48.5 4.2 Rural 236 786 49.5 1 075 173 51.5 4.5
Caprivi 22 482 4.7 94 705 4.5 4.2 Erongo 43 428 9.1 143 120 6.9 3.3 Hardap 20 939 4.4 83 212 4.0 4.0 Karas 19 146 4.0 66 769 3.2 3.5 Kavango 36 626 7.7 217 592 10.4 5.9 Khomas 98 667 20.6 394 507 18.9 4.0 Kunene 18 054 3.8 65 729 3.2 3.6 Ohangwena 42 462 8.9 230 500 11.1 5.4 Omaheke 17 613 3.7 66 491 3.2 3.8 Omusati 46 919 9.8 226 539 10.9 4.8 Oshana 41 469 8.7 178 804 8.6 4.3 Oshikoto 35 987 7.5 178 795 8.6 5.0 Otjozondjupa 34 961 7.3 139 163 6.7 4.0
Table 2.1 Household and population by area and region

NAMIBIA LABOUR FORCE SURVEY 20124
2.3 Age structure
Age is an important factor in demographic and labour force analysis as the school-going population and labour force are concentrated in specific age groups. The age distribution of the population by broad age groups and sex is presented in Figure 2.3. The figure reveals that age groups 0-4, 5-9, 10-14 and 15-19 record the highest percentages, showing that Namibia has a youthful population in the broad base of young people below a very narrow apex made up of the small proportion of elderly people aged 60 years and older. This shape is a typical reflection of populations having high fertility and high mortality rates. Further, the pyramid shows that the share of females is larger than that of males in all age groups, and that the gender imbalance is especially stark in the oldest age groups. This again indicates the greater average longevity of women.
3
Table 2.2 Population by age group and sex
Age group Female Male Both sexes
Sex ratio Number % Number % Number %
00 - 04 142 522 13.1 141 522 14.1 284 044 13.6 99 05 - 09 121 520 11.2 119 055 11.9 240 574 11.5 98 10 - 14 123 748 11.4 121 898 12.2 245 646 11.8 99 15 - 19 118 468 10.9 115 449 11.5 233 917 11.2 98 20 - 24 105 848 9.8 100 383 10.0 206 231 9.9 95 25 - 29 88 552 8.2 81 737 8.2 170 289 8.2 92 30 - 34 74 312 6.9 69 057 6.9 143 369 6.9 93 35 - 39 63 086 5.8 57 832 5.8 120 918 5.8 92 40 - 44 50 291 4.6 44 692 4.5 94 983 4.6 89 45 - 49 42 402 3.9 35 187 3.5 77 589 3.7 83 50 - 54 33 531 3.1 25 627 2.6 59 158 2.8 76 55 - 59 26 042 2.4 20 536 2.1 46 578 2.2 78 60 -64 22 091 2.0 17 982 1.8 40 073 1.9 81 65+ 64 756 6.0 42 148 4.2 106 904 5.1 65 Don't know 7 677 0.7 7 977 0.8 15 653 0.9 103 Total 1 084 845 100.0 1 001 082 100.0 2 085 927 100.0 92
4
Figure 2.3 Age structure
150 000 100 000 50 000 0 50 000 100 000 150 000
00 - 04 05 - 09 10 - 14 15 - 19 20 - 24 25 - 29 30 - 34 35 - 39 40 - 44 45 - 49 50 - 54 55 - 59 60 -64
65 - 69 70 - 74 75 - 79 80 - 84 85 - 89 90 - 94
95+
Male
Female
Table 2.2 Population by age group and sex
Figure 2.3 Age structure
NAMIBIA LABOUR FORCE SURVEY 2012 5
2.4 Dependency ratio
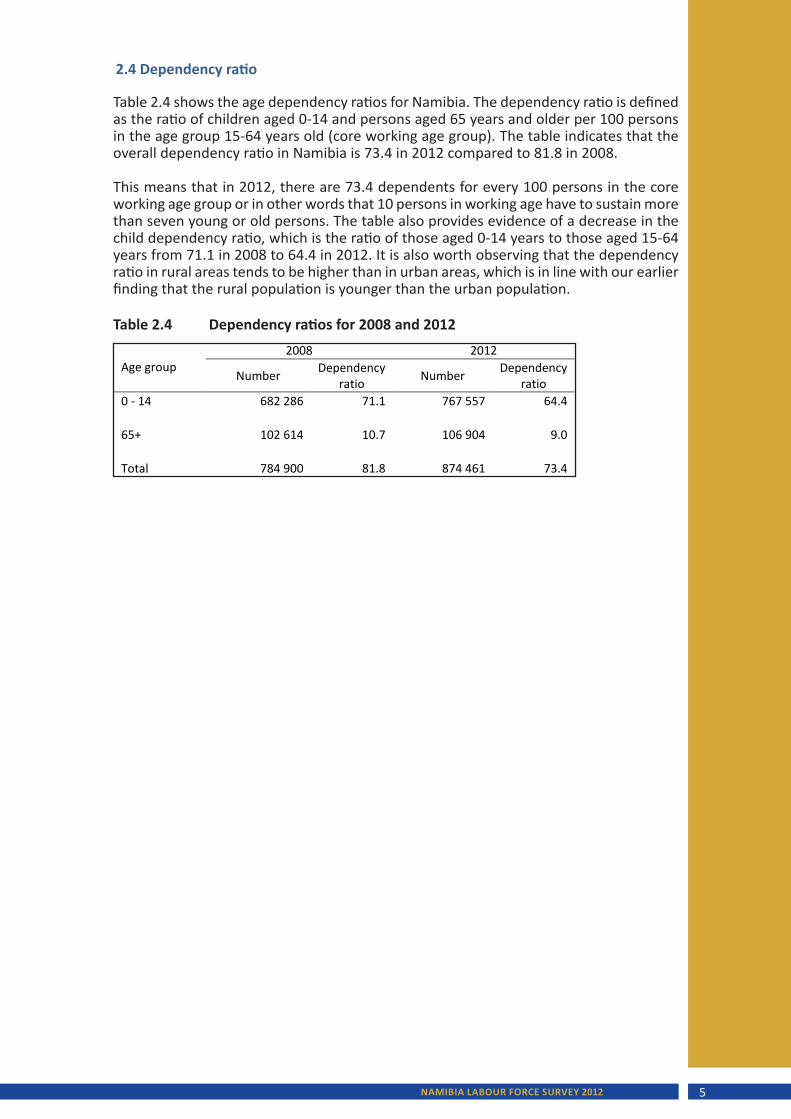
Table 2.4 shows the age dependency ratios for Namibia. The dependency ratio is defined as the ratio of children aged 0-14 and persons aged 65 years and older per 100 persons in the age group 15-64 years old (core working age group). The table indicates that the overall dependency ratio in Namibia is 73.4 in 2012 compared to 81.8 in 2008.
This means that in 2012, there are 73.4 dependents for every 100 persons in the core working age group or in other words that 10 persons in working age have to sustain more than seven young or old persons. The table also provides evidence of a decrease in the child dependency ratio, which is the ratio of those aged 0-14 years to those aged 15-64 years from 71.1 in 2008 to 64.4 in 2012. It is also worth observing that the dependency ratio in rural areas tends to be higher than in urban areas, which is in line with our earlier finding that the rural population is younger than the urban population.
5
Table 2.4 Dependency ratios for 2008 and 2012
Age group 2008 2012
Number Dependency ratio Number Dependency
ratio 0 - 14 682 286 71.1 767 557 64.4
65+ 102 614 10.7 106 904 9.0
Total 784 900 81.8 874 461 73.4
Table 2.4 Dependency ratios for 2008 and 2012
NAMIBIA LABOUR FORCE SURVEY 20126
chapter 3: ECONOMIC ACTIVITY STATUS
3.1 Introduction
The economic activity status of the population divides the population into two broad categories, i.e. the economically active and the economically inactive population. The economically active are the employed and unemployed also known as the labour force while the economically inactive population includes those who are outside of the labour force such as students, homemakers, pensioners, income recipients (income from investment for instance) etc.
The survey asked for the economic activity conducted during the seven days prior to the interview in respect of all persons aged 8 years and above. A person was regarded as having worked, if he or she had worked for at least one hour for pay, profit or family gain during that period or had a job or business or other economic or farming activities to return to. Unlike in previous years, the NLFS 2012 consisted of eight prompt questions in addition to the standard question about work for pay, profit or family gain that will help to identify those who are employed. These questions enquired specifically about running a business for him/herself; helping without pay in a household business; doing work on a household farm, plot or the like; collecting water or wood for household sale; producing other goods for household use; doing construction or major repair work on own property; and catching animals or collecting food for household consumptions.Even though the survey collected information on the economic activity for persons above the age of 8 years, the analysis here focuses on the population aged 15 years and above, which is in accordance with international practice.
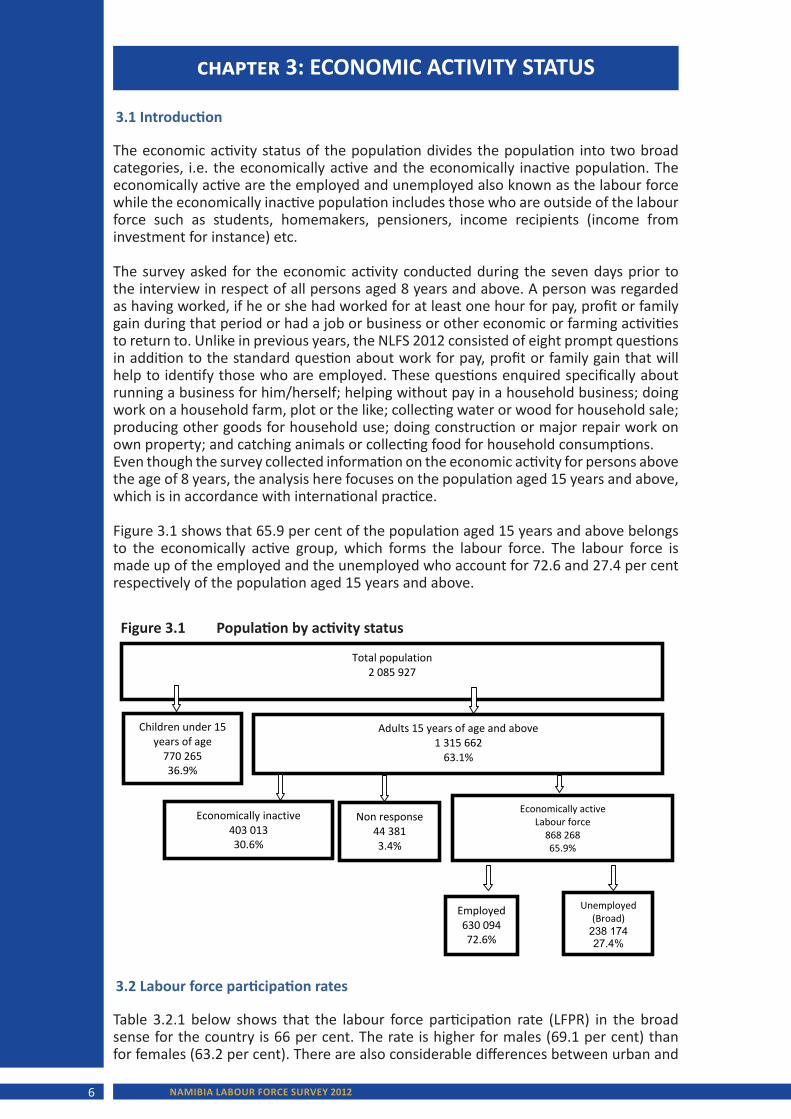
Figure 3.1 shows that 65.9 per cent of the population aged 15 years and above belongs to the economically active group, which forms the labour force. The labour force is made up of the employed and the unemployed who account for 72.6 and 27.4 per cent respectively of the population aged 15 years and above.
6
Figure 3.1 Population by activity status
Total population 2 085 927
Children under 15 years of age
770 265 36.9%
Adults 15 years of age and above 1 315 662
63.1%
Non response 44 381 3.4%
Economically inactive 403 013 30.6%
Economically active Labour force
868 268 65.9%
Employed 630 094 72.6%
Unemployed (Broad)
238 174 27.4%
3.2 Labour force participation rates
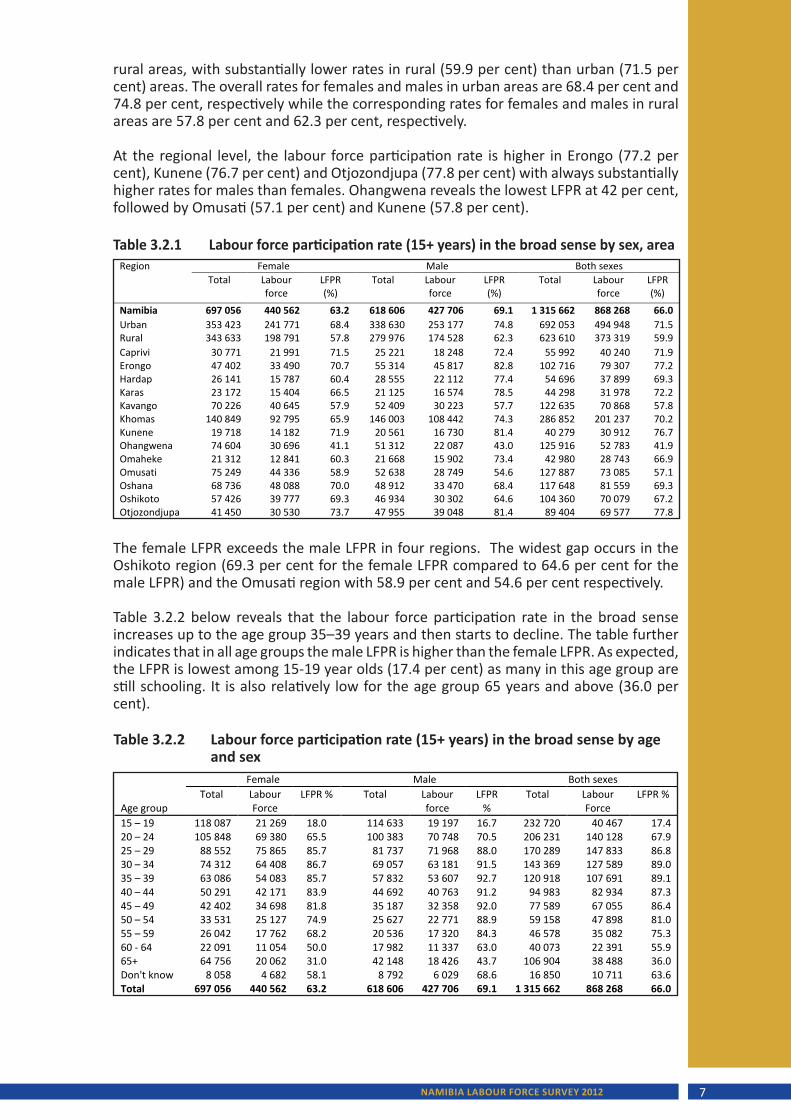
Table 3.2.1 below shows that the labour force participation rate (LFPR) in the broad sense for the country is 66 per cent. The rate is higher for males (69.1 per cent) than for females (63.2 per cent). There are also considerable differences between urban and
Figure 3.1 Population by activity status
NAMIBIA LABOUR FORCE SURVEY 2012 7
rural areas, with substantially lower rates in rural (59.9 per cent) than urban (71.5 per cent) areas. The overall rates for females and males in urban areas are 68.4 per cent and 74.8 per cent, respectively while the corresponding rates for females and males in rural areas are 57.8 per cent and 62.3 per cent, respectively.
At the regional level, the labour force participation rate is higher in Erongo (77.2 per cent), Kunene (76.7 per cent) and Otjozondjupa (77.8 per cent) with always substantially higher rates for males than females. Ohangwena reveals the lowest LFPR at 42 per cent, followed by Omusati (57.1 per cent) and Kunene (57.8 per cent).
The female LFPR exceeds the male LFPR in four regions. The widest gap occurs in the Oshikoto region (69.3 per cent for the female LFPR compared to 64.6 per cent for the male LFPR) and the Omusati region with 58.9 per cent and 54.6 per cent respectively.
Table 3.2.2 below reveals that the labour force participation rate in the broad sense increases up to the age group 35–39 years and then starts to decline. The table further indicates that in all age groups the male LFPR is higher than the female LFPR. As expected, the LFPR is lowest among 15-19 year olds (17.4 per cent) as many in this age group are still schooling. It is also relatively low for the age group 65 years and above (36.0 per cent).
7
Table 3.2.1 Labour force participation rate (15+ years) in the broad sense by sex, area
Region Female Male Both sexes Total Labour
force LFPR (%)
Total Labour force
LFPR (%)
Total Labour force
LFPR (%)
Namibia 697 056 440 562 63.2 618 606 427 706 69.1 1 315 662 868 268 66.0 Urban 353 423 241 771 68.4 338 630 253 177 74.8 692 053 494 948 71.5 Rural 343 633 198 791 57.8 279 976 174 528 62.3 623 610 373 319 59.9 Caprivi 30 771 21 991 71.5 25 221 18 248 72.4 55 992 40 240 71.9 Erongo 47 402 33 490 70.7 55 314 45 817 82.8 102 716 79 307 77.2 Hardap 26 141 15 787 60.4 28 555 22 112 77.4 54 696 37 899 69.3 Karas 23 172 15 404 66.5 21 125 16 574 78.5 44 298 31 978 72.2 Kavango 70 226 40 645 57.9 52 409 30 223 57.7 122 635 70 868 57.8 Khomas 140 849 92 795 65.9 146 003 108 442 74.3 286 852 201 237 70.2 Kunene 19 718 14 182 71.9 20 561 16 730 81.4 40 279 30 912 76.7 Ohangwena 74 604 30 696 41.1 51 312 22 087 43.0 125 916 52 783 41.9 Omaheke 21 312 12 841 60.3 21 668 15 902 73.4 42 980 28 743 66.9 Omusati 75 249 44 336 58.9 52 638 28 749 54.6 127 887 73 085 57.1 Oshana 68 736 48 088 70.0 48 912 33 470 68.4 117 648 81 559 69.3 Oshikoto 57 426 39 777 69.3 46 934 30 302 64.6 104 360 70 079 67.2 Otjozondjupa 41 450 30 530 73.7 47 955 39 048 81.4 89 404 69 577 77.8
8
Table 3.2.2 Labour force participation rate (15+ years) in the broad sense by age and sex
Age group
Female Male Both sexes Total Labour
Force LFPR % Total Labour
force LFPR
% Total Labour
Force LFPR %
15 – 19 118 087 21 269 18.0 114 633 19 197 16.7 232 720 40 467 17.4 20 – 24 105 848 69 380 65.5 100 383 70 748 70.5 206 231 140 128 67.9 25 – 29 88 552 75 865 85.7 81 737 71 968 88.0 170 289 147 833 86.8 30 – 34 74 312 64 408 86.7 69 057 63 181 91.5 143 369 127 589 89.0 35 – 39 63 086 54 083 85.7 57 832 53 607 92.7 120 918 107 691 89.1 40 – 44 50 291 42 171 83.9 44 692 40 763 91.2 94 983 82 934 87.3 45 – 49 42 402 34 698 81.8 35 187 32 358 92.0 77 589 67 055 86.4 50 – 54 33 531 25 127 74.9 25 627 22 771 88.9 59 158 47 898 81.0 55 – 59 26 042 17 762 68.2 20 536 17 320 84.3 46 578 35 082 75.3 60 - 64 22 091 11 054 50.0 17 982 11 337 63.0 40 073 22 391 55.9 65+ 64 756 20 062 31.0 42 148 18 426 43.7 106 904 38 488 36.0 Don't know 8 058 4 682 58.1 8 792 6 029 68.6 16 850 10 711 63.6 Total 697 056 440 562 63.2 618 606 427 706 69.1 1 315 662 868 268 66.0
Table 3.2.2 Labour force participation rate (15+ years) in the broad sense by age and sex
Table 3.2.1 Labour force participation rate (15+ years) in the broad sense by sex, area
NAMIBIA LABOUR FORCE SURVEY 20128
3.3 Characteristics of employed population (15+ years)
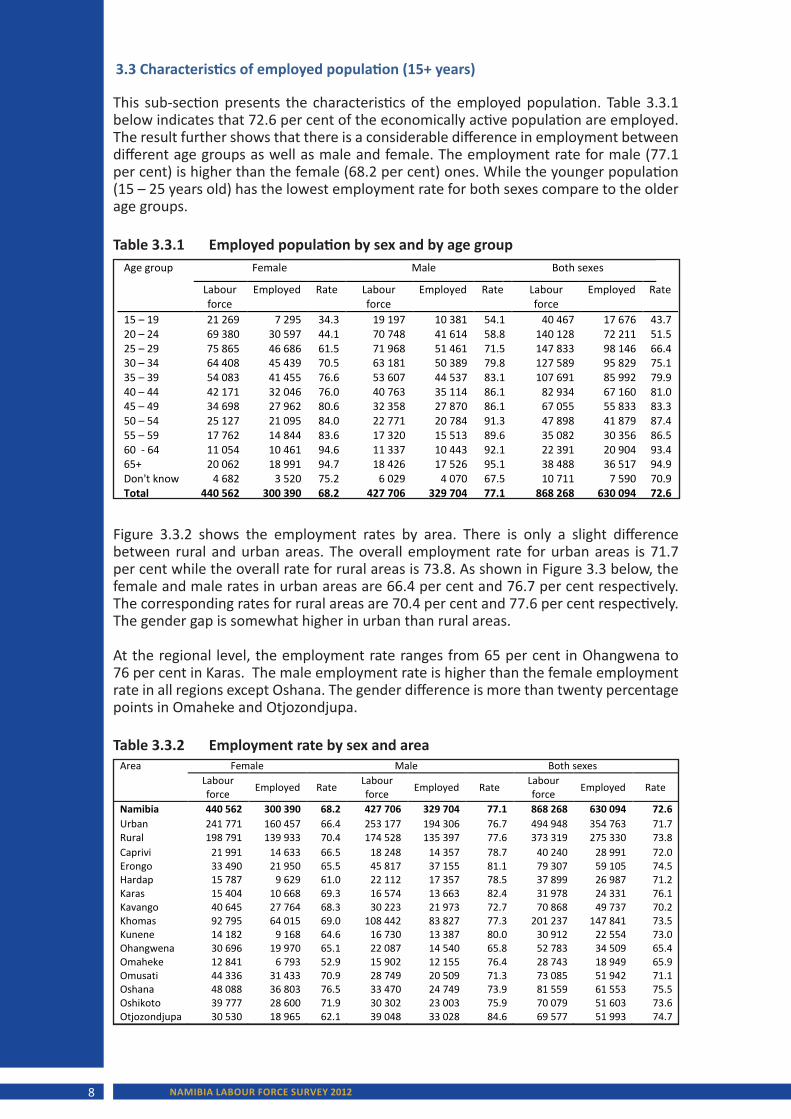
This sub-section presents the characteristics of the employed population. Table 3.3.1 below indicates that 72.6 per cent of the economically active population are employed. The result further shows that there is a considerable difference in employment between different age groups as well as male and female. The employment rate for male (77.1 per cent) is higher than the female (68.2 per cent) ones. While the younger population (15 – 25 years old) has the lowest employment rate for both sexes compare to the older age groups.
Figure 3.3.2 shows the employment rates by area. There is only a slight difference between rural and urban areas. The overall employment rate for urban areas is 71.7 per cent while the overall rate for rural areas is 73.8. As shown in Figure 3.3 below, the female and male rates in urban areas are 66.4 per cent and 76.7 per cent respectively. The corresponding rates for rural areas are 70.4 per cent and 77.6 per cent respectively. The gender gap is somewhat higher in urban than rural areas.
At the regional level, the employment rate ranges from 65 per cent in Ohangwena to 76 per cent in Karas. The male employment rate is higher than the female employment rate in all regions except Oshana. The gender difference is more than twenty percentage points in Omaheke and Otjozondjupa.
9
Table 3.3.1 Employed population by sex and by age group
Age group Female Male Both sexes
Labour force
Employed Rate Labour force
Employed Rate Labour force
Employed Rate
15 – 19 21 269 7 295 34.3 19 197 10 381 54.1 40 467 17 676 43.7 20 – 24 69 380 30 597 44.1 70 748 41 614 58.8 140 128 72 211 51.5 25 – 29 75 865 46 686 61.5 71 968 51 461 71.5 147 833 98 146 66.4 30 – 34 64 408 45 439 70.5 63 181 50 389 79.8 127 589 95 829 75.1 35 – 39 54 083 41 455 76.6 53 607 44 537 83.1 107 691 85 992 79.9 40 – 44 42 171 32 046 76.0 40 763 35 114 86.1 82 934 67 160 81.0 45 – 49 34 698 27 962 80.6 32 358 27 870 86.1 67 055 55 833 83.3 50 – 54 25 127 21 095 84.0 22 771 20 784 91.3 47 898 41 879 87.4 55 – 59 17 762 14 844 83.6 17 320 15 513 89.6 35 082 30 356 86.5 60 - 64 11 054 10 461 94.6 11 337 10 443 92.1 22 391 20 904 93.4 65+ 20 062 18 991 94.7 18 426 17 526 95.1 38 488 36 517 94.9 Don't know 4 682 3 520 75.2 6 029 4 070 67.5 10 711 7 590 70.9 Total 440 562 300 390 68.2 427 706 329 704 77.1 868 268 630 094 72.6
10
Table 3.3.2 Employment rate by sex and area
Area Female Male Both sexes Labour force Employed Rate Labour
force Employed Rate Labour force Employed Rate
Namibia 440 562 300 390 68.2 427 706 329 704 77.1 868 268 630 094 72.6 Urban 241 771 160 457 66.4 253 177 194 306 76.7 494 948 354 763 71.7 Rural 198 791 139 933 70.4 174 528 135 397 77.6 373 319 275 330 73.8 Caprivi 21 991 14 633 66.5 18 248 14 357 78.7 40 240 28 991 72.0 Erongo 33 490 21 950 65.5 45 817 37 155 81.1 79 307 59 105 74.5 Hardap 15 787 9 629 61.0 22 112 17 357 78.5 37 899 26 987 71.2 Karas 15 404 10 668 69.3 16 574 13 663 82.4 31 978 24 331 76.1 Kavango 40 645 27 764 68.3 30 223 21 973 72.7 70 868 49 737 70.2 Khomas 92 795 64 015 69.0 108 442 83 827 77.3 201 237 147 841 73.5 Kunene 14 182 9 168 64.6 16 730 13 387 80.0 30 912 22 554 73.0 Ohangwena 30 696 19 970 65.1 22 087 14 540 65.8 52 783 34 509 65.4 Omaheke 12 841 6 793 52.9 15 902 12 155 76.4 28 743 18 949 65.9 Omusati 44 336 31 433 70.9 28 749 20 509 71.3 73 085 51 942 71.1 Oshana 48 088 36 803 76.5 33 470 24 749 73.9 81 559 61 553 75.5 Oshikoto 39 777 28 600 71.9 30 302 23 003 75.9 70 079 51 603 73.6 Otjozondjupa 30 530 18 965 62.1 39 048 33 028 84.6 69 577 51 993 74.7
Table 3.3.2 Employment rate by sex and area
Table 3.3.1 Employed population by sex and by age group
NAMIBIA LABOUR FORCE SURVEY 2012 9
3.4 Employed population by industry
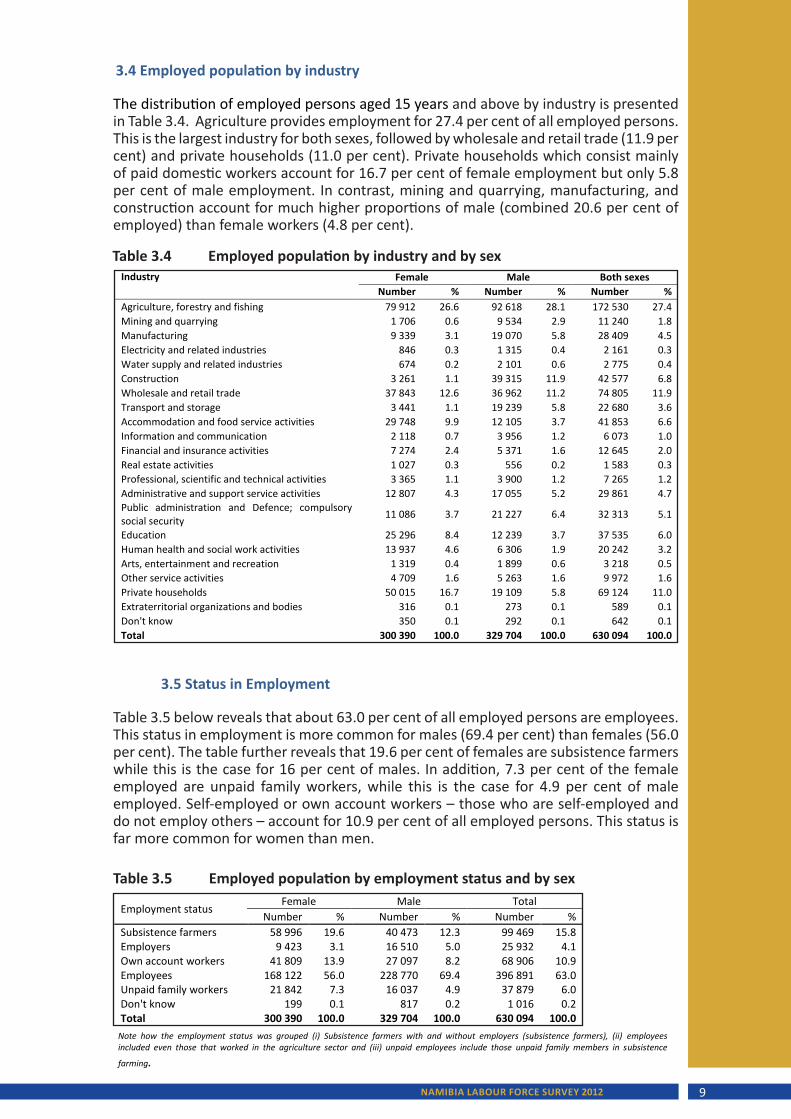
The distribution of employed persons aged 15 years and above by industry is presented in Table 3.4. Agriculture provides employment for 27.4 per cent of all employed persons. This is the largest industry for both sexes, followed by wholesale and retail trade (11.9 per cent) and private households (11.0 per cent). Private households which consist mainly of paid domestic workers account for 16.7 per cent of female employment but only 5.8 per cent of male employment. In contrast, mining and quarrying, manufacturing, and construction account for much higher proportions of male (combined 20.6 per cent of employed) than female workers (4.8 per cent).
11
Table 3.4 Employed population by industry and by sex
Industry Female Male Both sexes Number % Number % Number %
Agriculture, forestry and fishing 79 912 26.6 92 618 28.1 172 530 27.4 Mining and quarrying 1 706 0.6 9 534 2.9 11 240 1.8 Manufacturing 9 339 3.1 19 070 5.8 28 409 4.5 Electricity and related industries 846 0.3 1 315 0.4 2 161 0.3 Water supply and related industries 674 0.2 2 101 0.6 2 775 0.4 Construction 3 261 1.1 39 315 11.9 42 577 6.8 Wholesale and retail trade 37 843 12.6 36 962 11.2 74 805 11.9 Transport and storage 3 441 1.1 19 239 5.8 22 680 3.6 Accommodation and food service activities 29 748 9.9 12 105 3.7 41 853 6.6 Information and communication 2 118 0.7 3 956 1.2 6 073 1.0 Financial and insurance activities 7 274 2.4 5 371 1.6 12 645 2.0 Real estate activities 1 027 0.3 556 0.2 1 583 0.3 Professional, scientific and technical activities 3 365 1.1 3 900 1.2 7 265 1.2 Administrative and support service activities 12 807 4.3 17 055 5.2 29 861 4.7 Public administration and Defence; compulsory social security 11 086 3.7 21 227 6.4 32 313 5.1
Education 25 296 8.4 12 239 3.7 37 535 6.0 Human health and social work activities 13 937 4.6 6 306 1.9 20 242 3.2 Arts, entertainment and recreation 1 319 0.4 1 899 0.6 3 218 0.5 Other service activities 4 709 1.6 5 263 1.6 9 972 1.6 Private households 50 015 16.7 19 109 5.8 69 124 11.0 Extraterritorial organizations and bodies 316 0.1 273 0.1 589 0.1 Don't know 350 0.1 292 0.1 642 0.1 Total 300 390 100.0 329 704 100.0 630 094 100.0
3.5 Status in Employment
Table 3.5 below reveals that about 63.0 per cent of all employed persons are employees. This status in employment is more common for males (69.4 per cent) than females (56.0 per cent). The table further reveals that 19.6 per cent of females are subsistence farmers while this is the case for 16 per cent of males. In addition, 7.3 per cent of the female employed are unpaid family workers, while this is the case for 4.9 per cent of male employed. Self-employed or own account workers – those who are self-employed and do not employ others – account for 10.9 per cent of all employed persons. This status is far more common for women than men.
12
Table 3.5 Employed population by employment status and by sex
Employment status Female Male Total
Number % Number % Number % Subsistence farmers 58 996 19.6 40 473 12.3 99 469 15.8 Employers 9 423 3.1 16 510 5.0 25 932 4.1 Own account workers 41 809 13.9 27 097 8.2 68 906 10.9 Employees 168 122 56.0 228 770 69.4 396 891 63.0 Unpaid family workers 21 842 7.3 16 037 4.9 37 879 6.0 Don't know 199 0.1 817 0.2 1 016 0.2 Total 300 390 100.0 329 704 100.0 630 094 100.0
Note how the employment status was grouped (i) Subsistence farmers with and without employers (subsistence farmers), (ii) employees included even those that worked in the agriculture sector and (iii) unpaid employees include those unpaid family members in subsistence
farming.
Table 3.5 Employed population by employment status and by sex
Table 3.4 Employed population by industry and by sex
12
Table 3.5 Employed population by employment status and by sex
Employment status Female Male Total
Number % Number % Number % Subsistence farmers 58 996 19.6 40 473 12.3 99 469 15.8 Employers 9 423 3.1 16 510 5.0 25 932 4.1 Own account workers 41 809 13.9 27 097 8.2 68 906 10.9 Employees 168 122 56.0 228 770 69.4 396 891 63.0 Unpaid family workers 21 842 7.3 16 037 4.9 37 879 6.0 Don't know 199 0.1 817 0.2 1 016 0.2 Total 300 390 100.0 329 704 100.0 630 094 100.0
Note how the employment status was grouped (i) Subsistence farmers with and without employers (subsistence farmers), (ii) employees included even those that worked in the agriculture sector and (iii) unpaid employees include those unpaid family members in subsistence
farming.
NAMIBIA LABOUR FORCE SURVEY 201210
3.6 Employment by educational level
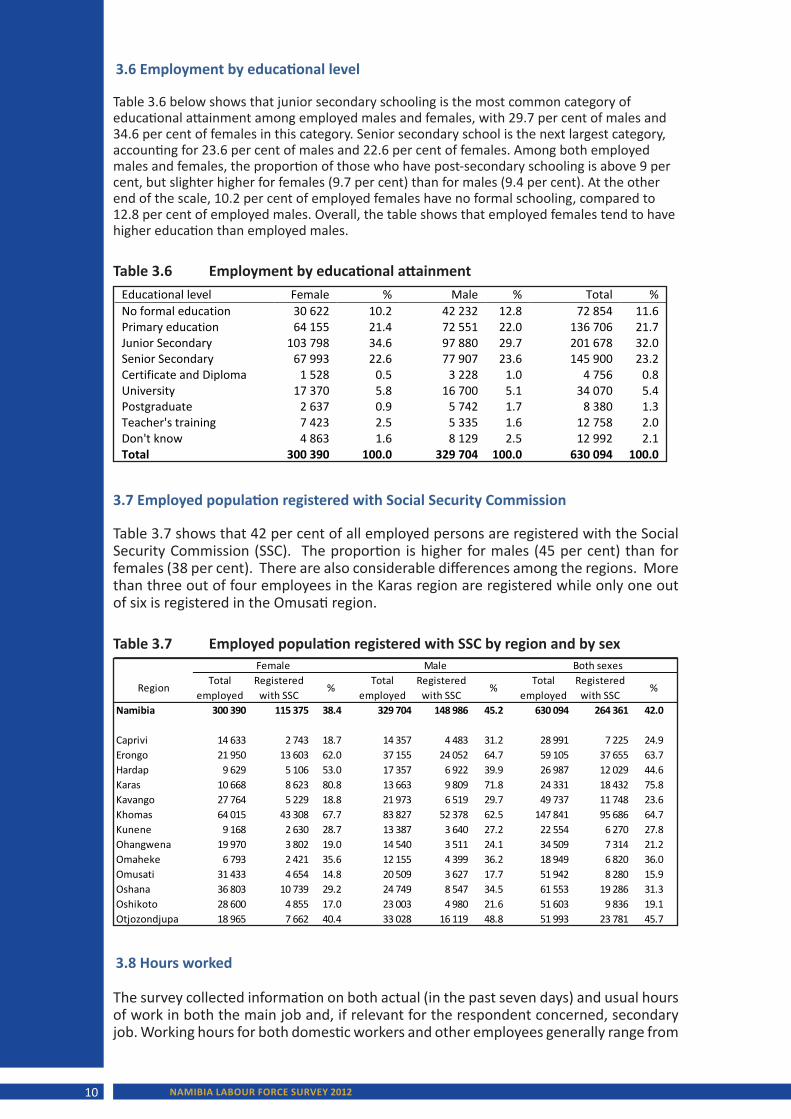
Table 3.6 below shows that junior secondary schooling is the most common category of educational attainment among employed males and females, with 29.7 per cent of males and 34.6 per cent of females in this category. Senior secondary school is the next largest category, accounting for 23.6 per cent of males and 22.6 per cent of females. Among both employed males and females, the proportion of those who have post-secondary schooling is above 9 per cent, but slighter higher for females (9.7 per cent) than for males (9.4 per cent). At the other end of the scale, 10.2 per cent of employed females have no formal schooling, compared to 12.8 per cent of employed males. Overall, the table shows that employed females tend to have higher education than employed males.
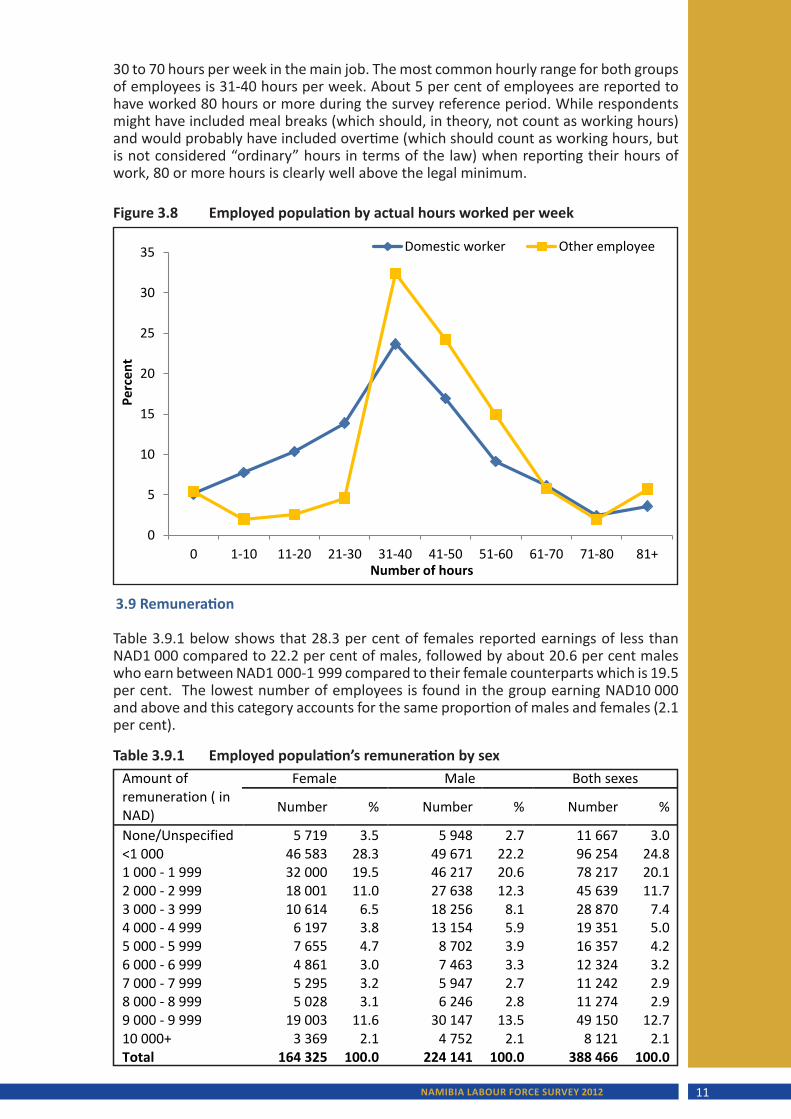
3.8 Hours worked
The survey collected information on both actual (in the past seven days) and usual hours of work in both the main job and, if relevant for the respondent concerned, secondary job. Working hours for both domestic workers and other employees generally range from
13
Table 3.6 Employment by educational attainment
Educational level Female % Male % Total % No formal education 30 622 10.2 42 232 12.8 72 854 11.6 Primary education 64 155 21.4 72 551 22.0 136 706 21.7 Junior Secondary 103 798 34.6 97 880 29.7 201 678 32.0 Senior Secondary 67 993 22.6 77 907 23.6 145 900 23.2 Certificate and Diploma 1 528 0.5 3 228 1.0 4 756 0.8 University 17 370 5.8 16 700 5.1 34 070 5.4 Postgraduate 2 637 0.9 5 742 1.7 8 380 1.3 Teacher's training 7 423 2.5 5 335 1.6 12 758 2.0 Don't know 4 863 1.6 8 129 2.5 12 992 2.1 Total 300 390 100.0 329 704 100.0 630 094 100.0
3.7 Employed population registered with Social Security Commission
Table 3.7 shows that 42 per cent of all employed persons are registered with the Social Security Commission (SSC). The proportion is higher for males (45 per cent) than for females (38 per cent). There are also considerable differences among the regions. More than three out of four employees in the Karas region are registered while only one out of six is registered in the Omusati region.
14
Table 3.7 Employed population registered with SSC by region and by sex
RegionTotal
employedRegistered
with SSC%
Total employed
Registered with SSC
%Total
employedRegistered
with SSC%
Namibia 300 390 115 375 38.4 329 704 148 986 45.2 630 094 264 361 42.0
Caprivi 14 633 2 743 18.7 14 357 4 483 31.2 28 991 7 225 24.9Erongo 21 950 13 603 62.0 37 155 24 052 64.7 59 105 37 655 63.7Hardap 9 629 5 106 53.0 17 357 6 922 39.9 26 987 12 029 44.6Karas 10 668 8 623 80.8 13 663 9 809 71.8 24 331 18 432 75.8Kavango 27 764 5 229 18.8 21 973 6 519 29.7 49 737 11 748 23.6Khomas 64 015 43 308 67.7 83 827 52 378 62.5 147 841 95 686 64.7Kunene 9 168 2 630 28.7 13 387 3 640 27.2 22 554 6 270 27.8Ohangwena 19 970 3 802 19.0 14 540 3 511 24.1 34 509 7 314 21.2Omaheke 6 793 2 421 35.6 12 155 4 399 36.2 18 949 6 820 36.0Omusati 31 433 4 654 14.8 20 509 3 627 17.7 51 942 8 280 15.9Oshana 36 803 10 739 29.2 24 749 8 547 34.5 61 553 19 286 31.3Oshikoto 28 600 4 855 17.0 23 003 4 980 21.6 51 603 9 836 19.1Otjozondjupa 18 965 7 662 40.4 33 028 16 119 48.8 51 993 23 781 45.7
Female Male Both sexes
Table 3.6 Employment by educational attainment
Table 3.7 Employed population registered with SSC by region and by sex
NAMIBIA LABOUR FORCE SURVEY 2012 11
3.9 Remuneration
Table 3.9.1 below shows that 28.3 per cent of females reported earnings of less than NAD1 000 compared to 22.2 per cent of males, followed by about 20.6 per cent males who earn between NAD1 000-1 999 compared to their female counterparts which is 19.5 per cent. The lowest number of employees is found in the group earning NAD10 000 and above and this category accounts for the same proportion of males and females (2.1 per cent).
15
Figure 3.8 Employed population by actual hours worked per week
0
5
10
15
20
25
30
35
0 1-10 11-20 21-30 31-40 41-50 51-60 61-70 71-80 81+
Perc
ent
Number of hours
Domestic worker Other employee
30 to 70 hours per week in the main job. The most common hourly range for both groups of employees is 31-40 hours per week. About 5 per cent of employees are reported to have worked 80 hours or more during the survey reference period. While respondents might have included meal breaks (which should, in theory, not count as working hours) and would probably have included overtime (which should count as working hours, but is not considered “ordinary” hours in terms of the law) when reporting their hours of work, 80 or more hours is clearly well above the legal minimum.
16
Table 3.9.1 Employed population’s remuneration by sex
Amount of remuneration ( in NAD)
Female Male Both sexes
Number % Number % Number %
None/Unspecified 5 719 3.5 5 948 2.7 11 667 3.0 <1 000 46 583 28.3 49 671 22.2 96 254 24.8 1 000 - 1 999 32 000 19.5 46 217 20.6 78 217 20.1 2 000 - 2 999 18 001 11.0 27 638 12.3 45 639 11.7 3 000 - 3 999 10 614 6.5 18 256 8.1 28 870 7.4 4 000 - 4 999 6 197 3.8 13 154 5.9 19 351 5.0 5 000 - 5 999 7 655 4.7 8 702 3.9 16 357 4.2 6 000 - 6 999 4 861 3.0 7 463 3.3 12 324 3.2 7 000 - 7 999 5 295 3.2 5 947 2.7 11 242 2.9 8 000 - 8 999 5 028 3.1 6 246 2.8 11 274 2.9 9 000 - 9 999 19 003 11.6 30 147 13.5 49 150 12.7 10 000+ 3 369 2.1 4 752 2.1 8 121 2.1 Total 164 325 100.0 224 141 100.0 388 466 100.0
Figure 3.8 Employed population by actual hours worked per week
Table 3.9.1 Employed population’s remuneration by sex
NAMIBIA LABOUR FORCE SURVEY 201212
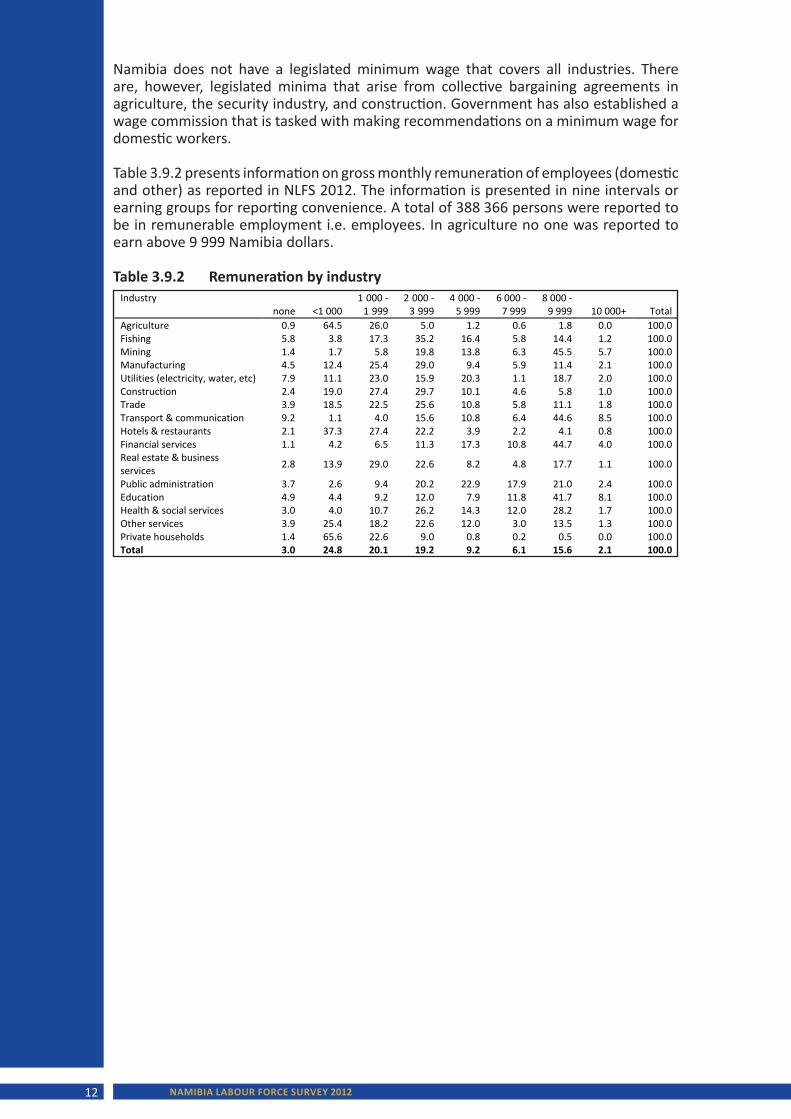
Namibia does not have a legislated minimum wage that covers all industries. There are, however, legislated minima that arise from collective bargaining agreements in agriculture, the security industry, and construction. Government has also established a wage commission that is tasked with making recommendations on a minimum wage for domestic workers.
Table 3.9.2 presents information on gross monthly remuneration of employees (domestic and other) as reported in NLFS 2012. The information is presented in nine intervals or earning groups for reporting convenience. A total of 388 366 persons were reported to be in remunerable employment i.e. employees. In agriculture no one was reported to earn above 9 999 Namibia dollars.
17
Table 3.9.2 Remuneration by industry
Industry none <1 000
1 000 -1 999
2 000 -3 999
4 000 -5 999
6 000 - 7 999
8 000 -9 999 10 000+ Total
Agriculture 0.9 64.5 26.0 5.0 1.2 0.6 1.8 0.0 100.0 Fishing 5.8 3.8 17.3 35.2 16.4 5.8 14.4 1.2 100.0 Mining 1.4 1.7 5.8 19.8 13.8 6.3 45.5 5.7 100.0 Manufacturing 4.5 12.4 25.4 29.0 9.4 5.9 11.4 2.1 100.0 Utilities (electricity, water, etc) 7.9 11.1 23.0 15.9 20.3 1.1 18.7 2.0 100.0 Construction 2.4 19.0 27.4 29.7 10.1 4.6 5.8 1.0 100.0 Trade 3.9 18.5 22.5 25.6 10.8 5.8 11.1 1.8 100.0 Transport & communication 9.2 1.1 4.0 15.6 10.8 6.4 44.6 8.5 100.0 Hotels & restaurants 2.1 37.3 27.4 22.2 3.9 2.2 4.1 0.8 100.0 Financial services 1.1 4.2 6.5 11.3 17.3 10.8 44.7 4.0 100.0 Real estate & business services 2.8 13.9 29.0 22.6 8.2 4.8 17.7 1.1 100.0
Public administration 3.7 2.6 9.4 20.2 22.9 17.9 21.0 2.4 100.0 Education 4.9 4.4 9.2 12.0 7.9 11.8 41.7 8.1 100.0 Health & social services 3.0 4.0 10.7 26.2 14.3 12.0 28.2 1.7 100.0 Other services 3.9 25.4 18.2 22.6 12.0 3.0 13.5 1.3 100.0 Private households 1.4 65.6 22.6 9.0 0.8 0.2 0.5 0.0 100.0 Total 3.0 24.8 20.1 19.2 9.2 6.1 15.6 2.1 100.0
Table 3.9.2 Remuneration by industry
NAMIBIA LABOUR FORCE SURVEY 2012 13
chapter 4: CHARACTERISTICS OF THE UNEMPLOYED POPULATION
The unemployment rate is widely regarded as one of the key labour market indicators and a good measure of current economic activity.
If one uses the strict definition, the unemployed population consists of all persons (15 years and above) who are actively seeking work and are available for work during the reference period (last seven days before the interview took place). The broad unemployment definition drops the requirement that the person is actively looking for work. This chapter looks at various characteristics of the unemployed population in Namibia as reported in the survey using mainly the broad definition. Among others, it examines the educational profile, unemployment by region, age, and sex.
4.1 Unemployment by age
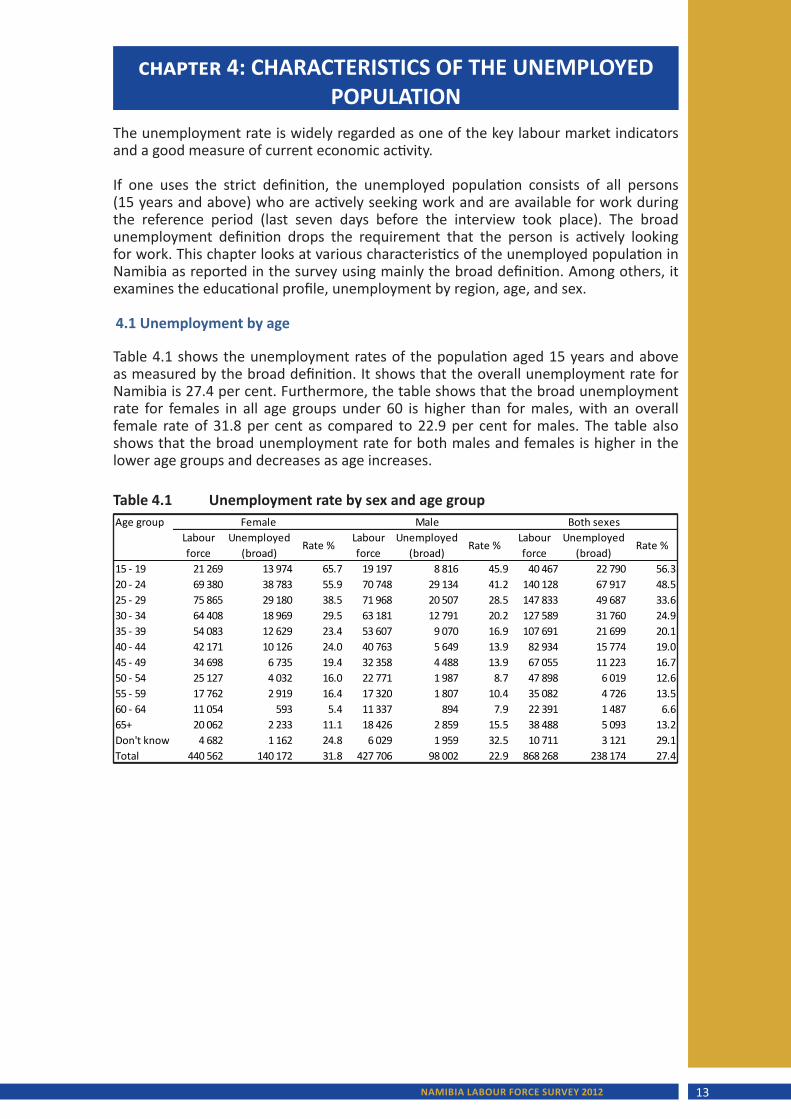
Table 4.1 shows the unemployment rates of the population aged 15 years and above as measured by the broad definition. It shows that the overall unemployment rate for Namibia is 27.4 per cent. Furthermore, the table shows that the broad unemployment rate for females in all age groups under 60 is higher than for males, with an overall female rate of 31.8 per cent as compared to 22.9 per cent for males. The table also shows that the broad unemployment rate for both males and females is higher in the lower age groups and decreases as age increases.
18
Table 4.1 Unemployment rate by sex and age group
Age groupLabour force
Unemployed (broad)
Rate %Labour force
Unemployed (broad)
Rate %Labour force
Unemployed (broad)
Rate %
15 - 19 21 269 13 974 65.7 19 197 8 816 45.9 40 467 22 790 56.320 - 24 69 380 38 783 55.9 70 748 29 134 41.2 140 128 67 917 48.525 - 29 75 865 29 180 38.5 71 968 20 507 28.5 147 833 49 687 33.630 - 34 64 408 18 969 29.5 63 181 12 791 20.2 127 589 31 760 24.935 - 39 54 083 12 629 23.4 53 607 9 070 16.9 107 691 21 699 20.140 - 44 42 171 10 126 24.0 40 763 5 649 13.9 82 934 15 774 19.045 - 49 34 698 6 735 19.4 32 358 4 488 13.9 67 055 11 223 16.750 - 54 25 127 4 032 16.0 22 771 1 987 8.7 47 898 6 019 12.655 - 59 17 762 2 919 16.4 17 320 1 807 10.4 35 082 4 726 13.560 - 64 11 054 593 5.4 11 337 894 7.9 22 391 1 487 6.665+ 20 062 2 233 11.1 18 426 2 859 15.5 38 488 5 093 13.2Don't know 4 682 1 162 24.8 6 029 1 959 32.5 10 711 3 121 29.1Total 440 562 140 172 31.8 427 706 98 002 22.9 868 268 238 174 27.4
Female Male Both sexes
Table 4.1 Unemployment rate by sex and age group
NAMIBIA LABOUR FORCE SURVEY 201214
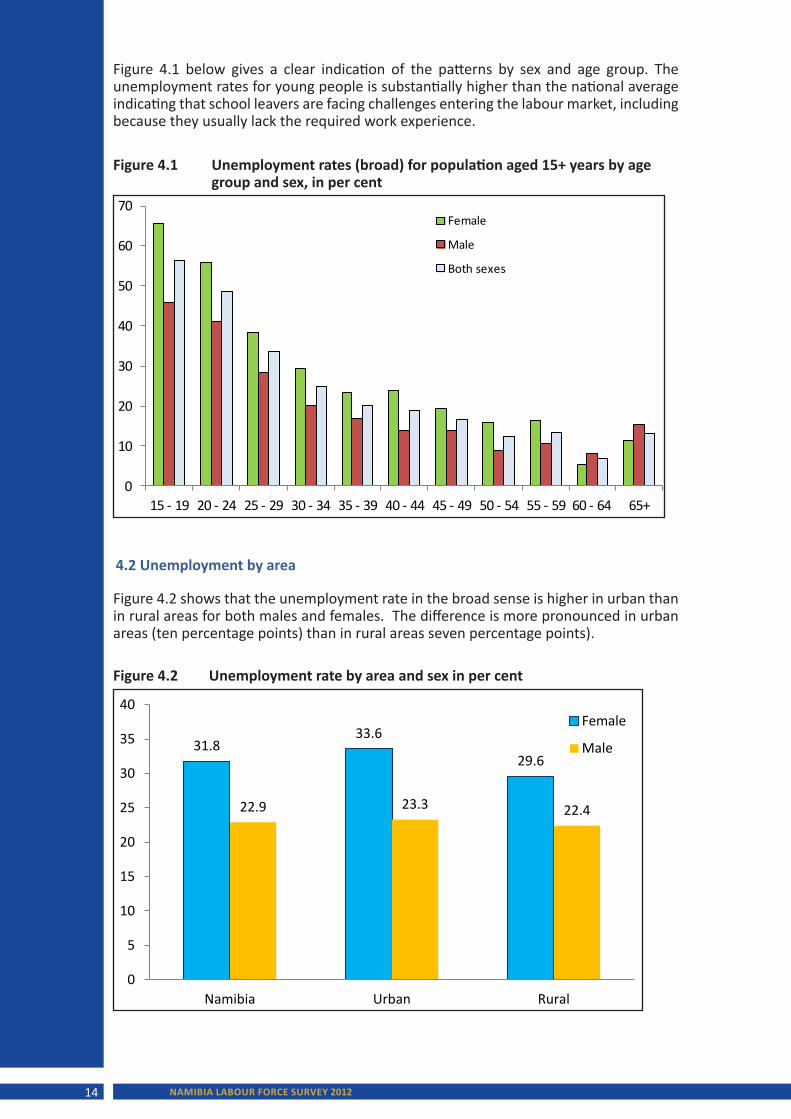
Figure 4.1 below gives a clear indication of the patterns by sex and age group. The unemployment rates for young people is substantially higher than the national average indicating that school leavers are facing challenges entering the labour market, including because they usually lack the required work experience.
4.2 Unemployment by area
Figure 4.2 shows that the unemployment rate in the broad sense is higher in urban than in rural areas for both males and females. The difference is more pronounced in urban areas (ten percentage points) than in rural areas seven percentage points).
19
Figure 4.1 Unemployment rates (broad) for population aged 15+ years by age group and sex, in per cent
0
10
20
30
40
50
60
70
15 - 19 20 - 24 25 - 29 30 - 34 35 - 39 40 - 44 45 - 49 50 - 54 55 - 59 60 - 64 65+
Female
Male
Both sexes
20
Figure 4.2 Unemployment rate by area and sex in per cent
31.8 33.6
29.6
22.9 23.3 22.4
0
5
10
15
20
25
30
35
40
Namibia Urban Rural
Female
Male
Figure 4.2 Unemployment rate by area and sex in per cent
Figure 4.1 Unemployment rates (broad) for population aged 15+ years by age group and sex, in per cent
NAMIBIA LABOUR FORCE SURVEY 2012 15
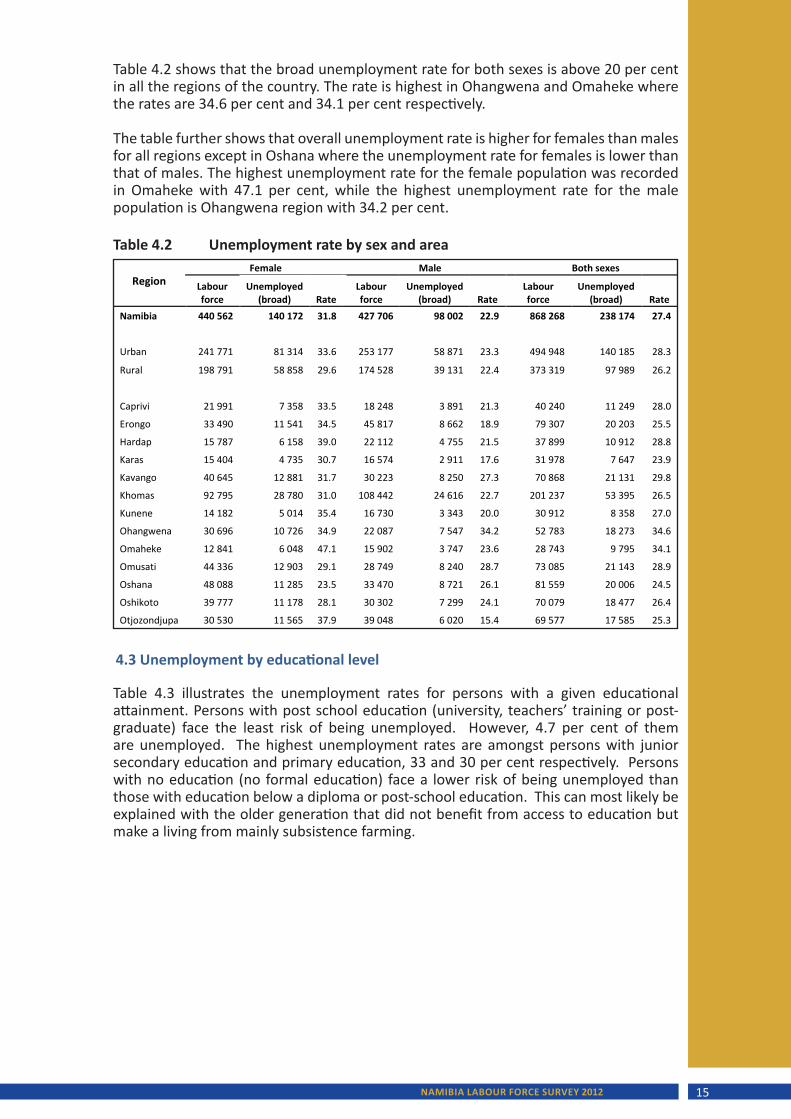
Table 4.2 shows that the broad unemployment rate for both sexes is above 20 per cent in all the regions of the country. The rate is highest in Ohangwena and Omaheke where the rates are 34.6 per cent and 34.1 per cent respectively.
The table further shows that overall unemployment rate is higher for females than males for all regions except in Oshana where the unemployment rate for females is lower than that of males. The highest unemployment rate for the female population was recorded in Omaheke with 47.1 per cent, while the highest unemployment rate for the male population is Ohangwena region with 34.2 per cent.
4.3 Unemployment by educational level
Table 4.3 illustrates the unemployment rates for persons with a given educational attainment. Persons with post school education (university, teachers’ training or post-graduate) face the least risk of being unemployed. However, 4.7 per cent of them are unemployed. The highest unemployment rates are amongst persons with junior secondary education and primary education, 33 and 30 per cent respectively. Persons with no education (no formal education) face a lower risk of being unemployed than those with education below a diploma or post-school education. This can most likely be explained with the older generation that did not benefit from access to education but make a living from mainly subsistence farming.
21
Table 4.2 Unemployment rate by sex and area
Region Female Male Both sexes
Labour force
Unemployed (broad) Rate
Labour force
Unemployed (broad) Rate
Labour force
Unemployed (broad) Rate
Namibia 440 562 140 172 31.8 427 706 98 002 22.9 868 268 238 174 27.4
Urban 241 771 81 314 33.6 253 177 58 871 23.3 494 948 140 185 28.3
Rural 198 791 58 858 29.6 174 528 39 131 22.4 373 319 97 989 26.2
Caprivi 21 991 7 358 33.5 18 248 3 891 21.3 40 240 11 249 28.0
Erongo 33 490 11 541 34.5 45 817 8 662 18.9 79 307 20 203 25.5
Hardap 15 787 6 158 39.0 22 112 4 755 21.5 37 899 10 912 28.8
Karas 15 404 4 735 30.7 16 574 2 911 17.6 31 978 7 647 23.9
Kavango 40 645 12 881 31.7 30 223 8 250 27.3 70 868 21 131 29.8
Khomas 92 795 28 780 31.0 108 442 24 616 22.7 201 237 53 395 26.5
Kunene 14 182 5 014 35.4 16 730 3 343 20.0 30 912 8 358 27.0
Ohangwena 30 696 10 726 34.9 22 087 7 547 34.2 52 783 18 273 34.6
Omaheke 12 841 6 048 47.1 15 902 3 747 23.6 28 743 9 795 34.1
Omusati 44 336 12 903 29.1 28 749 8 240 28.7 73 085 21 143 28.9
Oshana 48 088 11 285 23.5 33 470 8 721 26.1 81 559 20 006 24.5
Oshikoto 39 777 11 178 28.1 30 302 7 299 24.1 70 079 18 477 26.4
Otjozondjupa 30 530 11 565 37.9 39 048 6 020 15.4 69 577 17 585 25.3
Table 4.2 Unemployment rate by sex and area
NAMIBIA LABOUR FORCE SURVEY 201216
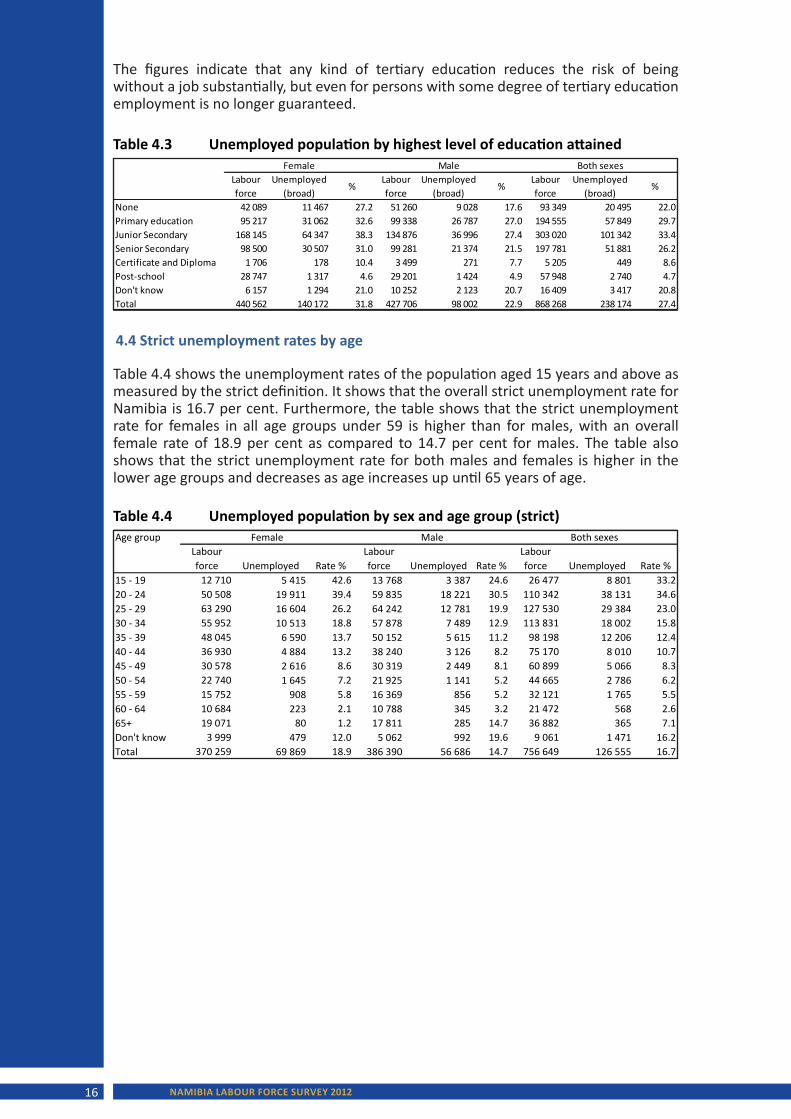
The figures indicate that any kind of tertiary education reduces the risk of being without a job substantially, but even for persons with some degree of tertiary education employment is no longer guaranteed.
4.4 Strict unemployment rates by age
Table 4.4 shows the unemployment rates of the population aged 15 years and above as measured by the strict definition. It shows that the overall strict unemployment rate for Namibia is 16.7 per cent. Furthermore, the table shows that the strict unemployment rate for females in all age groups under 59 is higher than for males, with an overall female rate of 18.9 per cent as compared to 14.7 per cent for males. The table also shows that the strict unemployment rate for both males and females is higher in the lower age groups and decreases as age increases up until 65 years of age.
22
Table 4.3 Unemployed population by highest level of education attained
Labour force
Unemployed (broad)
%Labour force
Unemployed (broad)
%Labour force
Unemployed (broad)
%
None 42 089 11 467 27.2 51 260 9 028 17.6 93 349 20 495 22.0Primary education 95 217 31 062 32.6 99 338 26 787 27.0 194 555 57 849 29.7Junior Secondary 168 145 64 347 38.3 134 876 36 996 27.4 303 020 101 342 33.4Senior Secondary 98 500 30 507 31.0 99 281 21 374 21.5 197 781 51 881 26.2Certificate and Diploma 1 706 178 10.4 3 499 271 7.7 5 205 449 8.6Post-school 28 747 1 317 4.6 29 201 1 424 4.9 57 948 2 740 4.7Don't know 6 157 1 294 21.0 10 252 2 123 20.7 16 409 3 417 20.8Total 440 562 140 172 31.8 427 706 98 002 22.9 868 268 238 174 27.4
Female Male Both sexes
23
Table 4.4 Unemployed population by sex and age group (strict)
Age groupLabour force Unemployed Rate %
Labour force Unemployed Rate %
Labour force Unemployed Rate %
15 - 19 12 710 5 415 42.6 13 768 3 387 24.6 26 477 8 801 33.220 - 24 50 508 19 911 39.4 59 835 18 221 30.5 110 342 38 131 34.625 - 29 63 290 16 604 26.2 64 242 12 781 19.9 127 530 29 384 23.030 - 34 55 952 10 513 18.8 57 878 7 489 12.9 113 831 18 002 15.835 - 39 48 045 6 590 13.7 50 152 5 615 11.2 98 198 12 206 12.440 - 44 36 930 4 884 13.2 38 240 3 126 8.2 75 170 8 010 10.745 - 49 30 578 2 616 8.6 30 319 2 449 8.1 60 899 5 066 8.350 - 54 22 740 1 645 7.2 21 925 1 141 5.2 44 665 2 786 6.255 - 59 15 752 908 5.8 16 369 856 5.2 32 121 1 765 5.560 - 64 10 684 223 2.1 10 788 345 3.2 21 472 568 2.665+ 19 071 80 1.2 17 811 285 14.7 36 882 365 7.1Don't know 3 999 479 12.0 5 062 992 19.6 9 061 1 471 16.2Total 370 259 69 869 18.9 386 390 56 686 14.7 756 649 126 555 16.7
Both sexesFemale Male
Table 4.4 Unemployed population by sex and age group (strict)
Table 4.3 Unemployed population by highest level of education attained
NAMIBIA LABOUR FORCE SURVEY 2012 17
4.5 Strict unemployment rates by region and by rural and urban areas
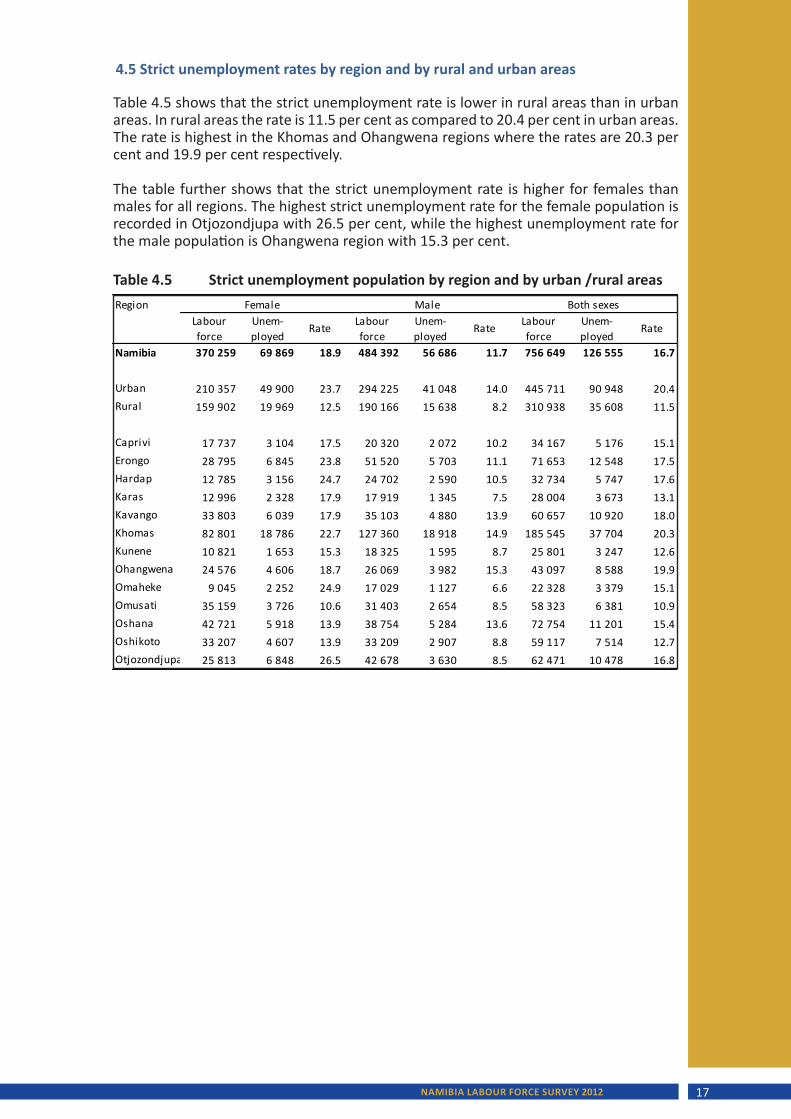
Table 4.5 shows that the strict unemployment rate is lower in rural areas than in urban areas. In rural areas the rate is 11.5 per cent as compared to 20.4 per cent in urban areas. The rate is highest in the Khomas and Ohangwena regions where the rates are 20.3 per cent and 19.9 per cent respectively.
The table further shows that the strict unemployment rate is higher for females than males for all regions. The highest strict unemployment rate for the female population is recorded in Otjozondjupa with 26.5 per cent, while the highest unemployment rate for the male population is Ohangwena region with 15.3 per cent.
24
Table 4.5 Strict unemployment population by region and by urban /rural areas
RegionLabour force
Unem-ployed
Rate Labour force
Unem-ployed
Rate Labour force
Unem-ployed
Rate
Namibia 370 259 69 869 18.9 484 392 56 686 11.7 756 649 126 555 16.7
Urban 210 357 49 900 23.7 294 225 41 048 14.0 445 711 90 948 20.4Rural 159 902 19 969 12.5 190 166 15 638 8.2 310 938 35 608 11.5
Caprivi 17 737 3 104 17.5 20 320 2 072 10.2 34 167 5 176 15.1Erongo 28 795 6 845 23.8 51 520 5 703 11.1 71 653 12 548 17.5Hardap 12 785 3 156 24.7 24 702 2 590 10.5 32 734 5 747 17.6Karas 12 996 2 328 17.9 17 919 1 345 7.5 28 004 3 673 13.1Kavango 33 803 6 039 17.9 35 103 4 880 13.9 60 657 10 920 18.0Khomas 82 801 18 786 22.7 127 360 18 918 14.9 185 545 37 704 20.3Kunene 10 821 1 653 15.3 18 325 1 595 8.7 25 801 3 247 12.6Ohangwena 24 576 4 606 18.7 26 069 3 982 15.3 43 097 8 588 19.9Omaheke 9 045 2 252 24.9 17 029 1 127 6.6 22 328 3 379 15.1Omusati 35 159 3 726 10.6 31 403 2 654 8.5 58 323 6 381 10.9Oshana 42 721 5 918 13.9 38 754 5 284 13.6 72 754 11 201 15.4Oshikoto 33 207 4 607 13.9 33 209 2 907 8.8 59 117 7 514 12.7Otjozondjupa 25 813 6 848 26.5 42 678 3 630 8.5 62 471 10 478 16.8
Female Male Both sexes
Table 4.5 Strict unemployment population by region and by urban /rural areas
NAMIBIA LABOUR FORCE SURVEY 201218
chapter 5: ECONOMICALLY INACTIVE POPULATION
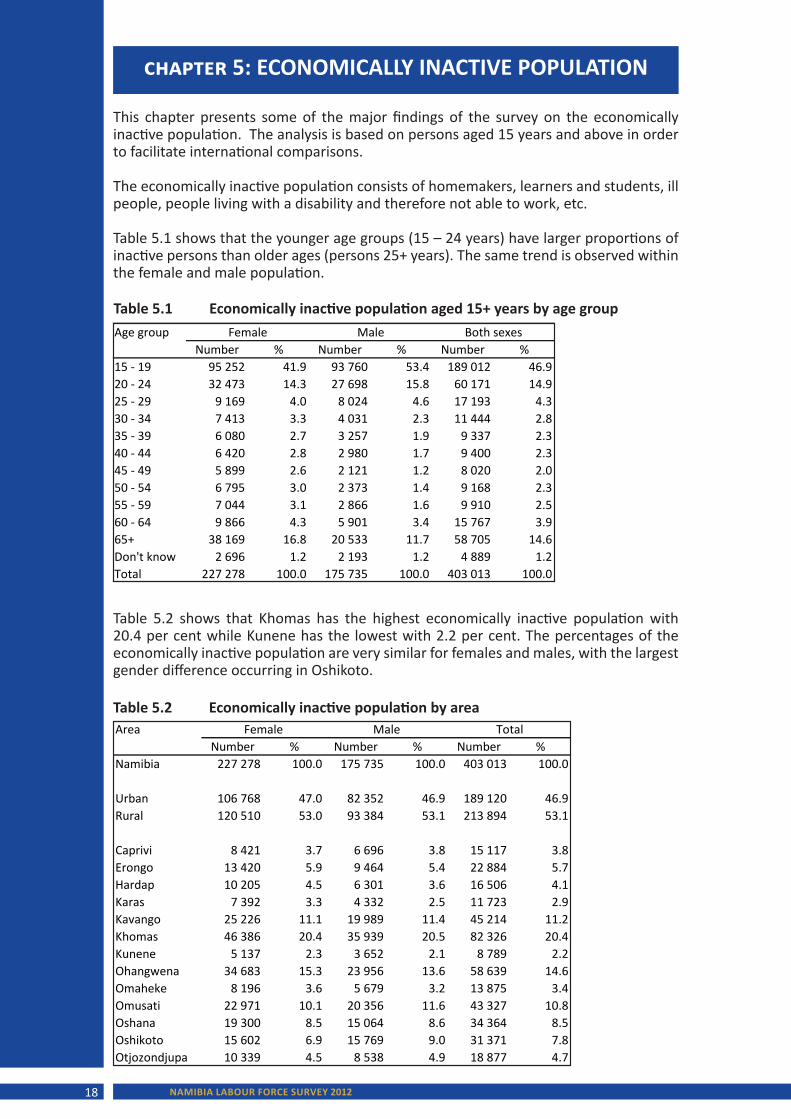
This chapter presents some of the major findings of the survey on the economically inactive population. The analysis is based on persons aged 15 years and above in order to facilitate international comparisons.
The economically inactive population consists of homemakers, learners and students, ill people, people living with a disability and therefore not able to work, etc.
Table 5.1 shows that the younger age groups (15 – 24 years) have larger proportions of inactive persons than older ages (persons 25+ years). The same trend is observed within the female and male population.
25
Table 5.1 Economically inactive population aged 15+ years by age group
Age groupNumber % Number % Number %
15 - 19 95 252 41.9 93 760 53.4 189 012 46.920 - 24 32 473 14.3 27 698 15.8 60 171 14.925 - 29 9 169 4.0 8 024 4.6 17 193 4.330 - 34 7 413 3.3 4 031 2.3 11 444 2.835 - 39 6 080 2.7 3 257 1.9 9 337 2.340 - 44 6 420 2.8 2 980 1.7 9 400 2.345 - 49 5 899 2.6 2 121 1.2 8 020 2.050 - 54 6 795 3.0 2 373 1.4 9 168 2.355 - 59 7 044 3.1 2 866 1.6 9 910 2.560 - 64 9 866 4.3 5 901 3.4 15 767 3.965+ 38 169 16.8 20 533 11.7 58 705 14.6Don't know 2 696 1.2 2 193 1.2 4 889 1.2Total 227 278 100.0 175 735 100.0 403 013 100.0
Female Male Both sexes
Table 5.2 shows that Khomas has the highest economically inactive population with 20.4 per cent while Kunene has the lowest with 2.2 per cent. The percentages of the economically inactive population are very similar for females and males, with the largest gender difference occurring in Oshikoto.
26
Table 5.2 Economically inactive population by area
AreaNumber % Number % Number %
Namibia 227 278 100.0 175 735 100.0 403 013 100.0
Urban 106 768 47.0 82 352 46.9 189 120 46.9Rural 120 510 53.0 93 384 53.1 213 894 53.1
Caprivi 8 421 3.7 6 696 3.8 15 117 3.8Erongo 13 420 5.9 9 464 5.4 22 884 5.7Hardap 10 205 4.5 6 301 3.6 16 506 4.1Karas 7 392 3.3 4 332 2.5 11 723 2.9Kavango 25 226 11.1 19 989 11.4 45 214 11.2Khomas 46 386 20.4 35 939 20.5 82 326 20.4Kunene 5 137 2.3 3 652 2.1 8 789 2.2Ohangwena 34 683 15.3 23 956 13.6 58 639 14.6Omaheke 8 196 3.6 5 679 3.2 13 875 3.4Omusati 22 971 10.1 20 356 11.6 43 327 10.8Oshana 19 300 8.5 15 064 8.6 34 364 8.5Oshikoto 15 602 6.9 15 769 9.0 31 371 7.8Otjozondjupa 10 339 4.5 8 538 4.9 18 877 4.7
Female Male Total
Table 5.1 Economically inactive population aged 15+ years by age group
Table 5.2 Economically inactive population by area
NAMIBIA LABOUR FORCE SURVEY 2012 19
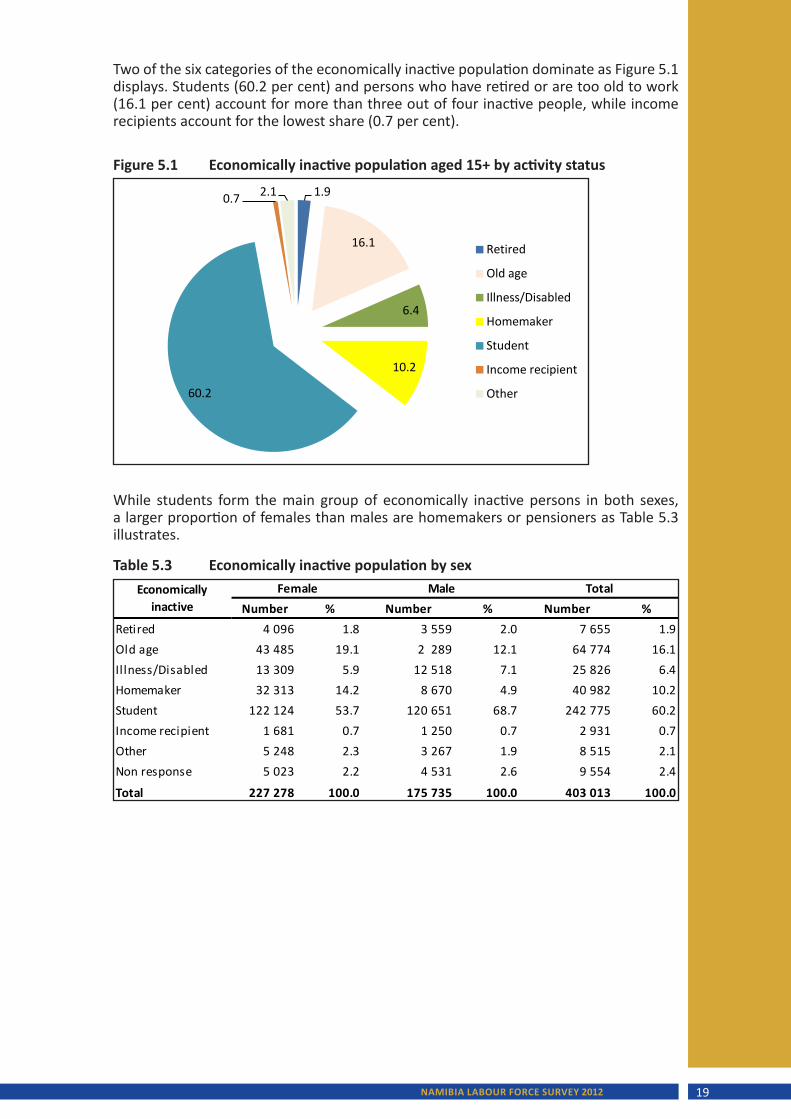
Two of the six categories of the economically inactive population dominate as Figure 5.1 displays. Students (60.2 per cent) and persons who have retired or are too old to work (16.1 per cent) account for more than three out of four inactive people, while income recipients account for the lowest share (0.7 per cent).
While students form the main group of economically inactive persons in both sexes, a larger proportion of females than males are homemakers or pensioners as Table 5.3 illustrates.
27
Figure 5.1 Economically inactive population aged 15+ by activity status
1.9
16.1
6.4
10.2
60.2
0.7 2.1
Retired
Old age
Illness/Disabled
Homemaker
Student
Income recipient
Other
28
Table 5.3 Economically inactive population by sex
Number % Number % Number %Retired 4 096 1.8 3 559 2.0 7 655 1.9Old age 43 485 19.1 2 289 12.1 64 774 16.1Illness/Disabled 13 309 5.9 12 518 7.1 25 826 6.4Homemaker 32 313 14.2 8 670 4.9 40 982 10.2Student 122 124 53.7 120 651 68.7 242 775 60.2Income recipient 1 681 0.7 1 250 0.7 2 931 0.7Other 5 248 2.3 3 267 1.9 8 515 2.1Non response 5 023 2.2 4 531 2.6 9 554 2.4
Total 227 278 100.0 175 735 100.0 403 013 100.0
Economically inactive
Female Male Total
Figure 5.1 Economically inactive population aged 15+ by activity status
Table 5.3 Economically inactive population by sex

NAMIBIA LABOUR FORCE SURVEY 201220
NAMIBIA LABOUR FORCE SURVEY 2012 21
ANNEXES
ANNEX A: METHODOLOGY A1. Introduction
This section of the NLFS 2012 report discusses the methodology adopted with regard to the execution of the survey.
The strength of the NLFS 2012 is that it has the largest coverage of any household survey in Namibia in recent times. It thus has more reliable statistics for the estimation of labour conditions for smaller geographical areas (in particular regions) in Namibia. The sample size was one of the main issues pointed out by the critics of the NLFS 2008. This increased by 65 per cent from 5 975 in 2008 to 9 108 households in 2012. The sampled PSUs also increased, by 47 per cent from 239 to 506.
In addition, the sampling errors are relatively small, as a result of improved methods of data collection using a combination of Geographical Information Systems (GIS) for identification of true boundaries of primary sampling units (PSUs) and households selected for the survey, as well as efficient geo-coding of the questionnaires during data capturing and processing. This ensures greater data integrity and reliability than any previous statistical survey in the country.
Furthermore, previous rounds of the NLFS used only two questions to determine the employment (and thus also unemployment) rate in the country. The NLFS 2012 used nine specific questions in order to capture more fully people engaged in work other than that as a remunerated employee or formal sector employer. The survey covered in addition a large range of employment-related variables, such as the number of people employed by each household as domestic workers, thus allowing cross-linking analyses to be undertaken.
One of the limitations of the NLFS 2012, as with other household-based surveys, is that the sample design does not guarantee adequate coverage of any industry, as the survey is household based and not industrially stratified. The NLFS coverage also omits dwelling units that are non-residential and others such as public or school hostels, army/police barracks, etc. Household members residing inside these public institutions are only included if they live in their own private accommodation. A2. Organisation and preparation
A2.1 Legal basis
The NLFS 2012 was conducted by the Namibia Statistics Agency under the Statistics Act, No.9 of 2011, which mandates the agency, among others, to constitute the central statistical authority of the country and to collect, produce, analyse and disseminate official and other statistics in Namibia. By virtue of this Act, the information collected was kept strictly confidential.
The NSA conducted the NLFS 2012 in close collaboration with the Ministry of Labour and Social Welfare (MoLSW) and other stakeholders that form part of the Namibia Statistics System.
A2.2 Organisational structure
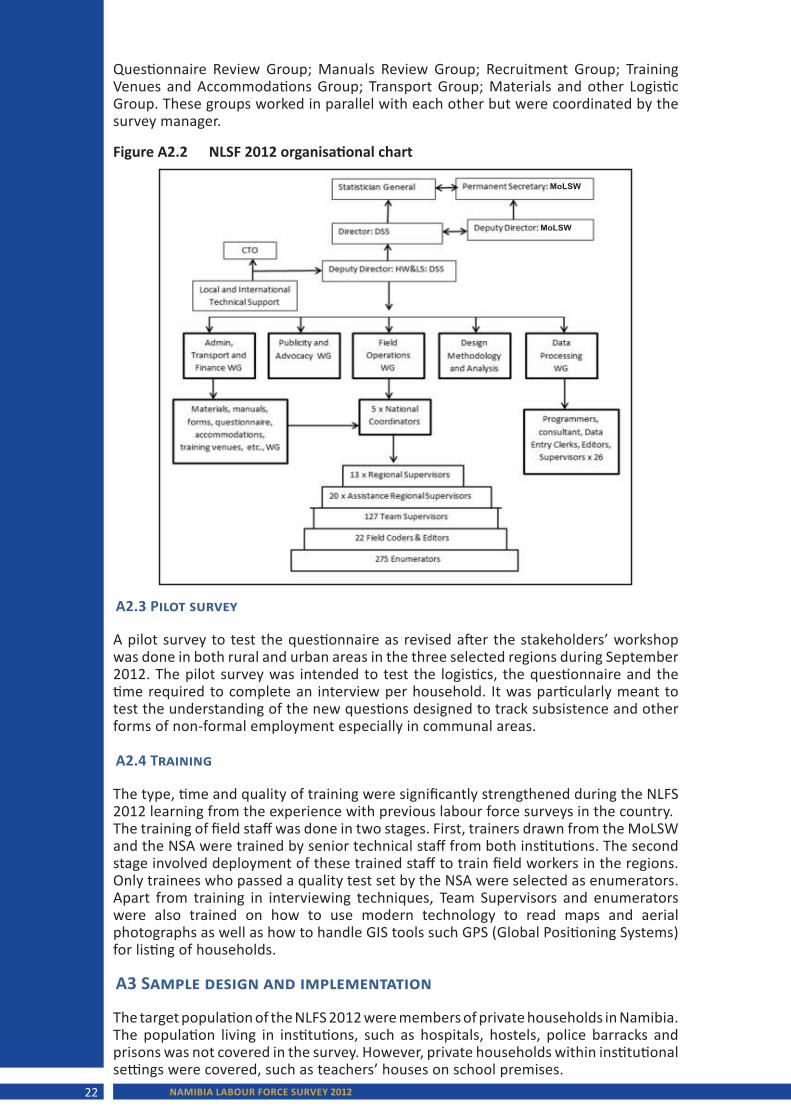
Various Technical Working Groups consisting of staff members from the NSA, the MoLSW, other line ministries and stakeholders were established from time to time to guide the entire project from planning to implementation. These included the
NAMIBIA LABOUR FORCE SURVEY 201222
Questionnaire Review Group; Manuals Review Group; Recruitment Group; Training Venues and Accommodations Group; Transport Group; Materials and other Logistic Group. These groups worked in parallel with each other but were coordinated by the survey manager.
A2.3 Pilot survey
A pilot survey to test the questionnaire as revised after the stakeholders’ workshop was done in both rural and urban areas in the three selected regions during September 2012. The pilot survey was intended to test the logistics, the questionnaire and the time required to complete an interview per household. It was particularly meant to test the understanding of the new questions designed to track subsistence and other forms of non-formal employment especially in communal areas.
A2.4 Training
The type, time and quality of training were significantly strengthened during the NLFS 2012 learning from the experience with previous labour force surveys in the country. The training of field staff was done in two stages. First, trainers drawn from the MoLSW and the NSA were trained by senior technical staff from both institutions. The second stage involved deployment of these trained staff to train field workers in the regions. Only trainees who passed a quality test set by the NSA were selected as enumerators.Apart from training in interviewing techniques, Team Supervisors and enumerators were also trained on how to use modern technology to read maps and aerial photographs as well as how to handle GIS tools such GPS (Global Positioning Systems) for listing of households.
A3 Sample design and implementation
The target population of the NLFS 2012 were members of private households in Namibia. The population living in institutions, such as hospitals, hostels, police barracks and prisons was not covered in the survey. However, private households within institutional settings were covered, such as teachers’ houses on school premises.
Figure A2.2 NLSF 2012 organisational chart
29
Figure A2.2 NLSF 2012 organisational chart
NAMIBIA LABOUR FORCE SURVEY 2012 23
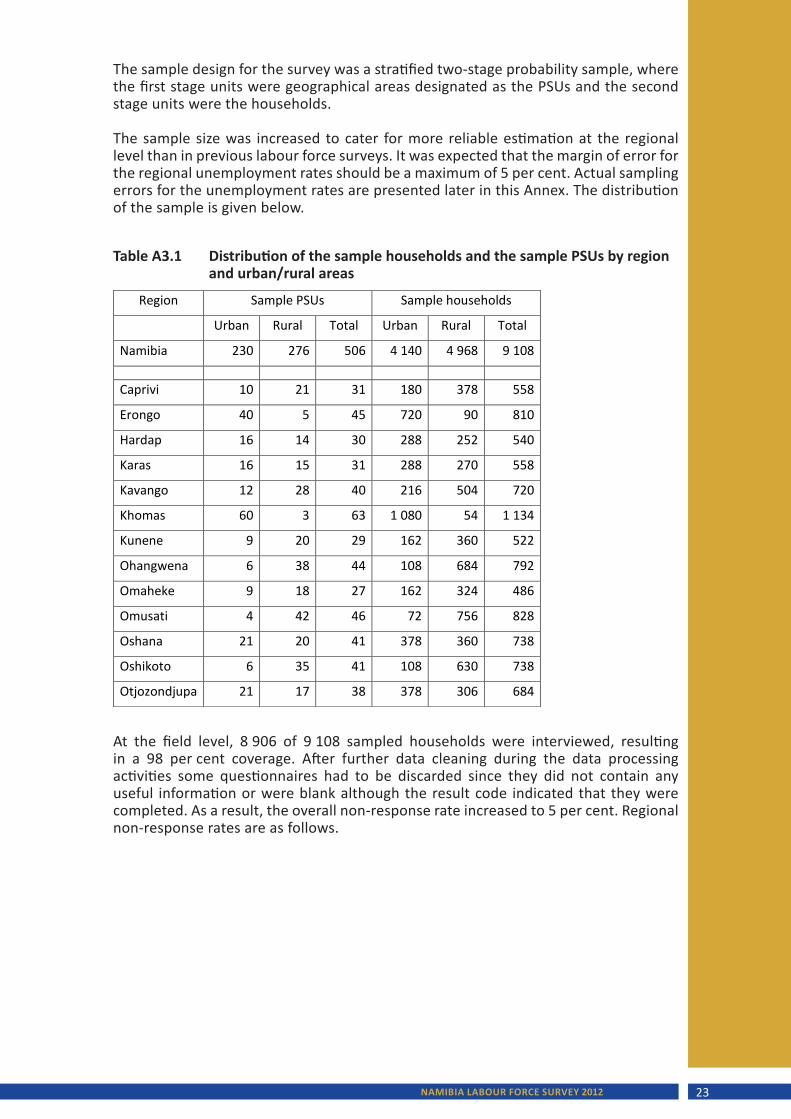
The sample design for the survey was a stratified two-stage probability sample, where the first stage units were geographical areas designated as the PSUs and the second stage units were the households.
The sample size was increased to cater for more reliable estimation at the regional level than in previous labour force surveys. It was expected that the margin of error for the regional unemployment rates should be a maximum of 5 per cent. Actual sampling errors for the unemployment rates are presented later in this Annex. The distribution of the sample is given below.
30
Table A3.1 Distribution of the sample households and the sample PSUs by region and urban/rural areas
Region Sample PSUs Sample households
Urban Rural Total Urban Rural Total
Namibia 230 276 506 4 140 4 968 9 108
Caprivi 10 21 31 180 378 558
Erongo 40 5 45 720 90 810
Hardap 16 14 30 288 252 540
Karas 16 15 31 288 270 558
Kavango 12 28 40 216 504 720
Khomas 60 3 63 1 080 54 1 134
Kunene 9 20 29 162 360 522
Ohangwena 6 38 44 108 684 792
Omaheke 9 18 27 162 324 486
Omusati 4 42 46 72 756 828
Oshana 21 20 41 378 360 738
Oshikoto 6 35 41 108 630 738
Otjozondjupa 21 17 38 378 306 684
At the field level, 8 906 of 9 108 sampled households were interviewed, resulting in a 98 per cent coverage. After further data cleaning during the data processing activities some questionnaires had to be discarded since they did not contain any useful information or were blank although the result code indicated that they were completed. As a result, the overall non-response rate increased to 5 per cent. Regional non-response rates are as follows.
Table A3.1 Distribution of the sample households and the sample PSUs by region and urban/rural areas
NAMIBIA LABOUR FORCE SURVEY 201224
A3.1 The master sample frame and stratification
The National Sampling Frame, which is maintained by the NSA, is based on the Enumeration Areas (EAs) of the 2011 Population and Housing Census and the households within the EAs. The frame was revised and updated in July 2011. The revised frame now has 6 104 EAs or Primary Sampling Units (PSUs). Each PSU consists of between 40 and 120 households.
The frame was stratified first by region, and then by urban/rural areas within each region. A probability sample of 506 PSUs was selected proportionately across the regions in the first stage using the probability proportional to size sampling procedure together with systematic sampling.
PSUs in the urban areas were further stratified implicitly into high, middle and low by ordering them according to the levels of living conditions and housing characteristics. Rural areas consist of communal and commercial areas as well as proclaimed settlements and these form the rural strata.
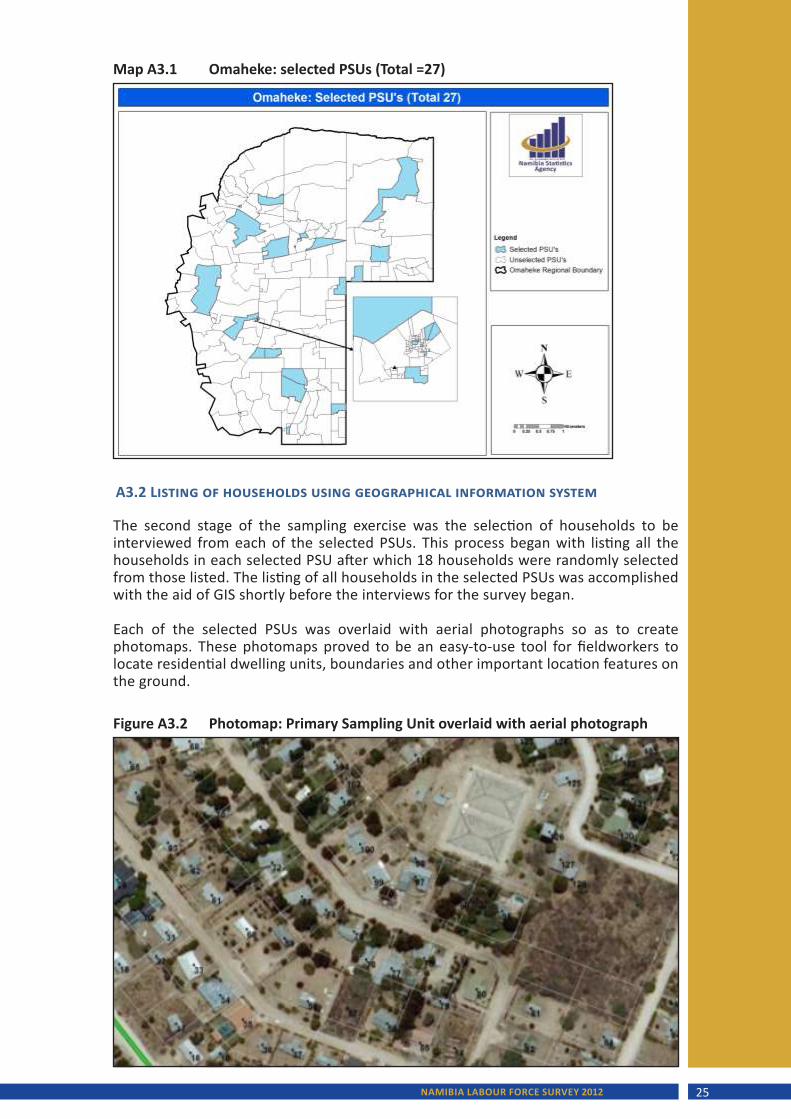
Within each region PSUs were selected randomly to achieve the number allocated for that region. For example, Map A3.1 shows how the 27 PSUs for the Omaheke region were spread across the region.
31
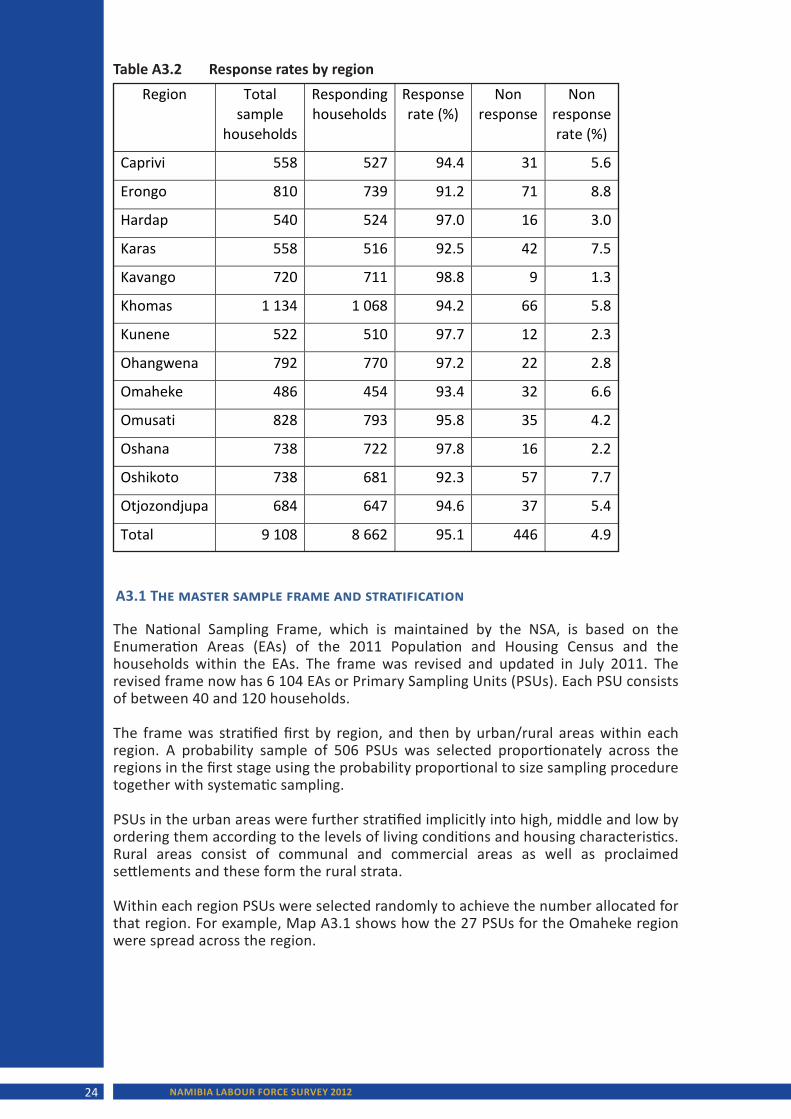
Table A3.2 Response rates by region
Region Total sample
households
Responding households
Response rate (%)
Non response
Non response rate (%)
Caprivi 558 527 94.4 31 5.6
Erongo 810 739 91.2 71 8.8
Hardap 540 524 97.0 16 3.0
Karas 558 516 92.5 42 7.5
Kavango 720 711 98.8 9 1.3
Khomas 1 134 1 068 94.2 66 5.8
Kunene 522 510 97.7 12 2.3
Ohangwena 792 770 97.2 22 2.8
Omaheke 486 454 93.4 32 6.6
Omusati 828 793 95.8 35 4.2
Oshana 738 722 97.8 16 2.2
Oshikoto 738 681 92.3 57 7.7
Otjozondjupa 684 647 94.6 37 5.4
Total 9 108 8 662 95.1 446 4.9
Table A3.2 Response rates by region
NAMIBIA LABOUR FORCE SURVEY 2012 25
A3.2 Listing of households using geographical information system
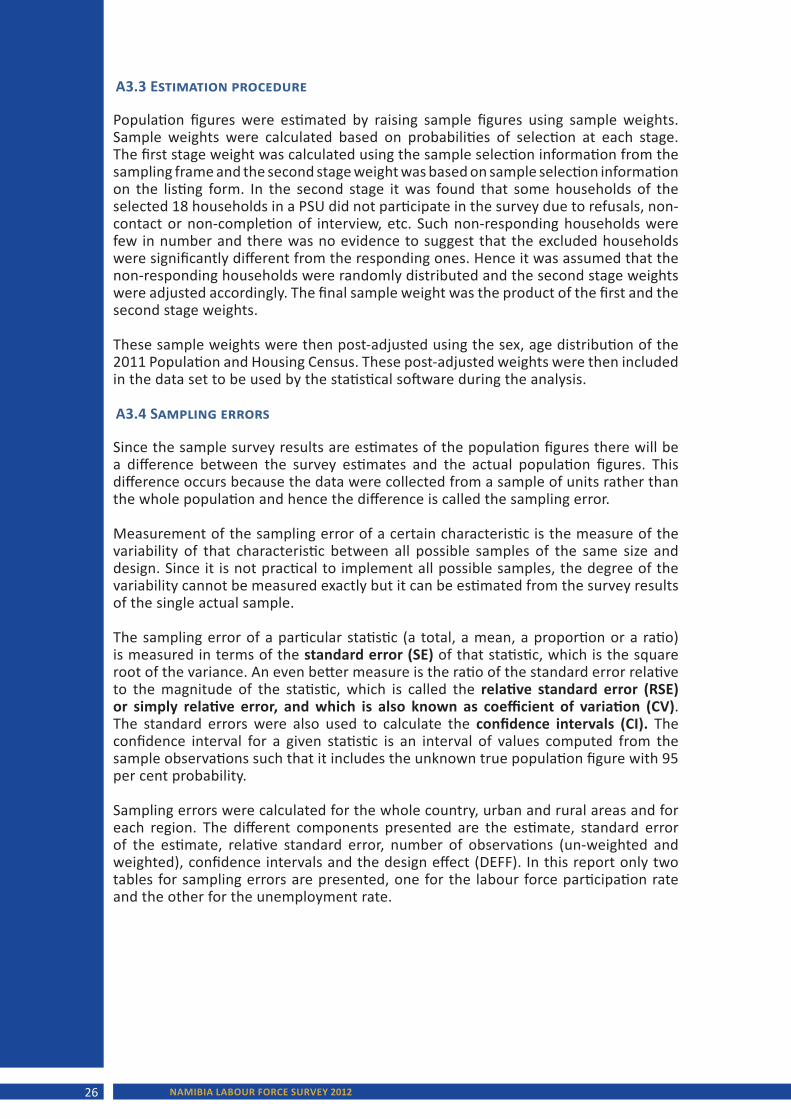
The second stage of the sampling exercise was the selection of households to be interviewed from each of the selected PSUs. This process began with listing all the households in each selected PSU after which 18 households were randomly selected from those listed. The listing of all households in the selected PSUs was accomplished with the aid of GIS shortly before the interviews for the survey began.
Each of the selected PSUs was overlaid with aerial photographs so as to create photomaps. These photomaps proved to be an easy-to-use tool for fieldworkers to locate residential dwelling units, boundaries and other important location features on the ground.
32
Map A3.1 Omaheke: selected PSUs (Total =27)
33
Figure A3.2 Photomap: Primary Sampling Unit overlaid with aerial photograph
Figure A3.2 Photomap: Primary Sampling Unit overlaid with aerial photograph
Map A3.1 Omaheke: selected PSUs (Total =27)
NAMIBIA LABOUR FORCE SURVEY 201226
A3.3 Estimation procedure
Population figures were estimated by raising sample figures using sample weights. Sample weights were calculated based on probabilities of selection at each stage. The first stage weight was calculated using the sample selection information from the sampling frame and the second stage weight was based on sample selection information on the listing form. In the second stage it was found that some households of the selected 18 households in a PSU did not participate in the survey due to refusals, non-contact or non-completion of interview, etc. Such non-responding households were few in number and there was no evidence to suggest that the excluded households were significantly different from the responding ones. Hence it was assumed that the non-responding households were randomly distributed and the second stage weights were adjusted accordingly. The final sample weight was the product of the first and the second stage weights.
These sample weights were then post-adjusted using the sex, age distribution of the 2011 Population and Housing Census. These post-adjusted weights were then included in the data set to be used by the statistical software during the analysis.
A3.4 Sampling errors
Since the sample survey results are estimates of the population figures there will be a difference between the survey estimates and the actual population figures. This difference occurs because the data were collected from a sample of units rather than the whole population and hence the difference is called the sampling error.
Measurement of the sampling error of a certain characteristic is the measure of the variability of that characteristic between all possible samples of the same size and design. Since it is not practical to implement all possible samples, the degree of the variability cannot be measured exactly but it can be estimated from the survey results of the single actual sample.
The sampling error of a particular statistic (a total, a mean, a proportion or a ratio) is measured in terms of the standard error (SE) of that statistic, which is the square root of the variance. An even better measure is the ratio of the standard error relative to the magnitude of the statistic, which is called the relative standard error (RSE) or simply relative error, and which is also known as coefficient of variation (CV). The standard errors were also used to calculate the confidence intervals (CI). The confidence interval for a given statistic is an interval of values computed from the sample observations such that it includes the unknown true population figure with 95 per cent probability.
Sampling errors were calculated for the whole country, urban and rural areas and for each region. The different components presented are the estimate, standard error of the estimate, relative standard error, number of observations (un-weighted and weighted), confidence intervals and the design effect (DEFF). In this report only two tables for sampling errors are presented, one for the labour force participation rate and the other for the unemployment rate.
NAMIBIA LABOUR FORCE SURVEY 2012 27
34
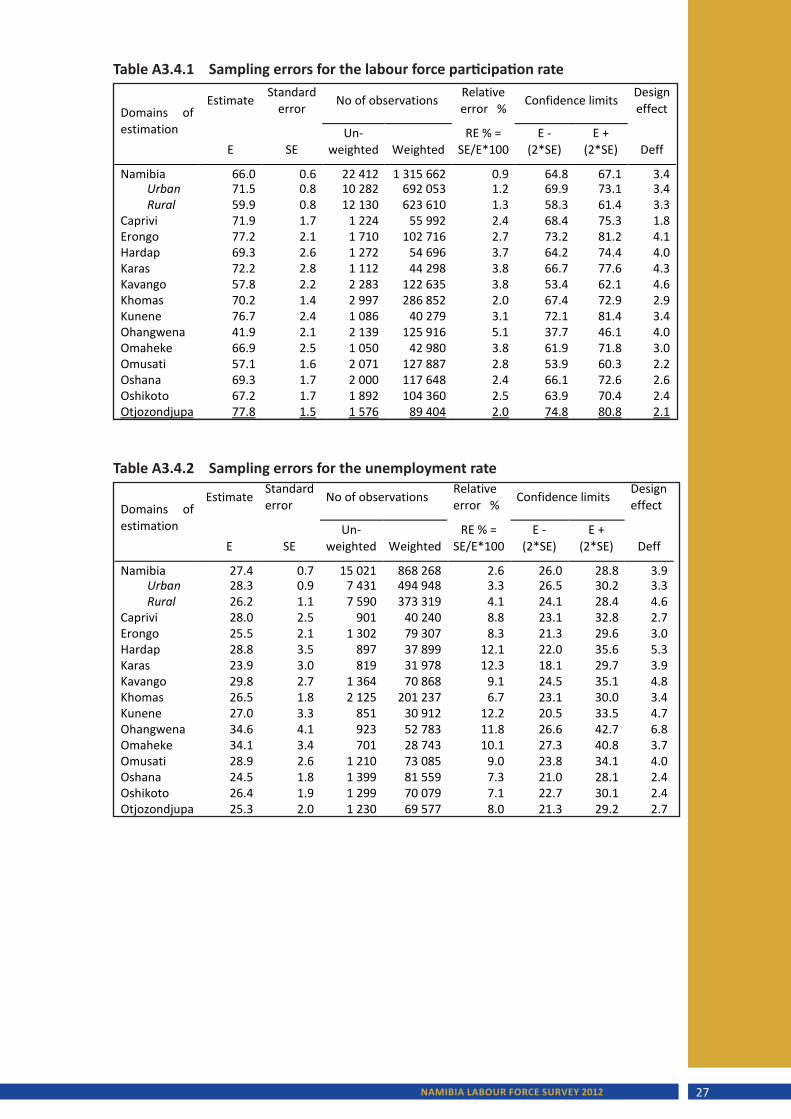
Table A3.4.1 Sampling errors for the labour force participation rate
Domains of estimation
Estimate Standard error No of observations Relative
error % Confidence limits Design effect
E SE Un-
weighted Weighted RE % =
SE/E*100 E -
(2*SE) E +
(2*SE) Deff
Namibia 66.0 0.6 22 412 1 315 662 0.9 64.8 67.1 3.4 Urban 71.5 0.8 10 282 692 053 1.2 69.9 73.1 3.4 Rural 59.9 0.8 12 130 623 610 1.3 58.3 61.4 3.3
Caprivi 71.9 1.7 1 224 55 992 2.4 68.4 75.3 1.8 Erongo 77.2 2.1 1 710 102 716 2.7 73.2 81.2 4.1 Hardap 69.3 2.6 1 272 54 696 3.7 64.2 74.4 4.0 Karas 72.2 2.8 1 112 44 298 3.8 66.7 77.6 4.3 Kavango 57.8 2.2 2 283 122 635 3.8 53.4 62.1 4.6 Khomas 70.2 1.4 2 997 286 852 2.0 67.4 72.9 2.9 Kunene 76.7 2.4 1 086 40 279 3.1 72.1 81.4 3.4 Ohangwena 41.9 2.1 2 139 125 916 5.1 37.7 46.1 4.0 Omaheke 66.9 2.5 1 050 42 980 3.8 61.9 71.8 3.0 Omusati 57.1 1.6 2 071 127 887 2.8 53.9 60.3 2.2 Oshana 69.3 1.7 2 000 117 648 2.4 66.1 72.6 2.6 Oshikoto 67.2 1.7 1 892 104 360 2.5 63.9 70.4 2.4 Otjozondjupa 77.8 1.5 1 576 89 404 2.0 74.8 80.8 2.1
35
Table A3.4.2 Sampling errors for the unemployment rate
Domains of estimation
Estimate Standard error No of observations Relative
error % Confidence limits Design effect
E SE Un-
weighted Weighted RE % =
SE/E*100 E -
(2*SE) E +
(2*SE) Deff
Namibia 27.4 0.7 15 021 868 268 2.6 26.0 28.8 3.9 Urban 28.3 0.9 7 431 494 948 3.3 26.5 30.2 3.3 Rural 26.2 1.1 7 590 373 319 4.1 24.1 28.4 4.6
Caprivi 28.0 2.5 901 40 240 8.8 23.1 32.8 2.7 Erongo 25.5 2.1 1 302 79 307 8.3 21.3 29.6 3.0 Hardap 28.8 3.5 897 37 899 12.1 22.0 35.6 5.3 Karas 23.9 3.0 819 31 978 12.3 18.1 29.7 3.9 Kavango 29.8 2.7 1 364 70 868 9.1 24.5 35.1 4.8 Khomas 26.5 1.8 2 125 201 237 6.7 23.1 30.0 3.4 Kunene 27.0 3.3 851 30 912 12.2 20.5 33.5 4.7 Ohangwena 34.6 4.1 923 52 783 11.8 26.6 42.7 6.8 Omaheke 34.1 3.4 701 28 743 10.1 27.3 40.8 3.7 Omusati 28.9 2.6 1 210 73 085 9.0 23.8 34.1 4.0 Oshana 24.5 1.8 1 399 81 559 7.3 21.0 28.1 2.4 Oshikoto 26.4 1.9 1 299 70 079 7.1 22.7 30.1 2.4 Otjozondjupa 25.3 2.0 1 230 69 577 8.0 21.3 29.2 2.7
Table A3.4.2 Sampling errors for the unemployment rate
Table A3.4.1 Sampling errors for the labour force participation rate
NAMIBIA LABOUR FORCE SURVEY 201228
Relative standard errors for the labour force participation rate are less than 5 per cent across all the regions indicating that the sample sizes were large enough to produce reliable estimates. The relative standard errors for the unemployment rate are between 5 and 10 per cent for some regions while for the others it is between 10 and 15 per cent. Margin of errors will be less than 5 per cent for the first set of regions while it is between 5 and 10 per cent for the second set. In this case the expected margins of error of 5 per cent was not achieved for some of the regions with this sample size indicating that it was not large enough to cover the variation in those regions with the error margin required. The regional estimates with this margin of error can still be used, but with some caution because of the wider confidence interval.
A4 Publicity and community mobilisation
A Working Group on Publicity and Advocacy was established with the broad goal of providing the nation with accurate, timely and relevant information on the purpose of the survey; when and how the survey would be done; and what the NSA expected of the general public. A comprehensive publicity programme was put in place from the onset aimed at reducing non-response.
A5. Data processing and quality assurance
Questionnaires were scanned using sophisticated scanners built with Optical Character Recognition and Optical Mark Recognition capabilities. All the scanned questionnaires were stored as images onto the server. In order to enhance the data quality and control, scanning software was configured with data validation checks and data verification checks before data were transferred to the database. This included checks for un-interpreted data values and incorrect data values. Identified errors were corrected through a verification process which involved manual confirmation by an operator. The operator sat in front of the PC and could verify and confirm the scanned data with the data from the saved images of the questionnaires.
Finally, scanned data were transferred to a designated database for advanced data validation and consistency checks.
The advanced data validation process aimed to ensure that data were clean, correct and useful for the statistician to complete the analysis.
A5.1 Quality assurance
To ensure the data quality and comparisons, concepts and definitions were kept the same. Experiences of similar surveys were taken into consideration and this has brought the following improvements in the methodology of the Namibia Labour Force Survey 2012.
The sample size was increased from 5 975 to 9 108 households. The Primary Sampling Units also were raised from 239 to 506. This resulted in a better coverage so that the representation of different characteristics was improved. The questions on the labour force characteristics were also expanded to nine in order to improve the coverage of such activities. There was intensive training for the field staff and the field work supervision and monitoring activities were also expanded. The data processing system was designed to ensure the quality of data and this was done with the assistance of an external expert.
NAMIBIA LABOUR FORCE SURVEY 2012 29
ANNEX B: LABOUR FORCE CONCEPTS AND DEFINITIONS
Type of economic activity
Type of activity referred to the economic activity status of the respondents during the reference period. A person was regarded as having worked if he/she worked even for one hour for pay, profit or family gain during that period. Students who, while studying, were at the same time engage in any paid, self-employment or any economic activity were considered as having worked.
The following are the definitions of the various categories of economic activity status used:
(i) Worked: This referred to all persons aged 15 years and above who were engaged in paid work or self-employment or who worked for family gain.
(ii) Did not work but had job or business: This category referred to persons who had worked in their present jobs, but who were temporarily not at work during the reference period due to sickness, vacation, drought, unpaid leave, mechanical or electrical breakdown at work place, or reduction in economic activity, etc., provided they had assurance to return to work after the short absence. Farmers and farm workers who were not working because of drought were also classified under this category.
(iii) Students: This category referred to persons who were attending school during the reference period and were not engaged in any paid or self-employment and were also not available for work.
(iv) Homemakers: This category referred to persons, male and female, who during the reference period were wholly engaged in household duties and were neither engaged in any form of paid or self-employment nor worked for family gain, and who were also not available for work.
(v) Income recipients: This category referred to persons who were not in any paid or self-employment during the reference period but who received income from rents and investments.
(vi) Disabled: Persons who were not in any paid or self-employment and were also not available for work because of their disability or handicap were classified under this category. However, disabled persons who were in paid or self-employment were classified as worked. Similarly disabled persons who were looking for work or available for work were classified as unemployed (worked before) or unemployed (first time job seeker) as applicable.
(vii) Retired/old age: This category referred to persons who were retired or pensioned and were not in any form of paid or self-employment or available for work. This category also included persons who were not working because of old age. Retired persons who were engaged in any form of paid or self-employment were classified as worked.
(viii) Other: All other persons engaged in activities not classified in the above mentioned were classified in this category e.g., prisoners, etc.
NAMIBIA LABOUR FORCE SURVEY 201230
Employer refers to a person who operates his or her own economic enterprise or engages independently in a profession or trade, and hires one or more paid employees.
Employee refers to a person who works for a public or private employer and receives remuneration in wages, salary, commission, piece rates, or pay in kind.
Industry refers to the type of activity carried out, goods produced, services provided or business carried out at the work place where respondents worked (if worked) or previously worked (if unemployed), during the reference period.
Occupation refers to the kind of work done and the main duties performed at the respondent.
Own account worker refers to a person who operates his or her own economic enterprise or engages independently in a profession or trade, and hires no paid employees.
Status in employment refers to the status of those who were working or had jobs but did not work during the reference period in relation to their employment, i.e. whether they were working as an employer, own account worker, employee or unpaid family worker etc.
Unpaid family worker refers to a person who works without pay in an economic enterprise operated by a related member of the same household (including peasant farmers).

NAMIBIA LABOUR FORCE SURVEY 2012 31
-------------------------------------------------------------------------------------------------------------------------------------------------------------------------------------------------------------------------------------------------------------------------------------------------------------------------------------------------------------------------------------------------------------------------------------------------------------------------------------------------------------------------------------------------------------------------------------------------------------------------------------------------------------------------------------------------------------------------------------------------------------------------------------------------------------------------------------------------------------------------------------------------------------------------------------------------------------------------------------------------------------------------------------------------------------------------------------------------------------------------------------------------------------------------------------------------------------------------------------------------------------------------------------------------------------------------------------------------------------------------------------------------------------------------------------------------------------------------------------------------------------------------------------------------------------------------------------------------------------------------------------------------------------------------------------------------------------------------------------------------------------------------------------------------------------------------------------------------------------------------------------------------------------------------------------------------------------------------------------------------------------------------------------------------------------------------------------------------------------------------------------------------------------------------------------------------------------------------------------------------------------------------------------------------------------------------------------------------------------------------------------------------------------------------------------------------------------------------------------------------------------------------------------------------------------------------------------------------------------------------------------------------------------------------------------------------------------------------------------------------------------------------------------------------------------------------------------------------------------------------------------------------------------------------------------------------------------------------------------------------------------------------------------------------------------------------------------------------------------------------------------------------------------------------------------------------------------------------------------------------------------------------------------------------------------------------------------------------------------------------------------------------------------------------------------------------------------------------------------------------------------------------------------------------------------------------------------------------------------------------------------------------------------------------------------------------------------------------------------------------------------------------------------------------------------------------------------------------------------------------------------------------------------------------------------------------------------------------------------------------------------------------------------------------------------------------------------------------------------------------------------------------------------------------------------------------------------------------------------------------------------------------------------------------------------------------------------------------------------------------------------------------------------------------------------------------------------------------------------------------------------------------------------------------------------------------------------------------------------------------------------------------------------------------------------------------------------------------------------------------------------------------------------------------------------------------------------------------------------------------------------------------------------------------------------------------------------------------------------------------------------------------------------------------------------------------------------------------------------------------------------------------------------------------------------------------------------------------------------------------------------------------------------------------------------------------------------------------------------------------------------------------------------------------------------------------------------------------------------------------------------------------------------------------------------------------------------------------------------------------------------------------------------------------------------------------------------------------------------------------------------------------------------------------------------------------------------------------------------------------------------------------------------------------------------------------------------------------------------------------------------------------------------------------------------------------------------------------------------------------------------------------------------------------------------------------------------------------------------------------------------------------------------------------------------------------------------------------------------------------------------------------------------------------------------------------------------------------------------------------------------------------------------------------------------------------------------

NAMIBIA LABOUR FORCE SURVEY 201232 NAMIBIA LABOUR FORCE SURVEY 2012
P.O.Box 2133
FGI House, Post Street Mall
Windhoek, Namibia
Tel: +264 61 431 3200
Fax: +264 61 431 3253 | +264 61 431 3240
Website: www.nsa.org.na
P.O.Box 2133
FGI House, Post Street Mall
Windhoek, Namibia
Tel: +264 61 431 3200
Fax: +264 61 431 3253 | +264 61 431 3240
Website: www.nsa.org.na
NAMIBIA LABOUR FORCE SURVEY 2012
P.O.Box 2133
FGI House, Post Street Mall
Windhoek, Namibia
Tel: +264 61 431 3200
Fax: +264 61 431 3253 | +264 61 431 3240
Website: www.nsa.org.na
P.O.Box 2133
FGI House, Post Street Mall
Windhoek, Namibia
Tel: +264 61 431 3200
Fax: +264 61 431 3253 | +264 61 431 3240
Website: www.nsa.org.na