longer-term global oil supply volumes and composition · pira energy group longer-term global oil...
TRANSCRIPT

PIRA Energy Group
Longer-Term Global Oil Supply Volumes And Composition
Bill FullerSenior Director, International Oil
Annual Retainer Client SeminarNew York City: October 10-11, 2013

Overview and Non-OPEC Supplies

Call-on-OPEC Crude Continues to Grow in LongTerm But Non-OPEC Covers Most of Demand Growth
0.0
0.5
1.0
1.5
2.0
'00-'05 '05-'10 '10-'15 '15-'20 '20-'25 '25-'30
Total Non-OPEC Call on OPEC Crude Supply Growth Demand Growth
Non-OPEC Growth includes increasing amounts of higher cost non-conventionals
Annual Growths, MMB/D

World Oil Non-OPEC Supply Forecast Overview
Medium Term (to 2017):Non-OPEC Growth 2013 – 2017 Averages 1.4 MMB/D
– U.S. and Canada have strongest growth– Growth is relatively stable over the years thru 2017
Longer Term (to 2030):Non-OPEC Growth declines slightly to average 1.0 MMB/D / Year 2020-2030
– U.S. and Canada remain in lead group which becomes more broad based as Brazil, Mexico, FSU, China and OPEC NGL’s grow
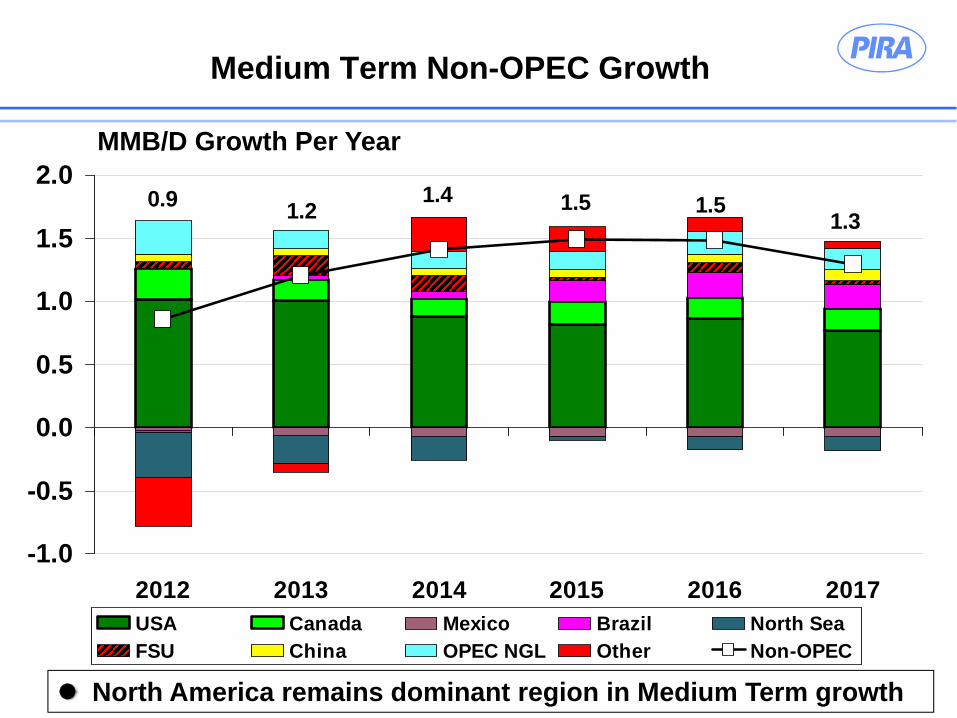
Medium Term Non-OPEC Growth
1.30.9 1.2 1.51.51.4
-1.0
-0.5
0.0
0.5
1.0
1.5
2.0
2012 2013 2014 2015 2016 2017USA Canada Mexico Brazil North SeaFSU China OPEC NGL Other Non-OPEC
MMB/D Growth Per Year
North America remains dominant region in Medium Term growth

Medium Term Non-OPEC Growth Components
Development of Shale Liquids; especially strong in U.S.
Also growing in Canada; slow beginning outside North America
Canada: Bitumen projects are economic at forecast price
Brazil: Development of already discovered sub salt fields
Kazakhstan: Start up of giant Kashagan field
OPEC NGL/Condensate: Recovery of liquids from associated
gas from crude expansion projects and from non-associated gas
projects

Long Term Non-OPEC GrowthContinues Strong But Less U.S. Centric
1.0
1.1
0.7 1.0
1.31.1
-0.5
0.0
0.5
1.0
1.5
'00-'05 '05-'10 '10-'15 '15-'20 '20-'25 '25-'30
USA Canada Mexico Brazil North SeaFSU China OPEC NGL Other Non-OPEC
MMB/D Growth Per Year

Factors Leading to Continued StrongNon-OPEC Production In the Long Term
Perceptions of evolution of oil market prices
“Easy” oil (i.e., low cost oil) used up
– Next increment of world resource base more expensive, supporting higher
oil prices
Higher oil price supports new higher cost projects
Technological advances; as spurred on by higher prices
Shale liquids; Oil Sands; Ultra-deep water; Sub-salt imaging
Investment climate good in countries at forefront of technology
Huge resource base for Shale liquids and Canadian oil sands
Increasing Natural Gas production provides associated liquids
High ratio oil to gas prices provides incentives for liquids recovery
Russian tax/duty incentives to develop new frontiers; ESPO pipeline

U.S. Shale Play Operators Improvising to ReapCost and Volume Improvements
More wells per rig» Cutting single well spud-to-spud times» Pad drilling (Multiple wells from one pad) reduces time to move rigs to
new locations
More wells per acre» Earlier 640 acre spacing being tested to reduction to 320 or 160» Some loss in single well recovery, but overall higher recovery
Initial production (IP) rates improving from longer laterals and higher horsepower fracing
Expanding into new areas / counties within formations» More activity now in Northern end of Niobrara shale
Developing deeper layers of existing shale plays» Bakken: Three Forks Benches 2-4; Permian Basin: Wolfcamp / Cline

U.S. Shale Crude Peaks at Over 6 MMB/DAbout 2025 – Peak Growth Year is 2013
0
1
2
3
4
5
6
7
2005 2010 2015 2020 2025 2030
MMB/D
Bakken Eagle FordPermian Basin Others
-0.2-0.10.00.10.20.30.40.50.60.70.8
'05-'10 '10-'15 '15-'20 '20-'25 '25-'30
MMB/D
Bakken Eagle FordPermian Basin Others

Lower 48 Onshore Crude Production Ex Shale CrudeGrows to 2020 Due To Resurgence in Permian Basin
0
1
2
3
4
5
6
1990 1995 2000 2005 2010 2015 2020 2025 2030
Lower48 Onshore ex Shale L48 ex Shale ex Permian
MMB/D
1998/99 Oil Price Collapse (Asian Financial Crisis)
2009 Price Fall (Global Recession)
L48 Onshore ex Shale Crude
Resurgence of Permian Basin Non-Shale Crude
Non-Shale Non-Permian Production

Crude Growth in Permian Basin Mainly from ShalesBut Non-Shale Crude Remains Larger Component
0.0
0.5
1.0
1.5
2.0
2.5
3.0
2005 2010 2015 2020 2025 2030TX Permian Non-Shale NM Permian Non-ShaleTX Permian Shale Crude NM Permian Shale Crude
MMB/D
Total Non-Shale
Growth in Non-Shale crude reflects growth in rigs drilling vertically

U.S. Gulf of Mexico Forecast AssumesBacklog of New Fields Begin Production
0.0
0.5
1.0
1.5
2.0
2.5
1995 2000 2005 2010 2015 2020 2025 2030
Fields Started Before 2013 Identified New Unidentified New
MMB/D
Unidentified “New”
(Post-2013) Production
Decline rates of “Older” production (Pre-2013) estimated at ~16%/Yr
Macondo spill April 2010 led to increased regulations
Identified Named Fields
Cost escalation and storm loss dented output in 2000’s decade
New GOM output highs reflect:Higher oil prices since 2010Good resource potentialTechnological advancesGood fiscal environmentLack cheaper alternatives

Alaska Production Expected to Grow After 2025
0.0
0.2
0.4
0.6
0.8
1.0
1.2
1.4
1.6
1.8
1990 1995 2000 2005 2010 2015 2020 2025 2030
Cook Inlet Existing North Slope New Named FieldsNew NPR-A New Central New Ugnu HeavyFederal Offshore Shale Crude ANWR
MMB/D

U.S. NGL Production Almost Doubles by 2030With Large Growth in Ethane
0
1
2
3
4
5
6
2010 2015 2020 2025 2030
Barnett Marcellus/UticaEagle Ford Anadarko/OtherPermian Bakken/RockiesOther Shales Non-Shale
0
1
2
3
4
5
6
2010 2015 2020 2025 2030Pentanes+ ButanesPropane Ethane
By Source By GradeMMB/D MMB/D

U.S. Total Oil Supply Growth Remains Strong in Medium Term then Tapers off Long Term
02468
101214161820
1990 2000 2010 2020 2030
MMB/D
Shale Crude Shale NGL Non-Shale Crude On.Non-Shale Crude Off. Non-Shale NGL BiofuelsOther Liquids Refinery Gain
-0.4
-0.2
0.0
0.2
0.4
0.6
0.8
1.0
95-0
0
00-0
5
05-1
0
10-1
5
15-2
0
20-2
5
25-3
0
MMB/DProduction Growth

Canadian Total Crude Growth is Mainly Oil SandsAnd Remains Strong Both Medium Term and Long Term
0
1
2
3
4
5
6
7
1990 2000 2010 2020 2030
Heavy Light/MediumAtlantic SyntheticBitumen Condensate
Production
-50
0
50
100
150
200
250
'95-
'00
'00-
'05
'05-
'10
'10-
'15
'15-
'20
'20-
'25
'25-
'30
Heavy Light/MediumAtlantic SyntheticBitumen Condensate
Growth / YearMMB/D MB/D
Light Includes Shale Crude

Canada Oil Sands Projects –Breakevens and Forecast Volume Discounts
CAPEX($Cdn/bbl
of capacity, Cdn$2010)
Economic Threshold(WTI US$
equivalent/bbl, US$2010)
1 - Mining, Extraction and Upgrading
$85,000-$105,000
$85-$95
2 - Mining and Extraction Only (No upgrading)
$60,000-$75,000
$65-$75
3 - Steam-assisted Gravity Drainage (SAGD)/Cyclic Steam Stimulation (CSS)
$25,000-$40,000
$50-$60
Includes an after-tax rate of return of 10 to 15%.
Source: Canada National Energy Board (NEB) Nov2011

Canada Risked Shale / Tight Oil Resource Base -Estimated Ultimately Recoverable Reserves (EUR)
0
2
4
6
8
10
12 Bn Bbls, Crude & CondensateTotal Canada Crude &
Condensate EUR 68 Bn Bbls

Canada Shale Crude Production
0100200300400500600700800900
1000
2005 2010 2015 2020 2025 2030
MB/D
Bakken VikingCardium MontneyDuvernay Other ProducingNew Probable New Possible
-100
10203040506070
'00-
'05
'05-
'10
'10-
'15
'15-
'20
'20-
'25
'25-
'30
MB/D
Bakken VikingCardium MontneyDuvernay Other ProducingNew Probable New Possible
Production Growth

FSU Crude Production Gains Result fromKashagan Field in Kazakhstan and Shale Crude In Russia
0
2
4
6
8
10
12
14
16
1990 2000 2010 2020 2030
Russia KazakhstanAzerbaijan Other FSUShale Crude
MMB/D MMB/D Growth
-0.1
0.0
0.1
0.2
0.3
0.4
0.5
0.6
0.7
0.8
95-0
0
00-0
5
05-1
0
10-1
5
15-2
0
20-2
5
25-3
0
Russia KazakhstanAzerbaijan Other FSUTotal
Shale Crude
Production

China Crude Oil Production is Expected to Grow Faster After 2020 Due to Shale Crude
0
1
2
3
4
5
6
1990 2000 2010 2020 2030Daqing ShengliChangqing YanchangXinjiang Other OnshoreOffshore Shale Crude
MMB/D
-50
0
50
100
150
200
'00-
'05
'05-
'10
'10-
'15
'15-
'20
'20-
'25
'25-
'30
Daqing ShengliChangqing YanchangXinjiang Other OnshoreOffshore Shale Crude
MB/DProduction Growth
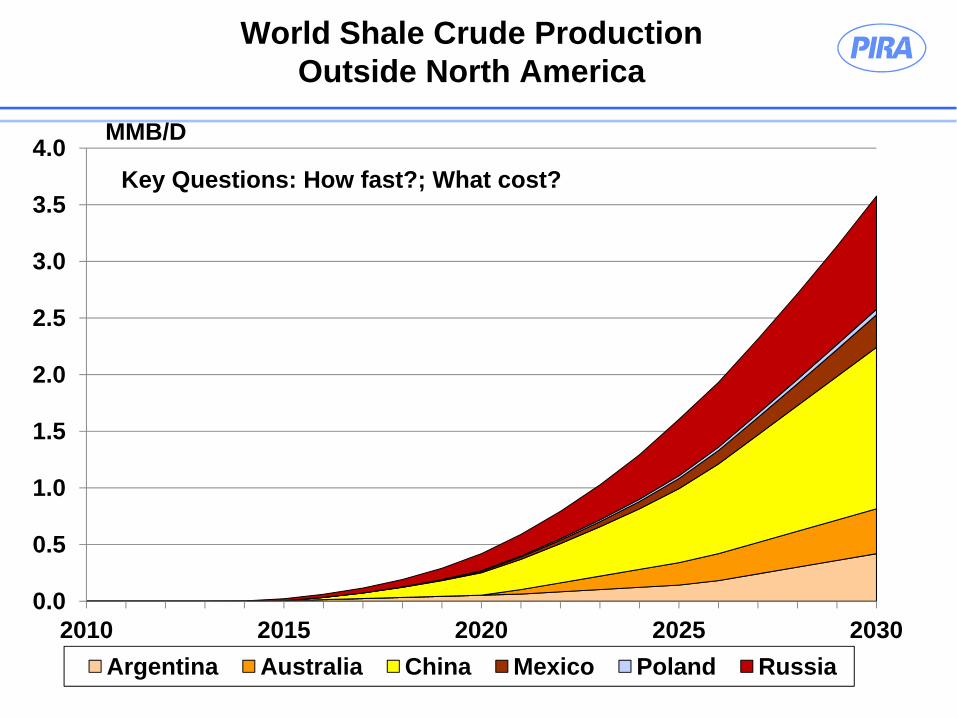
World Shale Crude Production Outside North America
0.0
0.5
1.0
1.5
2.0
2.5
3.0
3.5
4.0
2010 2015 2020 2025 2030Argentina Australia China Mexico Poland Russia
MMB/D
Key Questions: How fast?; What cost?

Argentina Vaca Muerta Shale
History / EventsYPF discovery well drilled Nov 2010; drilled 51 wells Jun12-Jul13Ryder Scott assessed ~22 Bn BblsOE Feb12 in part of Vaca MuertaYPF reported production for Jul13 of ~12 MBoe/D (crude ~8 MB/D)Argentina Ministry has not reported increased “Vacas Muertas” production; PIRA has not included YPF’s reported production in our data pending confirmation from Ministry
YPF / Chevron AgreementYPF and Chevron sign $1.24 billion agreement Jul13 to invest in developing a portion of the Vaca Muerta
Pilot program of 100 wellsFull development program ~1500 wellsTarget production in 5 years of 50 MB/D oil and 3 million cm/d gas
PIRA ForecastCurrently assuming Argentina shale crude production starts 2015
Production gradually climbs to 200 MB/D 2030

0
20
40
60
80
100
120
1990 1995 2000 2005 2010 2015 2020 2025 2030
MMB/D
Shale Crude Shale NGL Onshore CrudeOffShore Crude Canada Oil Sands Non-Shale NGLBiofuels Other Liquids Refinery Gain
31 MMB/D
Consolidated Long Range Supply
Shale Crude
35

Strong Initial Growth Rate for Light SweetLessens in Longer Term
Production
0102030405060708090
100
1990 2000 2010 2020 2030Lt Sweet Lt SourMed Sweet Med SourHvy Sweet Hvy SourShale Crude
MMB/D MMB/D
-0.5
0.0
0.5
1.0
1.5
2.0
'00 -'05
'05 -'10
'10 -'15
'15 -'20
'20 -'25
'25 -'30
Lt Sweet Lt SourMed Sweet Med SourHvy Sweet Hvy SourTotal Growth
Growth

PIRA Energy Group
Longer-Term Global Oil Supply Volumes And Composition
Dr. James MasonSenior Analyst, Global Oil
Annual Retainer Client SeminarNew York City: October 10-11, 2013

World Shale Resource Assessment

PIRA’s World Shale Oil Database:58 Countries; 89 Petroleum Basins; 180 Shale Plays
PIRA’s List of Prospective Shale Oil Plays Identified from Analyses of World Petroleum Sedimentary Basins

Many Shale Formations Were Formed by Marine Sediments Rich in Organic Matter
Bakken
AnadarkoWoodford
Marcellus
PermianWoodford
Example: U.S. Bakken, Marcellus, and Woodford Shale FormationsFormed from Marine Sediments 400 Million Years Ago
Most of U.S. Under Water

Geology of Petroleum Sedimentary Basins
Organic Sediments Settle to Floor of Bowl Shaped Basins
With Burial Depth Organic Sediments Compact Into Shale Layers
Example: Williston Basin and the Bakken Shale Formation
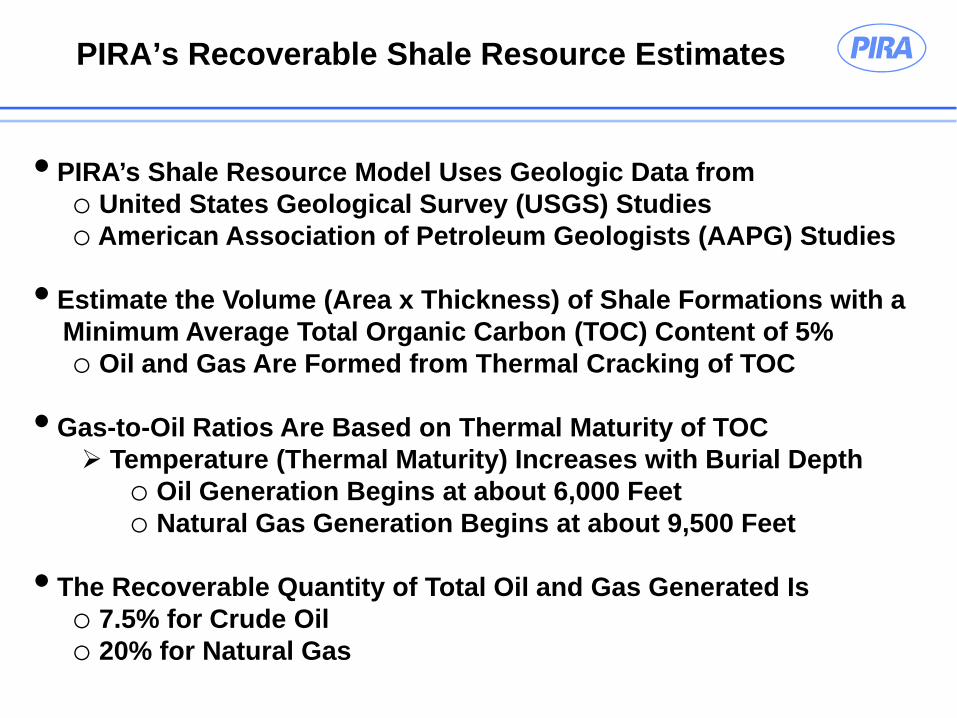
PIRA’s Recoverable Shale Resource Estimates
• PIRA’s Shale Resource Model Uses Geologic Data fromo United States Geological Survey (USGS) Studieso American Association of Petroleum Geologists (AAPG) Studies
• Estimate the Volume (Area x Thickness) of Shale Formations with aMinimum Average Total Organic Carbon (TOC) Content of 5%o Oil and Gas Are Formed from Thermal Cracking of TOC
• Gas-to-Oil Ratios Are Based on Thermal Maturity of TOCTemperature (Thermal Maturity) Increases with Burial Depth
o Oil Generation Begins at about 6,000 Feeto Natural Gas Generation Begins at about 9,500 Feet
• The Recoverable Quantity of Total Oil and Gas Generated Is o 7.5% for Crude Oilo 20% for Natural Gas
PIRA’s Risked Shale Resource Estimates
Risked Shale Resource Estimates
• Initial Shale Resource Estimates Are Unrisked
• Unrisked Resource Estimates Are Adjusted by a Risk Factor
• Assignment of Risk Factors:o Confidence Level in the Quality of Geologic Knowledgeo Drilling History of Shale Formations
• PIRA Reports Risked Resource Estimates
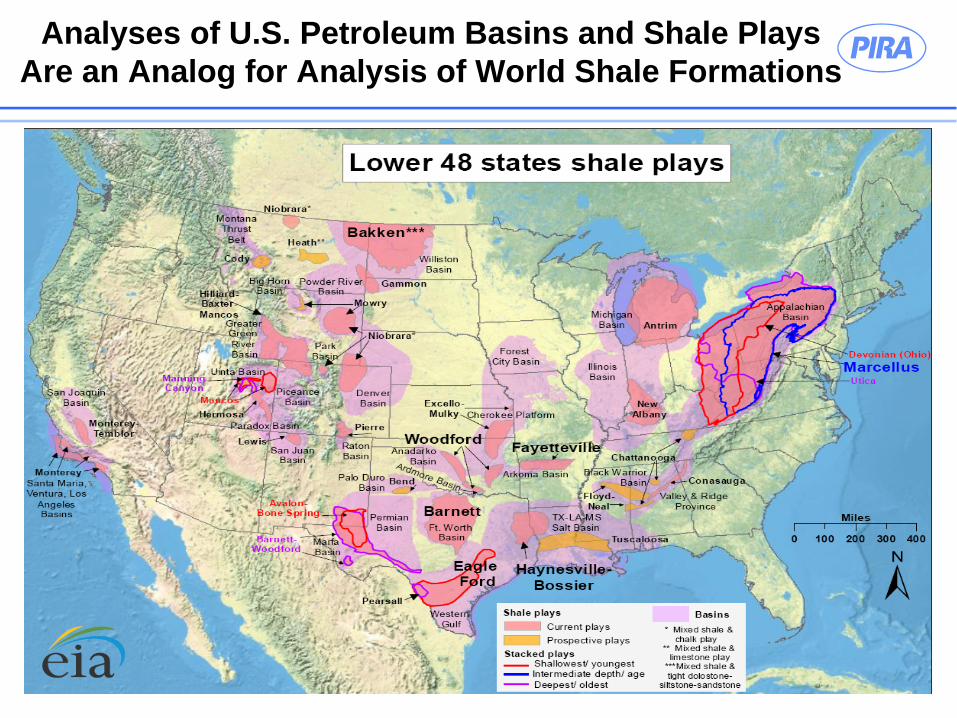
Analyses of U.S. Petroleum Basins and Shale Plays Are an Analog for Analysis of World Shale Formations

U.S. Shale Play Characteristics Are an Analog for Evaluation of World Shale Oil Plays
Geology of Bazhenov Shale Formation Is Similar to Bakken Shale Formationo Mineral Content (Brittleness) o Water Contento Natural Fracture Networks
Bazhenov Shale Has Above Average TOC Content (> 5%)
Highly Prospective Shale Oil Play.
Bazhenov Shale, West Siberia, Russia Compared with U.S. Shale Plays
BazhenovShale (Aqua)
West Siberian Basin
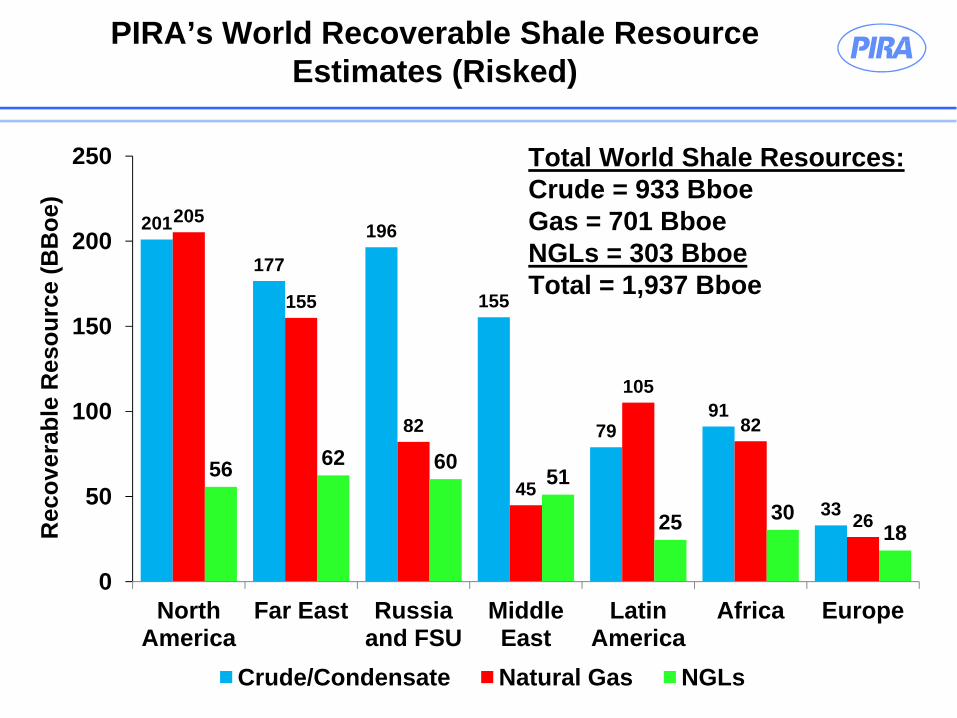
PIRA’s World Recoverable Shale Resource Estimates (Risked)
201
177
196
155
7991
33
205
155
82
45
105
82
26
56 62 6051
25 3018
0
50
100
150
200
250
North America
Far East Russia and FSU
Middle East
Latin America
Africa Europe
Rec
over
able
Res
ourc
e (B
Boe
)
Crude/Condensate Natural Gas NGLs
Total World Shale Resources:Crude = 933 BboeGas = 701 BboeNGLs = 303 BboeTotal = 1,937 Bboe

0%20%40%60%80%
100%
1990
1992
1994
1996
1998
2000
2002
2004
2006
2008
2010
2012
2014
2016
2018
2020
Ado
ptio
n
Classic Innovation-Adoption S-Curve
WolfcampMarcellus
Eagle FordBakken
Barnett
• U.S. Adoption of Horizontal, Hydraulic Fracturing (HHF) Well Technology for Shale Production Took Over Ten Years toDemonstrate First Economic Success (Barnett)
• Requires Application of Sophisticated and Costly TechnologyApplied by Experienced HHF Drilling & Completion Companies
• World Shale Development Is Not Expected to Occur Rapidly
Cracking the Code:Adoption of Horizontal, Hydraulic Fracturing (HHF)

Countries with Advanced Shale Oil Exploration Programs
• Russiao Russian E&P Companies Are Drilling > 400 HHF Wells o Russian Drilling Companies Order $9 bn of High-Spec Drilling
Rigs That Are Capable of Drilling Shale HHF Wellso Russian E&P Companies Are Forming JV’s with Foreign E&P
Companies to Gain Knowledge about Shale Drilling and Fracking
• Chinao Demonstration Projects for Shale HHF Drilling in 19 Zoneso Focus on Multi-Well Pad Drilling to Minimize Well Footprinto Foreign Companies Are Signing Production Sharing Contracts
• Argentinao YPF Drilling ~ 100 Shale HHF Exploratory Wells in Vaca Muertao YPF Finalized $1.2 bn Joint Venture with Chevron

Countries with Initial Shale Oil Exploration Programs
• Australiao Large Shale Oil Potential but Shale Oil Formations Are Located
in Remote and Unexplored Petroleum Basins
• Colombiao Good Initial HHF Well Flow Rates in Eastern Cordillera Basin’s
La Luna Shale
• Polando Shale Oil Wells Being Drilled in Eastern Poland – Horizontal
Fracking Pending
• United Kingdomo First Exploratory Shale Oil Well Being Drilled in Southern
England
• Other Countries:o Romania, Mexico, South Africa, Ukraine, Turkey, Lithuania,
Brazil, Kuwait, Saudi Arabia, and Germany

Shale Recoverable Resource Estimates (Risked)for Countries with Nearest Term Potential
143
89 7047
10 7 4
59
27112
24
5
73
47
21
35
16 3
0
50
100
150
200
250
300
Russia Australia China Argentina Colombia Mexico UK
Estim
ated
Ulti
mat
e R
ecov
ery
(Bbo
e)
Crude/Condensate Natural Gas and Casinghead Gas NGLs

PIRA Energy Group
Longer-Term Global Oil Supply Volumes And Composition
Glenn SchwartzSenior Analyst, Emissions and Clean Energy
Annual Retainer Client SeminarNew York City: October 10-11, 2013

International Fracking Regulation Discussion

Overview
Key drivers for global shale oil productionCan the U.S. boom be reproduced?
Key Policy Developments in major shale resource
potential countries in past year.
China
Russia
Argentina
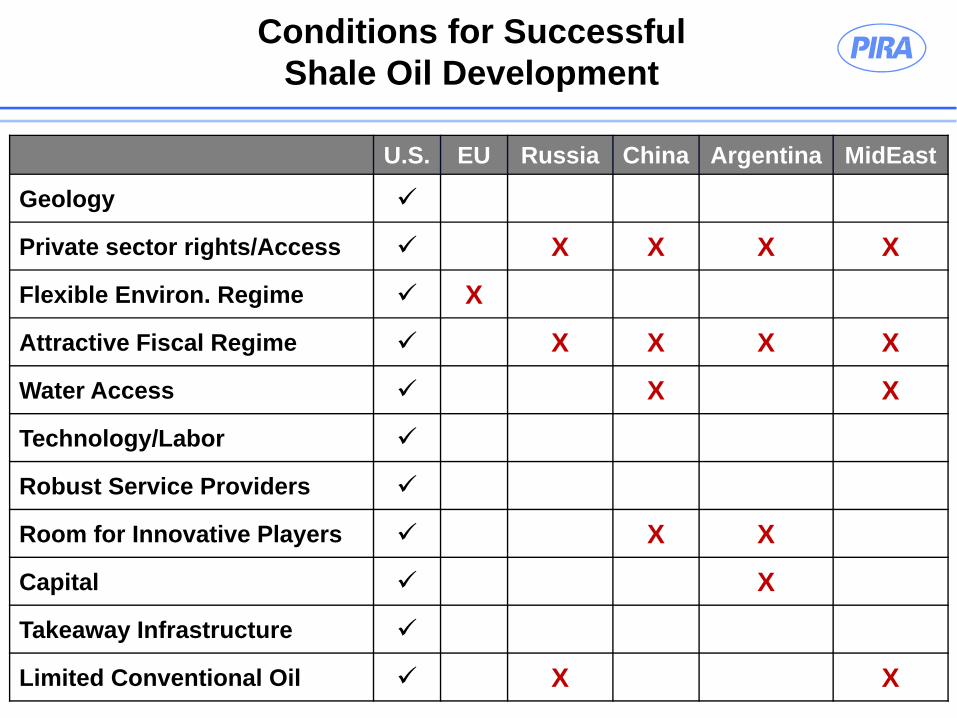
Conditions for Successful Shale Oil Development
U.S. EU Russia China Argentina MidEast
Geology
Private sector rights/Access X X X X
Flexible Environ. Regime X
Attractive Fiscal Regime X X X X
Water Access X X
Technology/Labor
Robust Service Providers
Room for Innovative Players X X
Capital X
Takeaway Infrastructure
Limited Conventional Oil X X

Land Rights – Another Key Difference
Land rights. U.S. is fairly unique in that subsurface mineral rights belong to private landowners. Elsewhere, owned by the State» Pros: only need one large negotiated production sharing contract (PSC)
with Energy Minister.» Cons: Public opinion becomes much more important as citizens see
same problems, but less direct benefit. – Political decisions move more slowly than private ones.
» China – less of an issue – gov’t option to relocate landowners.– BUT overlapping land use rights an issue.
» Russia – less of an issue – biggest shale deposits in sparsely populated areas.
» Argentina – Emerging issue. Local population (especially indigenous people) already instituting law suits, local bans.

Role of Foreign Investment
Some local deficiencies can be offset with foreign investment» Skilled labor, technology, know-how all exist in U.S.
– Producers and/or service companies» Money/investment is needed.» A good portion of drilling rig growth must come from foreign sources.» Technology acquisition a driver of China’s investment in U.S. shale
development.Tax Incentives being used to stimulate foreign investment.Difficulties» Importing expertise increases cost of shale development.» Risk-adjusted profitability must be high enough to draw investment
and expertise from North America» Shale industry requires flexibility on the part of operators.

Russia
Previous tax structure thought to be unworkable to justify developing increased costs associated with shale production.
Tax Incentives passed by the Duma in July (effective Sep 1, 2013). Producers get degrees of exemption from the Mineral Extraction Tax (MET).» Coefficient changes and becomes more favorable depending on degree
of difficulty of oil extraction. Taking into account depth, permeability, etc.
» Siberia’s Bazhenov formation (which contains huge shale oil reserves) as well as several other unconventional plays are 100% exempt for a period of 15 years.
New structure helps mitigate investment risks and compensates for significant capital expenditure associated with shale oil development.

Argentina
In July, Pres. Kirchner issued a Presidential Decree to incentivize foreign investment in oil and nat gas exploration.
That decree grants:» All companies that invest > $1B over 5 years gain the ability to export
20% of their crude and nat gas production after the 5th year without paying export duties.
» Freedom to access the foreign currency market at real market value.» The ability to keep earnings in foreign exchange outside Argentina
(other companies are required to repatriate their earnings).» Guaranteed international prices for crude sold on the local market
when obliged to sell locally to meet local demand.

China
Auction Leasing Policy Struggling to Find Success» First two auctions (June 2012, Jan 2013) of shale leasing rights
limited to state-owned companies. » Issue:
– PetroChina, Sinopec etc. reluctant to bear the risk or expense for uncertain returns; Have already experienced hefty exploration costs for low output in pilot drilling. Current/ongoing conventional projects far more attractive.
– Smaller companies offer entrepreneurial spirit, but lack skills, resources. (Many 2nd auction winners had no ties whatsoever to oil/gas industry)
» Third Auction planned – will they change criteria to encourage bids by companies with the relevant technology and experience in drilling for oil and gas?
Drilling has commenced, but chances of hitting FYP targets are remote.

Elsewhere
Europe – EU currently. has no regs, studies on whether to require Environmental Impact Assessments (EIA) ongoing. Right now, entirely regulated at members-state level.» France – moratorium. but pressure to lift mounting?» UK – government published proposals for a new tax regime designed to
incentivize the shale gas industry.» Poland – Recent law exempts drilling of up to 5,000 meters if it is away
from dwellings and drinking water from EIA.
Australia» Currently producing shale gas, but not oil. » Northern Territory’s “use it or lose it” policy to stimulate development.» Attempts at moratorium by Greens in Parliament, but voted down.

Conclusions
U.S. above-ground conditions will be difficult to duplicate elsewhere.
Foreign development will be slower, less efficient, and more costly.
But policy steps have been taken and will likely support production given the enormous potential.
PIRA Energy Group
Longer-Term Global Oil Supply Volumes And Composition
Miriam LevyDirector, Political Risk
Annual Retainer Client SeminarNew York City: October 10-11, 2013

Implications For and From OPEC

OPEC Crude Requirement Grows in the Longer Term, But Remains Flat for the Next Several Years
0
20
40
60
80
100
120
1995 2000 2005 2010 2015 2020 2025 2030Non-OPEC Conventional Non-OPEC UnconventionalOPEC Other OPEC CrudeNon-OPEC Shale Liquids
Global Liquids Supply (MMB/D)
30
15
313031
35
28

Potentially Difficult Period Ahead for OPECAnd for Saudi in Particular
0
5
10
15
20
25
30
35
40
2010
2011
2012
2013
2014
2015
2016
2017
2018
2019
2020
2021
2022
2023
2024
2025
2026
2027
2028
2029
2030
Saudi Kuwait/UAE Iran Iraq Other
OPEC Crude Production (MMB/D)

(500)(400)(300)(200)(100)
0 100 200 300 400 500 600
'00-'05 '05-'10 '10-'15 '15-'20 '20-'25 '25-'30
Latin America
W. Africa
Other MENA
Libya
Iraq
Iran
Kuwait/UAE
Saudi Arabia
Net Growth
0.3 0.2 0.1 0.3 0.3 0.3
5-Year Average Annual Capacity Growth (MMB/D)
Post-2015, Annual OPEC Capacity Growth Of 0.3 MMB/D Contributes to Flat Call on Saudi

…But OPEC Capacity Growth Is Not Assured:Capacity Has Declined 1.5 MMB/D Since 2008
OPEC Production
OPEC Spare
0
5
10
15
20
25
30
35
40MMB/D
OPEC Capacity

0.0 0.5 1.0 1.5 2.0 2.5 3.0 3.5 4.0 4.5 5.0
Feb-08 Forecast Current Forecast
Forecast OPEC Capacity in 2020 (MMB/D)
Excluding Iraq, Down 4.6 MMB/D
Forecast 2020 Non-Saudi OPEC Capacity Is Down 3.6 MMB/D from Forecast Five Years Ago

0
500
1,000
1,500
2,000
2,500
3,000
Major OPEC Supply Losses (MMBbl)
* Disruptions limited to two years cumulative impact on capacity.
Iran 1951/54*Suez 195657
Iraq Gaps 1997/03Nigeria Unrest 1999/00Kuwait Fire 2002/03Ven Strike 2002/03*Iraq War 2003*Nigeria Violence 2007/08Libya Civil War 2011Iran Sanctions 2012/13Libya Protests 2013
Iraq 1966/671967 WarNigeria 1967/68Libya 1970/71Algeria 19711973 Embargo
Iran Rev. 1978/79Iran/Iraq 1980*Iraq/Syria 1982/83*
Gulf War 1990/91*
OPEC Supply Capacity Disruptions:Unpredictable But Certain… And More Frequent?

Impact of Disruptions Often Lasts Well Beyond Immediate Production Losses
02468
Iran (MMB/D)
01234
Iraq (MMB/D)
01234
Libya (MMB/D)
01234
Venezuela (MMB/D)
Iran (MMB/D) Iraq (MMB/D)
Libya (MMB/D) Venezuela (MMB/D)

In Reference Case, Disruptions Diminish Over Time And Planned Future Capacity Growth Is Discounted
Current disruptions will slowly recede over timeIranLibyaNigeria
Planned capacity growth is discounted, especially in countries at high risk for disruptions
VenezuelaIraq
Potential for surprise to upside if situations improve faster than expected
Could create strategic dilemma for OPEC, especially Saudi Arabia

Iran Sanctions Cause Production Losses and Capacity Declines Through 2020
2.0 2.2 2.4 2.6 2.8 3.0 3.2 3.4 3.6 3.8 4.0 Downside
Sanctions prove difficult to evade and/or unwindDamage to reservoirs from forced shut-ins worse than anticipatedPolitical climate prevents foreign investment even if sanctions liftedMilitary action
UpsideQuick, effective deal allows removal of sanctions and quick return of oil to marketSanctions easier to evade over time even without explicit removal
Iran Production and Sanctions Impact (MMB/D)
Production
Crude not sold as a result of
sanctions
Risks to Iranian Production Outlook

Libyan Production Returns Gradually as Political Disputes Continue, Particularly in Eastern Libya
0.0 0.2 0.4 0.6 0.8 1.0 1.2 1.4 1.6 1.8 2.0
Libya Production and Disruptions (MMB/D)
Production
Civil War and Protests
Risks to Libyan Production Outlook
DownsideCurrent political protests devolve into civil war Cutting off oil sales becomes status quo in political negotiationsCentral power vacuum allows extremists to further establish themselves and destabilize country
UncertainEastern Libya attempts to sell oil independently
UpsideFaster resolution of protests and renewed efforts to create stable, democratic, central government

Theft in Nigeria Continues to Damage Infrastructure, But Some Stolen Crude Sold on Black Market
0.0
0.5
1.0
1.5
2.0
2.5
3.0
Nigeria Production and Disruptions (MMB/D)
Production
Black Market Crude Sales
Risks to Nigerian Outlook
DisruptionsDownside
Theft worsens, causing more prolonged pipeline closures and field shut-insResurgence of MEND militant group prior to or after 2015 Nigerian presidential electionPetroleum Industry Bill (PIB) never passes, foreign investment wanes
UpsideCorruption and theft reduced or eradicatedPIB passes with favorable terms for foreign investment

Difficult Economic and Political Dynamics in Venezuela Could Limit Pace of Orinoco Development
0.0
0.5
1.0
1.5
2.0
2.5
3.0
3.5
4.0
Venezuela Production and Disruptions (MMB/D)
Conventional
Losses from Upgrader
Maintenance
Risks to Venezuelan Outlook
Blended Extra Hvy
Syncrude
DownsideAcceleration of conventional decline rates and increased upgradermaintenanceCurrent economic difficulties become a full-blown crisis, reducing or deterring foreign investmentPolitical crisis prior to or during 2018 Presidential election
UpsideNext administration (2018 or earlier) pursues more open economic policies

0
2
4
6
8
10
12
14
16
2012 2013 2014 2015 2016 2017 2018 2019 2020Rumaila West Qurna-1 Kurdish Fields MajnoonWest Qurna-2 Kirkuk & Other NOC Zubair HalfayaMissan Gharaf Other South Fields PIRA Forecast
Planned Capacity Additions vs. PIRA Forecast (MMB/D)
In Iraq, PIRA Forecast Calls for Less Than 20% Of the Planned Capacity Additions by 2020

Field Operator
Prior Target
(MMB/D)
New Target
(MMB/D)TargetYear
Recent Output
(MMB/D) Recent Delays
Rumaila BP 2.85 2.10* 2016 1.33
West Qurna 1 XOM 2.83 1.80* 2016 0.45
Majnoon Shell 1.80 1.20* 2017 0.20175 MB/D restart target delayed from end-2012 to 4Q13
West Qurna 2 Lukoil 1.80 1.20 2017 0.00 Startup in Feb/Mar-
14, not 4Q13Zubair Eni 1.13 0.85 2016 0.32
Badra Gazprom, et al. 0.17
60 MB/D startup target delayed from Aug-13 to 2Q14
*Reported targets from ongoing negotiations between government and operators. Official targets remain unchanged.
Iraq Already Slipping from Original Contract Timelines And Reducing Production Plateaus

0.0
2.0
4.0
6.0
8.0
10.0
12.0
Saudi Production (MMB/D) OPEC Strategy Implications
OPEC dilemma: market share vs. price?
Higher non-OPEC productionIncreased OPEC capacitySlower demand growth
Unique Saudi position: Can absorb lower price with higher volumes, but…
… Other OPEC members will experience revenue loss,… Budget requirements are growing
Shale could help set limits on price
Reduced Call on OPEC Could Create Difficult Strategic Choices for OPEC and Saudi

Saudi Arabia Requires Higher Oil Prices To Balance Its Budget
0
50
100
150
200
250
3% Annual Spending Growth (2013 Budget)8% Annual Spending Growth14% Annual Spending Growth (5-yr avg)
Breakeven Price (Nominal $/Bbl Brent)

0
20
40
60
80
100
120
140
2007 2009 2011 2012 2013
Oil Price Requirements for Key Exporters Have Almost Doubled Since 2007
Required Breakeven Oil Prices ($/Bbl Brent)

0
20
40
60
80
100
120
140
160
180
Reference Case (Nominal)Reference Case (2012$)
Forecast Brent Price ($/Bbl)
Price-Responsiveness of Shale Production Likely to Help Manage Long-Term Price Trends