boynton beach general employees’ pension fund … funds/select your fund/boynton... · boynton...
TRANSCRIPT
BOYNTON BEACH GENERAL
EMPLOYEES’ PENSION FUND
INVESTMENT PERFORMANCE ANALYSIS
FOURTH QUARTER 2014
Note: For a copy of Part II of Southeastern Advisory Services, Inc.’s most recent Form ADV please write: Southeastern Advisory Services, Inc., 12 Piedmont Center, Suite 202, Atlanta, GA 30305, or e-mail your request to [email protected]. Part II of Form ADV will be mailed within seven (7) days upon receipt of the request.
Jeffrey D. Swanson, Senior Consultant
Southeastern Advisory Services, Inc. Twelve Piedmont Center, Suite 202
Atlanta, Georgia 30305 TEL: (404) 237-3156 FAX: (404) 237-2650
Only the executive summary portion of our reporting is provided herein. If you would like an electronic copy of the back-up pages to this executive summary, send your request to [email protected].

BOYNTON BEACH EMPLOYEES’ PENSION FUND
INVESTMENT PERFORMANCE ANALYSIS
DECEMBER 31, 2014
TABLE OF CONTENTS
TAB 1 MARKET ENVIRONMENT
TAB 2 PORTFOLIO GROWTH AND ASSET ALLOCATION
TAB 3 TOTAL FUND AND ASSET MANAGER PERFORMANCE COMPARISONS TAB 4 INVESTMENT POLICY COMPLIANCE
1
Executive Summary
BOYNTON BEACH EMPLOYEES’ PENSION FUND Quarter Ending December 31, 2014
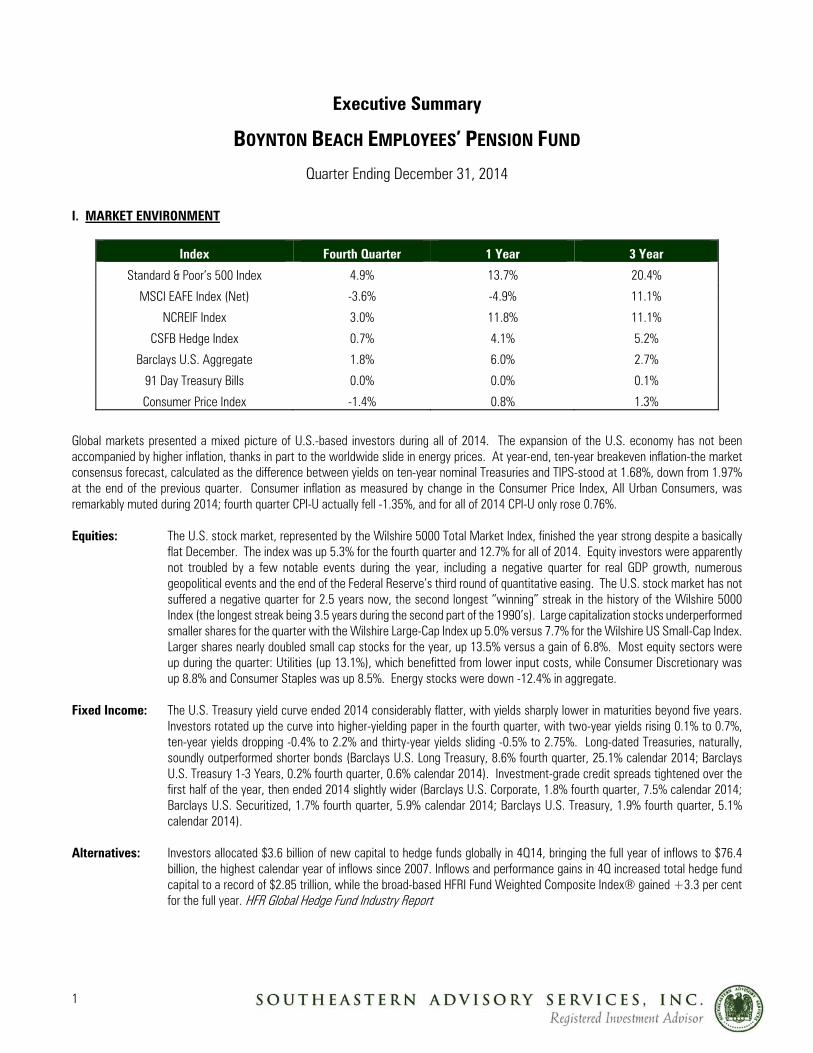
I. MARKET ENVIRONMENT
Index Fourth Quarter 1 Year 3 Year
Standard & Poor’s 500 Index 4.9% 13.7% 20.4%
MSCI EAFE Index (Net) -3.6% -4.9% 11.1%
NCREIF Index 3.0% 11.8% 11.1%
CSFB Hedge Index 0.7% 4.1% 5.2%
Barclays U.S. Aggregate 1.8% 6.0% 2.7%
91 Day Treasury Bills 0.0% 0.0% 0.1%
Consumer Price Index -1.4% 0.8% 1.3%
Global markets presented a mixed picture of U.S.-based investors during all of 2014. The expansion of the U.S. economy has not been accompanied by higher inflation, thanks in part to the worldwide slide in energy prices. At year-end, ten-year breakeven inflation-the market consensus forecast, calculated as the difference between yields on ten-year nominal Treasuries and TIPS-stood at 1.68%, down from 1.97% at the end of the previous quarter. Consumer inflation as measured by change in the Consumer Price Index, All Urban Consumers, was remarkably muted during 2014; fourth quarter CPI-U actually fell -1.35%, and for all of 2014 CPI-U only rose 0.76%. Equities: The U.S. stock market, represented by the Wilshire 5000 Total Market Index, finished the year strong despite a basically
flat December. The index was up 5.3% for the fourth quarter and 12.7% for all of 2014. Equity investors were apparently not troubled by a few notable events during the year, including a negative quarter for real GDP growth, numerous geopolitical events and the end of the Federal Reserve’s third round of quantitative easing. The U.S. stock market has not suffered a negative quarter for 2.5 years now, the second longest “winning” streak in the history of the Wilshire 5000 Index (the longest streak being 3.5 years during the second part of the 1990’s). Large capitalization stocks underperformed smaller shares for the quarter with the Wilshire Large-Cap Index up 5.0% versus 7.7% for the Wilshire US Small-Cap Index. Larger shares nearly doubled small cap stocks for the year, up 13.5% versus a gain of 6.8%. Most equity sectors were up during the quarter: Utilities (up 13.1%), which benefitted from lower input costs, while Consumer Discretionary was up 8.8% and Consumer Staples was up 8.5%. Energy stocks were down -12.4% in aggregate.
Fixed Income: The U.S. Treasury yield curve ended 2014 considerably flatter, with yields sharply lower in maturities beyond five years.
Investors rotated up the curve into higher-yielding paper in the fourth quarter, with two-year yields rising 0.1% to 0.7%, ten-year yields dropping -0.4% to 2.2% and thirty-year yields sliding -0.5% to 2.75%. Long-dated Treasuries, naturally, soundly outperformed shorter bonds (Barclays U.S. Long Treasury, 8.6% fourth quarter, 25.1% calendar 2014; Barclays U.S. Treasury 1-3 Years, 0.2% fourth quarter, 0.6% calendar 2014). Investment-grade credit spreads tightened over the first half of the year, then ended 2014 slightly wider (Barclays U.S. Corporate, 1.8% fourth quarter, 7.5% calendar 2014; Barclays U.S. Securitized, 1.7% fourth quarter, 5.9% calendar 2014; Barclays U.S. Treasury, 1.9% fourth quarter, 5.1% calendar 2014).
Alternatives: Investors allocated $3.6 billion of new capital to hedge funds globally in 4Q14, bringing the full year of inflows to $76.4
billion, the highest calendar year of inflows since 2007. Inflows and performance gains in 4Q increased total hedge fund capital to a record of $2.85 trillion, while the broad-based HFRI Fund Weighted Composite Index® gained +3.3 per cent for the full year. HFR Global Hedge Fund Industry Report
2
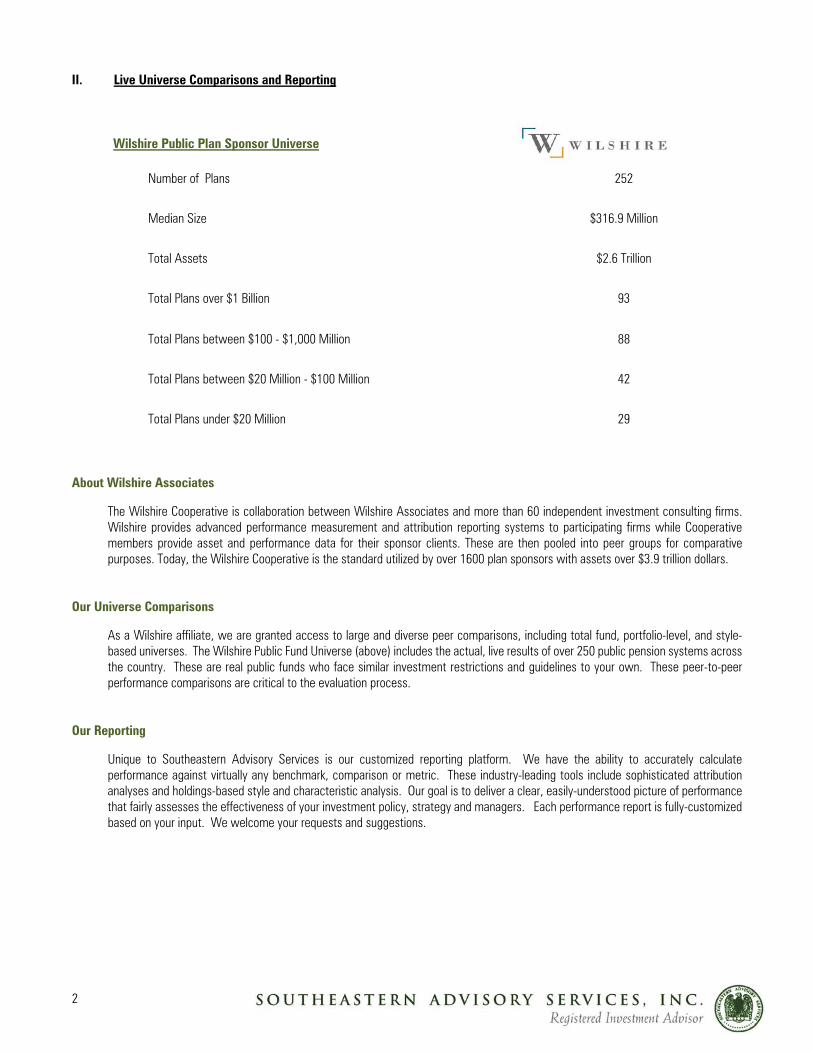
II. Live Universe Comparisons and Reporting
Wilshire Public Plan Sponsor Universe
Number of Plans 252
Median Size $316.9 Million
Total Assets $2.6 Trillion
Total Plans over $1 Billion 93
Total Plans between $100 - $1,000 Million 88
Total Plans between $20 Million - $100 Million 42
Total Plans under $20 Million 29
About Wilshire Associates
The Wilshire Cooperative is collaboration between Wilshire Associates and more than 60 independent investment consulting firms. Wilshire provides advanced performance measurement and attribution reporting systems to participating firms while Cooperative members provide asset and performance data for their sponsor clients. These are then pooled into peer groups for comparative purposes. Today, the Wilshire Cooperative is the standard utilized by over 1600 plan sponsors with assets over $3.9 trillion dollars.
Our Universe Comparisons
As a Wilshire affiliate, we are granted access to large and diverse peer comparisons, including total fund, portfolio-level, and style-based universes. The Wilshire Public Fund Universe (above) includes the actual, live results of over 250 public pension systems across the country. These are real public funds who face similar investment restrictions and guidelines to your own. These peer-to-peer performance comparisons are critical to the evaluation process.
Our Reporting
Unique to Southeastern Advisory Services is our customized reporting platform. We have the ability to accurately calculate performance against virtually any benchmark, comparison or metric. These industry-leading tools include sophisticated attribution analyses and holdings-based style and characteristic analysis. Our goal is to deliver a clear, easily-understood picture of performance that fairly assesses the effectiveness of your investment policy, strategy and managers. Each performance report is fully-customized based on your input. We welcome your requests and suggestions.
3
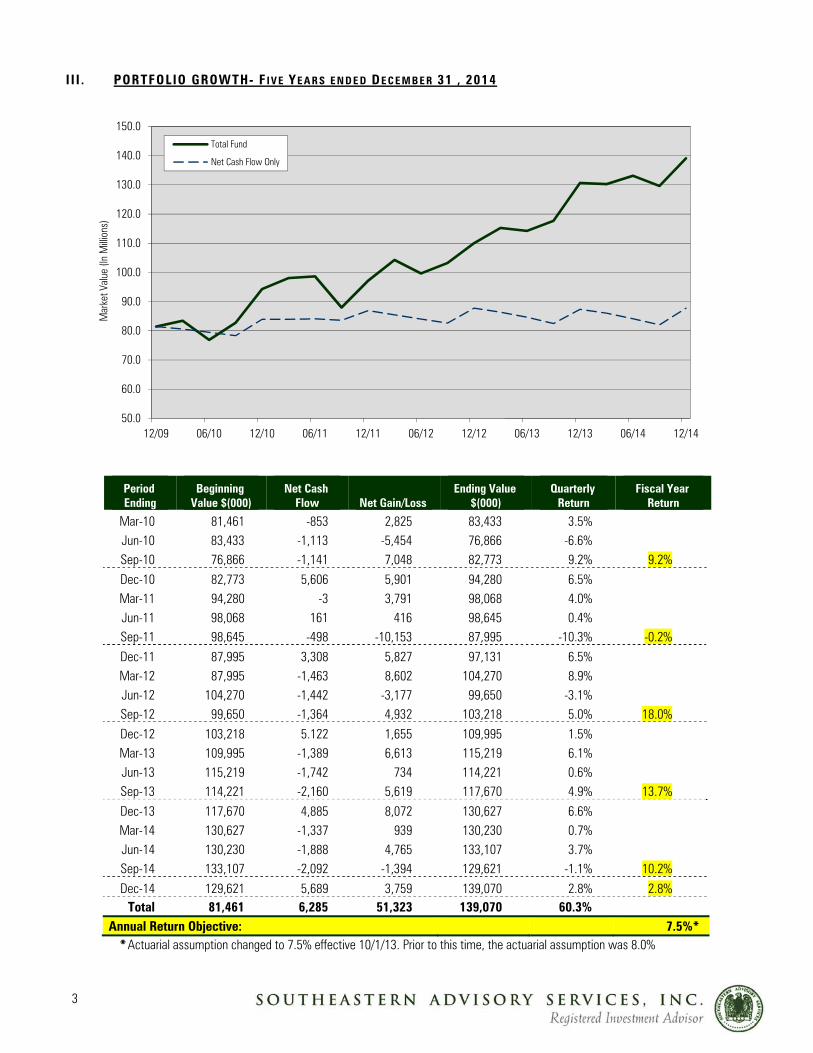
I I I . PORTFOLIO GROWTH- F IV E YE A R S E ND E D DE C E M B E R 31 , 2014
Period Ending
Beginning Value $(000)
Net Cash Flow Net Gain/Loss
Ending Value $(000)
Quarterly Return
Fiscal Year Return
Mar-10 81,461 -853 2,825 83,433 3.5% Jun-10 83,433 -1,113 -5,454 76,866 -6.6% Sep-10 76,866 -1,141 7,048 82,773 9.2% 9.2% Dec-10 82,773 5,606 5,901 94,280 6.5% Mar-11 94,280 -3 3,791 98,068 4.0% Jun-11 98,068 161 416 98,645 0.4% Sep-11 98,645 -498 -10,153 87,995 -10.3% -0.2%
Dec-11 87,995 3,308 5,827 97,131 6.5% Mar-12 87,995 -1,463 8,602 104,270 8.9% Jun-12 104,270 -1,442 -3,177 99,650 -3.1% Sep-12 99,650 -1,364 4,932 103,218 5.0% 18.0% Dec-12 103,218 5.122 1,655 109,995 1.5% Mar-13 109,995 -1,389 6,613 115,219 6.1% Jun-13 115,219 -1,742 734 114,221 0.6% Sep-13 114,221 -2,160 5,619 117,670 4.9% 13.7% Dec-13 117,670 4,885 8,072 130,627 6.6% Mar-14 130,627 -1,337 939 130,230 0.7% Jun-14 130,230 -1,888 4,765 133,107 3.7% Sep-14 133,107 -2,092 -1,394 129,621 -1.1% 10.2%
Dec-14 129,621 5,689 3,759 139,070 2.8% 2.8% Total 81,461 6,285 51,323 139,070 60.3%
Annual Return Objective: 7.5%* *Actuarial assumption changed to 7.5% effective 10/1/13. Prior to this time, the actuarial assumption was 8.0%
50.0
60.0
70.0
80.0
90.0
100.0
110.0
120.0
130.0
140.0
150.0
12/09 06/10 12/10 06/11 12/11 06/12 12/12 06/13 12/13 06/14 12/14
Mar
ket V
alue
(In
Milli
ons)
Total Fund
Net Cash Flow Only

4
IV . ALLOCATION OF ASSETS
Asset C lass Target Al locat ion Current Al locat ion Median Publ ic Plan Dom Equi ty Secur i t ies 45% 47.8% 45.5% Int l Equi ty Secur i t ies 20% 15.7% 13.6% Real Estate 10% 12.9% 4.3% Fixed Income Secur i t ies 25% 21.1% 25.3% Cash Equivalents 0% 2.5% 11.3%
03/12 06/12 09/12 12/12 03/13 06/13 09/13 12/13 03/14 06/14 09/14 12/14
Domestic Equity % 52.6 48.6 52.3 48.9 51.2 52.1 52.8 52.1 51.3 51.1 50.4 47.8
Intl Equity % 11.5 11.2 11.4 11.5 13.1 13.0 13.9 17.3 17.4 17.6 17.1 15.7
Real Estate % 7.3 7.8 7.8 7.5 7.4 7.7 7.8 7.2 8.9 10.6 11.8 12.9
Domestic Fixed % 25.9 27.5 26.2 28.0 24.7 23.0 22.6 20.5 19.8 18.5 18.8 21.1
Cash & Equiv % 2.7 4.9 2.3 4.1 3.6 4.2 2.9 2.9 2.6 2.2 1.9 2.5
Historical Asset Allocation
Domestic Equity %Intl Equity %Real Estate %Domestic Fixed %Cash & Equiv %
Dom Equity45%
Intl Equity20%
Real Estate10%
Fixed Income25%
Policy Allocation
Dom Equity47.8%
Intl Equity15.7%
Real Estate12.9%
Fixed Income21.1%
Cash2.5%
Current Allocation
5
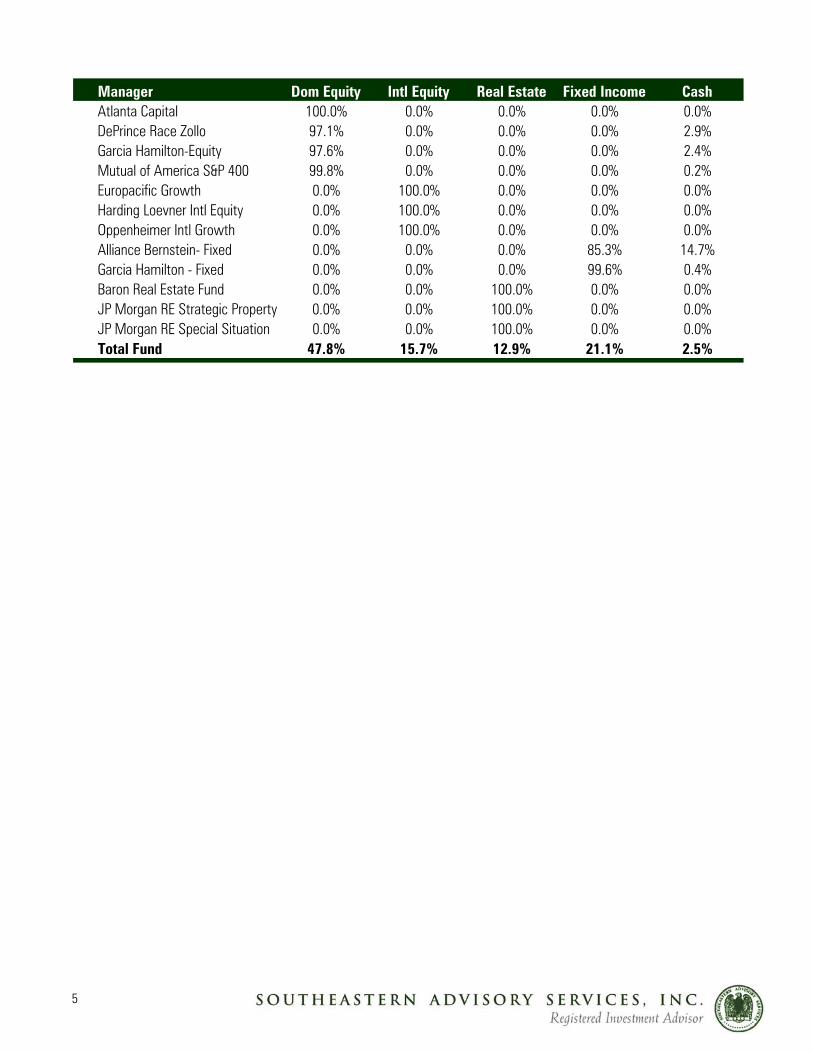
Manager Dom Equity Intl Equity Real Estate Fixed Income CashAtlanta Capital 100.0% 0.0% 0.0% 0.0% 0.0%DePrince Race Zollo 97.1% 0.0% 0.0% 0.0% 2.9%Garcia Hamilton-Equity 97.6% 0.0% 0.0% 0.0% 2.4%Mutual of America S&P 400 99.8% 0.0% 0.0% 0.0% 0.2%Europacific Growth 0.0% 100.0% 0.0% 0.0% 0.0%Harding Loevner Intl Equity 0.0% 100.0% 0.0% 0.0% 0.0%Oppenheimer Intl Growth 0.0% 100.0% 0.0% 0.0% 0.0%Alliance Bernstein- Fixed 0.0% 0.0% 0.0% 85.3% 14.7%Garcia Hamilton - Fixed 0.0% 0.0% 0.0% 99.6% 0.4%Baron Real Estate Fund 0.0% 0.0% 100.0% 0.0% 0.0%JP Morgan RE Strategic Property 0.0% 0.0% 100.0% 0.0% 0.0%JP Morgan RE Special Situation 0.0% 0.0% 100.0% 0.0% 0.0%Total Fund 47.8% 15.7% 12.9% 21.1% 2.5%
6
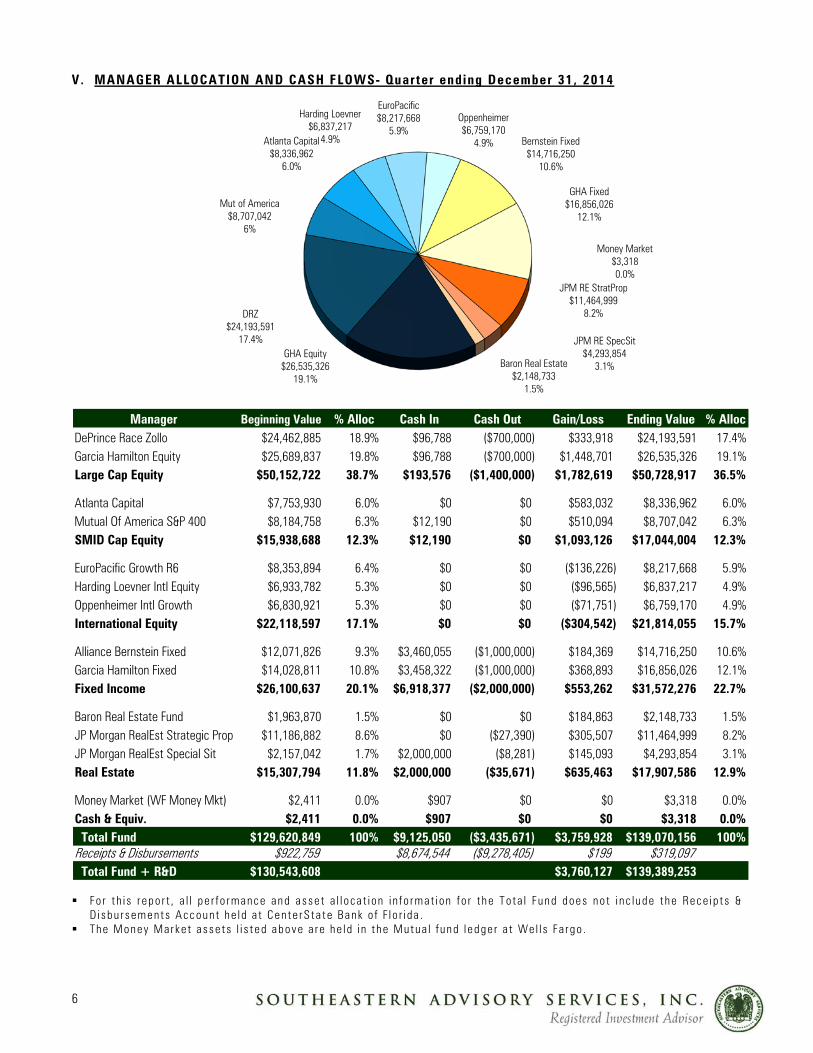
V. MANAGER ALLOCATION AND CASH FLOWS- Quarter ending December 31, 2014
Manager Beginning Value % Alloc Cash In Cash Out Gain/Loss Ending Value % AllocDePrince Race Zollo $24,462,885 18.9% $96,788 ($700,000) $333,918 $24,193,591 17.4%Garcia Hamilton Equity $25,689,837 19.8% $96,788 ($700,000) $1,448,701 $26,535,326 19.1%Large Cap Equity $50,152,722 38.7% $193,576 ($1,400,000) $1,782,619 $50,728,917 36.5%
Atlanta Capital $7,753,930 6.0% $0 $0 $583,032 $8,336,962 6.0%Mutual Of America S&P 400 $8,184,758 6.3% $12,190 $0 $510,094 $8,707,042 6.3%SMID Cap Equity $15,938,688 12.3% $12,190 $0 $1,093,126 $17,044,004 12.3%
EuroPacific Growth R6 $8,353,894 6.4% $0 $0 ($136,226) $8,217,668 5.9%Harding Loevner Intl Equity $6,933,782 5.3% $0 $0 ($96,565) $6,837,217 4.9%Oppenheimer Intl Growth $6,830,921 5.3% $0 $0 ($71,751) $6,759,170 4.9%International Equity $22,118,597 17.1% $0 $0 ($304,542) $21,814,055 15.7%
Alliance Bernstein Fixed $12,071,826 9.3% $3,460,055 ($1,000,000) $184,369 $14,716,250 10.6%Garcia Hamilton Fixed $14,028,811 10.8% $3,458,322 ($1,000,000) $368,893 $16,856,026 12.1%Fixed Income $26,100,637 20.1% $6,918,377 ($2,000,000) $553,262 $31,572,276 22.7%
Baron Real Estate Fund $1,963,870 1.5% $0 $0 $184,863 $2,148,733 1.5%JP Morgan RealEst Strategic Prop $11,186,882 8.6% $0 ($27,390) $305,507 $11,464,999 8.2%JP Morgan RealEst Special Sit $2,157,042 1.7% $2,000,000 ($8,281) $145,093 $4,293,854 3.1%Real Estate $15,307,794 11.8% $2,000,000 ($35,671) $635,463 $17,907,586 12.9%
Money Market (WF Money Mkt) $2,411 0.0% $907 $0 $0 $3,318 0.0%Cash & Equiv. $2,411 0.0% $907 $0 $0 $3,318 0.0% Total Fund $129,620,849 100% $9,125,050 ($3,435,671) $3,759,928 $139,070,156 100%Receipts & Disbursements $922,759 $8,674,544 ($9,278,405) $199 $319,097 Total Fund + R&D $130,543,608 $3,760,127 $139,389,253
Fo r t h i s r epo r t , a l l pe r f o rmance an d asse t a l l o ca t i on i n f o rm at i on f o r t h e T o ta l Fun d does n o t i n c lude t h e Rece ip t s &
D i sbu r semen ts Accoun t he l d a t Cen te rS ta te Bank o f F l o r i da . The Money Marke t a sse t s l i s t ed above a re he l d i n th e Mutua l f und l edge r a t We l l s Fa rgo .
GHA Equity$26,535,326
19.1%
DRZ$24,193,591
17.4%
Mut of America$8,707,042
6%
Atlanta Capital$8,336,962
6.0%
Harding Loevner$6,837,217
4.9%
EuroPacific$8,217,668
5.9%Oppenheimer$6,759,170
4.9% Bernstein Fixed$14,716,250
10.6%
GHA Fixed$16,856,026
12.1%
Money Market$3,3180.0%
JPM RE StratProp$11,464,999
8.2%
JPM RE SpecSit$4,293,854
3.1%Baron Real Estate$2,148,733
1.5%
7
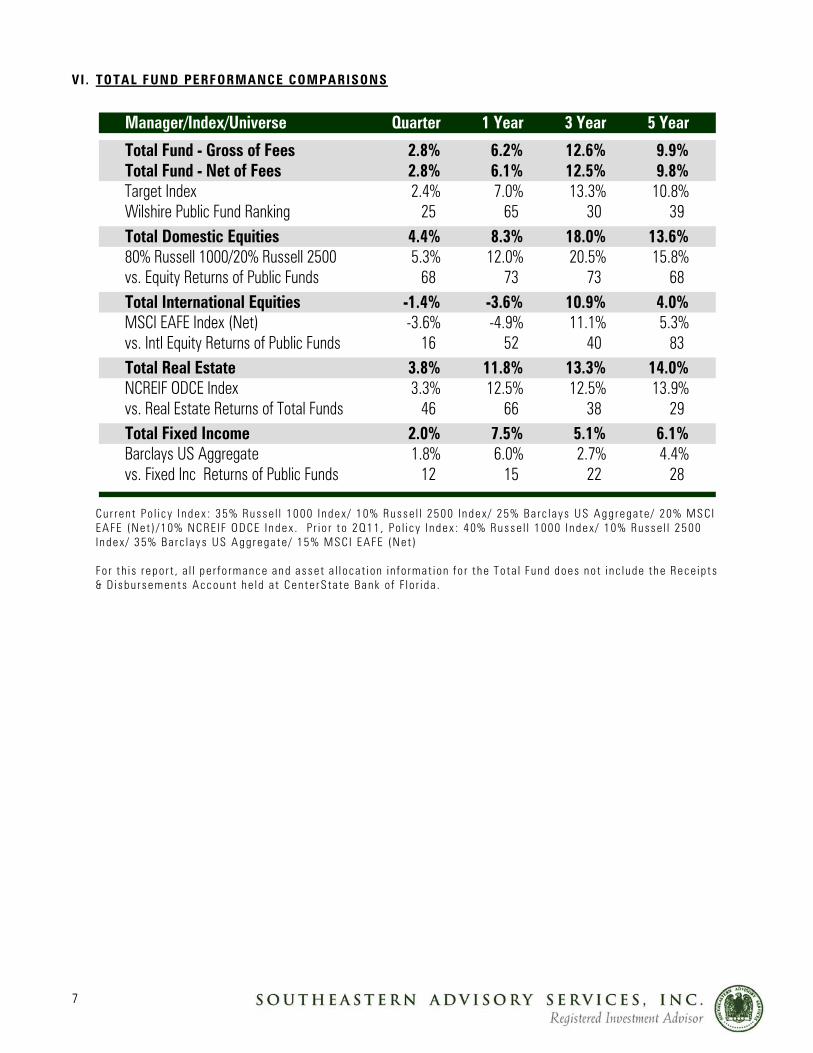
VI . TOTAL FUND PERFORMANCE COMPARISONS
Manager/Index/Universe Quarter 1 Year 3 Year 5 Year
Total Fund - Gross of Fees 2.8% 6.2% 12.6% 9.9%Total Fund - Net of Fees 2.8% 6.1% 12.5% 9.8%Target Index 2.4% 7.0% 13.3% 10.8%Wilshire Public Fund Ranking 25 65 30 39 Total Domestic Equities 4.4% 8.3% 18.0% 13.6%80% Russell 1000/20% Russell 2500 5.3% 12.0% 20.5% 15.8%vs. Equity Returns of Public Funds 68 73 73 68 Total International Equities -1.4% -3.6% 10.9% 4.0%MSCI EAFE Index (Net) -3.6% -4.9% 11.1% 5.3%vs. Intl Equity Returns of Public Funds 16 52 40 83 Total Real Estate 3.8% 11.8% 13.3% 14.0%NCREIF ODCE Index 3.3% 12.5% 12.5% 13.9%vs. Real Estate Returns of Total Funds 46 66 38 29 Total Fixed Income 2.0% 7.5% 5.1% 6.1%Barclays US Aggregate 1.8% 6.0% 2.7% 4.4%vs. Fixed Inc Returns of Public Funds 12 15 22 28
Cu r ren t Po l i c y I ndex : 35% Ru sse l l 1000 I ndex / 10% Ru sse l l 2500 I n dex / 25% Ba rc l ays US Agg rega te / 20% MSCI EAFE (Ne t ) /10% NCRE I F ODCE I n dex . P r i o r t o 2Q11 , Po l i c y I n dex : 40% Russe l l 1000 I n dex / 10% Ru sse l l 2500 I n dex / 35% Ba rc l ay s US A gg rega te / 15% MSC I EAFE (Ne t ) Fo r t h i s r epo r t , a l l pe r f o rmance an d asse t a l l oca t i on i n f o rmat i on f o r th e To ta l Fund does no t i nc lude th e Rece ip t s & D i sbu r sements Accoun t he ld a t Cen te rS ta te Bank o f F l o r i da .
8
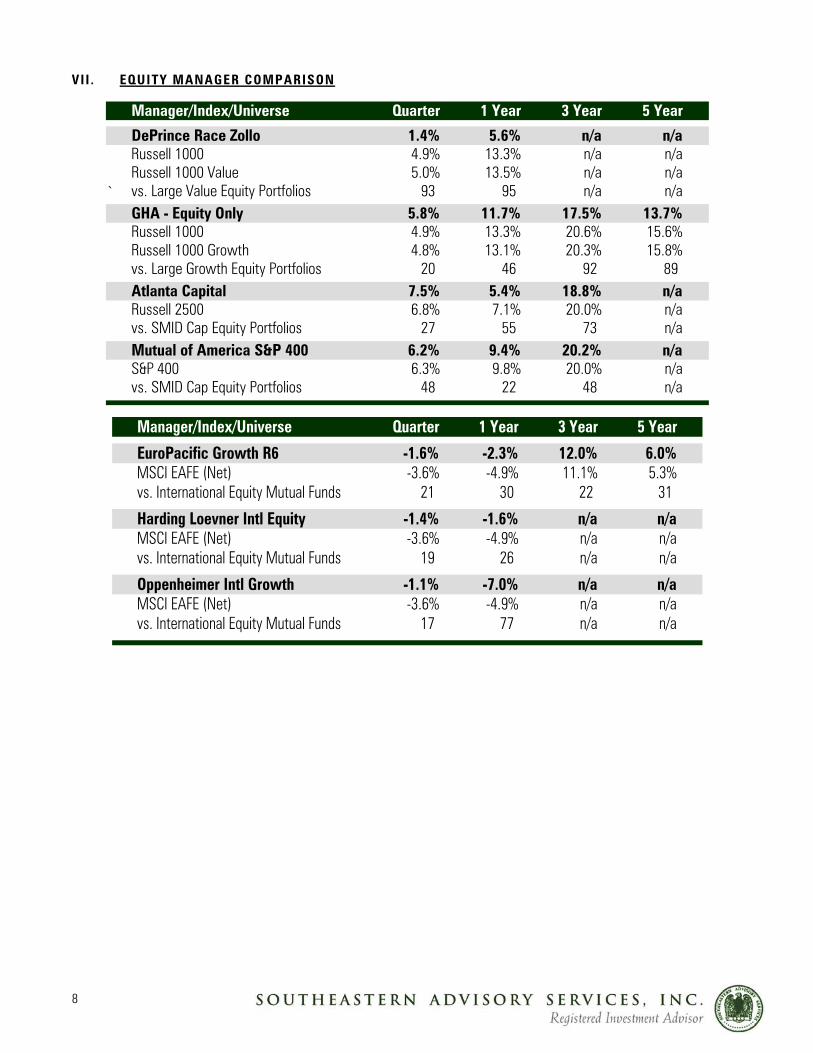
VII . EQUITY MANAGER COMPARISON
Manager/Index/Universe Quarter 1 Year 3 Year 5 Year
DePrince Race Zollo 1.4% 5.6% n/a n/aRussell 1000 4.9% 13.3% n/a n/aRussell 1000 Value 5.0% 13.5% n/a n/a
` vs. Large Value Equity Portfolios 93 95 n/a n/aGHA - Equity Only 5.8% 11.7% 17.5% 13.7%Russell 1000 4.9% 13.3% 20.6% 15.6%Russell 1000 Growth 4.8% 13.1% 20.3% 15.8%vs. Large Growth Equity Portfolios 20 46 92 89 Atlanta Capital 7.5% 5.4% 18.8% n/aRussell 2500 6.8% 7.1% 20.0% n/avs. SMID Cap Equity Portfolios 27 55 73 n/aMutual of America S&P 400 6.2% 9.4% 20.2% n/aS&P 400 6.3% 9.8% 20.0% n/avs. SMID Cap Equity Portfolios 48 22 48 n/a
Manager/Index/Universe Quarter 1 Year 3 Year 5 Year
EuroPacific Growth R6 -1.6% -2.3% 12.0% 6.0%MSCI EAFE (Net) -3.6% -4.9% 11.1% 5.3%vs. International Equity Mutual Funds 21 30 22 31
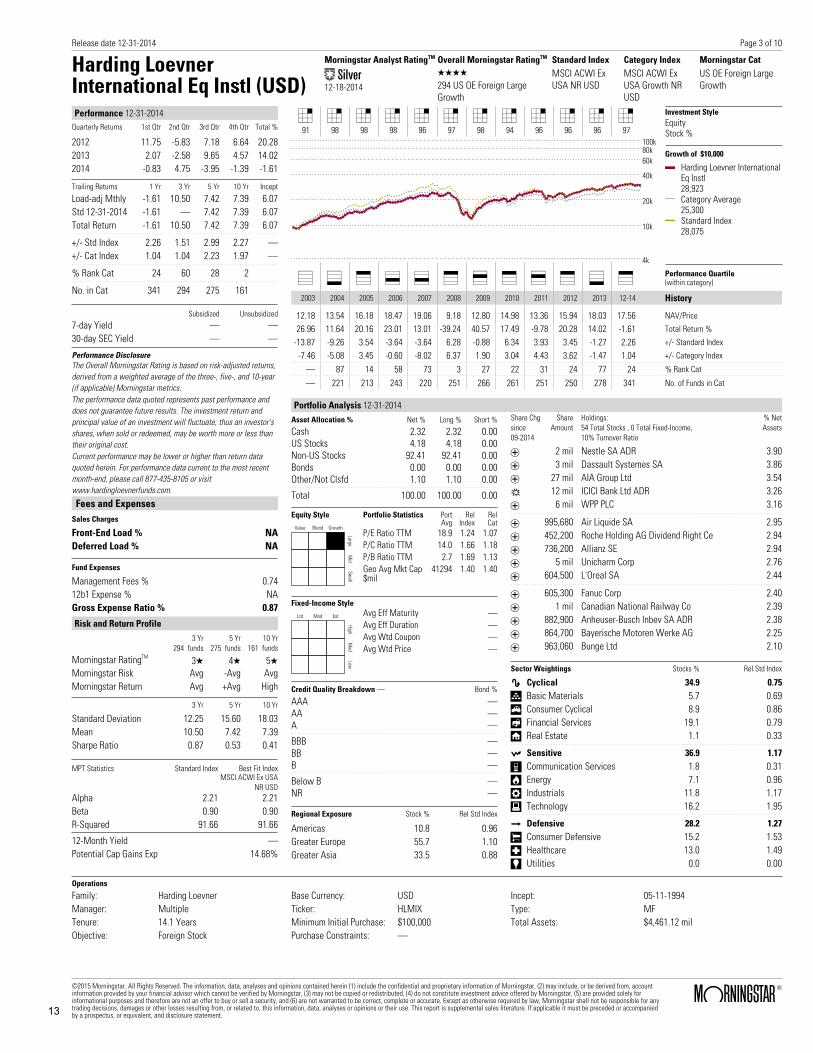
Harding Loevner Intl Equity -1.4% -1.6% n/a n/aMSCI EAFE (Net) -3.6% -4.9% n/a n/avs. International Equity Mutual Funds 19 26 n/a n/a
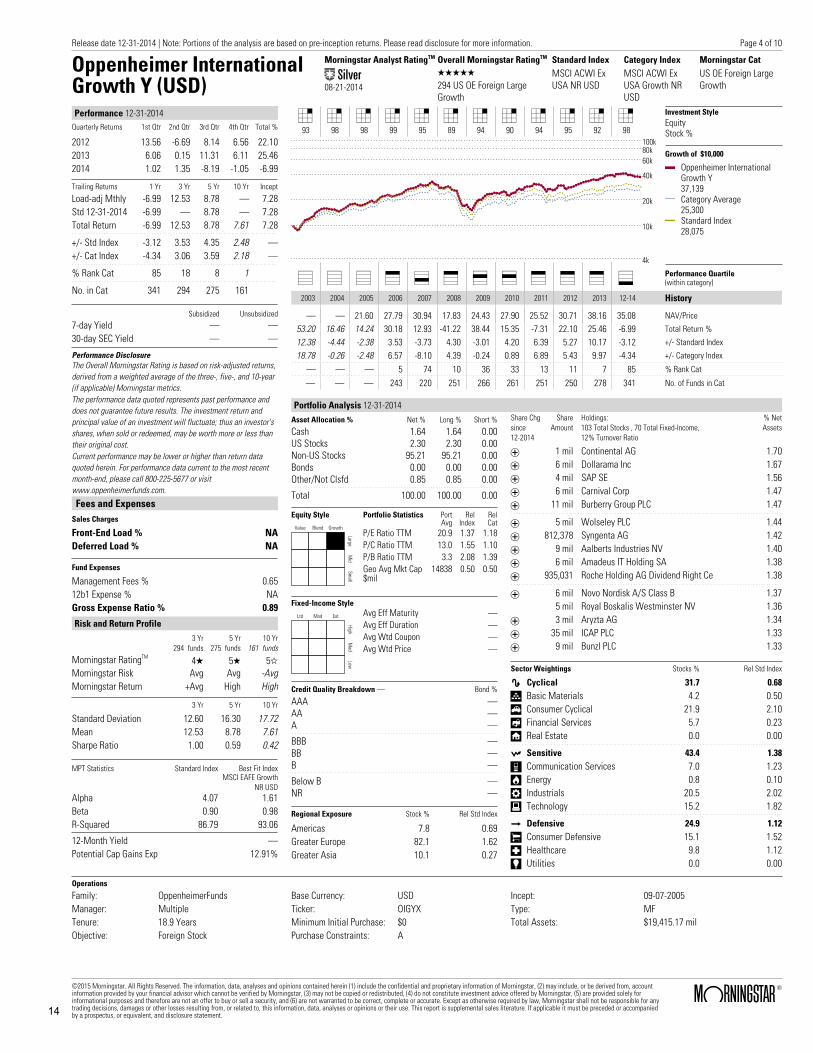
Oppenheimer Intl Growth -1.1% -7.0% n/a n/aMSCI EAFE (Net) -3.6% -4.9% n/a n/avs. International Equity Mutual Funds 17 77 n/a n/a
9
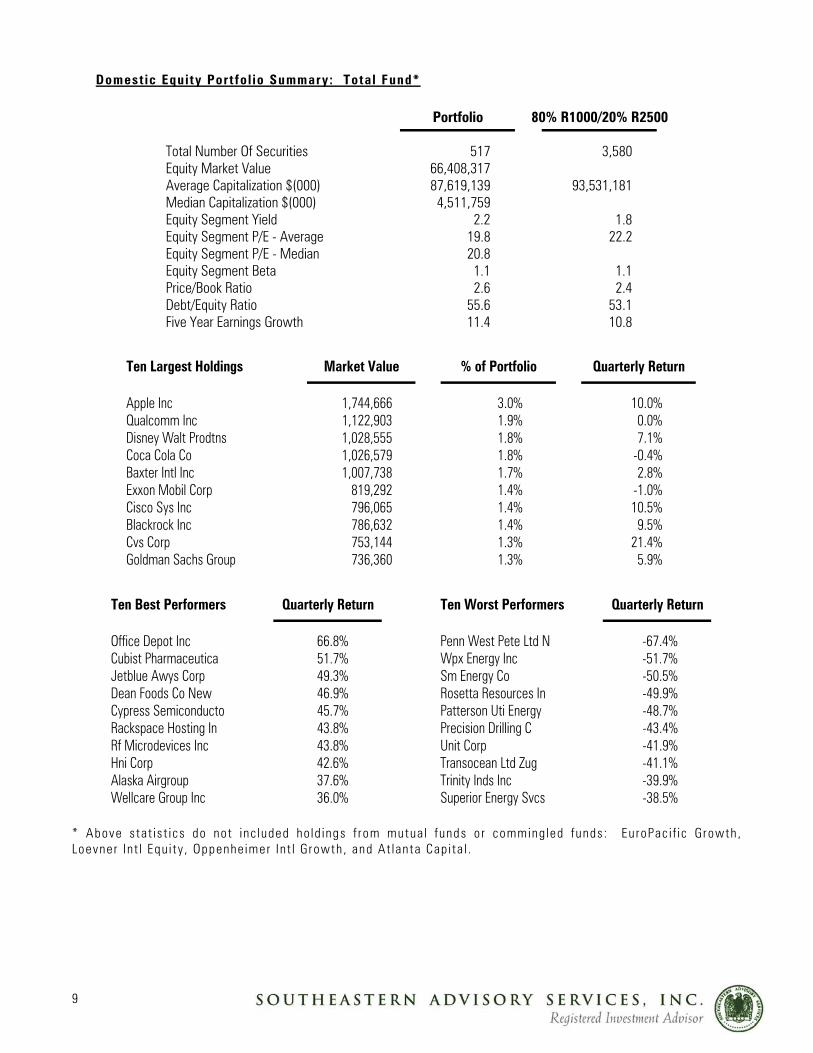
Domest ic Equity Port fo l io Summary: Total Fund*
Portfolio 80% R1000/20% R2500
Total Number Of Securities 517 3,580Equity Market Value 66,408,317Average Capitalization $(000) 87,619,139 93,531,181Median Capitalization $(000) 4,511,759Equity Segment Yield 2.2 1.8Equity Segment P/E - Average 19.8 22.2Equity Segment P/E - Median 20.8Equity Segment Beta 1.1 1.1Price/Book Ratio 2.6 2.4Debt/Equity Ratio 55.6 53.1Five Year Earnings Growth 11.4 10.8
Ten Largest Holdings Market Value % of Portfolio Quarterly Return
Apple Inc 1,744,666 3.0% 10.0%Qualcomm Inc 1,122,903 1.9% 0.0%Disney Walt Prodtns 1,028,555 1.8% 7.1%Coca Cola Co 1,026,579 1.8% -0.4%Baxter Intl Inc 1,007,738 1.7% 2.8%Exxon Mobil Corp 819,292 1.4% -1.0%Cisco Sys Inc 796,065 1.4% 10.5%Blackrock Inc 786,632 1.4% 9.5%Cvs Corp 753,144 1.3% 21.4%Goldman Sachs Group 736,360 1.3% 5.9%
Ten Best Performers Quarterly Return Ten Worst Performers Quarterly Return
Office Depot Inc 66.8% Penn West Pete Ltd N -67.4%Cubist Pharmaceutica 51.7% Wpx Energy Inc -51.7%Jetblue Awys Corp 49.3% Sm Energy Co -50.5%Dean Foods Co New 46.9% Rosetta Resources In -49.9%Cypress Semiconducto 45.7% Patterson Uti Energy -48.7%Rackspace Hosting In 43.8% Precision Drilling C -43.4%Rf Microdevices Inc 43.8% Unit Corp -41.9%Hni Corp 42.6% Transocean Ltd Zug -41.1%Alaska Airgroup 37.6% Trinity Inds Inc -39.9%Wellcare Group Inc 36.0% Superior Energy Svcs -38.5%
* Above s tat is t i cs do not inc luded ho ld ings f rom mutua l funds o r comming led funds : Eu roPac i f ic Growth , Loevner In t l Equ i ty , Oppenhe imer Int l G rowth , and At lanta Cap i ta l .
10
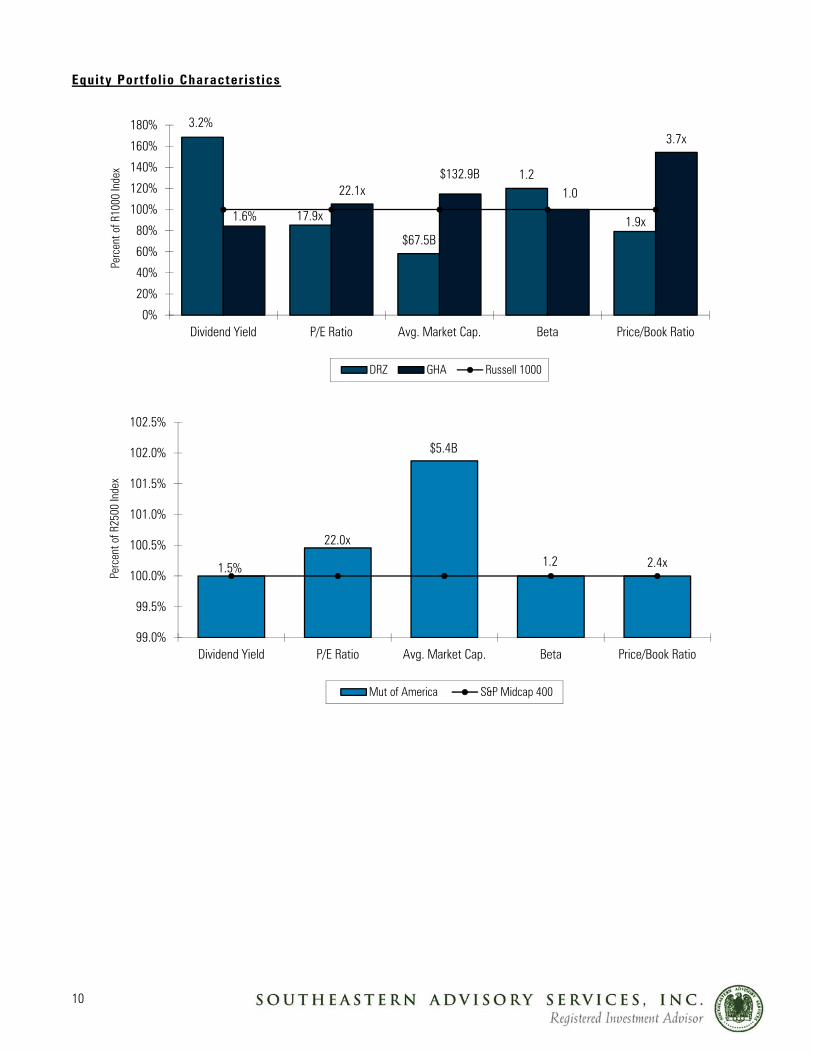
Equity Port fo l io Character ist ics
3.2%
17.9x
$67.5B
1.2
1.9x1.6%
22.1x$132.9B
1.0
3.7x
0%
20%
40%
60%
80%
100%
120%
140%
160%
180%
Dividend Yield P/E Ratio Avg. Market Cap. Beta Price/Book Ratio
Perc
ent o
f R10
00 In
dex
DRZ GHA Russell 1000
1.5%
22.0x
$5.4B
1.2 2.4x
99.0%
99.5%
100.0%
100.5%
101.0%
101.5%
102.0%
102.5%
Dividend Yield P/E Ratio Avg. Market Cap. Beta Price/Book Ratio
Perc
ent o
f R25
00 In
dex
Mut of America S&P Midcap 400
11
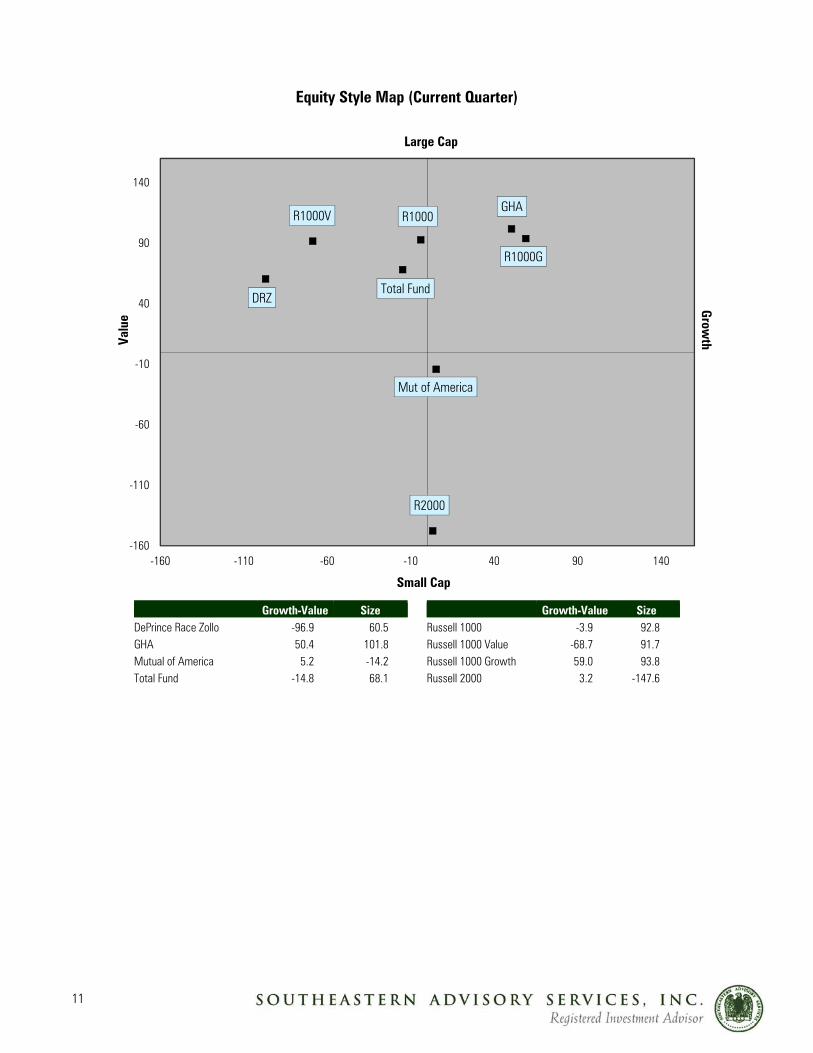
Growth-Value Size Growth-Value Size DePrince Race Zollo -96.9 60.5 Russell 1000 -3.9 92.8 GHA 50.4 101.8 Russell 1000 Value -68.7 91.7 Mutual of America 5.2 -14.2 Russell 1000 Growth 59.0 93.8 Total Fund -14.8 68.1 Russell 2000 3.2 -147.6
DRZ
GHA
Mut of America
Total Fund
R1000
R1000G
R1000V
R2000
-160
-110
-60
-10
40
90
140
-160 -110 -60 -10 40 90 140
Equity Style Map (Current Quarter)
Small Cap
Large CapVa
lue
Growth
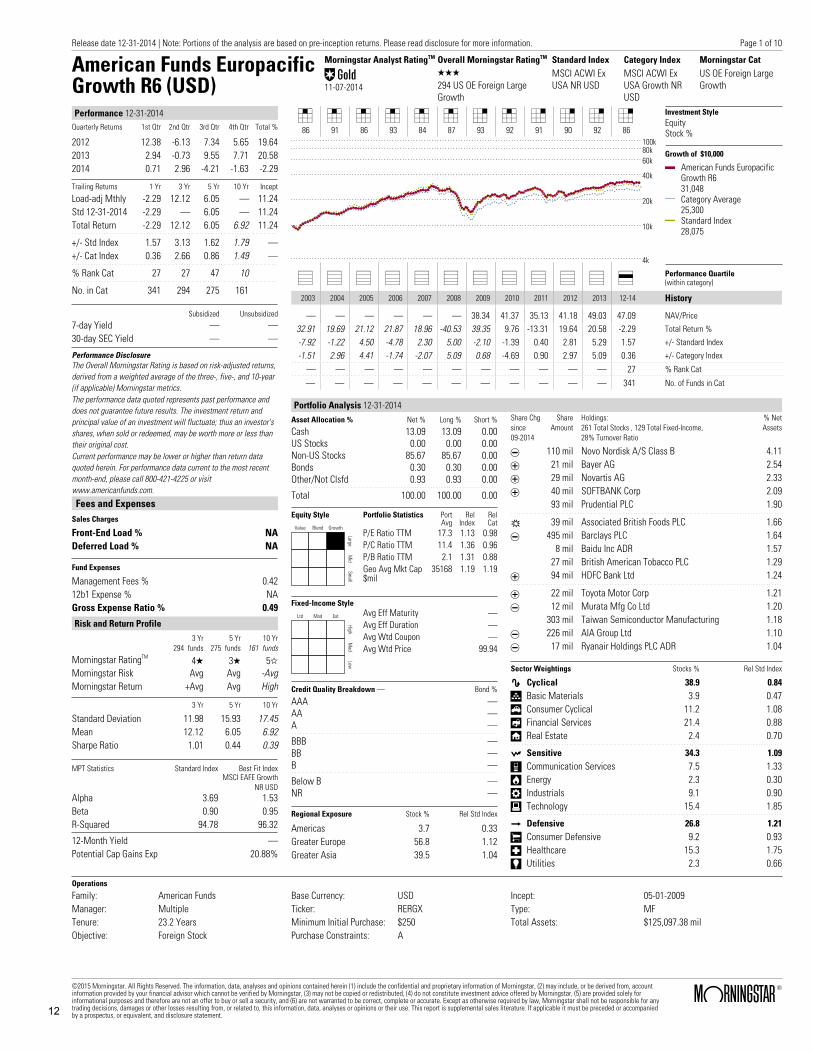
American Funds EuropacificGrowth R6 (USD)
Morningstar Analyst RatingTM
Œ11-07-2014
Overall Morningstar RatingTM Standard Index Category Index Morningstar CatQQQ MSCI ACWI Ex
USA NR USDMSCI ACWI ExUSA Growth NRUSD
US OE Foreign LargeGrowth294 US OE Foreign Large
Growth
Performance 12-31-2014Quarterly Returns 1st Qtr 2nd Qtr 3rd Qtr 4th Qtr Total %
2012 12.38 -6.13 7.34 5.65 19.642013 2.94 -0.73 9.55 7.71 20.582014 0.71 2.96 -4.21 -1.63 -2.29
Trailing Returns 1 Yr 3 Yr 5 Yr 10 Yr Incept
Load-adj Mthly -2.29 12.12 6.05 — 11.24Std 12-31-2014 -2.29 — 6.05 — 11.24Total Return -2.29 12.12 6.05 6.92 11.24
+/- Std Index 1.57 3.13 1.62 1.79 —+/- Cat Index 0.36 2.66 0.86 1.49 —
% Rank Cat 27 27 47 10
No. in Cat 341 294 275 161
Subsidized Unsubsidized
7-day Yield — —30-day SEC Yield — —
Performance DisclosureThe Overall Morningstar Rating is based on risk-adjusted returns,derived from a weighted average of the three-, five-, and 10-year(if applicable) Morningstar metrics.The performance data quoted represents past performance anddoes not guarantee future results. The investment return andprincipal value of an investment will fluctuate; thus an investor'sshares, when sold or redeemed, may be worth more or less thantheir original cost.Current performance may be lower or higher than return dataquoted herein. For performance data current to the most recentmonth-end, please call 800-421-4225 or visitwww.americanfunds.com.
Fees and ExpensesSales Charges
Front-End Load % NADeferred Load % NA
Fund Expenses
Management Fees % 0.4212b1 Expense % NAGross Expense Ratio % 0.49
Risk and Return Profile3 Yr 5 Yr 10 Yr
294 funds 275 funds 161 funds
Morningstar RatingTM 4Q 3Q 5WMorningstar Risk Avg Avg -AvgMorningstar Return +Avg Avg High
3 Yr 5 Yr 10 Yr
Standard Deviation 11.98 15.93 17.45Mean 12.12 6.05 6.92Sharpe Ratio 1.01 0.44 0.39
MPT Statistics Standard Index Best Fit IndexMSCI EAFE Growth
NR USDAlpha 3.69 1.53Beta 0.90 0.95R-Squared 94.78 96.32
12-Month Yield —Potential Cap Gains Exp 20.88%
4 4 4 4 4 4 7 4 7 7 7 786 91 86 93 84 87 93 92 91 90 92 86
4k
10k
20k
40k
60k80k100k
Investment StyleEquityStock %
Growth of $10,000
American Funds EuropacificGrowth R631,048Category Average25,300Standard Index28,075
_ _ _ _ _ _ _ _ _ _ _ * Performance Quartile(within category)
2003 2004 2005 2006 2007 2008 2009 2010 2011 2012 2013 12-14 History
— — — — — — 38.34 41.37 35.13 41.18 49.03 47.09 NAV/Price
32.91 19.69 21.12 21.87 18.96 -40.53 39.35 9.76 -13.31 19.64 20.58 -2.29 Total Return %
-7.92 -1.22 4.50 -4.78 2.30 5.00 -2.10 -1.39 0.40 2.81 5.29 1.57 +/- Standard Index
-1.51 2.96 4.41 -1.74 -2.07 5.09 0.68 -4.69 0.90 2.97 5.09 0.36 +/- Category Index
— — — — — — — — — — — 27 % Rank Cat
— — — — — — — — — — — 341 No. of Funds in Cat
Portfolio Analysis 12-31-2014Asset Allocation % Net % Long % Short %
Cash 13.09 13.09 0.00US Stocks 0.00 0.00 0.00Non-US Stocks 85.67 85.67 0.00Bonds 0.30 0.30 0.00Other/Not Clsfd 0.93 0.93 0.00
Total 100.00 100.00 0.00
Equity Style
Value Blend Growth
LargeM
idSm
all
Portfolio Statistics PortAvg
RelIndex
RelCat
P/E Ratio TTM 17.3 1.13 0.98P/C Ratio TTM 11.4 1.36 0.96P/B Ratio TTM 2.1 1.31 0.88Geo Avg Mkt Cap$mil
35168 1.19 1.19
Fixed-Income Style
Ltd Mod Ext
HighM
edLow
Avg Eff Maturity —Avg Eff Duration —Avg Wtd Coupon —Avg Wtd Price 99.94
Credit Quality Breakdown — Bond %
AAA —AA —A —
BBB —BB —B —
Below B —NR —
Regional Exposure Stock % Rel Std Index
Americas 3.7 0.33Greater Europe 56.8 1.12Greater Asia 39.5 1.04
Share Chgsince09-2014
ShareAmount
Holdings:261 Total Stocks , 129 Total Fixed-Income,28% Turnover Ratio
% NetAssets
Y 110 mil Novo Nordisk A/S Class B 4.11
T 21 mil Bayer AG 2.54
T 29 mil Novartis AG 2.33
T 40 mil SOFTBANK Corp 2.0993 mil Prudential PLC 1.90
R 39 mil Associated British Foods PLC 1.66
Y 495 mil Barclays PLC 1.648 mil Baidu Inc ADR 1.57
27 mil British American Tobacco PLC 1.29
T 94 mil HDFC Bank Ltd 1.24
T 22 mil Toyota Motor Corp 1.21
Y 12 mil Murata Mfg Co Ltd 1.20303 mil Taiwan Semiconductor Manufacturing 1.18
Y 226 mil AIA Group Ltd 1.10
Y 17 mil Ryanair Holdings PLC ADR 1.04
Sector Weightings Stocks % Rel Std Index
h Cyclical 38.9 0.84
r Basic Materials 3.9 0.47t Consumer Cyclical 11.2 1.08y Financial Services 21.4 0.88u Real Estate 2.4 0.70
j Sensitive 34.3 1.09
i Communication Services 7.5 1.33o Energy 2.3 0.30p Industrials 9.1 0.90a Technology 15.4 1.85
k Defensive 26.8 1.21
s Consumer Defensive 9.2 0.93d Healthcare 15.3 1.75f Utilities 2.3 0.66
Operations
Family: American FundsManager: MultipleTenure: 23.2 YearsObjective: Foreign Stock
Base Currency: USDTicker: RERGXMinimum Initial Purchase: $250Purchase Constraints: A
Incept: 05-01-2009Type: MFTotal Assets: $125,097.38 mil
Release date 12-31-2014 | Note: Portions of the analysis are based on pre-inception returns. Please read disclosure for more information.
©2015 Morningstar. All Rights Reserved. The information, data, analyses and opinions contained herein (1) include the confidential and proprietary information of Morningstar, (2) may include, or be derived from, accountinformation provided by your financial advisor which cannot be verified by Morningstar, (3) may not be copied or redistributed, (4) do not constitute investment advice offered by Morningstar, (5) are provided solely forinformational purposes and therefore are not an offer to buy or sell a security, and (6) are not warranted to be correct, complete or accurate. Except as otherwise required by law, Morningstar shall not be responsible for anytrading decisions, damages or other losses resulting from, or related to, this information, data, analyses or opinions or their use. This report is supplemental sales literature. If applicable it must be preceded or accompaniedby a prospectus, or equivalent, and disclosure statement.
ß®
Page 1 of 10
12
Harding LoevnerInternational Eq Instl (USD)
Morningstar Analyst RatingTM
„12-18-2014
Overall Morningstar RatingTM Standard Index Category Index Morningstar CatQQQQ MSCI ACWI Ex
USA NR USDMSCI ACWI ExUSA Growth NRUSD
US OE Foreign LargeGrowth294 US OE Foreign Large
Growth
Performance 12-31-2014Quarterly Returns 1st Qtr 2nd Qtr 3rd Qtr 4th Qtr Total %
2012 11.75 -5.83 7.18 6.64 20.282013 2.07 -2.58 9.65 4.57 14.022014 -0.83 4.75 -3.95 -1.39 -1.61
Trailing Returns 1 Yr 3 Yr 5 Yr 10 Yr Incept
Load-adj Mthly -1.61 10.50 7.42 7.39 6.07Std 12-31-2014 -1.61 — 7.42 7.39 6.07Total Return -1.61 10.50 7.42 7.39 6.07
+/- Std Index 2.26 1.51 2.99 2.27 —+/- Cat Index 1.04 1.04 2.23 1.97 —
% Rank Cat 24 60 28 2
No. in Cat 341 294 275 161
Subsidized Unsubsidized
7-day Yield — —30-day SEC Yield — —
Performance DisclosureThe Overall Morningstar Rating is based on risk-adjusted returns,derived from a weighted average of the three-, five-, and 10-year(if applicable) Morningstar metrics.The performance data quoted represents past performance anddoes not guarantee future results. The investment return andprincipal value of an investment will fluctuate; thus an investor'sshares, when sold or redeemed, may be worth more or less thantheir original cost.Current performance may be lower or higher than return dataquoted herein. For performance data current to the most recentmonth-end, please call 877-435-8105 or visitwww.hardingloevnerfunds.com.
Fees and ExpensesSales Charges
Front-End Load % NADeferred Load % NA
Fund Expenses
Management Fees % 0.7412b1 Expense % NAGross Expense Ratio % 0.87
Risk and Return Profile3 Yr 5 Yr 10 Yr
294 funds 275 funds 161 funds
Morningstar RatingTM 3Q 4Q 5QMorningstar Risk Avg -Avg AvgMorningstar Return Avg +Avg High
3 Yr 5 Yr 10 Yr
Standard Deviation 12.25 15.60 18.03Mean 10.50 7.42 7.39Sharpe Ratio 0.87 0.53 0.41
MPT Statistics Standard Index Best Fit IndexMSCI ACWI Ex USA
NR USDAlpha 2.21 2.21Beta 0.90 0.90R-Squared 91.66 91.66
12-Month Yield —Potential Cap Gains Exp 14.68%
7 7 7 7 7 7 7 7 7 7 7 791 98 98 98 96 97 98 94 96 96 96 97
4k
10k
20k
40k
60k80k100k
Investment StyleEquityStock %
Growth of $10,000
Harding Loevner InternationalEq Instl28,923Category Average25,300Standard Index28,075
_ ) & ( ( & * & * & ) & Performance Quartile(within category)
2003 2004 2005 2006 2007 2008 2009 2010 2011 2012 2013 12-14 History
12.18 13.54 16.18 18.47 19.06 9.18 12.80 14.98 13.36 15.94 18.03 17.56 NAV/Price
26.96 11.64 20.16 23.01 13.01 -39.24 40.57 17.49 -9.78 20.28 14.02 -1.61 Total Return %
-13.87 -9.26 3.54 -3.64 -3.64 6.28 -0.88 6.34 3.93 3.45 -1.27 2.26 +/- Standard Index
-7.46 -5.08 3.45 -0.60 -8.02 6.37 1.90 3.04 4.43 3.62 -1.47 1.04 +/- Category Index
— 87 14 58 73 3 27 22 31 24 77 24 % Rank Cat
— 221 213 243 220 251 266 261 251 250 278 341 No. of Funds in Cat
Portfolio Analysis 12-31-2014Asset Allocation % Net % Long % Short %
Cash 2.32 2.32 0.00US Stocks 4.18 4.18 0.00Non-US Stocks 92.41 92.41 0.00Bonds 0.00 0.00 0.00Other/Not Clsfd 1.10 1.10 0.00
Total 100.00 100.00 0.00
Equity Style
Value Blend Growth
LargeM
idSm
all
Portfolio Statistics PortAvg
RelIndex
RelCat
P/E Ratio TTM 18.9 1.24 1.07P/C Ratio TTM 14.0 1.66 1.18P/B Ratio TTM 2.7 1.69 1.13Geo Avg Mkt Cap$mil
41294 1.40 1.40
Fixed-Income Style
Ltd Mod Ext
HighM
edLow
Avg Eff Maturity —Avg Eff Duration —Avg Wtd Coupon —Avg Wtd Price —
Credit Quality Breakdown — Bond %
AAA —AA —A —
BBB —BB —B —
Below B —NR —
Regional Exposure Stock % Rel Std Index
Americas 10.8 0.96Greater Europe 55.7 1.10Greater Asia 33.5 0.88
Share Chgsince09-2014
ShareAmount
Holdings:54 Total Stocks , 0 Total Fixed-Income,10% Turnover Ratio
% NetAssets
T 2 mil Nestle SA ADR 3.90
T 3 mil Dassault Systemes SA 3.86
T 27 mil AIA Group Ltd 3.54
R 12 mil ICICI Bank Ltd ADR 3.26
T 6 mil WPP PLC 3.16
T 995,680 Air Liquide SA 2.95
T 452,200 Roche Holding AG Dividend Right Ce 2.94
T 736,200 Allianz SE 2.94
T 5 mil Unicharm Corp 2.76
T 604,500 L'Oreal SA 2.44
T 605,300 Fanuc Corp 2.40
T 1 mil Canadian National Railway Co 2.39
T 882,900 Anheuser-Busch Inbev SA ADR 2.38
T 864,700 Bayerische Motoren Werke AG 2.25
T 963,060 Bunge Ltd 2.10
Sector Weightings Stocks % Rel Std Index
h Cyclical 34.9 0.75
r Basic Materials 5.7 0.69t Consumer Cyclical 8.9 0.86y Financial Services 19.1 0.79u Real Estate 1.1 0.33
j Sensitive 36.9 1.17
i Communication Services 1.8 0.31o Energy 7.1 0.96p Industrials 11.8 1.17a Technology 16.2 1.95
k Defensive 28.2 1.27
s Consumer Defensive 15.2 1.53d Healthcare 13.0 1.49f Utilities 0.0 0.00
Operations
Family: Harding LoevnerManager: MultipleTenure: 14.1 YearsObjective: Foreign Stock
Base Currency: USDTicker: HLMIXMinimum Initial Purchase: $100,000Purchase Constraints: —
Incept: 05-11-1994Type: MFTotal Assets: $4,461.12 mil
Release date 12-31-2014
©2015 Morningstar. All Rights Reserved. The information, data, analyses and opinions contained herein (1) include the confidential and proprietary information of Morningstar, (2) may include, or be derived from, accountinformation provided by your financial advisor which cannot be verified by Morningstar, (3) may not be copied or redistributed, (4) do not constitute investment advice offered by Morningstar, (5) are provided solely forinformational purposes and therefore are not an offer to buy or sell a security, and (6) are not warranted to be correct, complete or accurate. Except as otherwise required by law, Morningstar shall not be responsible for anytrading decisions, damages or other losses resulting from, or related to, this information, data, analyses or opinions or their use. This report is supplemental sales literature. If applicable it must be preceded or accompaniedby a prospectus, or equivalent, and disclosure statement.
ß®
Page 3 of 10
13
Oppenheimer InternationalGrowth Y (USD)
Morningstar Analyst RatingTM
„08-21-2014
Overall Morningstar RatingTM Standard Index Category Index Morningstar CatQQQQQ MSCI ACWI Ex
USA NR USDMSCI ACWI ExUSA Growth NRUSD
US OE Foreign LargeGrowth294 US OE Foreign Large
Growth
Performance 12-31-2014Quarterly Returns 1st Qtr 2nd Qtr 3rd Qtr 4th Qtr Total %
2012 13.56 -6.69 8.14 6.56 22.102013 6.06 0.15 11.31 6.11 25.462014 1.02 1.35 -8.19 -1.05 -6.99
Trailing Returns 1 Yr 3 Yr 5 Yr 10 Yr Incept
Load-adj Mthly -6.99 12.53 8.78 — 7.28Std 12-31-2014 -6.99 — 8.78 — 7.28Total Return -6.99 12.53 8.78 7.61 7.28
+/- Std Index -3.12 3.53 4.35 2.48 —+/- Cat Index -4.34 3.06 3.59 2.18 —
% Rank Cat 85 18 8 1
No. in Cat 341 294 275 161
Subsidized Unsubsidized
7-day Yield — —30-day SEC Yield — —
Performance DisclosureThe Overall Morningstar Rating is based on risk-adjusted returns,derived from a weighted average of the three-, five-, and 10-year(if applicable) Morningstar metrics.The performance data quoted represents past performance anddoes not guarantee future results. The investment return andprincipal value of an investment will fluctuate; thus an investor'sshares, when sold or redeemed, may be worth more or less thantheir original cost.Current performance may be lower or higher than return dataquoted herein. For performance data current to the most recentmonth-end, please call 800-225-5677 or visitwww.oppenheimerfunds.com.
Fees and ExpensesSales Charges
Front-End Load % NADeferred Load % NA
Fund Expenses
Management Fees % 0.6512b1 Expense % NAGross Expense Ratio % 0.89
Risk and Return Profile3 Yr 5 Yr 10 Yr
294 funds 275 funds 161 funds
Morningstar RatingTM 4Q 5Q 5WMorningstar Risk Avg Avg -AvgMorningstar Return +Avg High High
3 Yr 5 Yr 10 Yr
Standard Deviation 12.60 16.30 17.72Mean 12.53 8.78 7.61Sharpe Ratio 1.00 0.59 0.42
MPT Statistics Standard Index Best Fit IndexMSCI EAFE Growth
NR USDAlpha 4.07 1.61Beta 0.90 0.98R-Squared 86.79 93.06
12-Month Yield —Potential Cap Gains Exp 12.91%
7 7 7 7 7 7 7 7 7 7 7 793 98 98 99 95 89 94 90 94 95 92 98
4k
10k
20k
40k
60k80k100k
Investment StyleEquityStock %
Growth of $10,000
Oppenheimer InternationalGrowth Y37,139Category Average25,300Standard Index28,075
_ _ _ & ( & * * & & & ) Performance Quartile(within category)
2003 2004 2005 2006 2007 2008 2009 2010 2011 2012 2013 12-14 History
— — 21.60 27.79 30.94 17.83 24.43 27.90 25.52 30.71 38.16 35.08 NAV/Price
53.20 16.46 14.24 30.18 12.93 -41.22 38.44 15.35 -7.31 22.10 25.46 -6.99 Total Return %
12.38 -4.44 -2.38 3.53 -3.73 4.30 -3.01 4.20 6.39 5.27 10.17 -3.12 +/- Standard Index
18.78 -0.26 -2.48 6.57 -8.10 4.39 -0.24 0.89 6.89 5.43 9.97 -4.34 +/- Category Index
— — — 5 74 10 36 33 13 11 7 85 % Rank Cat
— — — 243 220 251 266 261 251 250 278 341 No. of Funds in Cat
Portfolio Analysis 12-31-2014Asset Allocation % Net % Long % Short %
Cash 1.64 1.64 0.00US Stocks 2.30 2.30 0.00Non-US Stocks 95.21 95.21 0.00Bonds 0.00 0.00 0.00Other/Not Clsfd 0.85 0.85 0.00
Total 100.00 100.00 0.00
Equity Style
Value Blend Growth
LargeM
idSm
all
Portfolio Statistics PortAvg
RelIndex
RelCat
P/E Ratio TTM 20.9 1.37 1.18P/C Ratio TTM 13.0 1.55 1.10P/B Ratio TTM 3.3 2.08 1.39Geo Avg Mkt Cap$mil
14838 0.50 0.50
Fixed-Income Style
Ltd Mod Ext
HighM
edLow
Avg Eff Maturity —Avg Eff Duration —Avg Wtd Coupon —Avg Wtd Price —
Credit Quality Breakdown — Bond %
AAA —AA —A —
BBB —BB —B —
Below B —NR —
Regional Exposure Stock % Rel Std Index
Americas 7.8 0.69Greater Europe 82.1 1.62Greater Asia 10.1 0.27
Share Chgsince12-2014
ShareAmount
Holdings:103 Total Stocks , 70 Total Fixed-Income,12% Turnover Ratio
% NetAssets
T 1 mil Continental AG 1.70
T 6 mil Dollarama Inc 1.67
T 4 mil SAP SE 1.56
T 6 mil Carnival Corp 1.47
T 11 mil Burberry Group PLC 1.47
T 5 mil Wolseley PLC 1.44
T 812,378 Syngenta AG 1.42
T 9 mil Aalberts Industries NV 1.40
T 6 mil Amadeus IT Holding SA 1.38
T 935,031 Roche Holding AG Dividend Right Ce 1.38
T 6 mil Novo Nordisk A/S Class B 1.375 mil Royal Boskalis Westminster NV 1.36
T 3 mil Aryzta AG 1.34
T 35 mil ICAP PLC 1.33
T 9 mil Bunzl PLC 1.33
Sector Weightings Stocks % Rel Std Index
h Cyclical 31.7 0.68
r Basic Materials 4.2 0.50t Consumer Cyclical 21.9 2.10y Financial Services 5.7 0.23u Real Estate 0.0 0.00
j Sensitive 43.4 1.38
i Communication Services 7.0 1.23o Energy 0.8 0.10p Industrials 20.5 2.02a Technology 15.2 1.82
k Defensive 24.9 1.12
s Consumer Defensive 15.1 1.52d Healthcare 9.8 1.12f Utilities 0.0 0.00
Operations
Family: OppenheimerFundsManager: MultipleTenure: 18.9 YearsObjective: Foreign Stock
Base Currency: USDTicker: OIGYXMinimum Initial Purchase: $0Purchase Constraints: A
Incept: 09-07-2005Type: MFTotal Assets: $19,415.17 mil
Release date 12-31-2014 | Note: Portions of the analysis are based on pre-inception returns. Please read disclosure for more information.
©2015 Morningstar. All Rights Reserved. The information, data, analyses and opinions contained herein (1) include the confidential and proprietary information of Morningstar, (2) may include, or be derived from, accountinformation provided by your financial advisor which cannot be verified by Morningstar, (3) may not be copied or redistributed, (4) do not constitute investment advice offered by Morningstar, (5) are provided solely forinformational purposes and therefore are not an offer to buy or sell a security, and (6) are not warranted to be correct, complete or accurate. Except as otherwise required by law, Morningstar shall not be responsible for anytrading decisions, damages or other losses resulting from, or related to, this information, data, analyses or opinions or their use. This report is supplemental sales literature. If applicable it must be preceded or accompaniedby a prospectus, or equivalent, and disclosure statement.
ß®
Page 4 of 10
14
15
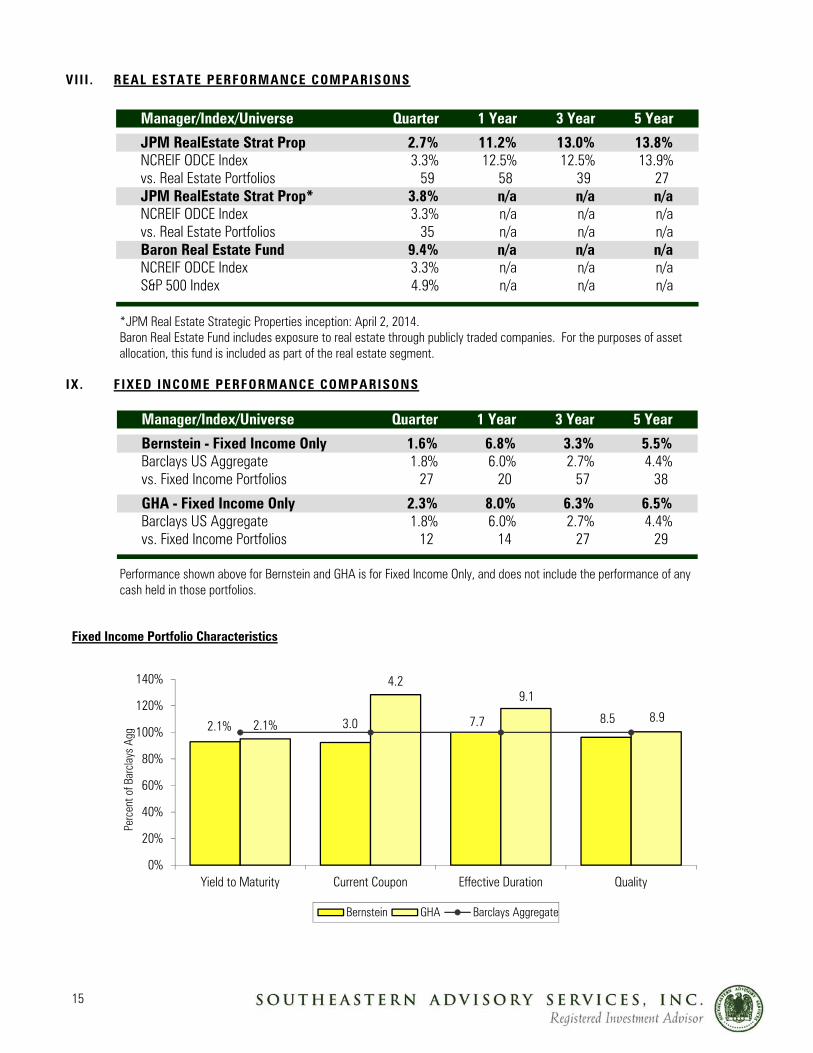
VII I . REAL ESTATE PERFORMANCE COMPARISONS
Manager/Index/Universe Quarter 1 Year 3 Year 5 Year
JPM RealEstate Strat Prop 2.7% 11.2% 13.0% 13.8%NCREIF ODCE Index 3.3% 12.5% 12.5% 13.9%vs. Real Estate Portfolios 59 58 39 27 JPM RealEstate Strat Prop* 3.8% n/a n/a n/aNCREIF ODCE Index 3.3% n/a n/a n/avs. Real Estate Portfolios 35 n/a n/a n/aBaron Real Estate Fund 9.4% n/a n/a n/aNCREIF ODCE Index 3.3% n/a n/a n/aS&P 500 Index 4.9% n/a n/a n/a
*JPM Real Estate Strategic Properties inception: April 2, 2014. Baron Real Estate Fund includes exposure to real estate through publicly traded companies. For the purposes of asset allocation, this fund is included as part of the real estate segment.
IX . FIXED INCOME PERFORMANCE COMPARISONS
Manager/Index/Universe Quarter 1 Year 3 Year 5 Year
Bernstein - Fixed Income Only 1.6% 6.8% 3.3% 5.5%Barclays US Aggregate 1.8% 6.0% 2.7% 4.4%vs. Fixed Income Portfolios 27 20 57 38
GHA - Fixed Income Only 2.3% 8.0% 6.3% 6.5%Barclays US Aggregate 1.8% 6.0% 2.7% 4.4%vs. Fixed Income Portfolios 12 14 27 29
Performance shown above for Bernstein and GHA is for Fixed Income Only, and does not include the performance of any cash held in those portfolios.
Fixed Income Portfolio Characteristics
2.1% 3.0 7.7 8.52.1%
4.29.1
8.9
0%
20%
40%
60%
80%
100%
120%
140%
Yield to Maturity Current Coupon Effective Duration Quality
Perc
ent o
f Bar
clay
s Ag
g
Bernstein GHA Barclays Aggregate

Baron Real EstateInstitutional (USD)
Overall Morningstar RatingTM Standard Index Category Index Morningstar CatQQQQQ MSCI ACWI NR
USDS&P United StatesREIT TR USD
US OE Real Estate236 US OE Real Estate
Performance 12-31-2014Quarterly Returns 1st Qtr 2nd Qtr 3rd Qtr 4th Qtr Total %
2012 15.76 1.99 13.42 6.77 42.992013 13.27 -3.30 6.17 9.63 27.482014 4.95 4.33 -2.40 9.41 16.93
Trailing Returns 1 Yr 3 Yr 5 Yr 10 Yr Incept
Load-adj Mthly 16.93 28.69 22.21 — 22.22Std 12-31-2014 16.93 — 22.21 — 22.22Total Return 16.93 28.69 22.21 — 22.22
+/- Std Index 12.76 14.59 13.04 — —+/- Cat Index -13.34 12.37 5.20 — —
% Rank Cat 96 1 1 —
No. in Cat 274 236 192 —
Subsidized Unsubsidized
7-day Yield — —30-day SEC Yield — —
Performance DisclosureThe Overall Morningstar Rating is based on risk-adjusted returns,derived from a weighted average of the three-, five-, and 10-year(if applicable) Morningstar metrics.The performance data quoted represents past performance anddoes not guarantee future results. The investment return andprincipal value of an investment will fluctuate; thus an investor'sshares, when sold or redeemed, may be worth more or less thantheir original cost.Current performance may be lower or higher than return dataquoted herein. For performance data current to the most recentmonth-end, please call 800-992-2766 or visitwww.baronfunds.com.
Fees and ExpensesSales Charges
Front-End Load % NADeferred Load % NA
Fund Expenses
Management Fees % 1.0012b1 Expense % NAGross Expense Ratio % 1.09
Risk and Return Profile3 Yr 5 Yr 10 Yr
236 funds 192 funds 151 funds
Morningstar RatingTM 5Q 5Q —Morningstar Risk -Avg High —Morningstar Return High High —
3 Yr 5 Yr 10 Yr
Standard Deviation 11.98 16.68 —Mean 28.69 22.21 —Sharpe Ratio 2.18 1.29 —
MPT Statistics Standard Index Best Fit IndexMorningstar Mid
Core TR USDAlpha 13.96 5.54Beta 0.88 1.00R-Squared 61.67 76.79
12-Month Yield —Potential Cap Gains Exp 18.71%
0 0 0 0 0 0 0 5 8 8 8 8— — — — — — — 96 99 96 94 96
4k
10k
20k
40k
60k80k100k
Investment StyleEquityStock %
Growth of $10,000
Baron Real EstateInstitutional27,264Category Average20,790Standard Index15,507
_ _ _ _ _ _ _ _ ) & & ) Performance Quartile(within category)
2003 2004 2005 2006 2007 2008 2009 2010 2011 2012 2013 12-14 History
— — — — — — 10.00 12.69 12.56 17.64 22.43 26.14 NAV/Price
— — — — — — — 26.90 0.80 42.99 27.48 16.93 Total Return %
— — — — — — — 14.23 8.15 26.86 4.68 12.76 +/- Standard Index
— — — — — — — -1.57 -7.67 25.00 25.08 -13.34 +/- Category Index
— — — — — — — — 95 1 1 96 % Rank Cat
— — — — — — — — 242 263 259 274 No. of Funds in Cat
Portfolio Analysis 12-31-2014Asset Allocation % Net % Long % Short %
Cash 1.21 1.21 0.00US Stocks 86.43 86.43 0.00Non-US Stocks 9.13 9.13 0.00Bonds 0.00 0.00 0.00Other/Not Clsfd 3.23 3.23 0.00
Total 100.00 100.00 0.00
Equity Style
Value Blend Growth
LargeM
idSm
all
Portfolio Statistics PortAvg
RelIndex
RelCat
P/E Ratio TTM 29.0 1.71 0.76P/C Ratio TTM 17.0 1.71 —P/B Ratio TTM 3.0 1.46 1.17Geo Avg Mkt Cap$mil
7904 0.18 0.65
Fixed-Income Style
Ltd Mod Ext
HighM
edLow
Avg Eff Maturity —Avg Eff Duration —Avg Wtd Coupon —Avg Wtd Price —
Credit Quality Breakdown — Bond %
AAA —AA —A —
BBB —BB —B —
Below B —NR —
Regional Exposure Stock % Rel Std Index
Americas 96.6 1.69Greater Europe 1.8 0.07Greater Asia 1.6 0.09
Share Chgsince09-2014
ShareAmount
Holdings:50 Total Stocks , 0 Total Fixed-Income,19% Turnover Ratio
% NetAssets
4 mil Brookdale Senior Living Inc 9.04
Y 411,330 Jones Lang LaSalle Inc 3.64
T 1 mil Hyatt Hotels Corp 3.61
T 2 mil CBRE Group Inc 3.58
Y 721,950 Starwood Hotels & Resorts Worldwid 3.45
2 mil Capital Senior Living Corp 3.27
Y 495,307 Home Depot Inc 3.07
Y 596,400 Wyndham Worldwide Corp 3.02
Y 217,419 Equinix Inc 2.91
Y 307,307 Mohawk Industries Inc 2.82
R 2 mil Hilton Worldwide Holdings Inc 2.58
T 1 mil Diamond Resorts International Inc 2.40
T 853,400 Norwegian Cruise Line Holdings Ltd 2.35
T 2 mil Kennedy Wilson Europe Real Estate 2.081 mil Kennedy-Wilson Holdings Inc 1.90
Sector Weightings Stocks % Rel Std Index
h Cyclical 77.9 2.03
r Basic Materials 3.4 0.62t Consumer Cyclical 34.1 3.17y Financial Services 1.4 0.07u Real Estate 39.0 13.46
j Sensitive 6.5 0.18
i Communication Services 1.8 0.38o Energy 0.0 0.00p Industrials 0.0 0.00a Technology 4.7 0.35
k Defensive 15.5 0.62
s Consumer Defensive 0.0 0.00d Healthcare 12.9 1.08f Utilities 2.7 0.80
Operations
Family: Baron Capital GroupManager: Jeffrey KolitchTenure: 5.2 YearsObjective: Specialty - Real Estate
Base Currency: USDTicker: BREIXMinimum Initial Purchase: $1 milMinimum IRA Purchase: $1 mil
Purchase Constraints: —Incept: 12-31-2009Type: MFTotal Assets: $1,710.45 mil
Release date 12-31-2014
©2015 Morningstar. All Rights Reserved. The information, data, analyses and opinions contained herein (1) include the confidential and proprietary information of Morningstar, (2) may include, or be derived from, accountinformation provided by your financial advisor which cannot be verified by Morningstar, (3) may not be copied or redistributed, (4) do not constitute investment advice offered by Morningstar, (5) are provided solely forinformational purposes and therefore are not an offer to buy or sell a security, and (6) are not warranted to be correct, complete or accurate. Except as otherwise required by law, Morningstar shall not be responsible for anytrading decisions, damages or other losses resulting from, or related to, this information, data, analyses or opinions or their use. This report is supplemental sales literature. If applicable it must be preceded or accompaniedby a prospectus, or equivalent, and disclosure statement.
ß®
Page 2 of 10
16
17
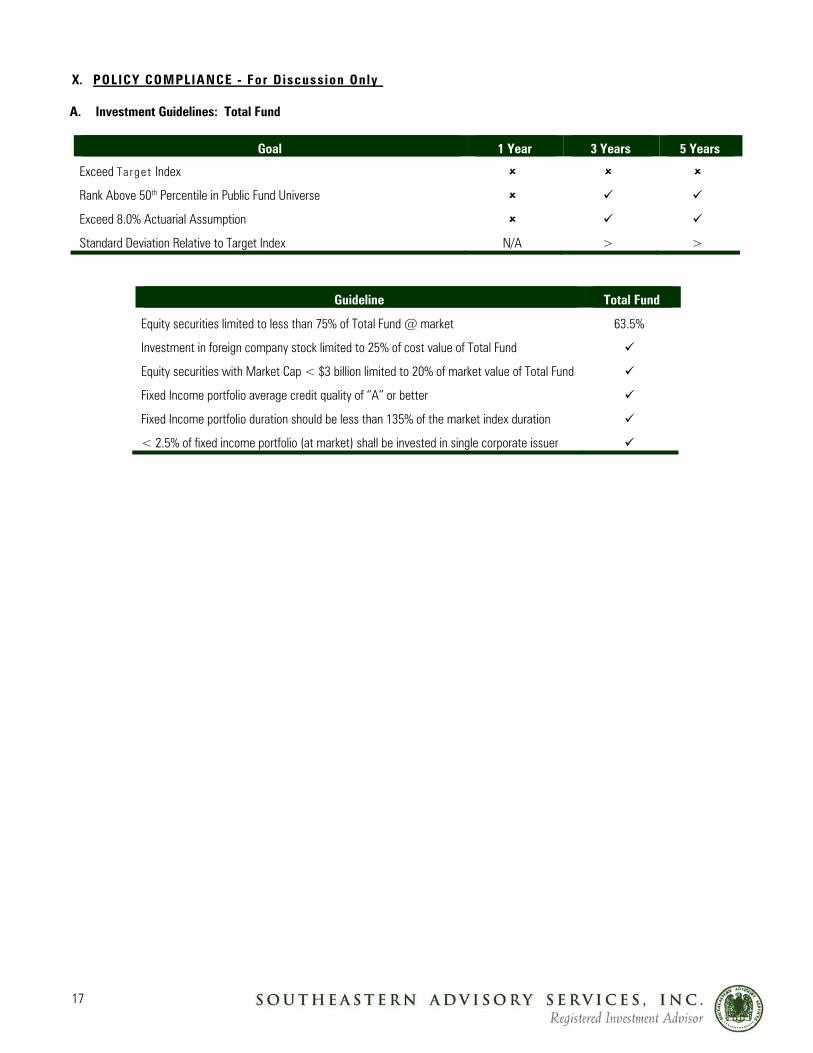
X. POLICY COMPLIANCE - For Discussion Only A. Investment Guidelines: Total Fund
Goal 1 Year 3 Years 5 Years
Exceed Ta rge t Index
Rank Above 50th Percentile in Public Fund Universe
Exceed 8.0% Actuarial Assumption
Standard Deviation Relative to Target Index N/A > >
Guideline Total Fund
Equity securities limited to less than 75% of Total Fund @ market 63.5%
Investment in foreign company stock limited to 25% of cost value of Total Fund
Equity securities with Market Cap < $3 billion limited to 20% of market value of Total Fund
Fixed Income portfolio average credit quality of “A” or better
Fixed Income portfolio duration should be less than 135% of the market index duration
< 2.5% of fixed income portfolio (at market) shall be invested in single corporate issuer

18
B. Fund Performance Objective
Manager
Exceed Benchmark
3-Year
Exceed Benchmark
4-Year
Exceed Benchmark
5-Year
Risk vs. Benchmark
5-Year
DePrince, Race, and Zollo n/a n/a n/a n/a
Garcia Hamilton Equity >
Atlanta Capital n/a n/a
Mutual of America S&P 400 n/a n/a
EuroPacific Growth <
Harding Loevner Intl Equity n/a n/a n/a n/a
Oppenheimer Intl Growth n/a n/a n/a n/a
Alliance Bernstein Fixed >
Garcia Hamilton Fixed <
Baron Real Estate Fund n/a n/a n/a n/a
JPM Real Estate Strategic Properties <
JPM Real Estate Special Situations n/a n/a n/a n/a
Manager
Rank Above 50th Percentile
3-Year
Rank Above 50th Percentile
4-Year
Rank Above 50th Percentile
5-Year
DePrince, Race, and Zollo n/a n/a n/a
Garcia Hamilton Equity 92nd 91st 89th
Atlanta Capital 73rd n/a
Mutual of America S&P 400 60th n/a
EuroPacific Growth
Harding Loevner Intl Equity n/a n/a n/a
Oppenheimer Intl Growth n/a n/a n/a
Alliance Bernstein Fixed 57th
Garcia Hamilton Fixed
Baron Real Estate Fund n/a n/a n/a
JPM Real Estate Strategic Properties
JPM Real Estate Special Situations n/a n/a n/a

19
C. HISTORICAL EARNINGS ANALYSIS (Net of Fees)
Fiscal Year Fiscal Year Earnings Fiscal Year Return 1992 $2,635,666 12.4% 1993 $3,062,820 11.9% 1994 ($567,443) -1.9% 1995 $5,316,432 17.6% 1996 $4,320,516 12.0% 1997 $9,819,224 24.3% 1998 $4,239,413 8.4% 1999 $6,296,353 11.4% 2000 $5,844,369 9.8% 2001 ($6,123,671) -9.4% 2002 ($3,744,638) -6.4% 2003 $7,923,854 14.4% 2004 $4,620,118 7.3%
2005 $7,301,581 10.9% 2006 $5,446,508 7.4% 2007 $11,645,687 14.9% 2008 ($13,013,710) -15.0% 2009 $379,643 0.6% 2010 $7,172,900 9.2% 2011 ($44,118) -0.2% 2012 $16,184,331 17.9% 2013 $14,621,956 13.6% 2014 $12,382,268 10.0%
FYTD 2015 $3,759,928 2.76% FY 1992-2014 $109,479,987 7.5%*
*Annualized, net of fees. All performance and gain/loss data prior to 1Q2008 was provided by the previous consultant, Merrill Lynch Consulting.

20
D. Manager Status
Manager Status Effective Date
Alliance Bernstein Fixed Income Good Standing
Garcia Hamilton Equity Terminated 4Q14
Garcia Hamilton Fixed Income Good Standing
DePrince Race Zollo Good Standing
Atlanta Capital Good Standing
Mutual of America Good Standing
EuroPacific Growth R6 Good Standing
Harding Loevner International Equity Good Standing
Oppenheimer International Growth Good Standing
Baron Real Estate Good Standing
JPM Real Estate Strategic Properties Good Standing
JPM Real Estate Special Situations Good Standing
XI. NOTES
1) The prior investment consultant, Merrill Lynch Consulting Services, provided all performance and market value data for periods prior
to April 1, 2008. 2) Investment Manger fees are not paid directly out of the Alliance Bernstein, Garcia Hamilton, DRZ, Mutual of America, and Atlanta
Capital accounts, therefore those management fees are not included in the Net of Fee performance on page 6.. 3) Funds were transferred to Atlanta Capital and MOA S&P 400 on June 28, 2012. 4) Initial investment in the Atlanta Capital commingled account is January 3, 2011. 5) The inception date of Harding Loevner International Equity and Oppenheimer International Growth was March 21, 2013. 6) Assets were transferred from Alliance Bernstein Equity to DePrince Race Zollo on March 18, 2013. 7) The inception date of Baron Real Estate Fund is March 21, 2014. 8) The inception of JPM Real Estate Special Situations: April 2, 2014.