reactions between simple models of biomolecular compounds
TRANSCRIPT
Reactions between simple models of biomolecular compounds and small
water clusters of the superoxide anion
Marius Friberg Otterstad
Master’s thesis
Faculty of mathematics and natural sciences
UNIVERSITY OF OSLO
15.05.2017

II
Reactions between simple models of biomolecular compounds and small water clusters of the superoxide anion

III
© Marius Friberg Otterstad
2017
Reactions between simple models of biomolecular compounds and small water clusters of the superoxide anion
Marius Friberg Otterstad
http://www.duo.uio.no/
Print: Reprosentralen, Universitetet of Oslo

IV
Abstract
Superoxide anion radical water clusters (O2•–(H2O)n) were formed in an ESI and
analysed using a QTOF-MS instrument. The quadrupole was used to mass-
select the cluster size before entering a collision cell containing the vapour of a
model chemical allowing a reaction to occur between the two species. The
model chemicals used were dimethyl disulphide (DMDS) and acetic acid. The
products were then analysed in a TOF detector. Energy diagrams for the
reactions observed were constructed using computational methods. Dimethyl
disulphide showed a very low reactivity towards superoxide water clusters
other than the formation of adducts. This is likely due to a large energy barrier
for the cleavage of the S-S bond in an SN2 reaction. The determination of the
exact geometry and height of this transition state was unsuccessful. When
naked superoxide (n = 0) reacted with acetic acid, acetic acid was easily
deprotonated, this reaction became less favourable as cluster size increased. As
cluster size increased, adduct formation increased which is always
accompanied by the loss of at least one water molecule. A hypothesis is
proposed that states the endothermic evaporation of a water molecule from
the adduct allows for the removal of excess internal energy which stabilizes the
adduct which is formed from an exothermic process in an adiabatic
environment. Extrapolation of these results indicate adduct formation seems to
be very favourable in bulk solution.

V

VI
Acknowledgments
Although this thesis is result of my many long hours spent behind a computer
screen, several others have contributed to it in their own way and deserve
credit. I would like to thank Glenn B. S. Miller, for literally being right next to
me, teaching me practical things and answering countless questions whenever I
had any. Because lab work and experiments are rarely without technical issues,
Mauritz Ryding and Osamu Sekiguchi have been of great help when showing
me the ropes in the lab and providing tech support whenever an unexpected
problem occurred in the lab. As the deadline approached, Joakim Samuel Jestilä
was very helpful in providing input on any questions I had about the details of
the thesis. A special thanks must be given to my supervisor, Einar Uggerud, for
always being a great source of positivity, inspiration and always pointing me in
the right direction whenever I was lost. I don’t think I could have asked for a
better supervisor.
While they may or may not be aware of it, I’d like to extend a big thanks to my
family and friends, for helping me relax whenever the stress level was at its
highest. Especially my grandparents, Ruth and Rolf, have been very supportive,
with their regular and long phone calls, asking questions and trying to
understand what I say, despite having limited scientific background.
Thank you all so much.

VII
VIII
Table of Contents
1. Introduction ................................................................................................ 1
1.1 - Production and processing of ROS .......................................................... 1
1.2 - The Fenton reaction ................................................................................ 3
1.3 - Other sources of ROS .............................................................................. 4
1.4 – Health issues regarding ROS ................................................................... 5
1.5 – Superoxide ............................................................................................. 6
1.6 – Cluster chemistry ................................................................................... 7
1.7 – The aim of this study .............................................................................. 8
1.7.1 – Dimethyl disulphide ......................................................................... 8
1.7.2 – Acetic acid ........................................................................................ 8
2. Instrument setup ......................................................................................... 9
2.1 - Electrospray Ionization ........................................................................... 9
2.2 - Quadrupole mass analyser .................................................................... 11
2.3 - Collision cell (hexapole) ........................................................................ 14
2.4 - Collision energy ..................................................................................... 16
2.5 - Time of Flight mass analyzer ................................................................. 17
2.6 - The microchannel plates detector ........................................................ 18
2.7 - Quantum chemistry .............................................................................. 19
2.7.1 - The Schrödinger equation ............................................................... 20
2.7.2 - The Born-Oppenheimer approximation .......................................... 20
2.7.3 - The Hartree-Fock method ............................................................... 22
2.7.4 - The self-consistent-field (SCF) procedure ....................................... 24
2.7.5 - Density functional theory ............................................................... 25
2.7.6 - Basis sets ........................................................................................ 26
2.8 - Experimental details ............................................................................. 27
2.8.1 - Collision gas inlet ............................................................................ 27
2.8.2 - Degassing procedure ...................................................................... 28

IX
2.8.3 - Experimental setup ......................................................................... 29
2.8.4 - Execution of experiments involving dimethyl disulphide ................ 32
2.8.5 - Execution of experiments involving acetic acid ............................... 33
3. Results ....................................................................................................... 35
3.1 - Relative abundance............................................................................... 35
3.2 - Dimethyl disulphide .............................................................................. 35
3.2.1 - n = 0 ................................................................................................ 35
3.2.2 - n = 1 ................................................................................................ 36
3.2.3 - n = 2 ................................................................................................ 38
3.2.4 - n = 3, 4 ............................................................................................ 39
3.2.5 - Bond cleavage investigation ........................................................... 42
3.3 - Acetic acid ............................................................................................. 43
3.3.1 - Cluster size (n) ................................................................................ 43
3.3.2 - Collision energy (Ecom) ..................................................................... 46
3.3.3 - Pressure (Pcell) ................................................................................. 48
3.3.4 - Error sources .................................................................................. 49
3.4 – Calculations .......................................................................................... 50
3.4.1 – Superoxide ..................................................................................... 50
3.4.2 - Dimethyl disulphide ........................................................................ 51
3.4.3 - Acetic acid ...................................................................................... 51
4. Discussion .................................................................................................. 52
4.1 - Dimethyl disulphide .............................................................................. 52
4.2 - Acetic acid ............................................................................................. 55
5. Conclusion ................................................................................................. 60
5.1 - Dimethyl disulphide .............................................................................. 60
5.2 - Acetic acid ............................................................................................. 60
6. References ................................................................................................. 61
7. Appendix ................................................................................................... 64

X
7.1 – DMDS ................................................................................................... 64
7.2 – Acetic Acid ........................................................................................... 68
7.2.1 – Energy diagrams for acetic acid ..................................................... 68
7.2.2 – Calculation of the gas phase basicity of O2•– .................................. 71

1
1. Introduction
The superoxide anion radical (O2•-), hydrogen peroxide (H2O2) and the hydroxyl
radical (OH•) are the species known as reactive oxygen species (ROS). A radical is a molecule with unpaired electrons, in this case both the superoxide anion radical and the hydroxyl radical has a single unpaired electron. This electron increases the reactivity of the species significantly, but radicals are usually less stable than their non-radical form and can easily deteriorate. Despite their short lifetime, radicals are of great importance to certain reactions and are the cause of oxidative stress. [1]
While these species may be damaging, they are also used as important signaling molecules. [2] ROS can be removed through metabolic processes involving superoxide dismutase, catalase and non-enzymatic antioxidants. [1] This results in a delicate balance between the production of free radicals and their removal. [3] Should ROS production exceed the cell’s capacity to remove these species, the excess ROS may start causing one or more uncontrolled reactions which damage structures in the cell, resulting in oxidative stress. While it is not the only factor, it is widely accepted that the accumulation of oxidative stress is contributing to the aging process. [1] Oxidative stress is also considered to contribute to a variety of health issues like cancer, neurodegenerative (such as Parkinson’s disease and Alzheimer’s disease), dermatological and cardiovascular diseases. [4-6]
1.1 - Production and processing of ROS
Mitochondria (Figure 1) are organelles which are found inside cells and are where the majority of cellular ROS is produced. The electron transport chain in the mitochondria is responsible for about 90% of the cellular production of reactive oxygen species. [1] The electron transport chain plays a very important role in adenosine triphosphate (ATP) regeneration by oxidative phosphorylation of adenosine diphosphate (ADP) and consists of five complexes named Complex I, II, II, IV and V. When active, the electron transport chain transports an electron through each of the complexes, enabling important redox reactions to occur before finally, an ADP molecule is phosphorylated to an ATP molecule. During energy transduction, small amounts of electrons are prematurely “leaked” from primarily complex I and III which allows oxygen to be reduced to the superoxide anion radical which is

2
considered to be the primary ROS as it can be metabolized into the secondary ROS. The cell regulates the concentration of superoxide anion radicals through the use of the superoxide dismutase (SOD). Superoxide dismutase is a group of enzymes that catalyzes the removal of superoxide anion radicals.
2𝑂2•− + 2𝐻+
𝑆𝑂𝐷→ 𝑂2 +𝐻2𝑂2 (1)
Superoxide dismutase therefore acts as a free radical scavenger which is of great importance to prevent oxidative stress. Experiments performed on mice show reduced amounts of superoxide dismutase leads to increased sensitivity to oxidative stress, while increased amounts usually results in an increased resistance to oxidative stress from high levels of ROS. [7]
Figure 1: Illustration of mitochondria. The figure shows the general structure of the mitochondria as well as the names of its different components [8].
Three types of superoxide dismutase enzymes are produced in the cell. The first one is superoxide dismutase 1 (SOD1, also known as CuZn superoxide dismutase or CuZnSOD) and is a copper and zinc-containing homodimer which is used for its functionality as an enzyme. The second enzyme is superoxide dismutase 2 (SOD2, also known as manganese superoxide dismutase or MnSOD or FeSOD) which is very similar to SOD1, but uses a manganese or iron cation. SOD1 is for the most part located in the cytoplasm of the mitochondria while
3
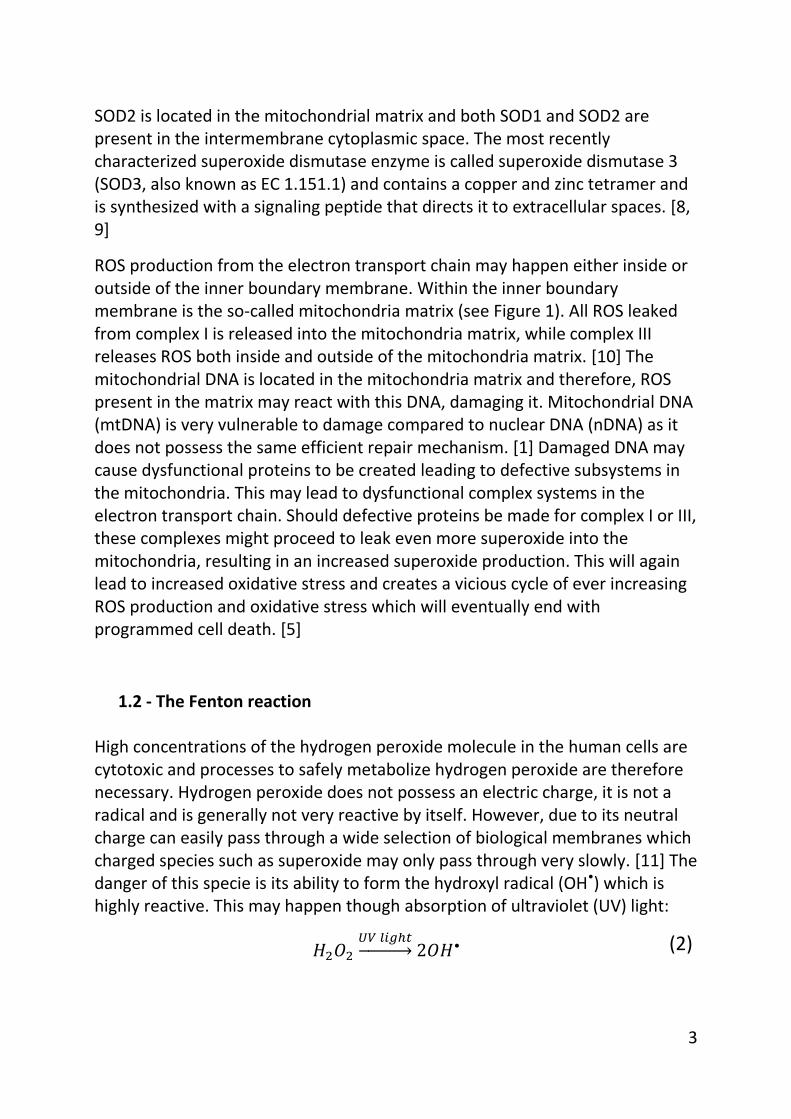
SOD2 is located in the mitochondrial matrix and both SOD1 and SOD2 are present in the intermembrane cytoplasmic space. The most recently characterized superoxide dismutase enzyme is called superoxide dismutase 3 (SOD3, also known as EC 1.151.1) and contains a copper and zinc tetramer and is synthesized with a signaling peptide that directs it to extracellular spaces. [8, 9]
ROS production from the electron transport chain may happen either inside or outside of the inner boundary membrane. Within the inner boundary membrane is the so-called mitochondria matrix (see Figure 1). All ROS leaked from complex I is released into the mitochondria matrix, while complex III releases ROS both inside and outside of the mitochondria matrix. [10] The mitochondrial DNA is located in the mitochondria matrix and therefore, ROS present in the matrix may react with this DNA, damaging it. Mitochondrial DNA (mtDNA) is very vulnerable to damage compared to nuclear DNA (nDNA) as it does not possess the same efficient repair mechanism. [1] Damaged DNA may cause dysfunctional proteins to be created leading to defective subsystems in the mitochondria. This may lead to dysfunctional complex systems in the electron transport chain. Should defective proteins be made for complex I or III, these complexes might proceed to leak even more superoxide into the mitochondria, resulting in an increased superoxide production. This will again lead to increased oxidative stress and creates a vicious cycle of ever increasing ROS production and oxidative stress which will eventually end with programmed cell death. [5]
1.2 - The Fenton reaction
High concentrations of the hydrogen peroxide molecule in the human cells are cytotoxic and processes to safely metabolize hydrogen peroxide are therefore necessary. Hydrogen peroxide does not possess an electric charge, it is not a radical and is generally not very reactive by itself. However, due to its neutral charge can easily pass through a wide selection of biological membranes which charged species such as superoxide may only pass through very slowly. [11] The danger of this specie is its ability to form the hydroxyl radical (OH•) which is highly reactive. This may happen though absorption of ultraviolet (UV) light:
𝐻2𝑂2𝑈𝑉 𝑙𝑖𝑔ℎ𝑡→ 2𝑂𝐻• (2)

4
Hydrogen peroxide may also react with a transition metal, for instance Fe2+ and a proton to form a hydroxyl radical through the Fenton reaction: [1, 12]
𝐻2𝑂2 + 𝐹𝑒2+ +𝐻+ → 𝐻2𝑂 + 𝑂𝐻
• + 𝐹𝑒3+ (3)
Several metal cations may be used in the Fenton reaction (eq (3)), such as cobalt(II) and titanium(III), however, due to the low amount of such metal cations in vivo, only Fe2+ is the metal cation used for the Fenton reaction in vivo under normal conditions. [11] Hydrogen peroxide will react with an unincorporated Fe2+ cation or the Fe2+ cation in a mononuclear enzyme and undergo the Fenton reaction. The Fe2+ cation is then oxidized to Fe3+ and hydrogen peroxide is reduced to water and a hydroxyl radical. The superoxide anion radical may also react with iron in mononuclear enzymes with similar results. Fe2+ is oxidized to Fe3+ in order to reduce superoxide while reacting with two protons to create hydrogen peroxide (shown in equation (4)). If the Fe2+ was incorporated in an enzyme, it will dissociate from the enzyme as a result in both reactions.
𝐹𝑒2+ + 𝑂2•− + 2𝐻+ → 𝐹𝑒3+ +𝐻2𝑂2 (4)
The loss of this iron cation disables the enzyme which may also be damaged by the hydroxyl radical created by the Fenton reaction. A Fe2+ cation can be added to the enzyme to reactivate it again, but the process is not perfect; many repetitions of this activation may cause the enzyme to slowly lose its efficiency due to the damage from the hydroxyl radical. [9]
1.3 - Other sources of ROS
Although ROS produced in a biological system is a big concern, ROS can also be produced from irradiation of species present in the atmosphere. Species present in the in the lower region of the atmosphere (the troposphere) may undergo photochemical reactions and form ROS or secondary organic aerosols (SOA). For instance, hydrogen peroxide may be formed from the photo-oxidation of formaldehyde. This hydrogen peroxide may then be brought down to lower altitudes by rain. [13] Through photolysis of ozone, an oxygen molecule is formed as well as an oxygen atom in its 1Dg excited state. This excited oxygen can then react with water vapour and produce two hydroxyl radicals. [14]

5
𝑂3𝑈𝑙𝑡𝑟𝑎𝑣𝑖𝑜𝑙𝑒𝑡 𝑙𝑖𝑔ℎ𝑡→ 𝑂2 + 𝑂
∗ (5)
𝑂∗ +𝐻2𝑂 → 2𝑂𝐻• (6)
These hydroxyl radicals can react with ozone and hydrocarbons to produce ROS and SOA. Gasses such as H2O2 are highly soluble species of oxidized species will be removed by the mucus in the upper airways when they are inhaled. SOA (and other ROS associated with such aerosols) on the other hand have different physical properties which allow them to penetrate deep into the lungs and cause oxidative stress. [13]
1.4 – Health issues regarding ROS
Superoxide is mainly generated from the electron transport chain in the mitochondria. The electron transport chain is an important part of the ATP production in the cell and an increased energy demand will result in an increased activity in the electron transport chain. Since superoxide leaks from complex I and III in the electron transport chain, an increase in the production of ATP from this system results in an increase in production of superoxide due to increased activity in the electron transport chain. The brain is metabolically very active and requires a relatively large amount of ATP in order to function properly due to all the neurons located in the brain. The cells in the brain therefore produce more ATP than most organs, resulting in an increased activity in their electron transport chain. This increased ATP production leads to a greater superoxide production in the brain which again leads to increased production of secondary ROS. In addition, iron-containing proteins are found throughout the brain such as cytochromes and ferritin. While most of the iron found in the brain is stored in ferritin, making it less likely to produce hydroxyl radicals compared to free iron cations, brain tissue easily releases iron and copper ions which are capable of producing hydroxyl radicals from hydrogen peroxide, lipid peroxidation and autoxidation of neurotransmitters. The brain’s cerebrospinal spinal fluid does contain transferrin which is capable to bind free iron, but calculations indicate transferrin is often close to or is saturated with iron. [15] The brain also has a lower capacity to repair cellular damage and is therefore believed to be more vulnerable to the effects for ROS. This is of interest when studying neurodegenerative diseases such as Parkinson’s disease

6
and Alzheimer’s diseases. Patients with these diseases have been reported to have neurodegeneration in selective parts of their brain which is assumed to be a result of oxidative stress. [5] Needless to say, superoxide is greatly tied to the occurrence of such health issue.
1.5 – Superoxide
As mentioned in previous sections, superoxide is of vital importance when discussing oxidative stress. Superoxide is made through monovalent reduction of O2.
𝑂2 + 𝑒– ↔ 𝑂2
•– (7)
A recent review published by Maan et al., 2016 gives a good overview of the properties and production of the superoxide anion and some of their reports will be mentioned here. [16]
Superoxide has been studied in both the condensed phase and the gas phase. [17-20] The lower limit of the lifetime of superoxide is has been estimated by computational methods to be approximately 30ps, which is in good agreement with experimental data. [21] The short half-life of superoxide makes quantitative measurements difficult and maintaining superoxide in a stable state long enough for a measurement to complete can be a difficult task. Several methods are capable of producing superoxide, most notably electrochemical methods such as electrospray ionization which has proven to be a good method for producing superoxide. [18] When an electrospray ionizer is combined with a quadrupole time-of-flight mass spectrometer (QTOF-MS), the ions may be passed through a collision cell where a reaction may occur with a collision gas before superoxide dissociates, making it an excellent method to investigate superoxide reactions in the gas phase.
Superoxide has many interesting properties, such as being a good nucleophile for SN2 reactions, a good proton acceptor and electron donor, making superoxide a very interesting specie for scientists to investigate. [16] For instance, superoxide has been used to cleave a disulphide bond with the help of an iron cation. [22] This raises the question if superoxide can cleave disulphide bonds in a biological system and if so, what other bonds can it cleave? Answering these questions will provide valuable insight into
7
superoxide’s behaviour in situ and its role in processes the cause oxidative stress.
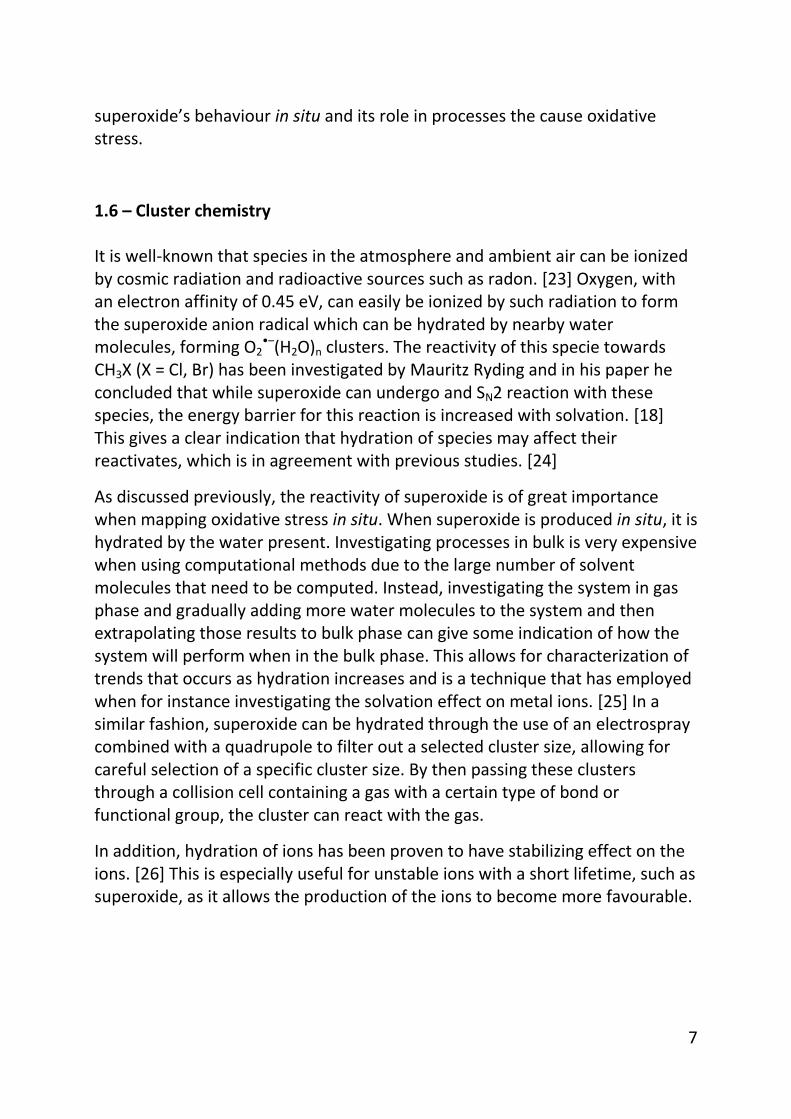
1.6 – Cluster chemistry
It is well-known that species in the atmosphere and ambient air can be ionized by cosmic radiation and radioactive sources such as radon. [23] Oxygen, with an electron affinity of 0.45 eV, can easily be ionized by such radiation to form the superoxide anion radical which can be hydrated by nearby water molecules, forming O2
•–(H2O)n clusters. The reactivity of this specie towards CH3X (X = Cl, Br) has been investigated by Mauritz Ryding and in his paper he concluded that while superoxide can undergo and SN2 reaction with these species, the energy barrier for this reaction is increased with solvation. [18] This gives a clear indication that hydration of species may affect their reactivates, which is in agreement with previous studies. [24]
As discussed previously, the reactivity of superoxide is of great importance when mapping oxidative stress in situ. When superoxide is produced in situ, it is hydrated by the water present. Investigating processes in bulk is very expensive when using computational methods due to the large number of solvent molecules that need to be computed. Instead, investigating the system in gas phase and gradually adding more water molecules to the system and then extrapolating those results to bulk phase can give some indication of how the system will perform when in the bulk phase. This allows for characterization of trends that occurs as hydration increases and is a technique that has employed when for instance investigating the solvation effect on metal ions. [25] In a similar fashion, superoxide can be hydrated through the use of an electrospray combined with a quadrupole to filter out a selected cluster size, allowing for careful selection of a specific cluster size. By then passing these clusters through a collision cell containing a gas with a certain type of bond or functional group, the cluster can react with the gas.
In addition, hydration of ions has been proven to have stabilizing effect on the ions. [26] This is especially useful for unstable ions with a short lifetime, such as superoxide, as it allows the production of the ions to become more favourable.

8
1.7 – The aim of this study
1.7.1 – Dimethyl disulphide
As mentioned in section 1.5, superoxide has been found to be able to cleave a
disulphide bond, but the question still remains if this is possible in a biological
environment. Due to the high water affinity of superoxide it is likely to be
hydrated if water is present, which may alter its reactivity towards the
disulphide bond. A hypothesis this study will test is whether or not superoxide
at various hydration is able to cleave the disulphide bond in dimethyl
disulphide in the gas phase.
1.7.2 – Acetic acid
In a protein, hydrogen bonds between the carboxylic acid groups on the side
chains of amino acids are formed to give the protein its secondary structure.
Should the carboxylic acid group be deprotonated, the group will no longer be
able to act as a hydrogen donor to the hydrogen bond. Should both groups in
the hydrogen bond be deprotonated, they will no longer be able to form a
hydrogen bond with each other. A suitable model molecule for a carboxylic acid
is the acetic acid molecule. In the gas phase, superoxide has a higher proton
affinity than acetate, thus superoxide is able to deprotonate acetic acid, but the
effect hydration has on this reaction has not been studied. [27] The second
hypothesis to be tested in this study is if hydration of the superoxide anion
radical will hinder this deprotonation reaction in the gas phase.

9
2. Instrument setup
All experiments were conducted on a Waters Quadruple Time of Flight 2 W
Mass Spectrometer (QTOF-MS). The various components of this instrument
and how they were used will be explained now.
2.1 - Electrospray Ionization
Electrospray ionization (ESI) is a so-called “soft” ionization method. “Soft”
ionization methods primarily ionize the compounds without destroying their
structure. This method also allows for the transformation of a solution into an
aerosol, which is required in order to analyse the compounds in a mass
spectrometer. When combined with a mass spectrometer, this allows us to
much more easily produce and detect the molecular ion, giving us the mass of
this molecule. Its counterpart, “hard” ionization methods, tends to destroy and
fragment the compound during the ionization process. This allows us to
observe the fragments of the molecular ion, which have a range of uses.
However the signal of the molecular ion is typically very weak when using these
methods. The fragmentation pattern of a compound can be used to determine
the structure by comparing the pattern to a library of fragmentation patterns
of known compounds (such as the NIST library). [28]
In the first step, the solution containing the analytes is passed through a
capillary which is in a region of atmospheric pressure while a high voltage (Ucap)
is applied between the capillary and the entrance to the mass spectrometer.
Due to this potential, when the liquid exits the capillary it forms what is known
as a Taylor cone. At the tip of the cone, charged droplets are formed, released
and pulled towards the opening to the mass spectrometer (Figure 2). The ESI
can form both positive and negative ions by simply switching the polarities of
the voltage applied to the capillary and the opening to the mass spectrometer.
Ucap was chosen to be 3.30kV, but could be reduced to 2.90kV if the signal of
the ion of interest was too strong. One droplet may have a charge which is
greater than one. A nebulizer gas (also called drying gas and is shown as N2 in
Figure 2) is ejected from the sides of the capillary and is often an inert gas such
as nitrogen or argon gas. This gas helps the solvent evaporate, thus reducing

10
the size of the droplets. Desolvation gas (N2 was used for the experiments in
this paper) can also be turned on to further increase the evaporation of the
solvent. As the size of the droplets get smaller, the distance between the
charges is reduced and the repulsive force between the charges increases. Two
forces are acting in the droplet; the surface tension trying to hold the droplet
together, and the coulombic forces from the charges inside the droplet trying
to burst the droplet. When these two forces become equal each other, the
breaking point which is known as the Rayleigh instability limit has been
reached. Should the droplet size be reduced further and pass the Rayleigh
instability limit, the coulombic forces will overcome the surface tension and the
droplet will burst in a coulombic explosion, forming smaller droplets with a
lower charge. [29]
Figure 2: Diagram of Electrospray Ionization. [30]
The maximum number of charges ( 𝑍𝑅𝑒) that can be stored inside a droplet
while still keeping the droplet stable is given by the Rayleigh equation:

11
𝑍𝑅𝑒 = √8𝜋(𝜖0𝛾𝑅3) (8)
Where R is the spherical radius of the droplet, 𝛾 is the surface tension and 𝜖 is
the permittivity of the surrounding solvent. [31]
The smaller droplets that are formed then undergo the same process of solvent
evaporation and coulombic explosion. This process continues until only the
analyte and the charge remains, which then enters the mass spectrometer.
Small amounts of the solvent may still be present on the charged analyte, this
will however change the mass of the ion and can be filtered out through a mass
selection unit in the mass spectrometer.
Through this process, superoxide anions and water clusters of this anion is able
to be produced and fed to the mass spectrometer. The nitrogen gas used
contained some oxygen, which actually improved the superoxide production
compared to when pure nitrogen gas was used.
2.2 - Quadrupole mass analyser
The quadrupole consists of four linear, parallel, metal rods with equal distance
apart, having a distance r0 from the center and a constant stream of ions passes
in the middle between all four rods. While active, two rods on opposite sides
have the same DC current passing through them (U), while the remaining two
rods have the DC current passing through it, but with opposite sign (-U). Both
rod pairs also have an AC component (V), adding to their potential. The AC
component is periodic, with a radio frequency (RF) denoted as ω. The total
potential is given by
𝜙0 = 𝑈 + 𝑉 cos𝜔𝑡 (9)
The ions enter the quadrupole with a velocity that’s parallel to the z-axis and
once inside the electric field, the ion will accelerate along the x- and y-axis.
Because the potential changes over time, the attraction and repulsion in the x-

12
and y-axis will alternate. The motion of the ion in along the x- and y-axis is
described by equations (10) and (11).
𝑑2𝑥
𝑑𝑡2+
𝑒
𝑚𝑖𝑟02(𝑈 + 𝑉 cos𝜔𝑡)𝑥 = 0
(10)
𝑑2𝑦
𝑑𝑡2+
𝑒
𝑚𝑖𝑟02(𝑈 + 𝑉 cos𝜔𝑡)𝑦 = 0
(11)
While the ions may not have a stable trajectory through the quadrupole, as
long as its amplitude in the xy-plane is not too large, the ions will not get
discharged by hitting the poles and instead just pass through. The conditions
for this can be found using the Mathieu equations. When written in
dimensionless terms, equation (10) and (11) yields the following equations:
𝑑2𝑥
𝑑𝜏2+ (𝑎𝑥 + 2𝑞𝑥 cos 2𝜏)𝑥 = 0
(12)
𝑑2𝑦
𝑑𝜏2+ (𝑎𝑦 + 2𝑞𝑦 cos 2𝜏)𝑦 = 0
(13)
When comparing equations (12) and (13) to equations (10) and (11),
expressions for the parameters a and q can be obtained.
𝑎𝑥 = −𝑎𝑦 =
4𝑒𝑈
𝑚𝑖𝑟02𝜔2
(14)
𝑞𝑥 = −𝑞𝑦 =
2𝑒𝑉
𝑚𝑖𝑟02𝜔2
(15)
𝜏 =
𝜔𝑡
2 (16)

13
By adjusting ω, U and V, a certain m/z value or m/z range will have a stable
trajectory through the quadrupole (i.e. the amplitude of the oscillations of the
ions is less than r0). By making a plot of a vs q, a stability diagram is obtained,
showing when the trajectories along both the x- and y-axis are stable, when the
trajectory along either the x- or y-axis is stable, or when neither trajectories are
stable (see Figure 3). By adjusting the U and V voltage, while still keeping their
ratio constant, a very narrow interval of m/z values may have a stable
trajectory through the quadrupole, so narrow in fact, that only a certain m/z
value can pass through. [29, 32]
Figure 3: Stability diagram in the xy-plane of a quadrupole field. Reprinted figure with permission from reference [33] Paul Wolfgang, Reviews of Modern Physics, Volume 62, page 531-540, 1990. Copyright 1990 by the American Physical Society.
14
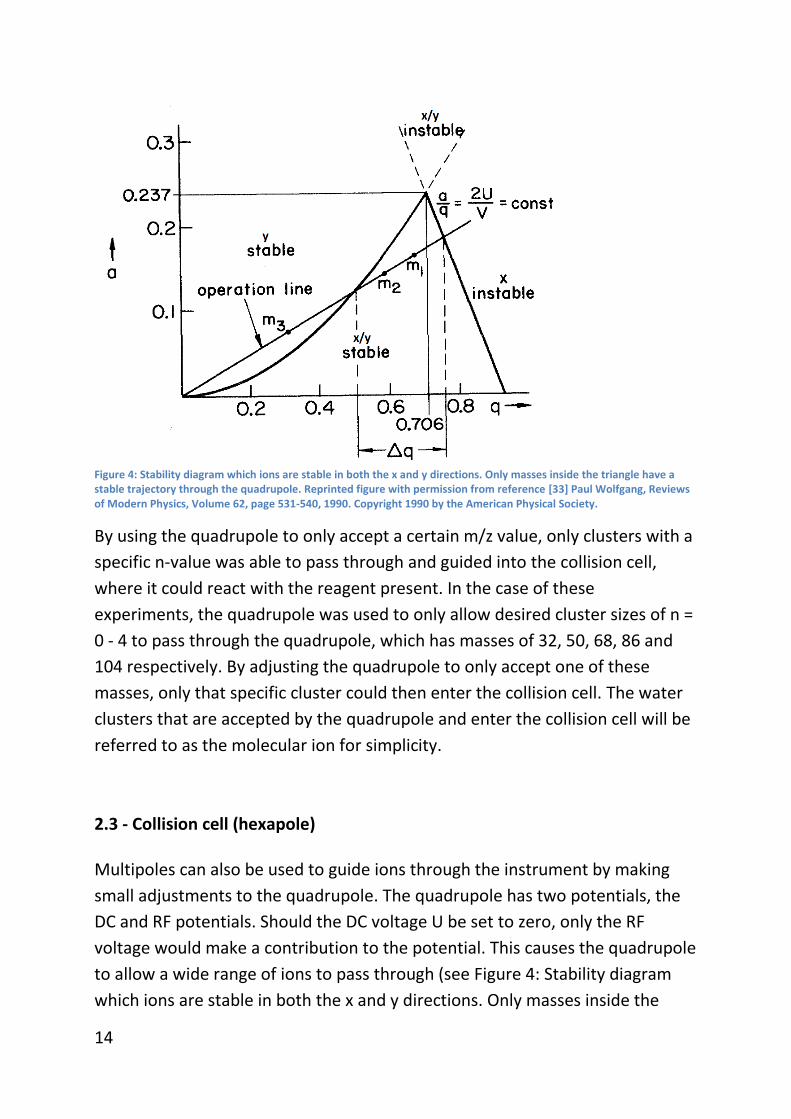
Figure 4: Stability diagram which ions are stable in both the x and y directions. Only masses inside the triangle have a stable trajectory through the quadrupole. Reprinted figure with permission from reference [33] Paul Wolfgang, Reviews of Modern Physics, Volume 62, page 531-540, 1990. Copyright 1990 by the American Physical Society.
By using the quadrupole to only accept a certain m/z value, only clusters with a
specific n-value was able to pass through and guided into the collision cell,
where it could react with the reagent present. In the case of these
experiments, the quadrupole was used to only allow desired cluster sizes of n =
0 - 4 to pass through the quadrupole, which has masses of 32, 50, 68, 86 and
104 respectively. By adjusting the quadrupole to only accept one of these
masses, only that specific cluster could then enter the collision cell. The water
clusters that are accepted by the quadrupole and enter the collision cell will be
referred to as the molecular ion for simplicity.
2.3 - Collision cell (hexapole)
Multipoles can also be used to guide ions through the instrument by making
small adjustments to the quadrupole. The quadrupole has two potentials, the
DC and RF potentials. Should the DC voltage U be set to zero, only the RF
voltage would make a contribution to the potential. This causes the quadrupole
to allow a wide range of ions to pass through (see Figure 4: Stability diagram
which ions are stable in both the x and y directions. Only masses inside the
15
triangle have a stable trajectory through the quadrupole. , if the DC potential is
turned off, i.e. a = 0, a wide range of m/z values will be allowed through the
multipole). This can also be used on hexapoles (6 poles instead of 4) and
octapoles (8 poles instead of 4); however these devices cannot be used be used
to selectively allow a narrow interval of m/z values to pass through. This is due
to the fact that hexapoles and octapoles do not have a sharp cut-off
transmission for various m/z values.
These higher-order RF-only 2N-multipoles have a steeper potential well, which
gives them an increased interval of accepted m/z values and better ion guiding
capabilities (deeper potential well) than what a quadrupole can offer.
Therefore, these higher-order RF 2N-multipoles are used as ion-guiders trough
the instrument. Because neutral ions are not affected by the multipoles, and
can freely exit the potential well between the poles and be pumped out of the
collision cell, while ions are kept trapped within the potential well within the
multipole.
By using a higher-order RF-only 2N multipole to guide the ions into and through
a chamber containing a collision gas, the ions may react or fragment as a result
of collisions with the collision gas. The product-ions produced from this process
are kept within the multipole and guided to a mass analyser and detector for
analysis. In this case, a time of flight detector was used to analyse the mass of
the ions.
A barometer is placed inside the collision cell to allow for pressure
measurements during experiments. The unit of the pressure can be given in the
form of different gasses, in the case of these experiments, the H2O unit was
used. Because the pressure in the collision cell needs to be low in order to
function properly, gas is continuously pumped out of the cell. This causes the
pressure to not be homogenous throughout the cell. In order to increase the
efficiency of this setup, the gas inlet and barometer is placed very close to the
multipole, ensuring the pressure is the highest where the ions are. This setup
however and lack of homogeneousness of the pressure means the observed
pressure reported by the barometer can depend on which instrument is used
and should be considered when attempting to reproducing the pressure
conditions with different instruments. [32, 33]

16
2.4 - Collision energy
When ions collide with the collision gas in the collision cell, a reaction may
occur. What reactions occur may be strongly dependent on the internal energy
of the species during the collision. Careful control of the energy of the species
can therefore be of great importance when investigating various reaction
pathways. This is very important for collision induced dissociation (CID). When
considering CID, a species AB+ is introduced to the collision cell. When AB+
collides with a neutral gas N, the species becomes activated, forming AB*+. The
internal energy of the activated species is then randomly distributed
throughout the system, before dissociating into A+ + B. The reaction equation is
shown in equation (17).
𝐴𝐵+ +𝑁 → 𝐴𝐵+∗ +𝑁 → 𝐴+ + 𝐵 + 𝑁 (17)
The internal energy of the system EAB+* is composed of the energy before the
collision, EAB+, and any energy transferred during the collision, Q.
𝐸𝐴𝐵+∗ = 𝐸𝐴𝐵+ + 𝑄 (18)
If the molecular ion has no metastable decomposition, all the molecular ions
are due to field ionization. This means all the energy of the molecular ion is
from the ionization process. By considering a reference system where the
molecular ion is at rest, (EAB+ = 0) any internal energy available for the
fragmentation process will be due to the transferred energy Q during the
collision. The maximum energy that can be transferred during the collision
forms an upper limit for the energy available for the fragmentation process.
This upper limit for Q is called the center-of-mass energy and is defined by
equation (19):

17
𝐸𝑐𝑜𝑚 = 𝐸𝐿𝐴𝐵𝑚𝑁
𝑚𝑁𝑚𝐴𝐵 (19)
In this equation ELAB is the ion kinetic energy in the laboratory frame of
reference, mN is the mass of the neutral gas molecule and mAB+ is the mass of
the ion.[35] When using the instrument, the ELAB can be adjusted to get the
desired Ecom.
2.5 - Time of Flight mass analyzer
The time-of-flight mass analyzer (TOF) operates on a simple concept; heavier
ions move more slowly than lighter ions, given they have the same kinetic
energy. A continuous stream of ions consisting of products and unreacted
species exits the collision cell and enters TOF region along the x-axis. An
orthogonal accelerator is positioned parallel with the ion stream and pulses
with an electromagnetic field (usually 5-10 kV, although due to the low mass of
the ions analysed in the experiments, this was set to 3.00kV) of the same
polarity of the ions. When the pulse is turned on, the ions in the ion beam
currently positioned over the accelerator are accelerated along the y-axis by
the field generated by the accelerator for the duration of the pulse. This gives
the accelerated ions the same kinetic energy. The accelerated ions will start
moving in the y-direction and eventually hits the detector. The m/z value of the
ion can be determined through measuring the time the ions require to reach
the detector. The formula used is to calculate the m/z ratio is
𝑚𝑖𝑧=2𝑒𝑈𝑡2
𝑠2
(20)
Where e is the charge of an electron, U is the voltage applied to the
accelerator, s is the distance the ions have to travel, and t is the time the ion is
detected after being accelerated.
18
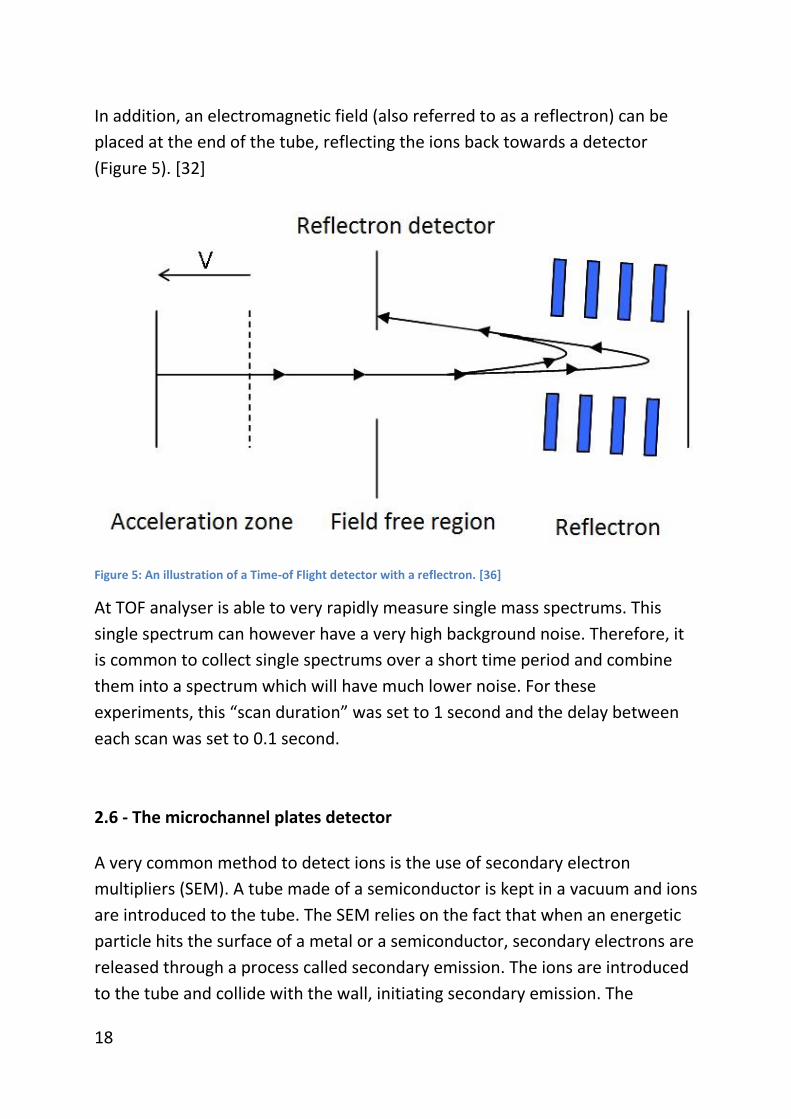
In addition, an electromagnetic field (also referred to as a reflectron) can be
placed at the end of the tube, reflecting the ions back towards a detector
(Figure 5). [32]
Figure 5: An illustration of a Time-of Flight detector with a reflectron. [36]
At TOF analyser is able to very rapidly measure single mass spectrums. This
single spectrum can however have a very high background noise. Therefore, it
is common to collect single spectrums over a short time period and combine
them into a spectrum which will have much lower noise. For these
experiments, this “scan duration” was set to 1 second and the delay between
each scan was set to 0.1 second.
2.6 - The microchannel plates detector
A very common method to detect ions is the use of secondary electron
multipliers (SEM). A tube made of a semiconductor is kept in a vacuum and ions
are introduced to the tube. The SEM relies on the fact that when an energetic
particle hits the surface of a metal or a semiconductor, secondary electrons are
released through a process called secondary emission. The ions are introduced
to the tube and collide with the wall, initiating secondary emission. The
19
emitted electrons may again collide with another wall in the tube, resulting in
further secondary emission, creating more secondary electrons. This creates an
avalanche of electrons, rapidly increasing the number of secondary electrons,
which can be detected. By applying a positive potential that gradually increases
trough the tube, the emitted electrons are pulled further into the tube by the
attractive forces of the potential. In order to achieve a gradually increasing
voltage throughout the tube the material used must have a sufficiently high
resistance.
A channel electron multiplier (CEM) is a linear, heavily lead-doped glass tube,
with its inside coated by a conductive layer of leadoxide, which is again coated
by a layer of silicone dioxide. This construction allows the tube to withstand the
high voltage applied to the tube (about 2 kV). A linear CEM is unstable at gains
exceeding 104 due to an effect called ion-feedback. Residual gas becomes
ionized during electronic ionization (EI), forming positive ions which become
attracted to the inlet of the CEM tube, and generate random signals. When the
tube is curved the gain increases to 108 due to a reduction in the free-path of
the ions. This great increase in gain supresses the noise from the ion-feedback.
The microchannel plates (MCP) consists of millions of very tiny, linear CEMs.
These CEMs are bundled together, forming a microchannel plate (MCP). To
reduce the free-path of the ions and increase the gain, the channels are
inclined a tiny bit from being perpendicular to the plate’s surface. The gain of a
single MCP is about 103-104, which is lower than a CEM and SEM, but by
combining two MCPs together in such a way the inclined angles of the channels
oppose each other, the gain is increased to 106-107. [32]
2.7 - Quantum chemistry
The topics covered here are well known and covered by most quantum
chemistry courses and introductory books. This chapter will only cover the
main parts of quantum chemistry theory. For the sources used here see the
following references. [37-39]
20
2.7.1 - The Schrödinger equation
In classical mechanics, a system is described by the positions, masses, and
forces acting on the different bodies in question. For this, Newton’s laws are
used to calculate how the system will evolve over time. In quantum mechanics,
a system is described by a wave function and evolves over time following the
Schrödinger equation. The Schrödinger equation was proposed by Erwin
Schrödinger in 1926 and the general form (in one dimension) can be written as
𝐻𝛹 = 𝐸𝛹 = 𝑖ℏ
𝑑𝛹
𝑑𝑡= −
ℏ2
2𝑚
𝑑2𝛹
𝑑𝑥2+ 𝑉(𝑥)𝛹
(21)
H is the Hamiltonian operator, Ψ is the wave function that is a function of both
position and time, ℏ is the Planck constant divided by 2𝜋 (ℎ
2𝜋), V(x) is the
potential as a function of x and i is the imaginary number. By using the
technique separation of variables, the time-independent Schrödinger equation
can be derived and has the form
𝐻𝜓 = 𝐸𝜓 = −
ℏ2
2𝑚
𝑑2𝜓
𝑑𝑥2+ 𝑉(𝑥)𝜓
(22)
Here, ψ is the wave function, but is only dependent on the position of the
particle and E is the energy of the system. These equations can all be
transformed to apply for all three dimensions, making the functions which are
dependent on x to also be dependent on y and z coordinates as well and
making the double derivatives also include the d2/dy2 and d2/dz2 derivatives as
well. To simplify this derivative, the Laplacian operator can be used, which is
simply the d2/dx2, d2/dy2 and d2/dz2 derivative and is symbolized by ∇2.
2.7.2 - The Born-Oppenheimer approximation
The Hamiltonian operator for a system with N electrons and M nuclei can be
separated into several terms (written in atomic units):

21
𝐻 = −∑
1
2∇𝑖2 −∑
1
2𝑀𝐴
𝑀
𝐴=1
𝑁
𝑖=1
∇𝐴2 −∑∑
𝑍𝐴𝑟𝑖𝐴
𝑀
𝐴=1
𝑁
𝑖=1
+∑∑1
𝑟𝑖𝑗+∑∑
𝑍𝐴𝑍𝐵𝑅𝐴𝐵
𝑀
𝐵>𝐴
𝑀
𝐴=1
𝑁
𝑗>𝑖
𝑁
𝑖=1
(23)
Where i and j are specific electrons, MA is the ratio of the mass of nucleus A to
the mass of an electron, ZA is the atomic number of nucleus A, rij is the distance
between electron i and j, riA is the distance between electron i and nuclei A, RAB
is the distance between nuclei A and B and ∇2 is the Laplacian operator. In this
equation, the two first terms are the operators for the kinetic energy of the
electrons and nuclei, respectively, the third term is the coulomb attraction
between the electrons and the nuclei and finally the fourth and the fifth term
represent the repulsion between the electrons and the nuclei, respectively.
A vital part of quantum chemistry is the Born-Oppenheimer approximation.
Because the nuclei are much heavier than electrons and moves a lot slower,
the Born-Oppenheimer approximation assumes the electrons are the only
particles moving and the nuclei are static objects. Because the nuclei are
considered as fixed bodies, their kinetic energy will be zero and the coulomb
repulsion between the nuclei will be constant. If a constant is added to the
expression in an operator, that constant is simply added to the operator
eigenvalues and does not change the eigenfunctions. Therefore, both the
second and fifth term of equation (23) (the terms for kinetic energy of the
nuclei and the repulsion between them) can be removed from the operator
and added to the result later. The remaining expression is called the electronic
Hamiltonian:
𝐻𝑒𝑙𝑒𝑐 = −∑
1
2∇𝑖2
𝑁
𝑖=1
−∑∑𝑍𝐴𝑟𝑖𝐴
𝑀
𝐴=1
𝑁
𝑖=1
+∑∑1
𝑟𝑖𝑗
𝑁
𝑗>𝑖
𝑁
𝑖=1
(24)

22
Because the system now considers the nuclei as fixed bodies, a new wave
function can be made: one that depends explicitly on the coordinates of the
electrons and parametrically on the coordinates of the nuclei.
𝜓𝑒𝑙𝑒𝑐 = 𝜓𝑒𝑙𝑒𝑐({𝑟𝑖}; {𝑅𝐴}) (25)
The Schrödinger equation using the electric Hamiltonian and the electric wave
function then becomes:
𝐻𝑒𝑙𝑒𝑐𝜓𝑒𝑙𝑒𝑐 = 𝜀𝑒𝑙𝑒𝑐𝜓𝑒𝑙𝑒𝑐 (26)
In equation (26), 𝜀𝑒𝑙𝑒𝑐 is the electronic energy. However, to get the total
energy, the nuclear repulsion must also be included:
𝜀𝑡𝑜𝑡 = 𝜀𝑒𝑙𝑒𝑐 +∑∑
𝑍𝐴𝑍𝐵𝑅𝐴𝐵
𝑀
𝐵>𝐴
𝑀
𝐴=1
(27)
The main problem in quantum chemistry is to determine the electronic energy,
however through the Born-Oppenheimer approximation; this has been
simplified to being a value that relies only explicitly on the coordinates of the
electrons and parametrically on the nuclei.
2.7.3 - The Hartree-Fock method
The first step in deriving the Hartree-Fock (HF) method is to properly describe
the orbitals by a single determinant and ensuring the orbitals are the best
approximation of the ground state for the N-electron system which is described
by the electric Hamiltonian. The variation principle states that the best spin
23
orbitals must have a form which minimizes the electronic energy given by the
expression in equation (28).
𝐸0 =< 𝛹0|𝐻|𝛹0 >
= ∑ < 𝑎|ℎ|𝑎 >
𝑎
+1
2∑ < 𝑎𝑏||𝑎𝑏 >
𝑎𝑏
=∑ < 𝑎|ℎ|𝑎 >
𝑎
+1
2∑[𝑎𝑎|𝑏𝑏] − [𝑎𝑏|𝑏𝑎]
𝑎𝑏
(28)
In equation (28), <a|h|a> is the energy contribution of the kinetic and
potential energy of electron a, [aa|bb] is the coulombic interaction between
electron a and b, and [ab|ba] is the exchange interaction between electron a
and b and 𝛹0 is the slater determinant for the ground state of the system.
Because the last sums in the equation includes the interaction between a
specific electron and all other electrons, every interaction is counted twice,
which is the reason why the sum is multiplied by ½ to counteract this. The
orbitals also have to be orthonormal, so adjusting the spin orbitals while
keeping them orthonormal in order to obtain the lowest possible energy for
the system will yield an equation that defines the best possible spin orbitals.
This equation is called the Hartree-Fock integro-differential equation and has
the form
ℎ(1)𝜒𝑎(1) +∑ [∫𝑑𝑥2|𝜒𝑏(2)|
2𝑟12−1] 𝜒𝑎(1)
𝑏≠𝑎
−∑ [∫𝑑𝑥2𝜒𝑏∗(2)𝜒𝑎(2)𝑟12
−1] 𝜒𝑏(1)
𝑏≠𝑎
= 𝜀𝑎𝜒𝑎(1)
(29)
Where the first term is the kinetic and electron-nuclei attraction of electron 1,
χa is spin orbital a, the first and second sums are the coulomb and exchange
terms respectively and 𝜀a is the orbital energy for the spin orbital χa. From this
equation an operator called the Fock-operator can be derived and has the form

24
𝑓(1) = ℎ(1) +∑𝑔𝑏(1) − 𝐾𝑏(1)
𝑏
(30)
Equation (2) is the Fock-operator for electron 1, where gb is the coulombic term
and Kb is the exchange term in equation (19). The Fock-operator is used to
describe the Hartree-Fock (HF) Hamiltonian, H0, which is an approximate
Hamiltonian that can be solved exactly for an N-electron system.
𝐻0 = ∑𝑓(𝑖)
𝑁
𝑖=1
(31)
By using the Hartree-Fock Hamiltonian on the slater-determinant for the
ground state, the Hartree-Fock energy is found for the ground state of the
system.
𝐻0|𝛹0 > = 𝐸00|𝛹0 > (32)
Where
𝐸0(0) = ∑𝜀𝑎
𝑎
(33)
This energy is not exact, but can be improved upon by perturbation.
2.7.4 - The self-consistent-field (SCF) procedure
In practice, the Fock-operator is used in the Roothaan equations (equation 27)
to give the energy of the system.
𝐹𝐶 = 𝑆𝐶𝜀 (34)
Unfortunately, the last two sums in equation 23 depend on all the other
electrons in the system. This problem can be simplified by finding the charge
density matrix P of all the electrons, which turns out can be found by summing

25
up the charge contributions from all the electron wave functions, although it
does not completely solve the problem of describing the location of the
electrons. However by guessing a charge density matrix P, a guess of the
position of the electrons can be made. This charge density matrix is then used
to solve all the one-electron problems for the Fock-operator which allows for
the determining of all the electron states in this density matrix. By using these
new electron states, a new density matrix can be made, and the process is
repeated. Each time the process is done, the energy is lowered, until the
energy no longer change and the best estimate for the electron states and the
lowest energy has been determined, which is in accordance with the variational
principle. This process is called the self-consistent-field (SCF) procedure.
2.7.5 - Density functional theory
Density functional theory (DFT) takes on the same problem as HF-theory, but
instead of using the wave functions of the electrons to compute the energy of
the system, it uses the electron density. The Hoenberg-Kohn existence theorem
states that a system with a specific electron density will only have one possible
energy state. The second theorem Hoenberg and Kohn developed is the
Hoenberg-Kohn variational theorem, which states that the charge density
obeys the variational theorem. Because of these two theorems, DFT is
considered to be an “exact” theory. Similarly to the HF-procedure, the initial
electron is guessed and used to solve the Kohn-Sham equations which then
give the means to calculate the occupied Kohn-Sham orbitals. These orbitals
are then used to form a better electron density and the process is repeated in a
SCF-manner until the electron density no longer changes.
However, while the exact energy of the system is a function of the density, the
form of this function is unknown. Approximations to make an expression for
the energy have been made, however this means that DFT with these
approximations no longer are exact and does no longer necessarily obeys the
variational principle; i.e. the energy can be lower than the exact answer.
Various methods have been developed with DFT using different
approximations that can generally be divided into groups depending on which

26
approximation that is applied to them. Such approximations can be the Local
Density Approximation (LDA), General Gradient Approximation (GGA) or hybrid
functions that adapt some terms from HF-theory (which gives rise to the
popular B3LYP functional) to name a few of the approximations made to DFT.
2.7.6 - Basis sets
In order to carry out calculations on a molecule, the orbitals need to be
represented mathematically. The wave function of the molecular orbital can be
represented as a linear combination of N atomic orbital functions.
𝜙 =∑𝛼𝑖𝜑𝑖
𝑁
𝑖=1
(35)
By squaring the wave function, the probability of finding an electron in a given
position can be found, so it is preferable to use functions can simulate the
“flexibility” of the electrons to move to positions that increases the electron
density, but lowers the overall energy of the system. The greater amount of
atomic orbital functions used in the linear combination, the closer the
molecular orbital wave function described by this linear combination becomes
to the exact wave function. The collection of functions (called basis functions)
used is called a basis set. Unfortunately, due to practical limitations, a basis set
with infinite amount of functions is impossible to achieve and a finite amount
must be used instead. A larger basis set has more basis functions and results in
longer calculation times. Larger systems also requires longer calculation times
than a smaller system, so for a large system a smaller basis set may be chosen
to prevent the calculation time from being too long. Sometimes special
functions are needed to accurately describe a system. One example is systems
with weakly bonded electrons which needs diffuse functions to describe those
kinds of bonds.

27
The calculations used here use mostly the basis set aug-cc-pvtz; a Dunning’s
correlation consistent basis set. The pvtz indicates the basis uses triple-zeta (tz)
functions for each valence atomic orbital, while a smaller basis set such as the
pvdz uses a double zeta functions and a larger basis set such as the pvqz uses
quadruple zeta functions. This kind of basis sets includes polarizing functions
which is highly recommended when simulating an excited system. When the
keyword aug- is added, diffuse functions are included to the basis set. Because
the systems investigated here are anionic and have ligand effects, both diffuse
and polarizing functions are needed in the calculations. 6-311+G**(d,p) is a
smaller basis set than aug-cc-pvtz, but includes both diffuse and polarizable
functions.
2.8 - Experimental details
2.8.1 - Collision gas inlet
An illustration of the gas inlet for the collision gas is shown in Figure 6. A
sample of a volatile liquid is put in a vial and attached to the setup (the vial is
shown on the left in the illustration). This setup allows the vapour from the
liquid in the vial to be transported to the collision cell by opening valve A, E and
the needle valve. If the pressure before the needle valve is not held constant,
maintaining a stable and constant pressure in the collision cell may be difficult.
By placing the sample vial in an ice bath will keep the temperature in the
sample stable which will reduce the fluctuations of the vapour pressure as
vapour pressure is dependent on temperature. Once the sample has been
cooled to thermal equilibrium, valves A and D are opened while valve B, C and
E are closed, allowing the gas vapour to flow through the tubes. Then, valve A is
closed and valve B is opened, sealing the vial again and removing the gas in the
tubes. This process is repeated and the pressure on the barometer is observed.
When the barometer shows approximately the same pressure each time valve
A is opened, the pressure experienced by the barometer will be largely due to
the vapour pressure of the sample and not due to any air left in the vial when
the vial was attached to the pipes. Before this liquid can be used as a collision

28
gas, it needs to be degassed, a procedure with will be described in the next
section. Alternatively, by attaching a gas canister and opening valve C instead
of valve A allows gas from the canister to be used as a collision gas. This is often
used when the collision gas is an inert gas such as argon, which is commonly
used in CID experiments. The pressure in the collision cell can be carefully
controlled by adjusting the needle valve.
2.8.2 - Degassing procedure
During this procedure the needle valve is closed. The vial is placed in a
container of liquid nitrogen until the liquid is frozen solid. Once the solution is
completely frozen, the valves A, B are opened to pump out the gas within the
pipes and vial for 10-30 minutes. After this time has passed, valve A is closed
and a water-bath is placed around the vial to thaw the sample. As the sample
thaws, gas trapped in the liquid is released and can be seen in the form of
bobbles forming in the sample and rising to the surface during the thawing
process. Once the sample has thawed completely, the sample is frozen again
using liquid nitrogen and the procedure is repeated again. This cycle is
repeated until no more bobbles are observed during the thawing and it should
be done a minimum of 3 times before using the sample for experiments.
Figure 6: Illustration of the gas inlet for the collision cell in the QTOF-MS.

29
Figure 7: Picture of the gas inlet on the QTOF-MS. The vial placed in the ice bath is shown on the right in the picture.
2.8.3 - Experimental setup
The ions were produced using ESI, with nitrogen being used as the nebulizer
gas. By introducing water (HiPerSolv Chromanorm for HPLC) to the ESI under
atmospheric pressure, oxygen molecules were ionized into superoxide. Due to
the presence of water, superoxide is also can also become hydrated, causing
the formation of water clusters (O2•–(H2O)n) of varying sizes (n). [18] By using
the quadrupole to only accept a certain m/z value, a cluster with a specific
value of n was able to pass through it to then be guided by a hexapole into a
collision cell. The model chemicals were introduced to the collision cell through
a gas inlet (see section 2.8.1) and in this collision cell the water clusters reacted
with the model chemicals. The products and unreacted clusters then exited the
collision cell and entered a time-of-flight mass analyser. The scan duration was
set to 1 second and the delay between each scan was set to 0.1 second.
In a QTOF-MS, the background noise may occur from various sources such as
electrical noise from the instrument. The signal-to-noise ratio (S/N) is used to
describe the uncertainty of a measured intensity in a mass spectrum. Noise is
30
random and will therefore be statistical in nature, and can therefore be
reduced by increasing the measurement time or increasing the duration of
each scan. For a single scan, the background noise is 1-2 at a random m/z value
and the chance of this noise to occur at the same m/z value twice is rather low,
though with increased measurement times it may occur once or twice. By
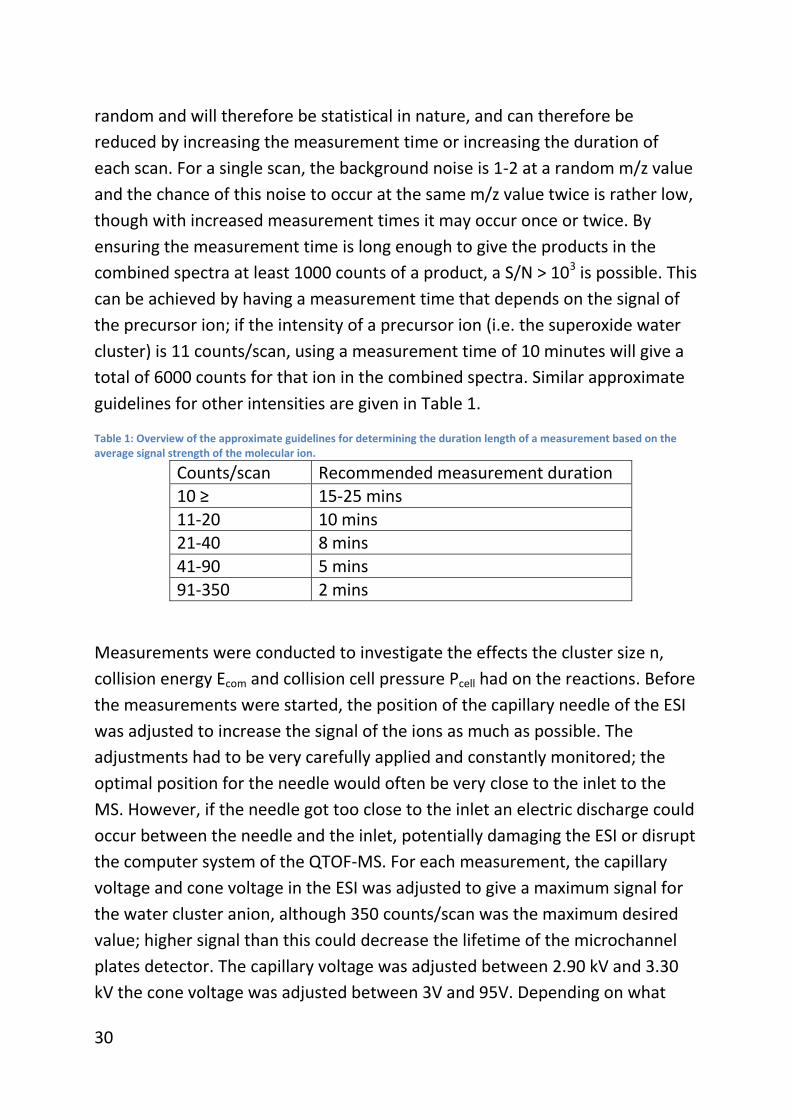
ensuring the measurement time is long enough to give the products in the
combined spectra at least 1000 counts of a product, a S/N > 103 is possible. This
can be achieved by having a measurement time that depends on the signal of
the precursor ion; if the intensity of a precursor ion (i.e. the superoxide water
cluster) is 11 counts/scan, using a measurement time of 10 minutes will give a
total of 6000 counts for that ion in the combined spectra. Similar approximate
guidelines for other intensities are given in Table 1.
Table 1: Overview of the approximate guidelines for determining the duration length of a measurement based on the average signal strength of the molecular ion.
Counts/scan Recommended measurement duration 10 ≥ 15-25 mins
11-20 10 mins 21-40 8 mins
41-90 5 mins
91-350 2 mins
Measurements were conducted to investigate the effects the cluster size n,
collision energy Ecom and collision cell pressure Pcell had on the reactions. Before
the measurements were started, the position of the capillary needle of the ESI
was adjusted to increase the signal of the ions as much as possible. The
adjustments had to be very carefully applied and constantly monitored; the
optimal position for the needle would often be very close to the inlet to the
MS. However, if the needle got too close to the inlet an electric discharge could
occur between the needle and the inlet, potentially damaging the ESI or disrupt
the computer system of the QTOF-MS. For each measurement, the capillary
voltage and cone voltage in the ESI was adjusted to give a maximum signal for
the water cluster anion, although 350 counts/scan was the maximum desired
value; higher signal than this could decrease the lifetime of the microchannel
plates detector. The capillary voltage was adjusted between 2.90 kV and 3.30
kV the cone voltage was adjusted between 3V and 95V. Depending on what
31
cluster size (n) was being used, the optimal value for these parameters could
vary greatly. Desolvation gas seemed to have a negative effect on the
production of the clusters when pure water was used as the solvent. Reference
measurements were taken in between sets of measurements to ensure the
signal was stable. For these measurements a cluster size n = 2 was used at a
collision energy of Ecom = 1.0 eV because this cluster had the highest production
of all the other clusters at this collision energy. Although in some special cases,
naked superoxide (n = 0) cluster was used instead.
Of all the water clusters used, the naked superoxide anion (n = 0) was the most
difficult anion to produce (1-5 counts/scan). This low production of superoxide
and the ease at which the n = 1 - 4 clusters are produced, indicates that
superoxide has a high affinity towards water and will easily form a water
cluster if in the presence of water. Because methanol vaporizes more easily
than water it is possible that superoxide has a lower affinity towards methanol
while still being able form superoxide in the electrospray. In an effort to
improve the production of this ion, an experiment with methanol and no
collision gas was done. These results were compared to a similar experiment
done with water. When compared the results, despite the low production using
water the experiments with methanol yielded an even lower production of the
naked superoxide anion. However, when using a 50/50 solution of
water/methanol along with turning on the desolvation gas, the production of
the n = 0 cluster is significantly increased. Because this was discovered later in
the project, not all measurements used this technique for the production of the
n = 0 cluster.
Quantum chemical calculations were conducted using DFT with the B3LYP
functional and aug-cc-pvtz as the basis set. For larger systems, the basis set 6-
311+G**(d,p) was first used to optimize the geometry before the aug-cc-pvtz
basis set was used to fine-tune the geometry and energy optimizations. The
reason for this choice of functional and basis set is because it tends to give a
more accurate estimate of the energies than smaller basis sets such as the 6-
311+G**(d,p) basis set and the systems are relatively small, making
computation times using this large basis set manageable. The B3LYP functional
was used as it seems to provide good results for complexes formed in the gas-
phase from SN2 reactions. It is important to note however that B3LYP does tend

32
to underestimate energy barriers when compared to other methods and
experimental data. [40]
A paper was published by M. Arshadi and P. Kebarle in 1970, reporting the
enthalpies of the hydration reaction of superoxide for the cluster sizes n = 1, 2,
3. [41] The enthalpies reported in this paper have been compared to those
found using B3LYP/aug-cc-pvtz and the comparison is shown in Table 2.
Table 2: The hydration enthalpies of superoxide. The experimental values determined compared to the values determined by using calculations using the B3LYP method with the cc-aug-pvtz basis set.
O2•– (H2O)n-1 + H2O O2
•– (H2O)n Experimental (kJ/mol)
B3LYP (kJ/mol)
Difference (kJ/mol)
n = 1 -77.0 -78.6 -1.6
n = 2 -72.0 -60.1 11.9 n = 3 -64.4 -51.9 12.5
The difference between the experimental values and the calculated ones using
B3LYP/aug-cc-pvtz are relatively small, which shows that B3LYP/aug-cc-pvtz is a
good method to use for calculating the energies of small superoxide water
clusters. This small energy difference could be due to B3LYP not being able to
compute the exact energy of the system, the experimental value is slightly
inaccurate, or a combination of both.
Previous publications using B3LYP on small sulphur systems similar to the
dimethyl disulphide (DMDS) system that was investigated here report that this
functional does not perform poorly on such systems, but better methods exist.
[34, 42] Since B3LYP seems to accurately predict the trend of hydration of
superoxide and it performs decently on DMDS systems, B3LYP became the
functional of choice for this paper.
2.8.4 - Execution of experiments involving dimethyl disulphide
The first sets of experiments were conducted using dimethyl disulphide as the
collision gas. About 2.5 mL of 99% pure dimethyl disulphide (from Sigma
Aldrich) was added to a vial which was then attached to the gas described in
section 2.8.1, which then introduced the vapours from the sample to the

33
collision cell. Superoxide water clusters were produced in the electrospray and
transported into and through the collision cell where collisions between the
water clusters and DMDS would occur. An attempt to keep the pressure in the
collision cell was made by keeping the vial of DMDS in an ice bath. For the first
two experiments, the pressure in the collision cell gradually increased as time
progressed, but the experiments after this the pressure was kept at about the
same value (during experiment the average pressure was 2.15•10-4 a standard
deviation of ±5•10-5 mBar, the relative standard deviation was 5.1%). These
experiments were however more qualitative and the slight change in pressure
in the early experiments would not affect the results to any great degree.
Measurements were done for various collision energies (0.4, 0.6, 0.9, 1.0, 2.0,
5.0 eV) and various water cluster sizes (n = 0, 1, 2, 3, 4). Increasing the pressure
does seem to increase the production of O2•–(DMDS), but no quantitative
investigation were done on this due to the relatively low signal of the adducts
and products observed.
Quantum chemical calculations were done on the species observed as well as
some hypothesised products. These calculations were carried out using density
functional theory (B3LYP) with the aug-cc-pvtz basis set. Transition state
calculations were done by first performing a scan along the reaction coordinate
using the keyword Modredundant and performing a transition state calculation
in the energy maxima found on the energy profile.
2.8.5 - Execution of experiments involving acetic acid
As with DMDS, experiments were done using acetic acid as the collision gas in
the collision cell. About 2.5 mL of acetic acid (100% extra pure from Sigma-
Aldrich) was added to a vial and attached to the gas inlet. Water clusters of
varying sizes were then produced in the electrospray, mass selected in the
quadrupole and introduced to the collision cell where collisions with acetic acid
molecules could occur before the m/z of the ions could be analyzed and
detected by the TOF-detector.
34
Measurements were carried out at collision energies of 0.6, 0.9, 1.0, 1.3 and
1.7 eV. As with experiments with DMDS, water clusters of the sizes n = 0, 1, 2,
3, 4 were used as well. In addition, the effect of the pressure had a great effect
on product formation, so a qualitative investigation of this was done as well.
The collision cell pressures investigated were 1.00•10-5 mBar, 1.80•10-4 mBar,
2.50•10-4 mBar, 3.30•10-4 mBar and 4.00•10-4 mBar. The collision cell pressure
was recorded each time a measurement was started and analysis showed the
pressure was relatively stable when the vial of acetic acid was cooled in an ice
bath (±1•10-5 mBar at most).
The energies of the hypothesized and observed species were calculated using
DFT (mainly using B3LYP functional with the aug-cc-pvtz basis set, but 6-
311+G**(d,p) basis set was used for rough geometry optimization for larger
system before aug-cc-pvtz was used to fine tune the geometry and energy
optimizations). Larger water clusters tend for have more than one stable
conformer so the energy of several conformations was calculated and the most
stable ones were used.

35
3. Results
3.1 - Relative abundance
When comparing the intensities of peaks in a mass spectra and analysing
reaction ratios, it is useful to report the peaks in their relative abundances (RA).
In a normal mass spectrum, the intensity of each peak is measured in the total
amount of counts that was collected for that m/z value during the
measurement. By removing the peaks of the background noise and summing
the counts of the remaining peaks, the total amount of counts is found. To
obtain the relative abundance of an ion, the counts of its peak (𝐼𝑖) is multiplied
by 100 and divided by the total amount of counts in the spectrum (eq. (36)).
𝑅𝐴𝑖 =
𝐼𝑖 ∗ 100
∑ 𝐼𝑗𝑗 (36)
The relative abundance is reported in %. Using relative abundances allows one
to easily distinguish products whose formations are more favourable or less
favourable, regardless of the measurement time. This method is useful when
discussing the reactivity of a system.
3.2 - Dimethyl disulphide
3.2.1 - n = 0
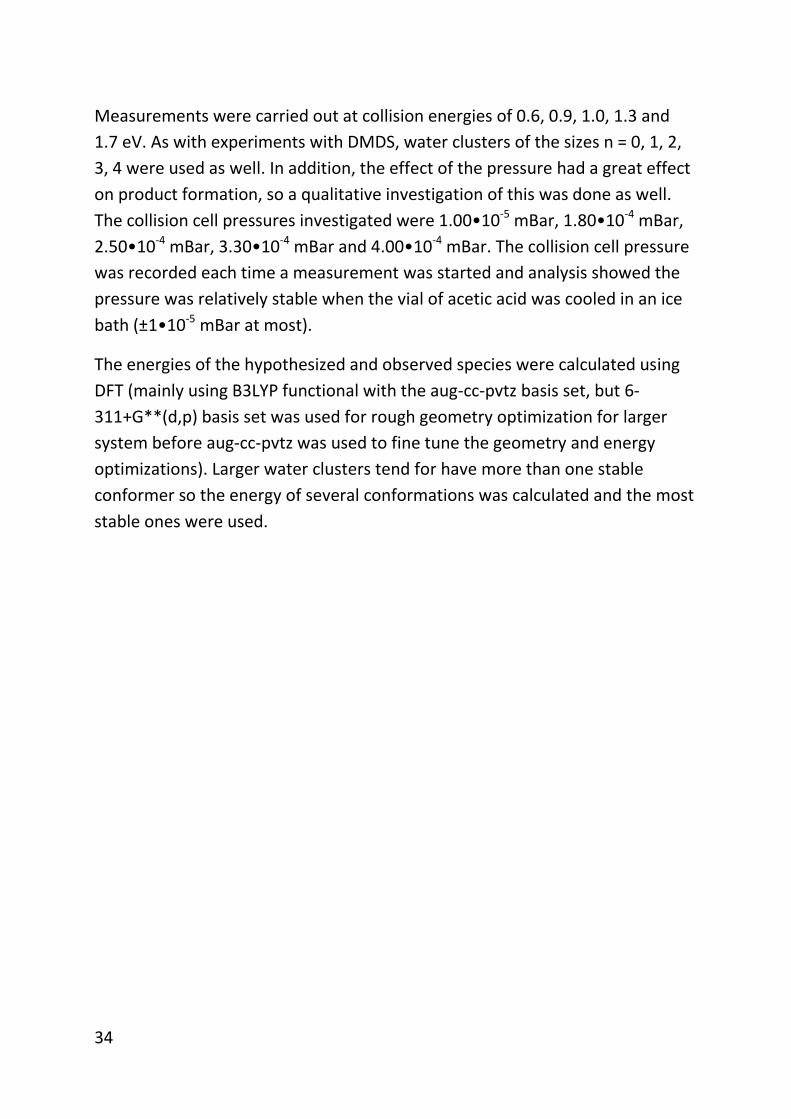
Figure 8 shows the spectrum where DMDS is used as the collision gas and the
naked superoxide anion radical (O2•–, m/z = 31.99) is the molecular ion. In this
spectrum, no other significant peaks are observed besides the one for the
molecular ion. As the collision energy was increased, some smaller peaks were
observed, however no conclusions could be drawn from these peaks as their
intensities were too low (<0.1% of the abundance of the molecular ion).
36
Figure 8: Spectrum taken by using naked superoxide as molecular ion with a Ecom = 0.6 eV and DMDS as collision gas with a pressure of 2.18E-4 mBar. The spectrum shows no significant reaction under these conditions.
3.2.2 - n = 1
When the n = 1 water cluster (O2●–(H2O)), m/z = 50.00) is the molecular ion, a
single peak is observed at m/z = 126, which is a match for O2•–(DMDS), as
shown in Figure 9. The reaction is observed with the collision energies 0.6 eV,
1.0 eV and 2.0 eV, but the signal is the strongest when 1.0 eV is used. The
relative abundance of this peak is low (about 2.5% relative abundance at Ecom =
1.0 eV), as indicated in the figure. An illustration of the geometry for this
adduct is shown in Figure 10.
The formation of this adduct is accompanied by the loss of a water molecule
from the cluster, indicating the reaction is exothermic. Because the system is

37
adiabatic, the excess energy makes the adduct unstable and the loss of a water
molecule gives the adduct a way to release energy and become stabilized.
Figure 9: Spectrum taken by using O2
•–(H2O) cluster as molecular ion with Ecom = 1.0 eV and DMDS as collision gas with a
pressure of 2.20E-4 mBar. DMDS forms an adduct with the water cluster O2•–
(DMDS) while vaporizing the water molecule.
Figure 10: Illustration of the structure of the O2
•–(DMDS) adduct. The structure was optimized using the B3LYP functional
and the aug-cc-pvtz basis set. The most stable conformation has the superoxide almost coaxial to the S-S bond.

38
3.2.3 - n = 2
If the n = 2 water clusters (O2●–(H2O)2), m/z = 68.03) is used as the molecular
ion, a peak at m/z = 144 is observed, which is a match with the O2•–
(H2O)(DMDS) adduct (see Figure 11). Again, the formation of this adduct is
accompanied by the loss of a water molecule, indicating the reaction is
exothermic.
Figure 11: Spectrum taken by using O2
•–(H2O)2 cluster as molecular ion with Ecom = 1.0 eV and DMDS as collision gas with
a pressure of 2.20E-4 mBar. DMDS forms an adduct with the water cluster O2•–
(H2O)(DMDS) while vaporizing the water molecule.
When Ecom was increased, a peak corresponding to O2•–(DMDS) was observed
as well. As Ecom gradually increased, the peak intensity of O2•–(DMDS) increased
while O2•–(H2O)(DMDS) decreased. An example of this is shown Figure 12; when
Ecom = 1.0 eV, the intensity of the peak for O2•–(H2O)(DMDS) is stronger than the
peak for O2•–(DMDS) (figure a), when the collision energy increased to 2.0 eV,
the peak for O2•–(DMDS) is stronger than the peak for O2
•–(H2O)(DMDS) (figure
b). It should also be noted that the counts of both peaks are significantly lower

39
when the collision energy is 2.0 eV compared to when the collision energy is
1.0eV. At Ecom = 5.0 eV, the signal of both peaks were almost completely gone,
only a small trace of O2•–(DMDS) was observed.
Figure 12: Comparison of two spectras in the interval m/z = 120 to 155. In both spectras the O2
•–(H2O)2 cluster was used
as the molecular ion and the pressure of DMDS in the collision cell was 2.20E-4 mBar. In figure a) the collision energy Ecom was 1.0 eV. In this figure, the O2
•– (H2O)(DMDS) at m/z = 144 is the dominating peak. In figure b), Ecom was increased to
2.0eV. This caused O2•–
(DMDS) at m/z = 126 to become the peak with the highest intensity.
3.2.4 - n = 3, 4
The same trend is observed for the n = 3, 4 clusters; at low collision energies
(Ecom = 0.6 eV, 1.0 eV) adducts with the loss of one or two water molecules is
observed, when the collision energy is increased to 2.0 eV the loss of two and
three water molecules are observed and at 5.0 eV the loss of all water
molecules are observed.
The adduct formations observed to follow this general reaction:
𝑂2•–(𝐻2𝑂)𝑛 + 𝐷𝑀𝐷𝑆 → 𝑂2
•–(𝐻2𝑂)𝑛−𝑥(𝐷𝑀𝐷𝑆) + 𝑥𝐻2𝑂 (37)

40
Where n ≥ x ≥ 1. At lower collision energies the following reaction x = 1, but as
this energy increases, so does the value of x. The trends that were observed are
shown in in Figure 13 through Figure 15.
Figure 13: The relative abundance of the O2
•–(DMDS)-adduct at various collision energies plotted against the water
cluster O2•–
(H2O)n, n = 0-4. The equation for this reaction is 𝑶𝟐•–(𝑯𝟐𝑶)𝒏 + 𝑫𝑴𝑫𝑺 → 𝑶𝟐
•–(𝑫𝑴𝑫𝑺) + 𝒏𝑯𝟐𝑶. The pressure
of DMDS in the collision cell used for these measurements was approximately 2.20E-4 mBar. There is a clear increase in the formation of this adduct when a cluster of O2
•–(H2O) is used.
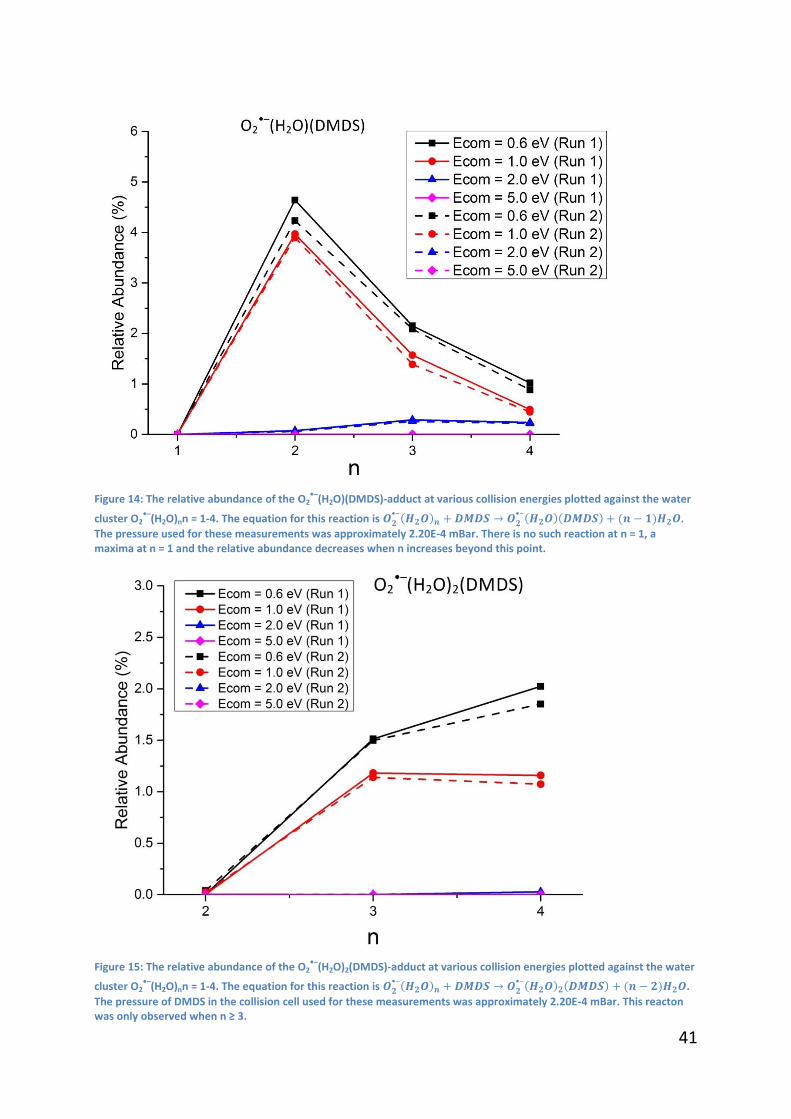
41
Figure 14: The relative abundance of the O2
•–(H2O)(DMDS)-adduct at various collision energies plotted against the water
cluster O2•–
(H2O)nn = 1-4. The equation for this reaction is 𝑶𝟐•–(𝑯𝟐𝑶)𝒏 + 𝑫𝑴𝑫𝑺 → 𝑶𝟐
•–(𝑯𝟐𝑶)(𝑫𝑴𝑫𝑺) + (𝒏 − 𝟏)𝑯𝟐𝑶.
The pressure used for these measurements was approximately 2.20E-4 mBar. There is no such reaction at n = 1, a maxima at n = 1 and the relative abundance decreases when n increases beyond this point.
Figure 15: The relative abundance of the O2
•–(H2O)2(DMDS)-adduct at various collision energies plotted against the water
cluster O2•–
(H2O)nn = 1-4. The equation for this reaction is 𝑶𝟐•–(𝑯𝟐𝑶)𝒏 + 𝑫𝑴𝑫𝑺 → 𝑶𝟐
•–(𝑯𝟐𝑶)𝟐(𝑫𝑴𝑫𝑺) + (𝒏 − 𝟐)𝑯𝟐𝑶.
The pressure of DMDS in the collision cell used for these measurements was approximately 2.20E-4 mBar. This reacton was only observed when n ≥ 3.
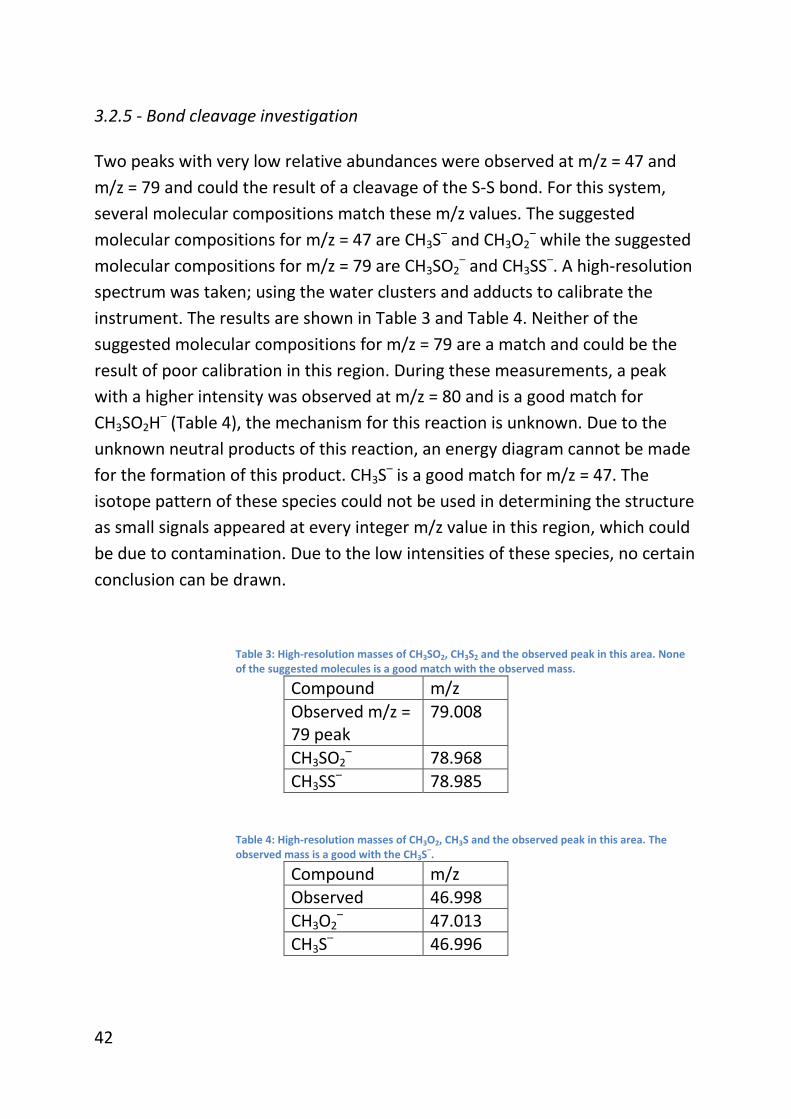
42
3.2.5 - Bond cleavage investigation
Two peaks with very low relative abundances were observed at m/z = 47 and
m/z = 79 and could the result of a cleavage of the S-S bond. For this system,
several molecular compositions match these m/z values. The suggested
molecular compositions for m/z = 47 are CH3S– and CH3O2– while the suggested
molecular compositions for m/z = 79 are CH3SO2– and CH3SS–. A high-resolution
spectrum was taken; using the water clusters and adducts to calibrate the
instrument. The results are shown in Table 3 and Table 4. Neither of the
suggested molecular compositions for m/z = 79 are a match and could be the
result of poor calibration in this region. During these measurements, a peak
with a higher intensity was observed at m/z = 80 and is a good match for
CH3SO2H– (Table 4), the mechanism for this reaction is unknown. Due to the
unknown neutral products of this reaction, an energy diagram cannot be made
for the formation of this product. CH3S– is a good match for m/z = 47. The
isotope pattern of these species could not be used in determining the structure
as small signals appeared at every integer m/z value in this region, which could
be due to contamination. Due to the low intensities of these species, no certain
conclusion can be drawn.
Table 3: High-resolution masses of CH3SO2, CH3S2 and the observed peak in this area. None of the suggested molecules is a good match with the observed mass.
Compound m/z
Observed m/z = 79 peak
79.008
CH3SO2– 78.968
CH3SS– 78.985
Table 4: High-resolution masses of CH3O2, CH3S and the observed peak in this area. The observed mass is a good with the CH3S
–.
Compound m/z Observed 46.998
CH3O2– 47.013
CH3S– 46.996

43
Table 5: Comparison of the observed mass at m/z = 80 and the monoisotopic mass of CH3SO2H
–. The observed peak is a good match with this molecular composition.
Compound m/z
Observed 79.992 CH3SO2H– 79.993
These low intensities may be explained by the energy diagram for these
species, which will be shown and discussed in section 3.4.2.
3.3 - Acetic acid
The three parameters investigated (cluster size, collision energy and pressure)
with this system and each seemed to have a great effect on the reactions
occurring and their effects will be mentioned separately.
3.3.1 - Cluster size (n)
Cluster size clearly had a great impact on the formation of the various products.
When the naked superoxide anion (n = 0) was used as the molecular ion,
deprotonation of acetic acid (m/z = 59) was observed. If a O2●–(H2O)n cluster
with n = 1 - 4 is the molecular ion however, the signal from deprotonated acetic
acid is strongly reduced and adducts of the water cluster and acetic acid were
observed. This is illustrated in Figure 16.

44
Figure 16: Comparison of two spectra. For both measurements, the collision energy Ecom was set to 0.9 eV and the pressure of CH3COOH in the collision cell was 3.30E-4 mBar. In spectra a, O2
•– ions were used. In this spectra
deprotonated acetic acid was observed as well as a dimer at m/z = 119. In spectra b, O2•–
(H2O)2 cluster was used. When this cluster was used, several adducts were observed while the signals from deprotonated acetid acid is severly reduced. Some smaller peaks from HCOOH contamination from a previous experiment were also observed.
Figure 17 shows how the peak of O2•–(CH3COOH) (m/z = 92) is dependent on
the cluster size of the molecular ion. While this peak is not observed when the
cluster n = 0 is used as the molecular ion, it is very dominant when the n = 2
cluster is used.
Figure 17: Plot of the relative abundance for the peak for the reaction 𝑶𝟐
•–(𝑯𝟐𝑶)𝒏 + 𝑪𝑯𝟑𝑪𝑶𝑶𝑯 → 𝑶𝟐•–(𝑪𝑯𝟑𝑪𝑶𝑶𝑯) +
𝒏𝑯𝟐𝑶 as a function of the cluster size, n. For these measurements the pressure of CH3COOH in the collision cell was 2.50E-4 mBar and Ecom was set to 1.3 eV. The reaction becomes more favourable as n increases until n = 3 and then decreases when n = 4. No reaction is observed when n = 0.

45
The O2•–(CH3COOH) adduct is only observed together with the loss of at least
one water molecule. As seen in Figure 16a, none of this adduct is observed
when n = 0 is used, but when n = 1 is used, no O2•–(H2O)(CH3COOH) (m/z = 110)
is observed. The same trend is observed for other cluster sizes as well. The
trend can be explained by the reaction
𝑂2•–(𝐻2𝑂)𝑛 + 𝐶𝐻3𝐶𝑂𝑂𝐻
→ 𝑂2•–(𝐻2𝑂)𝑛−𝑚(𝐶𝐻3𝐶𝑂𝑂𝐻) +𝑚𝐻2𝑂
(38)
where n ≥ m ≥ 1. On the other hand, the relative abundance of CH3COO– rapidly
declines as the cluster size is increased and when two to four water molecules
are present, the signal disappears completely. This trend is shown in Figure 18
and the reaction equation for this product is described in equation (39).
Figure 18: Plot of the relative abundance for the peak for the reaction 𝑶𝟐
•–(𝑯𝟐𝑶)𝒏 + 𝑪𝑯𝟑𝑪𝑶𝑶𝑯 → 𝑪𝑯𝟑𝑪𝑶𝑶– +
𝑶𝑶𝑯• + 𝒏𝑯𝟐𝑶 as a function of the cluster size, n. For these measurements the collision cell pressure was 2.50E-4 mBar and Ecom was set to 0.6 eV.
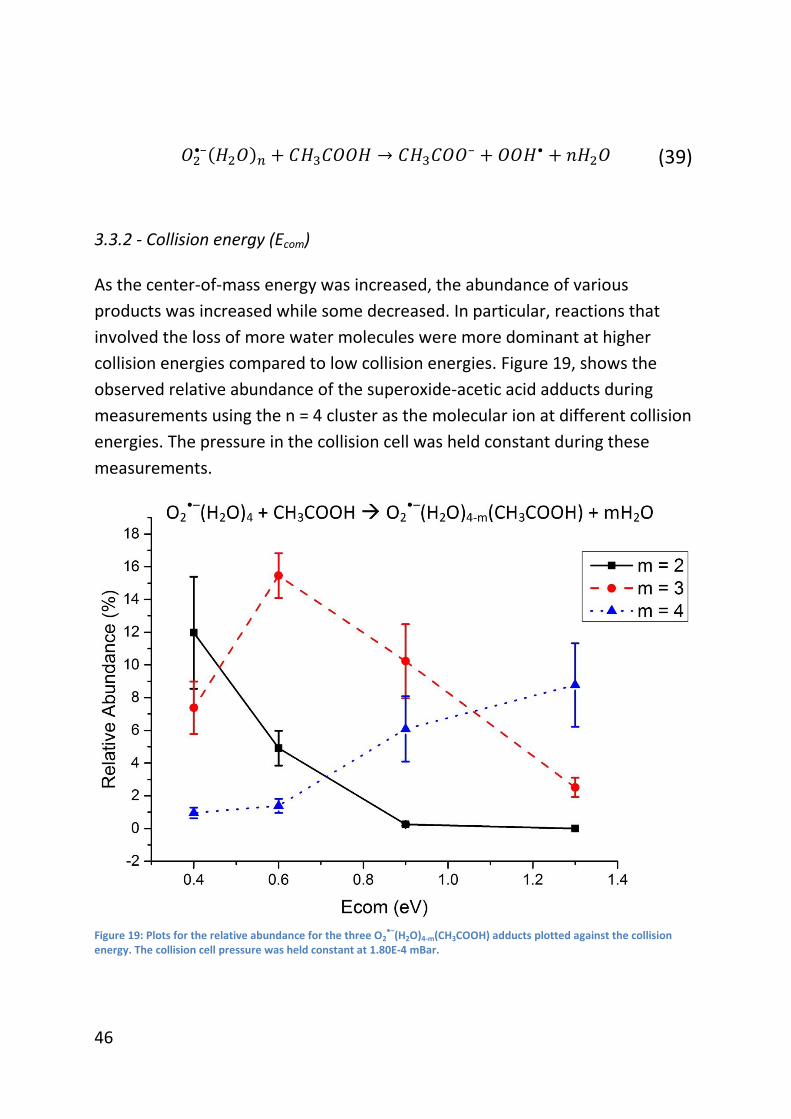
46
𝑂2•–(𝐻2𝑂)𝑛 + 𝐶𝐻3𝐶𝑂𝑂𝐻 → 𝐶𝐻3𝐶𝑂𝑂
– + 𝑂𝑂𝐻• + 𝑛𝐻2𝑂 (39)
3.3.2 - Collision energy (Ecom)
As the center-of-mass energy was increased, the abundance of various
products was increased while some decreased. In particular, reactions that
involved the loss of more water molecules were more dominant at higher
collision energies compared to low collision energies. Figure 19, shows the
observed relative abundance of the superoxide-acetic acid adducts during
measurements using the n = 4 cluster as the molecular ion at different collision
energies. The pressure in the collision cell was held constant during these
measurements.
Figure 19: Plots for the relative abundance for the three O2
•–(H2O)4-m(CH3COOH) adducts plotted against the collision
energy. The collision cell pressure was held constant at 1.80E-4 mBar.

47
Figure 19 shows an example of how the collision energy Ecom affects the
adducts formed through equation (38). At a low Ecom of 0.4 eV, O2•–
(H2O)2(CH3COOH) has the highest relative abundance. As Ecom was increased to
0.6 eV the relative abundance of this adduct decreased and the relative
abundance O2•–(H2O)(CH3COOH) increased. When Ecom was increased beyond
0.6 eV, the relative abundance of both the adducts decreased and an increase
in the relative abundance of O2•–(CH3COOH) was observed. This follows the
reaction in equation (38), where m increases with the energy. It is worth noting
that while the standard deviation increases with the relative abundance, the
relative standard deviation stays approximately the same (~30%).
As for the deprotonation reaction, the relative abundance of the deprotonated
product decreased when Ecom was increased when using the n = 0 cluster. The
opposite effect when the n = 1 cluster was used. This trend is displayed in
Figure 20. The deprotonation reaction was not observed when using clusters
larger than n = 1.
Figure 20: Plot of the relative abundance of the CH3COO
– from the reaction 𝑶𝟐
•–(𝑯𝟐𝑶)𝒏 + 𝑪𝑯𝟑𝑪𝑶𝑶𝑯 → 𝑪𝑯𝟑𝑪𝑶𝑶– +
𝑶𝑶𝑯• + 𝒏𝑯𝟐𝑶 vs Ecom. The collision cell pressure was held constant at 3.30E-4 mBar. The two plots are for n = 0 and n = 1.

48
3.3.3 - Pressure (Pcell)
As the pressure in the collision cell is increased, the number of collision
between the ions and the collision gas become more frequent. The abundance
of the products increases with pressure and the observed abundance of
unreacted water clusters decreases as collisions become more frequent with
greater pressure.
Figure 21: Plot of the relative abundance of O2
•–(CH3COOH) produced using the O2
•–(H2O)2 cluster and Ecom = 1.3 eV at
various pressures. The relative abundance seems to have a nearly linear dependence on the pressure, which is expected for this kind of reaction.
At increased pressures double collisions were observed in the form of O2•–
(CH3COOH)2 and CH3COO–(CH3COOH). While CH3COO–(CH3COOH) was observed
no matter which cluster size was used, there was a significant increase in the
relative abundance of this peak when the n = 1 cluster was used (Figure 22).

49
Figure 22: Plot of the relative abundance of CH3COO
–(CH3COOH) as a function of cluster size, O2
•–(H2O)n at a high pressure
(4.00E-4 mBar) and a low Ecom (0.4 eV). The production of this adduct is the greatest when n = 1. For n ≥ 2, a negative dependence on the cluster size is observed.
3.3.4 - Error sources
During a measurement, the signal intensity of the molecular ion is strongly
dependent on the cluster size, Elab (see equation (19) in section 2.4; an increase
in Elab will increase Ecom) and the position of the electrospray needle. A low
intensity of the molecular ion causes a lower total count of all products as
fewer molecular ions are available for the reactions. This causes the sample
size to go down and results in an increase in the uncertainty. This is particularly
true for measurements where the O2●– anion was used and Elab was low.
The positioning of the electrospray needle is a very subjective choice and may
be difficult to reproduce. If the needle is positioned too close to the MS
entrance, a discharge occurs which may damage the instrument, but the
observed cluster production decreases exponentially with the distance
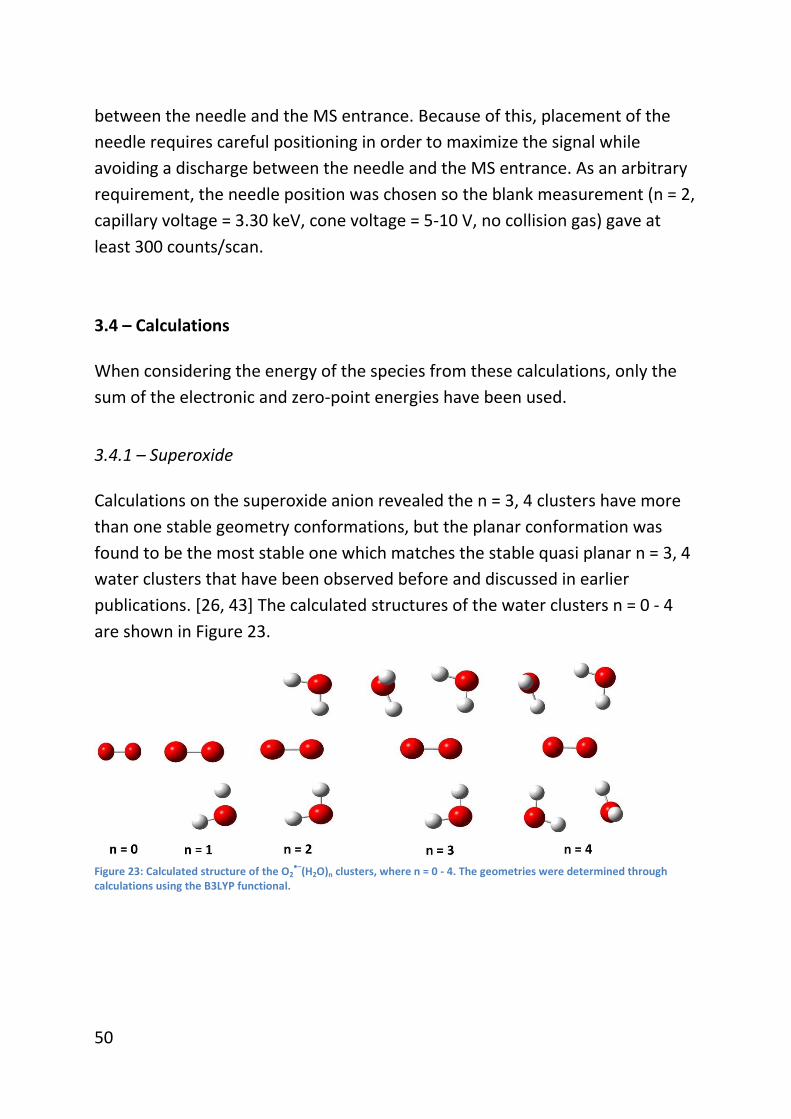
50
between the needle and the MS entrance. Because of this, placement of the
needle requires careful positioning in order to maximize the signal while
avoiding a discharge between the needle and the MS entrance. As an arbitrary
requirement, the needle position was chosen so the blank measurement (n = 2,
capillary voltage = 3.30 keV, cone voltage = 5-10 V, no collision gas) gave at
least 300 counts/scan.
3.4 – Calculations
When considering the energy of the species from these calculations, only the
sum of the electronic and zero-point energies have been used.
3.4.1 – Superoxide
Calculations on the superoxide anion revealed the n = 3, 4 clusters have more
than one stable geometry conformations, but the planar conformation was
found to be the most stable one which matches the stable quasi planar n = 3, 4
water clusters that have been observed before and discussed in earlier
publications. [26, 43] The calculated structures of the water clusters n = 0 - 4
are shown in Figure 23.
Figure 23: Calculated structure of the O2
•–(H2O)n clusters, where n = 0 - 4. The geometries were determined through
calculations using the B3LYP functional.

51
3.4.2 - Dimethyl disulphide
More than one stable conformation of the O2●–(DMDS) adduct was predicted
and this was indeed confirmed by quantum chemical calculations, however the
conformation in which superoxide attacks sulfur in a nearly linear angle to the
sulfur-sulfur bond was found to be the most stable conformation. This is a
match with the observations made in a previous paper investigating
nucleophilic substitution reactions on a similar disulphide system using
quantum chemical calculation methods. [34]
An attempt was made to find a transition for the cleavage of the disulphide
bond in the O2•–(DMDS) complex. An energy profile was constructed by
stretching the S-S bond and performing a transition state calculation using the
geometry of the energy maxima found in the energy profile (Figure A - 4 and
Figure A - 5 in the appendix). However, neither B3LYP, G4 nor MP2 were able to
optimize such a transition state.
3.4.3 - Acetic acid
Geometry and energy optimizations was conducted on various species
observed and as well as at different hydration levels. The energies of these
species were then used to construct energy diagrams for the various products
observed as well as possible intermediate products (Figure 26 through Figure
28).
52
4. Discussion
In this section, the experimental results will be compared to the results from
the calculations which may paint a better picture of the system and the
reactions that occur.
4.1 - Dimethyl disulphide
Experimental data indicates the reaction between a superoxide water cluster
and DMDS to form an adduct was always accompanied by the loss of at least
one water molecule; if no water molecules are present in the water cluster, the
adduct will not be formed. Figure 24 shows the energy diagram for this
reaction between O2•–(H2O) and DMDS. The formation of 2DOH is strongly
exothermic (-44 kJ/mol), and therefore very favourable; however this process
generates a lot of heat and because the system is adiabatic, this energy has no
way to leave the system, causing the adduct to become unstable. By
evaporating the water molecule from the adduct, energy is removed from the
system and 2DO is formed. Even if the overall reaction is slightly endothermic
(9 kJ/mol), the ionization of the water cluster gives the reactants enough initial
energy to form DO2. If the reactants have low initial energy, the loss of a single
water molecule is enough to stabilize the system. If a larger water molecule
had been used for this reaction, the adduct will have more water molecules
available for this “energy removal” which would be necessary if the reactants
have a higher initial energy. Similar energy diagrams for this reaction with
water clusters of the size n = 2, 3, 4 are shown in the appendix, section 7.1,
Figure A - 1 through Figure A - 3. The formation of these adducts are the most
dominant in the recorded spectrums and their formation follows the reaction
described in equation (37) at the end of section 3.2.4.

53
Figure 24: The energy diagram for the reaction between O2
•–(H2O) and DMDS. The energies are given in kJ/mol. These
energies were calculated using the B3LYP functional with the aug-cc-pvtz basis set.
The spectrums where O2•– (n = 0) is the molecular ion are quite different from
those where larger cluster sizes are the molecular ion and the energy diagram
for this system is shown in Figure 25. The energy diagram shows the two
species form the 2DO adduct and it is hypothesized this adduct may form two
transition states; TS1 and TS2.
In TS1, the S-S bond is assumed to be stretched and the O-S bond is shortened.
After overcoming the energy barrier of this transition state, the S-S bond is fully
cleaved, forming either 1SO or 1SC through an endothermic reaction of 131
kJ/mol and 84 kJ/mol respectively. 1SO is thought to be capable of transitioning

54
into 1SO2, as this process is strongly exothermic (overall reaction enthalpy of -
216), but calculations were unable to simulate a transition from the energy
minima of 1SO to the energy minima of 1SO2. Thus no conclusion about the
formation of this specie other than its formation enthalpy (-216 kJ/mol) can be
made.
TS2 is assumed to be the result of migration of the superoxide anion to the
methyl group, forming an O-C bond approximately coaxial to the S-C bond
while weakening the S-C bond. This transition state is also assumed to be able
to from 1D through a collision between O2●– at the carbon in the methyl group.
From this transition state, the C-S bond can be fully cleaved, forming 2SC.
Figure 25: The energy diagram for the formation of CH3SO2
– through the reaction between DMDS and O2
•–. The energies
are listed in kJ/mol. These energies were calculated using the B3LYP functional with the aug-cc-pvtz basis set. Note: TS1 and TS2 could not be optimized with B3LYP; the heights of the energy barriers at these transition states are not representative for the real system. See text for further information.

55
Because no experimental observations of 1SO, 1SC or 2SC were made, the
energy barriers of TS1 and TS2 are assumed to be significantly high. This
explains why no reactions are observed when n = 0 water clusters were used;
superoxide reacts with DMDS, forming 2DO. However, this exothermic process
gives the products much excess energy which greatly destabilizes the sytem.
Due to these high energy barriers of TS1 and TS2, the adduct cannot form any
products and instead dissociates back to the reactants to reduce the amount of
excess energy. When water clusters of n ≥ 1 are used, the adduct is formed and
water molecules are vaporized to remove the excess energy. The adduct don’t
have enough energy to overcome the energy barriers, nor does it have enough
energy to dissociate back into the reactants, thus the adduct is observed in the
mass spectrum.
Calculations were unable to determine energy or structure of neither TS1 nor
TS2. This could be due to poor initial geometry for the transition state
calculations. The initial geometry was chosen based on the energy profile from
the stretching of the S-S bond (the energy profile is shown in Figure A - 4 in the
appendix). The energy profile has a discontinuity however, due to what
appears to be the formation of a weak S-H bond between the sulphur on the
leaving group and the hydrogen atoms on the methyl group (Figure A - 5). This
discontinuity in the energy profile could lead to an energy maximum that is not
the result of the dissociation of the S-S bond, resulting in a poor initial
geometry for the transition state calculations. A second reason why the
calculations failed at finding these transition states could be that the methods
used (B3LYP, G4 and MP2) are poorly suited for transition state calculations for
these systems.
4.2 - Acetic acid
The formation of the observed adducts follows the expected trends for these
kinds of systems. The fact that the adduct O2•–(CH3COOH) is only observed
when a water molecule is vaporized indicates that the adduct formation is
exothermic. This is confirmed by quantum chemical calculations in Figure 26;
the adduct formation (1CO) is a strongly exothermic process and in an adiabatic
system, this excess energy cannot be removed through the collisions with

56
nearby molecules. The adduct becomes unstable due to all the excess energy
stored inside it and releases it through dissociation into CH3COO– (2C). The
overall reaction enthalpy for this reaction is slightly exothermic (-20 kJ/mol
according to calculations).
When water clusters of n ≥ 1 are used, the water molecules provide a way for
the system to release energy through evaporation of the water molecules,
allowing for stabilization of the intermediate adducts, thus these adducts are
observed in spectrums where these water clusters are the molecular ion. The
energy diagrams for this reaction using larger water clusters can be found in
the appendix, section 7.2.1.
Figure 26: Energy diagram displaying the reaction pathway for the reaction described in equation (39). The energies are listed in kJ/mol and were calculated using the B3LYP functional with the aug-cc-pvtz basis set.

57
Table 6 shows the gas phase basicity of fluorine, superoxide, acetate and
chlorine, whose values are in good agreement with the claim that the gas
phase basicity of superoxide is be between that of chlorine and fluorine, but
above acetate. [16, 27, 44]. The gas phase basicity for superoxide was
calculated using experimental values found in the literature. These calculations
are shown in the appendix, section 7.2.2.
Table 6: The gas phase basicity of the species fluorine, superoxide, acetate and chlorine. The gas phase basicity of superoxide is based on calculations using the electron affinity of oxygen, ionization potential of hydrogen and the H-O bond energy in H-O2
•. The remaining gas phase basicity of the other species are collected from the NIST library.
Specie Gas phase basicity (kJ/mol)
F– 1530
O2•– 1466
CH3COO– 1427
Cl– 1373
This shows the superoxide anion has higher gas phase basicity than acetate,
allowing superoxide to deprotonate acetic acid. Because the gas phase basicity
is defined as the Gibbs free energy for the deprotonation reaction, the Gibbs
free energy for the reaction will be the difference in gas phase basicity
between superoxide and acetate, which is -39 kJ/mol. This can be compared to
the estimated Gibbs free energy for the reaction in Figure 26 which was
calculated to be -20 kJ/mol. Some discrepancy in these values are expected, as
the values in the energy diagram are zero point vibrational energy, so the
temperature is set to 0K while experimental values are for standard conditions.
It appears the values provided by B3LYP are of the same magnitude as the
experimental values. The conclusion is the values provided by B3LYP are fine to
use for a qualitative analysis.
The observation of CH3COO–(CH3COOH) when the n = 1 water cluster is used is
interesting and raises the question as to what its reaction pathway is. One
possible pathway for the formation is displayed in Figure 27, named reaction
pathway A. The 1CO1H adduct is formed in an exothermic process, giving the
products more excess energy. This pathway is very similar to the one outlined
in Figure 26. Instead of evaporation of the water molecule, a hydrogen dioxide
radical is formed and released from the complex, forming 2C1H which has less
excess energy. A second collision with another acetic acid molecule then

58
occurs, causing the formation of the 3CH complex, which is unstable due to the
high excess energy from the exothermic process. The removal of the water
molecule reduces this excess energy, producing the observed 3C product. In
this pathway, the 2C1H complex seems to have much less excess energy, giving
it a long enough lifetime to allow the second collision to occur. The 2C1H
complex is observed in experiments with low pressure and low collision
energies; however their abundance is much lower than expected, indicating
this pathway may not be very favourable and a different pathway is also
possible.
Figure 27: Reaction pathway A for the production of CH3COO
–(CH3COOH) with the n = 1 cluster. The energies are listed in
kJ/mol and were calculated using the B3LYP functional with the aug-cc-pvtz basis set.

59
Reaction pathway B (Figure 28) is a similar pathway, but involves the
production of the 1CO adduct, which then undergoes a second collision with
acetic acid, forming the 3CO species. This specie has much excess energy and
due to this is highly unstable, readily dissociating into 3C. This reaction pathway
seems to be more favourable compared to pathway A, as much more of 1CO
(pathway B) is observed compared to 2C1H (pathway A) despite 1CO seemingly
having more excess energy.
Figure 28: Reaction pathway B for the production of CH3COO
–(CH3COOH) with the n = 1 cluster. The energies are listed in
kJ/mol and were calculated using the B3LYP functional with the aug-cc-pvtz basis set.
60
5. Conclusion
5.1 - Dimethyl disulphide
Very few reactions were observed between the water clusters and DMDS.
Adduct formations between DMDS and the water clusters were the vast
majority of the products observed. While small amounts of what seems to be
CH3S– is observed, the signal of this peak was very low and no conclusion can
be made about it. If CH3S– is formed, the reason for the low abundance of this
signal could be explained by the energy diagram in
Figure 25; the formation of this species has a presumably very high energy
barrier, hindering the reaction. This is confirmed by the fact that small amounts
of this specie are only observed at higher energies when n = 1 - 4 is used. More
investigation into this reaction under different conditions would be preferred.
5.2 - Acetic acid
Acetic acid and the superoxide water clusters of n = 1 – 4 readily forms
adducts. When higher energies are used, one or more water molecules may be
lost, depending on the excess energy of the product. When the n = 0 anion is
the molecular ion, only deprotonated acetic acid is formed, no adduct
formation is observed. This deprotonation is due to superoxide having a higher
proton affinity than acetate.
The production of CH3COO–(CH3COOH) from the n = 1 water cluster have two
possible pathways. While both pathways are possible, pathway B seems to be
the most favourable one. This is probably due to the loss of OOH• while leaving
the H2O attached to the complex is not an easy reaction; the straight up loss of
a water molecule in pathway B seems much more favourable.
Extrapolating these results to bulk solution seems to indicate direct
deprotonation will not happened in bulk solution as the presence of water
greatly stabilizes the adduct form. However, this may give the adduct a long
enough lifetime to possibly gain enough energy for the deprotonation at a later
time.

61
6. References
1. Kandola, K., A. Bowman, and M.A. Birch-Machin, Oxidative stress – a key emerging impact factor in health, ageing, lifestyle and aesthetics. International Journal of Cosmetic Science, 2015. 37: p. 1-8.
2. Schieber, M. and N. Chandel, ROS Function in Redox Signaling and Oxidative Stress. Current Biology. 24(10): p. R453-R462.
3. Dröge, W., Free Radicals in the Physiological Control of Cell Function. Physiological Reviews, 2002. 82(1): p. 47-95.
4. Jin, Y.N., W.Y. Hwang, C. Jo, and G.V.W. Johnson, Metabolic State Determines Sensitivity to Cellular Stress in Huntington Disease: Normalization by Activation of PPAR? PLoS ONE, 2012. 7(1): p. e30406.
5. Bhat, A.H., K.B. Dar, S. Anees, M.A. Zargar, A. Masood, M.A. Sofi, and S.A. Ganie, Oxidative stress, mitochondrial dysfunction and neurodegenerative diseases; a mechanistic insight. Biomedicine & Pharmacotherapy, 2015. 74: p. 101-110.
6. Koyama, T., M. Tawa, N. Yamagishi, A. Tsubota, T. Sawano, M. Ohkita, and Y. Matsumura, Role of superoxide production in post-ischemic cardiac dysfunction and norepinephrine overflow in rat hearts. Eur. J. Pharmacol., 2013. 711(1–3): p. 36-41.
7. Elchuri, S., T.D. Oberley, W. Qi, R.S. Eisenstein, L. Jackson Roberts, H. Van Remmen, C.J. Epstein, and T.-T. Huang, CuZnSOD deficiency leads to persistent and widespread oxidative damage and hepatocarcinogenesis later in life. Oncogene, 2004. 24(3): p. 367-380.
8. Zelko, I.N., T.J. Mariani, and R.J. Folz, Superoxide dismutase multigene family: a comparison of the CuZn-SOD (SOD1), Mn-SOD (SOD2), and EC-SOD (SOD3) gene structures, evolution, and expression. Free Radical Biol. Med., 2002. 33(3): p. 337-349.
9. Imlay, J.A., The molecular mechanisms and physiological consequences of oxidative stress: lessons from a model bacterium. Nat Rev Micro, 2013. 11(7): p. 443-454.
10. Austin, S., E. Klimcakova, and J. St-Pierre, Impact of PGC-1α on the topology and rate of superoxide production by the mitochondrial electron transport chain. Free Radical Biol. Med., 2011. 51(12): p. 2243-2248.
11. Halliwell, B. and J.M.C. Gutteridge, [1] Role of free radicals and catalytic metal ions in human disease: An overview, in Methods Enzymol. 1990, Academic Press. p. 1-85.
12. Halliwell, B., M.V. Clement, and L.H. Long, Hydrogen peroxide in the human body. FEBS Lett., 2000. 486(1): p. 10-13.
13. Khurshid, S.S., J.A. Siegel, and K.A. Kinney, Technical Note: Particulate reactive oxygen species concentrations and their association with environmental conditions in an urban, subtropical climate. Atmos. Chem. Phys., 2014. 14(13): p. 6777-6784.
14. Anglada, J.M., M. Martins-Costa, J.S. Francisco, and M.F. Ruiz-López, Interconnection of Reactive Oxygen Species Chemistry across the Interfaces of Atmospheric, Environmental, and Biological Processes. Acc. Chem. Res., 2015. 48(3): p. 575-583.
15. Halliwell, B., Role of Free Radicals in the Neurodegenerative Diseases. Drugs & Aging, 2012. 18(9): p. 685-716.
16. Hayyan, M., M.A. Hashim, and I.M. AlNashef, Superoxide Ion: Generation and Chemical Implications. Chem. Rev., 2016. 116(5): p. 3029-3085.
17. Blanksby, S.J., V.M. Bierbaum, G.B. Ellison, and S. Kato, Superoxide Does React with Peroxides: Direct Observation of the Haber–Weiss Reaction in the Gas Phase. Angew. Chem. Int. Ed., 2007. 46(26): p. 4948-4950.
18. Ryding, M.J., A. Debnárová, I. Fernández, and E. Uggerud, Nucleophilic Substitution in Reactions between Partially Hydrated Superoxide Anions and Alkyl Halides. J. Org. Chem., 2015. 80(12): p. 6133-6142.
19. Merritt, M.V. and D.T. Sawyer, Electrochemical studies of the reactivity of superoxide ion with several alkyl halides in dimethyl sulfoxide. J. Org. Chem., 1970. 35(7): p. 2157-2159.

62
20. Johnson, R.A., E.G. Nidy, and M.V. Merritt, Superoxide chemistry. Reactions of superoxide with alkyl halides and alkyl sulfonate esters. JACS, 1978. 100(25): p. 7960-7966.
21. Yu, D., D.A. Armstrong, and A. Rauk, The transition probability of electron loss from anions in the gas phase: The lifetime of O2 ⋅−. J. Chem. Phys., 1992. 97(8): p. 5522-5531.
22. Peterson, D.A., S.L. Archer, and E.K. Weir, Superoxide Reduction of a Disulfide: A Model of Intracellular Redox Modulation? Biochem. Biophys. Res. Commun., 1994. 200(3): p. 1586-1591.
23. Hirsikko, A., T. Nieminen, S. Gagné, K. Lehtipalo, H.E. Manninen, M. Ehn, U. Hõrrak, V.M. Kerminen, L. Laakso, P.H. McMurry, A. Mirme, S. Mirme, T. Petäjä, H. Tammet, V. Vakkari, M. Vana, and M. Kulmala, Atmospheric ions and nucleation: a review of observations. Atmos. Chem. Phys., 2011. 11(2): p. 767-798.
24. Tanner, S.D., G.I. Mackay, and D.K. Bohme, An experimental study of the reactivity of the hydroxide anion in the gas phase at room temperature, and its perturbation by hydration. Can. J. Chem., 1981. 59(11): p. 1615-1621.
25. Beyer, M.K., Hydrated metal ions in the gas phase. Mass Spectrom. Rev., 2007. 26(4): p. 517-541.
26. Niedner-Schatteburg, G. and V.E. Bondybey, FT-ICR Studies of Solvation Effects in Ionic Water Cluster Reactions. Chem. Rev., 2000. 100(11): p. 4059-4086.
27. Dzidic, I., D.I. Carroll, R.N. Stillwell, and E.C. Horning, Gas phase reactions. Ionization by proton transfer to superoxide anions. JACS, 1974. 96(16): p. 5258-5259.
28. Alon, T. and A. Amirav, How enhanced molecular ions in Cold EI improve compound identification by the NIST library. Rapid Commun. Mass Spectrom., 2015. 29(23): p. 2287-2292.
29. Ho, C.S., C.W.K. Lam, M.H.M. Chan, R.C.K. Cheung, L.K. Law, L.C.W. Lit, K.F. Ng, M.W.M. Suen, and H.L. Tai, Electrospray Ionisation Mass Spectrometry: Principles and Clinical Applications. Clinical Biochemist Reviews, 2003. 24(1): p. 3-12.
30. Mason, E. Diagram of Electrospray Ionization. 2015 21 January 2015; Available from: https://commons.wikimedia.org/wiki/File:Electrospray_Ionization_Spectroscopy.svg.
31. Iavarone, A.T. and E.R. Williams, Mechanism of Charging and Supercharging Molecules in Electrospray Ionization. JACS, 2003. 125(8): p. 2319-2327.
32. Gross, J.H., Mass Spectrometry: A Textbook. 2011. p. 117-210. 33. Paul, W., Electromagnetic traps for charged and neutral particles. Reviews of Modern
Physics, 1990. 62(3): p. 531-540. 34. Bachrach, S.M. and D.C. Mulhearn, Nucleophilic Substitution at Sulfur: SN2 or
Addition−Elimination? J. Phys. Chem., 1996. 100(9): p. 3535-3540. 35. Gross, J.H., Mass Spectrometry: A Textbook. 2011. p. 420-423. 36. Elisemarion, Français : analyseur de spectrométrie de masse à temps de vol (time of flight
TOF) schématisé, avec le trajet des ions, en mode réflectron. 2007. 37. Atkins, P. and R. Friedman, Molecular Quantum Mechanics. 5th edition ed. 2011. 38. Szabo, A. and N.S. Ostlund, Modern Quantum Chemistry: Introduction to Advanced Electronic
Structure Theory. First Edition, Revised ed. 1996. 39. Cramer, C.J., Essentials of Computational Chemistry: Theories and Models. 2004. p. 249-300. 40. Bach, R.D., O. Dmitrenko, and C. Thorpe, Mechanism of Thiolate−Disulfide Interchange
Reactions in Biochemistry. J. Org. Chem., 2008. 73(1): p. 12-21. 41. Arshadi, M. and P. Kebarle, Hydration of OH- and O2- in the gas phase. Comparative solvation
of OH- by water and the hydrogen halides. Effects of acidity. J. Phys. Chem., 1970. 74(7): p. 1483-1485.
42. Kang, J.K. and C.B. Musgrave, Prediction of transition state barriers and enthalpies of reaction by a new hybrid density-functional approximation. J. Chem. Phys., 2001. 115(24): p. 11040-11051.

63
43. Ludwig, R., Water: From Clusters to the Bulk. Angew. Chem. Int. Ed., 2001. 40(10): p. 1808-1827.
44. Shen, V.K., D.W. Siderius, W.P. Krekelberg, and H.W. Hatch, eds. NIST Standard Reference Simulation Website. NIST Standard Reference Database Number 173. National Institute of Standards and Technology, Gaithersburg MD, 20899, http://doi.org/10.18434/T4M88Q, retrieved 9th of May 2017.

64
7. Appendix
7.1 – DMDS
Figure A - 1: The energy diagram for the reaction between O2•–
(H2O)2 and DMDS. The energies are given in kJ/mol were calculated using the B3LYP functional with the aug-cc-pvtz basis set.

65
Figure A - 2: The energy diagram for the reaction between O2•–
(H2O)3 and DMDS. The energies are given in kJ/mol were calculated using the B3LYP functional with the aug-cc-pvtz basis set.

66
Figure A - 3: The energy diagram for the reaction between O2•–
(H2O)4 and DMDS. The energies are given in kJ/mol were calculated using the B3LYP functional with the aug-cc-pvtz basis set.
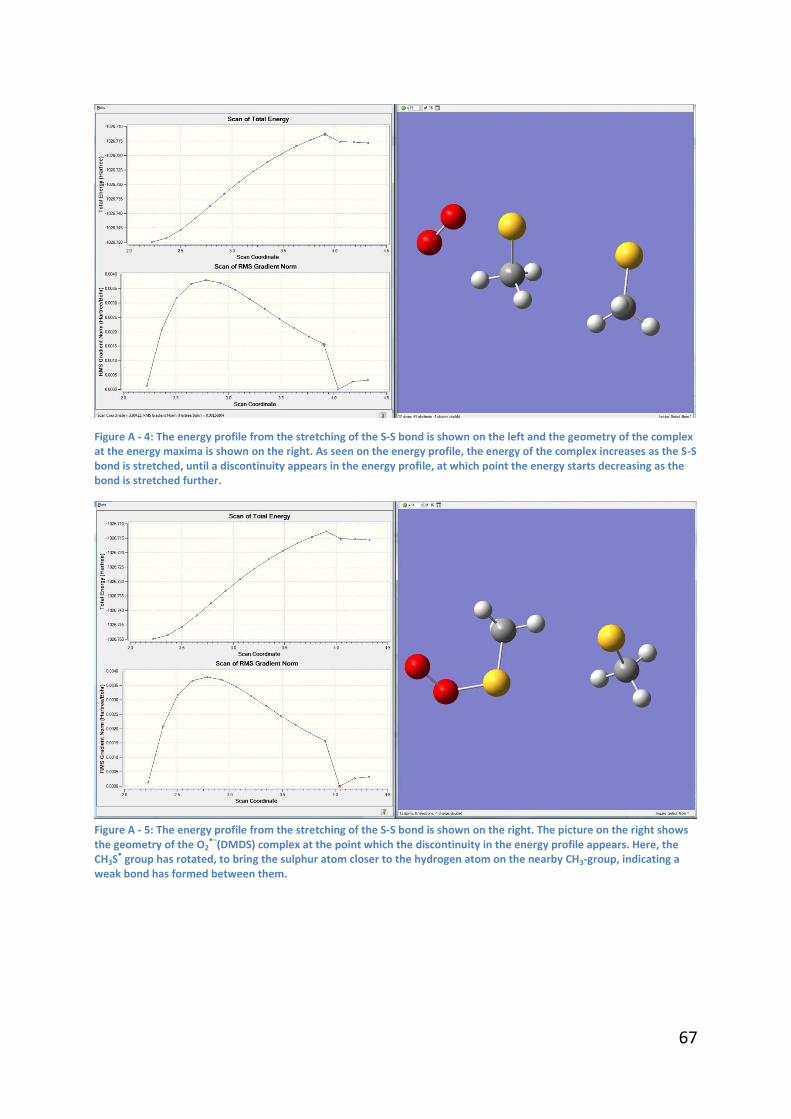
67
Figure A - 4: The energy profile from the stretching of the S-S bond is shown on the left and the geometry of the complex at the energy maxima is shown on the right. As seen on the energy profile, the energy of the complex increases as the S-S bond is stretched, until a discontinuity appears in the energy profile, at which point the energy starts decreasing as the bond is stretched further.
Figure A - 5: The energy profile from the stretching of the S-S bond is shown on the right. The picture on the right shows the geometry of the O2
•–(DMDS) complex at the point which the discontinuity in the energy profile appears. Here, the
CH3S• group has rotated, to bring the sulphur atom closer to the hydrogen atom on the nearby CH3-group, indicating a
weak bond has formed between them.

68
7.2 – Acetic Acid
7.2.1 – Energy diagrams for acetic acid
Figure A - 6: Energy diagram for the formation and stepwise dehydration of O2•–
(H2O)2(CH3COOH) from the reaction between O2
•–(H2O)2 and acetic acid. The energies are given in kJ/mol were calculated using the B3LYP functional with the
aug-cc-pvtz basis set.

69
Figure A - 7: Energy diagram for the formation and stepwise dehydration of O2•–
(H2O)3(CH3COOH) from the reaction between O2
•–(H2O)3 and acetic acid. The energies are given in kJ/mol were calculated using the B3LYP functional with the
aug-cc-pvtz basis set.

70
Figure A - 8: Energy diagram for the formation and stepwise dehydration of O2•–
(H2O)4(CH3COOH) from the reaction between O2
•–(H2O)4 and acetic acid. The energies are given in kJ/mol were calculated using the B3LYP functional with the
aug-cc-pvtz basis set.

71
7.2.2 – Calculation of the gas phase basicity of O2•–
This reaction is explained by considering the gas phase basicity of the species
involved in the reaction. The proton affinity of superoxide can be calculated
through the stepwise reactions that occur during the overall reaction. The
overall reaction is
𝐻𝑂2 → 𝐻+ + 𝑂2
•– (40)
The energy of the overall reaction can be described by the energies of the
stepwise reactions: the ionization potential (IP) of oxygen, the electron affinity
(EA) of hydrogen and the bond energy of the O-H bond (D(H-O2•–)).
𝐸𝐴(𝑂2) 𝑂2 + 𝑒– → 𝑂2
•– (41)
𝐼𝑃(𝐻) 𝐻+ + 𝑒– → 𝐻 (42)
𝐷(𝐻 − 𝑂2•) 𝐻+ + 𝑂2
•– → 𝐻 − 𝑂2• (43)
𝐺𝐵(𝑂2•–) = 𝐷(𝐻 − 𝑂2
•) + 𝐼𝐸(𝐻) – 𝐸𝐴(𝑂2) (44)
The values of EA(O2) has been determined to be 43 kJ/mol, IP(H) has been
determined to be 1312 kJ/mol eV and D(H-O2•) to be 197 kJ/mol. On the basis
of these values, using equation (44) gives superoxide a gas phase basicity of
1466 kJ/mol. These values are taken from the following references. [27, 44]