rci interface - benefits of cool roofs
TRANSCRIPT

7/29/2019 RCI Interface - Benefits of Cool Roofs
http://slidepdf.com/reader/full/rci-interface-benefits-of-cool-roofs 1/7
INTRODUCTION
Cool roofing is “hot.” It is a frequenttopic in trade magazines and at roofingsymposia. Sales of various cool roofingproducts outpace the overall market yearafter year. Manufacturers expend significant development resources working on theradiative properties of their materials, looking to improve their market positioning andshare. With all the talk surrounding the
subject, one could be forgiven for thinkingthat the general concept is new and innovative. In fact, “cool” roofing has been aroundfor quite some time now. Light-colored thermoplastic sheet materials and various typesof coatings have been available for decades.Some have remained virtually unchangedover that time, and some of the earliestinstallations, dating back to the 1970s inNorth America and the 1960s in Europe,are still in service today.
The developers of those products werebroadly guided – directly or intuitively – bythe principles of the Arrhenius equation,which states that for many common chemical reactions at room temperature, the reaction rate doubles for every 10°C increase intemperature. Applied to roofing materials,the thought process was generally that lightcolors would reduce the heat load on thesurface, thereby slowing down the agingprocess of membranes and underlyingmaterials. This concept is still valid todayand remains a key reason for installinglight-colored coatings on top of asphaltic
J U LY 2 0 0 9
and other dark-colored membranes.What have changed are the identifica
tion, recognition, and quantification of other benefits of cool roofing materials.Reports on the potential for energy savingsresulting from the use of these productsbegan to appear in the late 1990s. The basicconcept was that roofing materials thatreflect substantial portions of the sun’sincident radiation back into the atmosphere
and quickly emit whatever heat is absorbedhave lower surface temperatures and therefore require less energy to keep conditionedspaces below them cool.
ASHRAE first recognized this principlein 1999, in ASHRAE Standard 90.1-1999. Anumber of states and municipalities beganto mandate the use of cool roofing materials, most notably the state of California,which included use of such materials as aprescriptive method to meet the requirements of its Title 24 energy code in 2005.Most recently, U.S. Energy Secretary StevenChu, speaking at a climate change symposium in London, highlighted the broadimplementation of cool roofs and paving asimportant measures in the current administration’s “new revolution” regarding energy usage.
ASSESSING COOL ROOF IMPACTS ON COMMERCIAL
BUILDINGS
Since those first studies more than adecade ago, extensive research and analysishave been done on the various elements
related to cool roofing. Much of that workhas been carried out by the LawrenceBerkeley National Laboratory (LBNL). In itsmost recent study, which has just beenreleased, LBNL simulated the potentialimpact of substituting cool roofs for conventional dark-colored roofs on commercialbuildings in 236 U.S. cities.
The potential impact of a cool roof onany given building depends on numerous
factors, including the building’s local climate, its operating systems (HVAC typesand efficiencies) and conditions (internaltemperatures, occupancy, hours of operation, etc.), the roof surface area, and theroof assembly’s construction, including itsthermal resistance, mass, and emittanceas well as its solar reflectance.
The simulations modeled new (post1980) and old (pre-1980) office and retailbuildings. Two of the most importantassumptions that have a significant impacton the results are the roof’s insulation leveland its solar reflectance. The roof insulations in each generation of structure wereassigned thermal resistances of R-7 and R19 for old and new respectively.
Many cool roof materials offer initialsolar reflectances greater than 80%However, roofs – like anything left exposedto the elements – will become soiled overtime. For darker materials, this may actually increase reflectance ever so slightlywhereas for light-colored materials theeffect is a decrease. Although a number of
I N T E R F A C E • 1 5

7/29/2019 RCI Interface - Benefits of Cool Roofs
http://slidepdf.com/reader/full/rci-interface-benefits-of-cool-roofs 2/7
studies have shown that practically all of the initial reflectance of most materials canbe restored through cleaning, few roofs areactually cleaned throughout their servicelife. Taking these factors into account, theauthors assumed agedsolar reflectances of 0.20for weathered conventional
with a weathered cool roof. Savings andpenalties were determined by comparingperformance with a cool roof to performance with a conventional roof. State andnational average rates of savings and penal-
of conditioned roof area (area of roof surfaceover a conditioned space, or CRA) for thestock of commercial buildings, and are notintended to be used to represent any givensingle building.
Three key metrics inassessing the relative performance of cool roofs
materials (assumed to be Although some standards may allow compared to conventional
gray), and 0.55 for weath- roofs are cooling energyered white cool roofs. The for them under certain circumstances, savings, heating energylatter value is consistent penalties, and overall enerwith California Title 24’s cooling energy savings should not be gy cost savings.minimum requirement forlow-slope, nonresidential used as a basis for using less insulation ENERGY AND COST IMPACTS
roofs and is generally con- Not surprisingly, thesistent with the findings of below cool roofs in any climate. greatest impact due toa number of studies.
Using the DOE-2.1Ebuilding energy model, LBNL simulated foreach prototype building in each city thehourly heating and cooling energy uses dur
ing a typical meteorological year – first witha weathered conventional roof and then
ties were then determined by weightingthese results according to local buildinginventories (types, ages, and densities of
construction). The following results arestate or national averages per square meter
change from a conventional gray roof surface to a
cool roof is achieved in hot states. ArizonaNew Mexico, and Nevada benefit the most,with calculated average annual savings of
7.69, 6.92, and 6.86 kWh/m2 of conditionedroof area. However, it is clear that even the
Figure 1
1 6 • I N T E R F A C E J U LY 2 0 0 9

7/29/2019 RCI Interface - Benefits of Cool Roofs
http://slidepdf.com/reader/full/rci-interface-benefits-of-cool-roofs 3/7
coldest states can benefit from significantreductions in cooling energy through theuse of cool roofs. According to the paper, inMinnesota, for example, annual coolingenergy reductions would average 4.17kWh/m2 of conditioned roof area.
If reflective roofs are beneficial in cooling-dominated climates, one would intuitively assume that such roofs would be dis
advantageous in heating-dominated climates. Presumably, in such climates, dark-colored, minimally reflective materials thatabsorb large amounts of the sun’s energyshould heat up, resulting in a reduction inthe heating energy required to keep theoccupied space below the roof’s surface atthe desired temperature. There should, ineffect, be a “heating energy penalty” associated with the use of cool roofs in such climates. According to the paper, there can be,although the magnitude is surprisinglysmall, even in the coldest states. In
Minnesota, for example, it would be 0.137therm/m2 per year on average. It would besimilar in Alaska, at 0.128 therm/m2 per year. There are a number of reasons forthis. Snow may cover the roof for extendedperiods of time. Winter days are shorter andcloudier and the sun is lower. In fact, as canbe seen in Figure 1, the wintertime horizontal solar irradiance is typically 20 to 35 percent of the summer irradiance in the mainland northern states. In other words, a horizontal surface in the northern statesreceives about three to five times more daily
sun in the summer than in the winter. The authors found that the reduction in
annual cooling load exceeded the increasein annual heating load everywhere in theU.S. except the most remote areas of Alaska.
The most important metric from a building operations perspective is economicimpact. Using 2005 commercial-sectorenergy prices obtained from the EnergyInformation Administration, the authorscalculated the estimated average annualenergy cost savings, taking into accountboth cooling energy savings and heatingenergy penalties for each state.
According to the LBNL simulations,Hawaii benefits the most from cool roofs($1.14/m2 of CRA per year on average), followed by California ($0.70/m2 per year). Atthe low end, average annual savings on theorder of $0.13/m2 were calculated fornorthern mainland states such asMinnesota and North Dakota. Interestingly,Alaska, with calculated average annual sav-
StateCooling Energy Saving
kWh/m2 CRAHeating Energy Penalty
Therm/m2 CRAEnergy Cost Savings
($/m2 CRA)
CA 6.13 0.0292 0.699
NV 6.86 0.0737 0.570
FL 5.72 0.0115 0.448
NH 5.35 0.1210 0.482
MN 4.17 0.1370 0.136
IL 4.22 0.0994 0.217U.S. 5.02 0.0645 0.356
Table 1 – Calculated average annual results for selected states. (Source: LBNL)
ings of $0.319/m2 per year, is only 10 percent below the overall U.S. average savings($0.356/m2 per year). This value is drivenby the state’s low cost of natural gas (heating) and its high cost of electricity (cooling).
Results for a cross section of states areshown in Table 1. With the plethora of coolroofing products now available on the mar
ket, there are technically sound solutionsthat are cost-competitive with noncooloptions for most, if not all, roofing situations. Therefore, even in locations where theenergy cost savings are modest, they can beachieved without an installed cost premi
um. The installation of cool roofs can alsoresult in additional benefits, which are outlined below.
The cost savings data represent a specific point in time. All major forms of energyare subject to pricing changes and to various degrees of volatility, all of which willaffect the results. One thing is clear, howev
er: Through all the noise of various marketforces, the overall trend for energy costs isto increase with time. Despite the ups anddowns that we experience, that trend islikely to carry on in the same direction forsome time to come.
J U LY 2 0 0 9 I N T E R F A C E • 1 7
7/29/2019 RCI Interface - Benefits of Cool Roofs
http://slidepdf.com/reader/full/rci-interface-benefits-of-cool-roofs 4/7
ECOLOGICAL BENEFITS
Although energy cost savings are a keydriver (particularly in warmer climates), onecould argue that the ecological benefits of cool roofs are of even greater importance.Much of the initiative behind the cool roof movement came as a result of theEnvironmental Protection Agency’s (EPA)Heat Island Reduction Initiative (HIRI),
which started in 1998. Urban heat islandsoccur as pavement and buildings replacevegetation in cities. These surfaces absorbsignificant amounts of the sun’s energy,with the cumulative effect being an overallincrease in the city’s surface- and air-temperatures. Increased urban air temperatures are associated with increases in smog.Under the HIRI, the EPA, the NationalAeronautics and Space Administration(NASA), the Department of Energy (DOE),and LBNL developed a number of heatisland mitigation strategies, including cool
roofs. This ultimately led to the creation of the Energy Star® program for roofs.
Much like the economic impacts, theprojected environmental benefits of coolroofs can also be quantified. Significantamounts of greenhouse gases and otherpollutants in our environment are the by
1 8 • I N T E R F A C E
StateCO2 Reduction
kg/m2 CRANOx Reduction
g/m2 CRASO2 Reduction
g/m2 CRAHg Reduction
µg/m2 CRA
CA 2.58 2.31 1.79 61.20
NV 3.64 6.37 4.74 71.80
FL 3.77 6.45 11.10 29.70
NH 1.82 2.14 6.36 21.60
MN 3.09 7.45 12.40 89.50IL 2.97 5.48 19.60 89.90
US 3.02 4.81 12.40 61.20
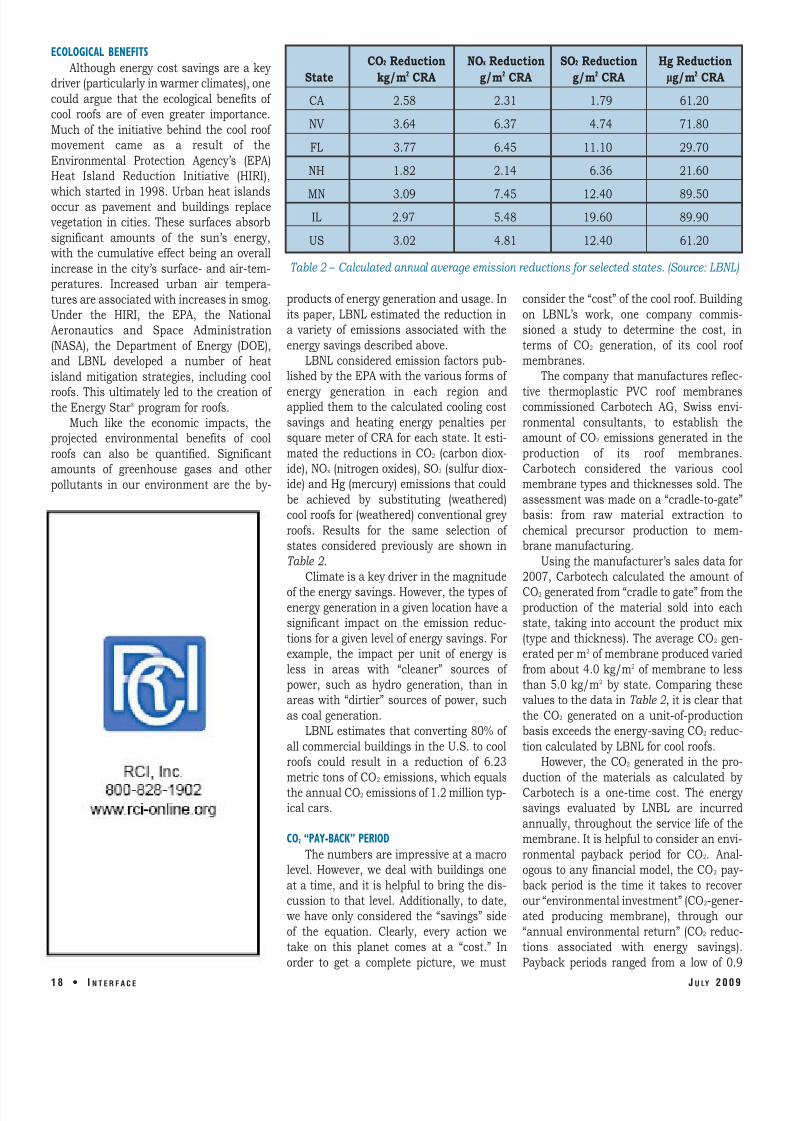
Table 2 – Calculated annual average emission reductions for selected states. (Source: LBNL)
products of energy generation and usage. Inits paper, LBNL estimated the reduction ina variety of emissions associated with theenergy savings described above.
LBNL considered emission factors published by the EPA with the various forms of
energy generation in each region andapplied them to the calculated cooling costsavings and heating energy penalties persquare meter of CRA for each state. It estimated the reductions in CO2 (carbon dioxide), NOx (nitrogen oxides), SO2 (sulfur dioxide) and Hg (mercury) emissions that couldbe achieved by substituting (weathered)cool roofs for (weathered) conventional greyroofs. Results for the same selection of states considered previously are shown inTable 2 .
Climate is a key driver in the magnitude
of the energy savings. However, the types of energy generation in a given location have asignificant impact on the emission reductions for a given level of energy savings. Forexample, the impact per unit of energy isless in areas with “cleaner” sources of power, such as hydro generation, than inareas with “dirtier” sources of power, suchas coal generation.
LBNL estimates that converting 80% of all commercial buildings in the U.S. to coolroofs could result in a reduction of 6.23metric tons of CO2 emissions, which equalsthe annual CO2 emissions of 1.2 million typical cars.
CO2 “PAY-BACK” PERIOD
The numbers are impressive at a macrolevel. However, we deal with buildings oneat a time, and it is helpful to bring the discussion to that level. Additionally, to date,we have only considered the “savings” sideof the equation. Clearly, every action wetake on this planet comes at a “cost.” Inorder to get a complete picture, we must
consider the “cost” of the cool roof. Buildingon LBNL’s work, one company commissioned a study to determine the cost, interms of CO2 generation, of its cool roofmembranes.
The company that manufactures reflec
tive thermoplastic PVC roof membranescommissioned Carbotech AG, Swiss environmental consultants, to establish theamount of CO2 emissions generated in theproduction of its roof membranes.Carbotech considered the various coolmembrane types and thicknesses sold. Theassessment was made on a “cradle-to-gate”basis: from raw material extraction tochemical precursor production to membrane manufacturing.
Using the manufacturer’s sales data for2007, Carbotech calculated the amount of
CO2 generated from “cradle to gate” from theproduction of the material sold into eachstate, taking into account the product mix(type and thickness). The average CO2 generated per m2 of membrane produced variedfrom about 4.0 kg/m2 of membrane to lessthan 5.0 kg/m2 by state. Comparing thesevalues to the data in Table 2 , it is clear thatthe CO2 generated on a unit-of-productionbasis exceeds the energy-saving CO2 reduction calculated by LBNL for cool roofs.
However, the CO2 generated in the production of the materials as calculated byCarbotech is a one-time cost. The energysavings evaluated by LNBL are incurredannually, throughout the service life of themembrane. It is helpful to consider an environmental payback period for CO2. Analogous to any financial model, the CO2 payback period is the time it takes to recoverour “environmental investment” (CO2-generated producing membrane), through our“annual environmental return” (CO2 reductions associated with energy savings)Payback periods ranged from a low of 0.9
J U LY 2 0 0 9

7/29/2019 RCI Interface - Benefits of Cool Roofs
http://slidepdf.com/reader/full/rci-interface-benefits-of-cool-roofs 5/7
State
CA
CO2 PaybackPeriod in Years
1.8
CO2 PaybackMultiple Over
20-Yr Service Life
11.1
NV 1.2 16.7
FL 1.2 16.7
NH 2.4 8.3
MN 1.3 15.4
IL 1.6 12.5
U.S. 1.7 11.8
Table 3 – Average CO 2 payback periods and payback
multiples for selected states. (Source: Carbotech)
years, in Hawaii, to a high of 4.3 years, inAlaska. Results for the states previouslyhighlighted are shown in Table 3 . Thenational average is 1.7 years.
Looking at it another way, assuming a
life expectancy of 20 years for the membrane, the CO2 investment would pay foritself almost 12 times over during the roof’sservice life on average across the U.S.Similar results for the selected states areshown in Table 3 .
ROOF PERFORMANCE
One cannot forget that theprimary purpose of any roof isto protect the structure fromthe elements. Roofing materials, whether “cool” or not,should be chosen based ontheir proven track record of durability. There are numer
ous cool products on the market in various product typesthat have provided decades of exemplary service.
Roof assemblies must beproperly designed incorporating vapor retarders or airbarriers where required,
multiple layers of insulation to prevent thermal shorts, appropriate fastening technology, proper detailing, etc. They must beinstalled by qualified contractors, ideally inthe presence of trained roof observers.
Taking shortcuts or “value engineering” keyelements of the roofing package will compromise roof performance, “cool” or not.One area in particular where specifiersshould avoid the temptation to value engineer their design around cool roofs is withregard to insulation. Although some stan-
J U LY 2 0 0 9 I N T E R F A C E • 1 9

7/29/2019 RCI Interface - Benefits of Cool Roofs
http://slidepdf.com/reader/full/rci-interface-benefits-of-cool-roofs 6/7
dards may allow for it under certain circumstances, cooling energy savings shouldnot be used as a basis for using less insulation below cool roofs in any climate. Coolroofing should be used as an enhancementto the insulation rather than as a partialsubstitute or a reason to specify a lower R-value. The one exception may be a buildingin a hot climate that contains many internal
heat sources (equipment, people, lighting),where increasing the thermal resistance of the shell may actually increase the coolingload.
Ultimately, our collective objectiveshould be to improve roof performance andenergy efficiency, wherever possible.
CONCLUSIONS
The latest LBNL report highlights thepotential cooling energy savings possible oncommercial buildings around the country.Its evaluation of “heating energy penalties”
shows that, even in northern states, themagnitude is quite small in this buildingsegment. Taking into account year-roundenergy impacts, net energy and corresponding cost savings are achievable on commercial buildings across the country.
These energy savings can translate into
reductions in greenhouse gases and otherpollutants. Although the production of coolroofing (and all other materials) results inthe generation of CO2 and other greenhouse gases, the environmental “cost” isquickly recouped through reductions inemissions associated with the energy savings. Most importantly, these benefits canbe achieved without sacrificing perfor
mance or durability.In an interview on the topic of cool roofsas a greenhouse gas mitigation strategy,Stephen Schneider, codirector of Stanford’sCenter for Environmental Science andPolicy and the editor of Climatic Change ,summed things up nicely when he said, “It’sa clever idea that has no obvious sideeffects and gives us a good bang for ourbuck.”
REFERENCES
Agence France Presse, “U.S. Wants to
Paint the World White to SaveEnergy,” May 26, 2009.
H. Akbari, A.A. Berhe, R.L. Levinson, S.Graveline, K. Foley, A. Delgado, R.M.Paroli, “Aging and Weathering of Cool Roofing Membranes,” Pro -
ceedings of the Cool Roofing... Cut -
ting Through the Glare Symposium
RCI Foundation, Atlanta, GA, 2005.H. Akbari, R. Levinson, “Evolution of
Cool-Roof Standards in the U.S.,”Ad vances in Building Energy Re
search , 2008, Volume 2.H.R. Beer, W. Pfammatter, “Durability of
PVC Roof Membranes – Field Investigation and Laboratory Testing Af
ter Up to 34 Years Exposure,” Pro ceed ings of the ICBEST Symposium
Sydney, Australia, 2004.S.P. Graveline, “Evaluating Environ
mental Returns,” Professional Roof
ing , April 2009.S.P. Graveline, H.R. Beer, R.M. Paroli,
A.H. Delgado, “Field Investigationand Laboratory Testing of ExposedPoly(Vinyl Chloride) Roof Systems,”Proceedings of the RCI 20th In ter
national Convention and Trade
Show , Miami, FL, 2005.
S. Kornell, “Is White the New Green?”,www.miller-mccune.com, April 32009.
R. Levinson, H. Akbari, “Potential Benefits of Cool Roofs on CommercialBuildings: Conserving Energy, Saving Money, and Reducing Emissions
2 0 • I N T E R F A C E J U LY 2 0 0 9

7/29/2019 RCI Interface - Benefits of Cool Roofs
http://slidepdf.com/reader/full/rci-interface-benefits-of-cool-roofs 7/7
of Greenhouse Gases and Air Pollutants,” Energy Efficiency , March2009.
C. Stettler, F. Dinkel, “Balancing CO2
Emissions from PVC Membrane Production with Energy Savings Emissions in Use,” Carbotech AG , March2009.
E. Wong, “Summertime Heat Islands,
the Heat Island Reduction Initiative,and Cool Roofs,” Proceedings of the
Cool Roofing... Cutting Through the
Glare Symposium , RCI Foundation,Atlanta, GA, 2005.
Stanley P. Graveline is vice president of technical services forSika Sarnafil Inc., Canton, MA. He has worked in the roofingindustry for more than 25 years in various technical, sales,and management capacities in Canada, Switzerland, and theU.S. He has participated in numerous technical committeesand standards-writing bodies in North America and Europe.He is a member of Professional Engineers Ontario and RCI,
Inc. Graveline is currently active on various committees within the Cool Roof Rating Council, the Chemical Fabric andFilm Association, and the National Roofing Contractors’ Association. He has a bachelor’s degree in chemical engineering from the University of Ottawa and an M.B.A. fromthe International Institute for Management Development, Lausanne, Switzerland.
Stanley P. Graveline
The Ozone Transport Commission (OTC) is a coalition of 13 Northeastern and Mid-Atlantic states that work cooperatively on regional
solutions to ground-level ozone.The OTC created a model rule regarding the reduction of emissions from volatile organic compounds from
adhesives and sealants. States have taken this model rule and used it as a foundation for drafting their own regulations.All states with final regulations have included a modified implementation schedule that indicates that low VOC products must be used during warm-weather months.
Following is an overview of passed, pending, and proposed regulations in these states concerning emissions of volatile organic compounds
from adhesives and sealants, updated from a similar table published in the April 2009 Interface.
UPDATED VOC ADHESIVE RULES FOR NE AND MID-ATLANTIC STATES
IMPLEMENTATION DATES
2009 2010 2011 2012
Connecticut
www.ct.gov/dep/lib/dep/regulations/22a/22a-174-1through200.pdf
6/1 - 8/31 5/1 - 9/30 5/1 - 9/30 01/01/12
and thereafter
Delaware
www.regulations.delaware.gov/register/april2009/final/12%20DE%20Reg%201333%2004-01-09.htm
6/1 - 8/31 5/1 - 9/30 5/1 -9/30 01/01/12
and thereafter
District of Columbia Under consideration
Maine
www.maine.gov/dep/air/regulations/proposed.htm
Regulation pending
Maryland
www.dsd.state.md.us/comar/subtitle_chapters/26_Chapters.htm. Select 26.11.35.01
5/15 -9/15 5/15 -9/15 5/1 -9/30 01/01/12
and thereafter
Massachusetts Under consideration
New Hampshire Under consideration
New Jersey
www.state.nj.us/dep/aqm/Sub26.pdf
6/1 - 8/31 5/1 - 9/30 5/1 -9/30 01/01/12
and thereafter
New York
www.dec.ny.gov/regulations/36816.html
Under consideration
Pennsylvania
www.depweb.state.pa.us/pubpartcenter/cwp/view.asp?a=3&q=523288
Regulation pending
Rhode Island
www.dem.ri.gov/programs/benviron/air/25313344.htm
7/1 - 8/31 5/1 - 9/30 5/1 -9/30 01/01/12
and thereafter
Vermont No action planned at this time
Virginia
www.townhall.state.va.us
Regulation proposed
Updated April 30, 2009 — Courtesy of EPDM Roofing Association (ERA)
J U LY 2 0 0 9 I N T E R F A C E • 2 1