rca showcase and performance analytics - crowe
TRANSCRIPT

Nurture Your NetworkUpskill. Connect. Grow.
Crowe Healthcare Summit 2019
Presented by:
Smart decisions. Lasting value.™
September 18
Brad HeatonAlex Garrison
RCA Showcase and Performance Analytics

© 2019 Crowe LLP 2
Simplify your busy workday. Register today to continue the
Healthcare Summit conversations: crowehive.com.
Being successful in your role today looks different than it
did even a few years ago. Engage with a network of
those who have been there before you:
• Ask and answer community questions
• Seek validation and gain support through crowdsourcing
• Connect with peers and Crowe specialists
• Earn rewards for your engagement and shop the Hive store
Introducing Healthcare’s Trusted Community:
The Crowe Hive Network

© 2019 Crowe LLP 3
• History of RCA
• Where are we going?
• Performance Analytics
Agenda

© 2019 Crowe LLP 4
Your presenters
Jay Sutton
Principal
Brad Heaton
Senior Manager
Alex Garrison
Senior Manager

© 2019 Crowe LLP 5
History of RCA

© 2019 Crowe LLP 6
Crowe® RCA Client Installations 2005
Hindsight Analysis

© 2019 Crowe LLP 7
Crowe® RCA Client Installations 2006 - 2008
RCA 2.0
MRA Module
Revenue Cycle Monitor

© 2019 Crowe LLP 8
Crowe® RCA Client Installations 2009
Variance Analysis Module

© 2019 Crowe LLP 9
Crowe® RCA Client Installations 2010 - 2012
350 Hospitals
RCA Budget Module
Automated Close Module

© 2019 Crowe LLP 10
Crowe® RCA Client Installations 2013
500+ Hospitals
Hindsight Trending Template
New reports & enhancements

© 2019 Crowe LLP 11
Crowe® RCA Client Installations 2014 - 2015
750+ Hospitals
RCA Ad-Hoc
VA Themes Reporting
Crowe Benchmarking
GL Mapping & Reporting

© 2019 Crowe LLP 12
Crowe® RCA Client Installations 2016
RCA “Hosting”
New User Interface
RCA SOC1
850+ Hospitals
© 2019 Crowe LLP 13
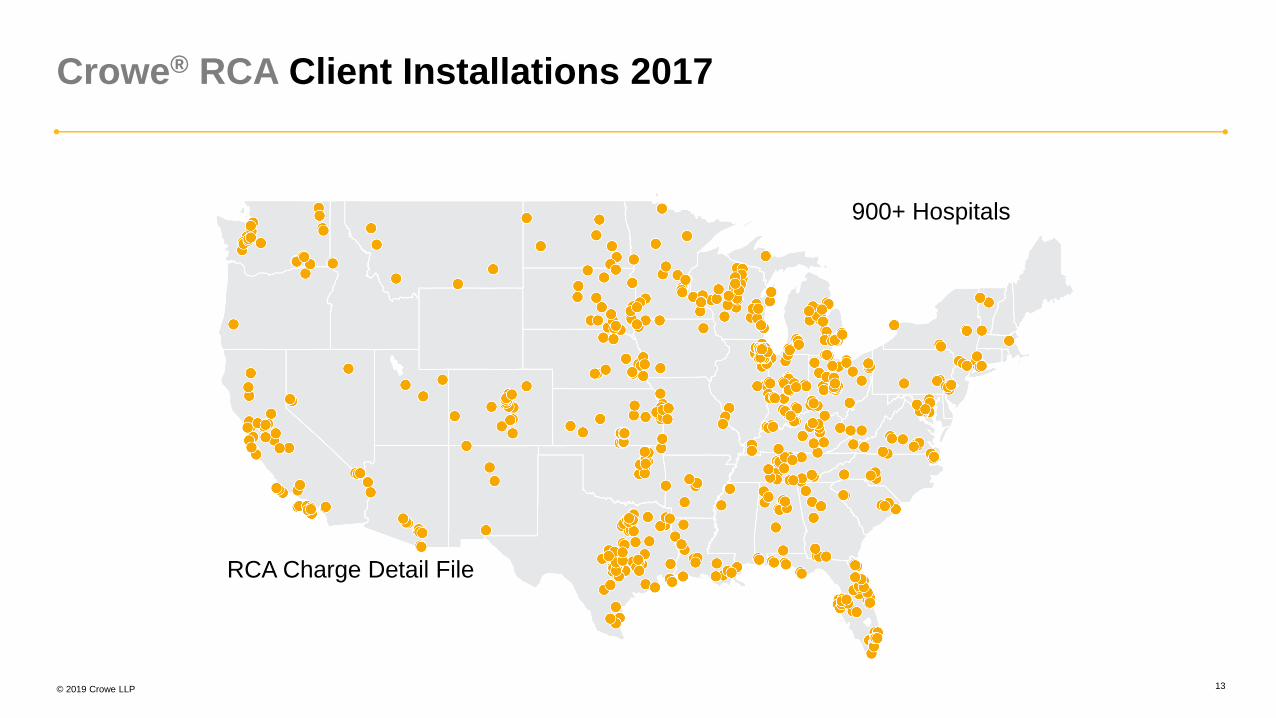
Crowe® RCA Client Installations 2017
900+ Hospitals
RCA Charge Detail File

© 2019 Crowe LLP 14
Crowe® RCA Client Installations 2019
1000+ Hospitals
Automated upgrades
Physicians module
Recoveries logic update

© 2019 Crowe LLP 15
Where are we going?

© 2019 Crowe LLP 16
Summary Product RoadmapQuality, Scalability, and Client Experience
RCA 2019• New upgrade process • Bug fixes • Performance improvements• End to end code review
Net Revenue• Simplifying the net revenue reporting process • Automating daily maintenance • New net revenue reporting • Sensitivity analysis
Feature Sets• Updated VA themes • Stats \ volume & charge level reporting • Service line reporting
Monitoring• Alerts and Subscriptions• System Health • Dashboards• Nightly Job Validation
Artificial Intelligence• Predictive Analytics• Machine learning • Bad debt, charity, and denial • Net revenue analysis
Modules• Budget Module• Physician Enhancements• Projections

© 2019 Crowe LLP 17
How can you help?
• Pass your ideas along to your RCA point of contact
• Email [email protected]

© 2019 Crowe LLP 18
Performance Analytics
© 2019 Crowe LLP 19
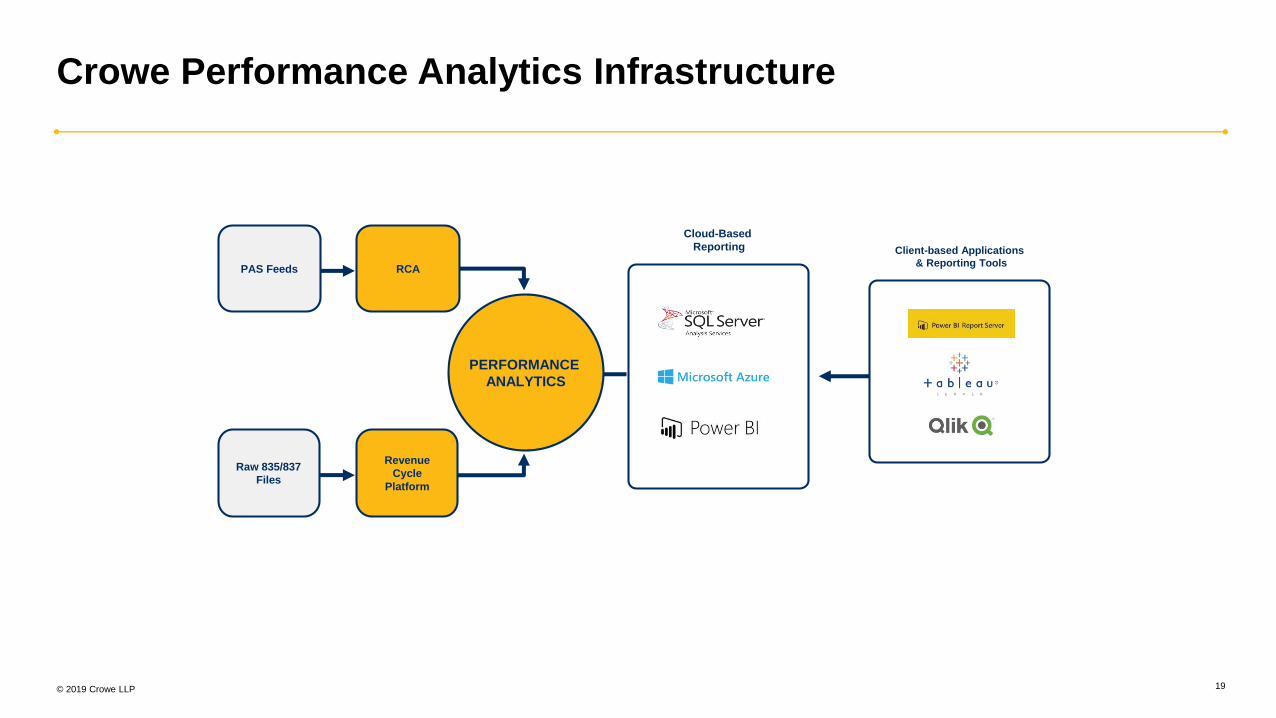
Crowe Performance Analytics Infrastructure
PERFORMANCE
ANALYTICS
PAS Feeds
Cloud-Based
Reporting
Raw 835/837
Files
RCA
Revenue
Cycle
Platform
Client-based Applications
& Reporting Tools

© 2019 Crowe LLP 20
• Quantify Opportunity
• Identify Root Cause
• Prioritize Improvement Efforts
BENEFITS
Attending physician,
diagnosis and
procedure data
PAS
Denials and patient
responsibility data
835
Financial realization, time
to payment/resolution,
service location
837
Link data at the account level
Utilize Available Data to Create Insightful KPIs and Analytics

© 2019 Crowe LLP 21
Performance Analytics Program Summary
Executive-level revenue cycle dashboard ranking facilities
based on an 11 metric score
Director & Manager-level KPI monitoring tool leveraging
40+ KPIs by facility, IP/OP, & Financial Class
Holistic denials reporting on initial & subsequent claims tied
to the PAS. In addition, KPI dashboards at the I-plan level
allow for increased payor-specific data discovery
KPI Module
Denials & Payor
Scorecard Modules
Ad Hoc Dashboarding Support
Index Score
Module
Utilizing Crowe’s analytics resources clients can configure
report views to suit their particular organizational needs
KPI Module Revenue Cycle Index
Score Module
Payor Scorecard
Module
Denials
Reporting
Module
Ad Hoc
Dashboarding
Support
1 2 3 4 5
© 2019 Crowe LLP 22
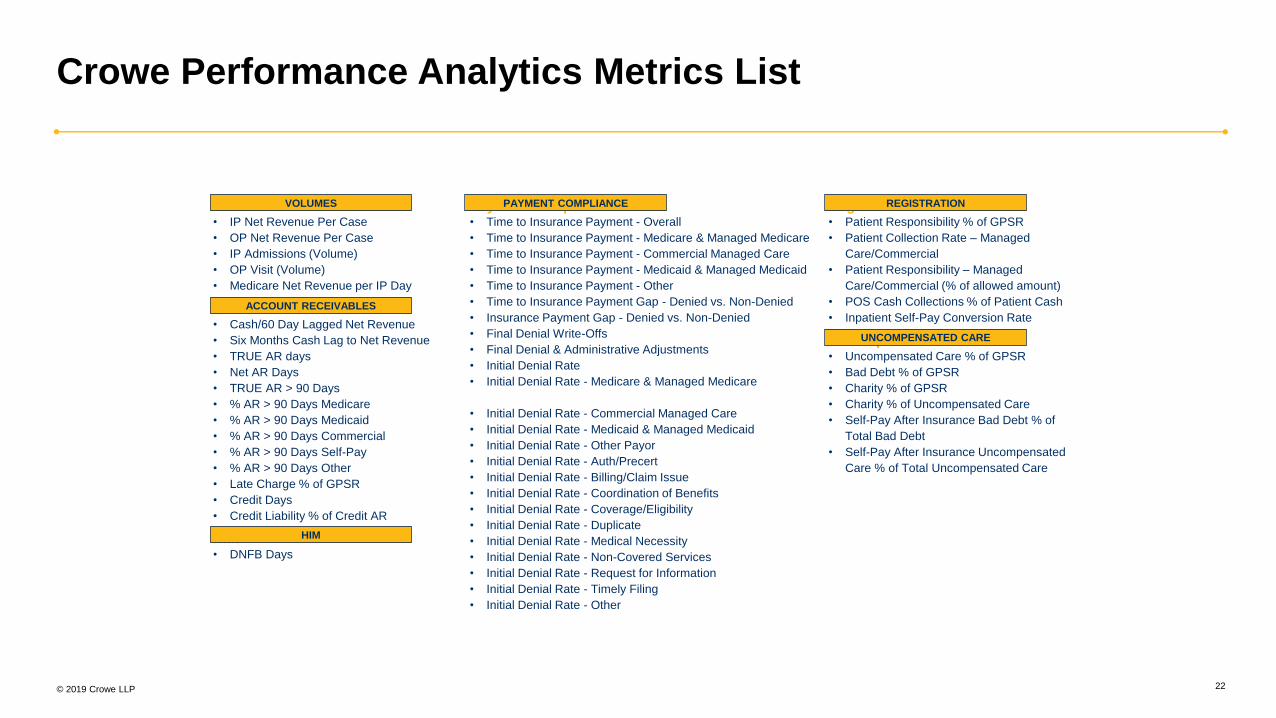
Volumes• IP Net Revenue Per Case
• OP Net Revenue Per Case
• IP Admissions (Volume)
• OP Visit (Volume)
• Medicare Net Revenue per IP Day
Accounts Receivable• Cash/60 Day Lagged Net Revenue
• Six Months Cash Lag to Net Revenue
• TRUE AR days
• Net AR Days
• TRUE AR > 90 Days
• % AR > 90 Days Medicare
• % AR > 90 Days Medicaid
• % AR > 90 Days Commercial
• % AR > 90 Days Self-Pay
• % AR > 90 Days Other
• Late Charge % of GPSR
• Credit Days
• Credit Liability % of Credit AR
HIM• DNFB Days
VOLUMES Payment Compliance• Time to Insurance Payment - Overall
• Time to Insurance Payment - Medicare & Managed Medicare
• Time to Insurance Payment - Commercial Managed Care
• Time to Insurance Payment - Medicaid & Managed Medicaid
• Time to Insurance Payment - Other
• Time to Insurance Payment Gap - Denied vs. Non-Denied
• Insurance Payment Gap - Denied vs. Non-Denied
• Final Denial Write-Offs
• Final Denial & Administrative Adjustments
• Initial Denial Rate
• Initial Denial Rate - Medicare & Managed Medicare
• Initial Denial Rate - Commercial Managed Care
• Initial Denial Rate - Medicaid & Managed Medicaid
• Initial Denial Rate - Other Payor
• Initial Denial Rate - Auth/Precert
• Initial Denial Rate - Billing/Claim Issue
• Initial Denial Rate - Coordination of Benefits
• Initial Denial Rate - Coverage/Eligibility
• Initial Denial Rate - Duplicate
• Initial Denial Rate - Medical Necessity
• Initial Denial Rate - Non-Covered Services
• Initial Denial Rate - Request for Information
• Initial Denial Rate - Timely Filing
• Initial Denial Rate - Other
Registration• Patient Responsibility % of GPSR
• Patient Collection Rate – Managed
Care/Commercial
• Patient Responsibility – Managed
Care/Commercial (% of allowed amount)
• POS Cash Collections % of Patient Cash
• Inpatient Self-Pay Conversion Rate
Uncompensated Care• Uncompensated Care % of GPSR
• Bad Debt % of GPSR
• Charity % of GPSR
• Charity % of Uncompensated Care
• Self-Pay After Insurance Bad Debt % of
Total Bad Debt
• Self-Pay After Insurance Uncompensated
Care % of Total Uncompensated Care
Crowe Performance Analytics Metrics List
ACCOUNT RECEIVABLES
HIM
PAYMENT COMPLIANCE REGISTRATION
UNCOMPENSATED CARE
© 2019 Crowe LLP 23© 2019 Crowe LLP
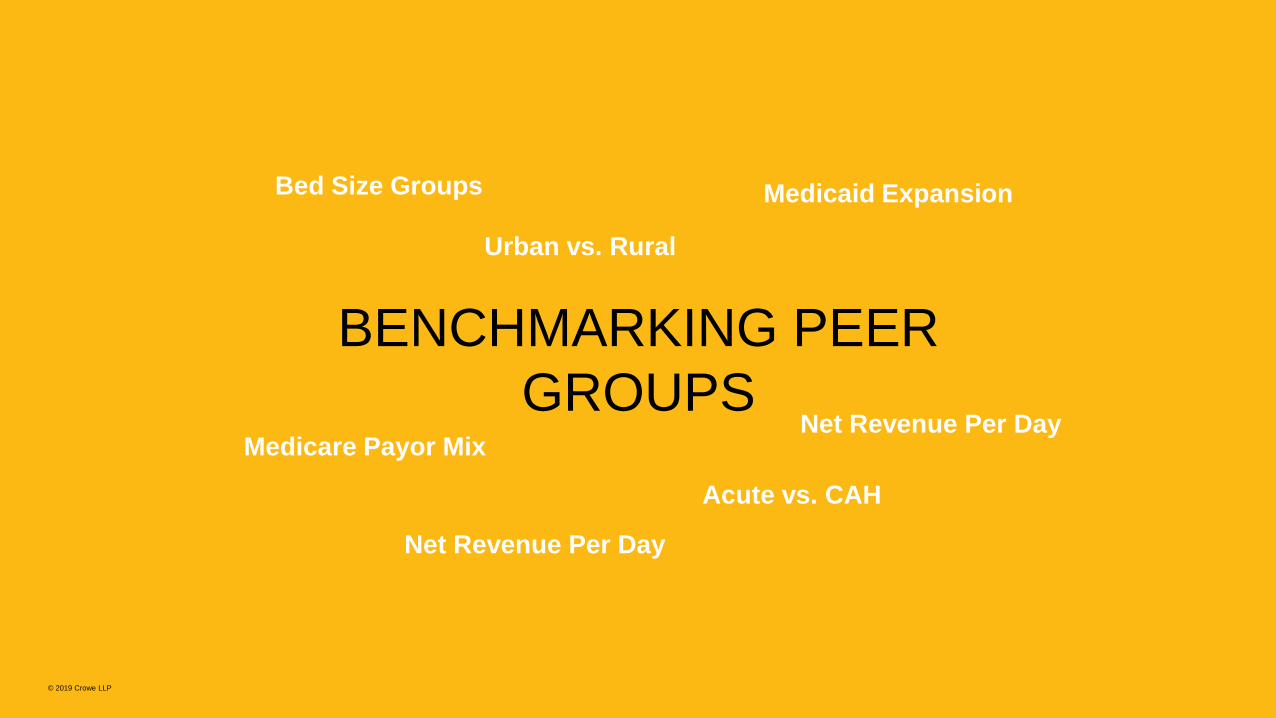
Bed Size Groups
BENCHMARKING PEER
GROUPS
Urban vs. Rural
Medicare Payor Mix
Acute vs. CAH
Net Revenue Per Day
Medicaid Expansion
Net Revenue Per Day

© 2019 Crowe LLP 24
Crowe Index Module
Identify site
performance
disparity,
favorable, and
unfavorable
trends
Track index
performance
over time for
the system and
individual
facilities

© 2019 Crowe LLP 25
Crowe Index Module (continued)
See key metrics driving index score and
associate with current performance

© 2019 Crowe LLP 26
Crowe Index Module (continued)
DEFINITION:
• Numerator: Total accounts receivable at current
account balance (excluding credits), includes
account balance plus contractual allowance if
insurance payment has not posted.
• Denominator: Average daily GPSR from
previous 3 months
True AR Days
Ma
rch
20
16
120
110
100
90
80
70
60
50
40
30
20
Ju
ne
20
16
Se
pte
mb
er
20
16
De
ce
mb
er
20
16
Ma
rch
20
17
Ju
ne
20
17
Se
pte
mb
er
20
17
Identify performance band improvement
thresholds and trace KPI performance
over time

© 2019 Crowe LLP 27
KPI Module
Track metric
comparisons to
user-
determined
peer group
Compare
performance
by key payor
groups to
benchmarks
User flexibility
for peer group
determination
from a variety
of factors

© 2019 Crowe LLP 28
Payor Scorecard Module
Custom payor
grouping
features allow
for i-plan
groupings to
payor and
product
defined fields
for analysis
KPI tracking at
the i-plan level
Comprehensive
metric tracking
for all supported
metrics

© 2019 Crowe LLP 29
Denials Module
Track detailed
remittance
information by
denial category
and compare
to national
benchmarks
Identify trends by a
variety of fields
including but not
limited to: ANSI
code, Remark Code
service type, DRG,
CPT, and more

© 2019 Crowe LLP 30
Simplify your busy workday. Register today to continue the
Healthcare Summit conversations: crowehive.com.
Being successful in your role today looks different than it
did even a few years ago. Engage with a network of
those who have been there before you:
• Ask and answer community questions
• Seek validation and gain support through crowdsourcing
• Connect with peers and Crowe specialists
• Earn rewards for your engagement and shop the Hive store
Introducing Healthcare’s Trusted Community:
The Crowe Hive Network

© 2019 Crowe LLP 31
Thank you

The information in this document is not – and is not intended to be – audit, tax, accounting, advisory, risk, performance, consulting, business, financial, investment, legal, or other professional advice. Some firm services may not be available to attest clients. The information
is general in nature, based on existing authorities, and is subject to change. The information is not a substitute for professional advice or services, and you should consult a qualified professional adviser before taking any action based on the information. Crowe is not
responsible for any loss incurred by any person who relies on the information discussed in this document. Visit www.crowe.com/disclosure for more information about Crowe LLP, its subsidiaries, and Crowe Global. © 2019 Crowe LLP.