rc-1585 evaluating pedestrian safety improvements purpose of the study was to evaluate the impact of...
TRANSCRIPT

1
Michigan Department of Transportation
EVALUATING PEDESTRIAN SAFETY IMPROVEMENTS: FINAL REPORT
Prepared by: Western Michigan University and T.Y. Lin International December 3, 2012

Technical Report Documentation Page
1. Report No. RC-1585
2. Government Accession No. N/A
3. MDOT Project Manager Deirdre Thompson
4. Title and Subtitle EVALUATING PEDESTRIAN SAFETY IMPROVEMENTS
5. Report Date December 3, 2012 6. Performing Organization Code N/A
7. Author(s) Ron Van Houten, Ph.D., John LaPlante, PT, PTOE, and Tim Gustafson, AICP
8. Performing Org. Report No. N/A
9. Performing Organization Name and Address Western Michigan University 1903 West Michigan Avenue Kalamazoo, MI 49008
10. Work Unit No. (TRAIS) N/A 11. Contract No. 2010-0297 11(a). Authorization No. Z1
12. Sponsoring Agency Name and Address Michigan Department of Transportation Research Administration 8885 Ricks Rd. P.O. Box 30049 Lansing MI 48909
13. Type of Report & Period Covered Final Report 10/1/2010 – 9/30/2012 14. Sponsoring Agency Code N/A
15. Supplementary Notes 16. Abstract The purpose of the study was to evaluate the impact of new pedestrian countermeasure installations on pedestrian safety to assist in informing future pedestrian safety initiatives. In order to address these objectives, the WMU team conducted a literature review; evaluated existing safety improvements, including pedestrian hybrid beacons (PHB), rectangular rapid flashing beacons (RRFB), and in-street signs; examined the use of a Gateway configurations of the in-street signs; determined the efficacy of PHB and RRFB installations in conjunction with in-street signs; evaluated potential outreach and enforcement techniques; conducted on-street surveys; and performed a statistical analysis of pedestrian countermeasures at traffic signals. RRFBs and PHBs were evaluated at a number of Michigan locations, including roundabouts. The findings of these studies suggested that the RRFB and the PHB performed similarly at two-lane roundabout installations, although the PHB appeared to outperform the RRFB at three-lane roundabouts. Furthermore, the PHB and RRFB devices often produced lower motorist yielding levels in Michigan when compared to the results of the larger-scale FHWA studies discussed in the literature review. This result could be due to a lack of familiarity with these devices in Michigan, or driver and pedestrian lack of understanding of Michigan law. In-street signs also were evaluated at six locations as part of the study. The in-street signs yielded results similar to those reported in the research literature. The in-street signs then were further evaluated using a Gateway configuration on each two lane leg of four-lane divided roads, which included the use of one placed at each curb and one placed in the center of the roadway between travel lanes. The Gateway treatment produced yielding levels equal to or superior to the PHB and RRFB. Intercept surveys were conducted to determine motorist and pedestrian knowledge of the necessary actions for PHB, RRFB, and in-street sign. The results of the driver and pedestrian survey provided additional evidence that drivers and pedestrians do not fully comprehend how they should respond to the PHB and RRFB. A crash analysis was completed for countermeasures installed at

Technical Report Documentation Page
signalized crossings. A statistical analysis of data from pedestrian countdown timers (PCT) in Detroit and Kalamazoo provided unequivocal evidence that the installation of the PCT had reduced crashes. The effect size in the Detroit sample was quite large; crash reductions also were observed in Kalamazoo, but the much smaller sample size reduced the level of confidence in the effect. However, when both sites were pooled, the effect was robust. The analysis of the effects of flashing yellow arrows treatment in Oakland County did not indicate any benefit to pedestrians. 17. Key Words Pedestrian Safety, PHB, RRFB, In Street Signs, Pedestrian Countdown timer, Gateway Treatment
18. Distribution Statement No restrictions. This document is available to the public through the Michigan Department of Transportation.
19. Security Classification - report Unclassified
20. Security Classification - page Unclassified
21. No. of Pages 107
22. Price N/A
2
TABLE OF CONTENTS EXECUTIVE SUMMARY 4 INTRODUCTION 8 CHAPTER 1 LITERATURE REVIEW 10
IMPROVEMENTS AT UNSIGNALIZED CROSSINGS 10 IMPROVEMENTS AT SIGNALIZED CROSSINGS 18 COST SUMMARY 26
CHAPTER 2 EVALUATION OF INNOVATIVE SAFETY IMPROVEMENTS 27 CHAPTER 3 EVALUATION OF IN-STREET SIGNS IN A GATEWAY CONFIGURATION 44 CHAPTER 4 ENHANCING THE EFFICACY OF THE PHB AND RRFB WITH IN-STREET SIGNS 47 CHAPTER 5 OUTREACH AND ENFORCEMENT TECHNIQUES FOR INNOVATIVE COUNTERMEASURES 55 CHAPTER 6 DRIVER AND PEDESTRIAN SURVEY RESULTS 62 CHAPTER 7 STATISTICAL ANALYSIS OF PEDESTRIAN COUNTDOWN TIMERS AND FLASHING YELLOW ARROWS 75 CHAPTER 8 CONCLUSIONS 102 BIBLIOGRAPHY 103

3
LIST OF ACRONYMS Average Daily Traffic ADT Baseline BL Federal Highway Administration FHWA Flashing Yellow Arrows FYA Florida Department of Transportation FDOT Institute of Transportation Engineers ITE Light-Emitting Diode LED Manual on Uniform Traffic Control Devices MUTCD Michigan Department of Transportation MDOT Michigan State University MSU Minnesota Department of Transportation MNDOT National Cooperative Highway Research Program NCHRP National Highway Traffic Safety Administration NHTSA Pedestrian Countdown Timers PCT Pedestrian Hybrid Beacon PHB Rectangular Rapid Flashing Beacon RRFB Right-turn-on-red RTOR Southeast Michigan Council of Governments SEMCOG University of Michigan U of M Wayne State University WSU

4
EXECUTIVE SUMMARY In 2009, the Michigan Department of Transportation (MDOT) initiated a multi-year study with Western Michigan University (WMU) and T.Y. Lin International (TYLI) in order to evaluate engineering and design solutions intended to reduce the number of pedestrian crashes in Michigan. These solutions included signage and traffic control countermeasures. The purpose of the study was to evaluate the impact of these countermeasure installations on pedestrian crashes that then could assist in informing future pedestrian safety initiatives. The results of this study, along with national guidance and current practices, would allow for the development of best pedestrian safety practices and help MDOT prioritize funding for the implementation of improvements throughout the state. The WMU/TYLI team (hereafter the “WMU team” or “research team”) proposed the following objectives associated with this multi-year study:
1. Identify national practices with regard to pedestrian safety countermeasures that could influence practice in Michigan.
2. Obtain an understanding of the effectiveness of current Michigan countermeasures in reducing pedestrian crashes.
3. Gauge public response to the pedestrian safety improvements. 4. Develop recommendations for application of future pedestrian safety improvements in
Michigan. In order to address these objectives, the WMU team conducted a literature review; evaluated existing safety improvements, including pedestrian hybrid beacons (PHB), rectangular rapid flashing beacons (RRFB), and in-street signs; examined the use of Gateway configurations of the in-street signs; determined the efficacy of PHB and RRFB installations in conjunction with in-street signs; evaluated potential outreach and enforcement techniques; conducted on-street surveys; and performed a statistical analysis of countermeasures. The literature review conducted as part of the multi-year study included a review of existing improvements used at uncontrolled locations (i.e., the use of PHB, RRFB, in-street signs, and advance warnings) and signalized intersections (i.e., the use of pedestrian countdown timers (PCT), no right-turn-on-red (RTOR) signs, leading pedestrian interval (LPI) signal phases, advance or offset stop bars, midblock traffic signals, and pedestrian call buttons). The case studies reviewed were to be used to help determine the potential effect of increasing driver yielding behavior and reducing pedestrian crashes. Case studies were evaluated for uncontrolled crossing locations using PHB within the City of Tucson, Arizona, as well as within the City of St. Petersburg, Florida. Based on the information reviewed in these studies, the WMU team determined that the effectiveness of the PHB was

5
largely dependent on the motorists’ understanding. In addition, the research team evaluated Federal Highway Administration (FHWA) studies centered on the use of the RRFB. These studies provided examples of changes in motorist yielding behavior from around the country. In general, the studies suggested that the RRFB increased yielding behaviors. In-street yield signs are installed in the roadway to increase the visibility of crosswalks and to remind motorists of the right of way laws at unsignalized crosswalks. The case studies typically showed that motorists had a strong understanding of these signs and the necessary actions associated with their presence. In addition, this type of signage could be used in conjunction with advance yield/stop markings. Case studies involving improvements at traffic signals also were analyzed as part of the literature review. For instance, PCT were found to be more intuitive than traditional signing as shown by studies conducted by the Florida Department of Transportation (FDOT) and the Minnesota Department of Transportation (MnDOT). Flashing yellow arrows (FYA) were evaluated within a study conducted by the National Cooperative Highway Research Program (NCHRP). The NCHRP study included a description of the effects on motorist comprehension, motorist behavior, and a change in the occurrence of all crashes where the FYA was implemented. Additional literature was reviewed documenting the use of no right-turn-on-red (RTOR) signage at signals, the leading pedestrian signal phase, advance or offset stop bars, midblock traffic signals, and pedestrian call buttons that confirm they have been pressed. Using knowledge obtained from the review of the literature, the WMU team conducted an evaluation of the PHB at sites located at Wayne State University (WSU) and in the municipalities of Ann Arbor, Ypsilanti, West Bloomfield, and within Oakland County. From this analysis, the research team determined that the efficacy of the PHB may depend in part on outreach and local law enforcement activity associated with the introduction of this device. Cultural or demographic factors and geometric design of the location also may influence the efficacy of new devices.
In addition to the PHB installations, the research team evaluated RRFB, which was developed to increase motorist yielding on multilane roads at a lower cost than PHB. The RRFB were evaluated at six Michigan locations, including roundabouts. The findings of these studies suggested that the RRFB and the PHB performed similarly at two-lane roundabout installations, although the PHB appeared to outperform the RRFB at three-lane roundabouts. Furthermore, the PHB and RRFB devices often produced lower motorist yielding levels in Michigan when compared to the results of the larger-scale FHWA studies discussed in the literature review. This result could be due to a lack of familiarity with these devices in Michigan, the use of the devices at roundabout locations, or driver and pedestrian lack of understanding of Michigan law.
6
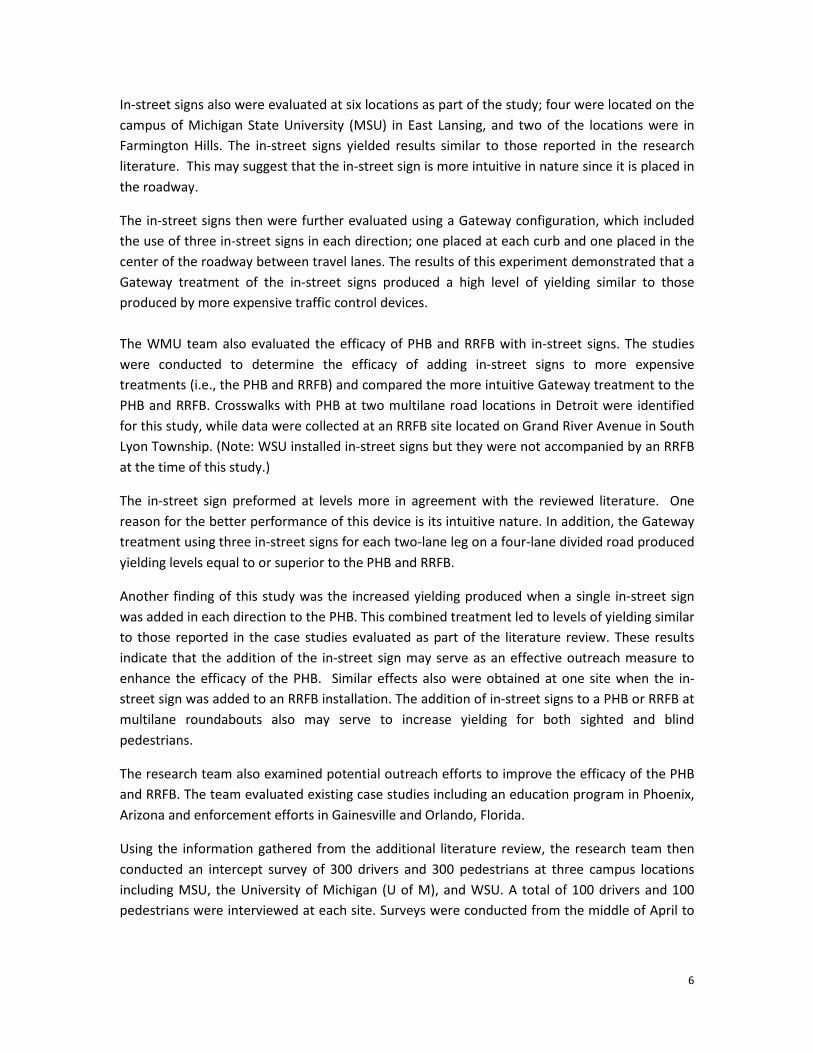
In-street signs also were evaluated at six locations as part of the study; four were located on the campus of Michigan State University (MSU) in East Lansing, and two of the locations were in Farmington Hills. The in-street signs yielded results similar to those reported in the research literature. This may suggest that the in-street sign is more intuitive in nature since it is placed in the roadway.
The in-street signs then were further evaluated using a Gateway configuration, which included the use of three in-street signs in each direction; one placed at each curb and one placed in the center of the roadway between travel lanes. The results of this experiment demonstrated that a Gateway treatment of the in-street signs produced a high level of yielding similar to those produced by more expensive traffic control devices. The WMU team also evaluated the efficacy of PHB and RRFB with in-street signs. The studies were conducted to determine the efficacy of adding in-street signs to more expensive treatments (i.e., the PHB and RRFB) and compared the more intuitive Gateway treatment to the PHB and RRFB. Crosswalks with PHB at two multilane road locations in Detroit were identified for this study, while data were collected at an RRFB site located on Grand River Avenue in South Lyon Township. (Note: WSU installed in-street signs but they were not accompanied by an RRFB at the time of this study.)
The in-street sign preformed at levels more in agreement with the reviewed literature. One reason for the better performance of this device is its intuitive nature. In addition, the Gateway treatment using three in-street signs for each two-lane leg on a four-lane divided road produced yielding levels equal to or superior to the PHB and RRFB.
Another finding of this study was the increased yielding produced when a single in-street sign was added in each direction to the PHB. This combined treatment led to levels of yielding similar to those reported in the case studies evaluated as part of the literature review. These results indicate that the addition of the in-street sign may serve as an effective outreach measure to enhance the efficacy of the PHB. Similar effects also were obtained at one site when the in-street sign was added to an RRFB installation. The addition of in-street signs to a PHB or RRFB at multilane roundabouts also may serve to increase yielding for both sighted and blind pedestrians.
The research team also examined potential outreach efforts to improve the efficacy of the PHB and RRFB. The team evaluated existing case studies including an education program in Phoenix, Arizona and enforcement efforts in Gainesville and Orlando, Florida.
Using the information gathered from the additional literature review, the research team then conducted an intercept survey of 300 drivers and 300 pedestrians at three campus locations including MSU, the University of Michigan (U of M), and WSU. A total of 100 drivers and 100 pedestrians were interviewed at each site. Surveys were conducted from the middle of April to

7
the end of July, 2012 between the hours of 10:00 am and 5:00 pm. The team analyzed pedestrian and motorist knowledge of the necessary actions for PHB, RRFB, and in-street sign.
However, with regard to signalized crossings, a statistical analysis of countermeasures, including Pedestrian Countdown Timers (PCT) and Flashing Yellow Arrows (FYA), was conducted. The intent of these analyses was to determine the efficacy of the countermeasures installed at signalized crossings. Crashes were analyzed for PCT locations in Detroit and Kalamazoo and for the FYA in Oakland County. The results of the statistical analysis provided unequivocal evidence that the installation of the PCT had reduced crashes. The effect size in the Detroit sample was quite large; crash reductions also were observed in Kalamazoo, but the much smaller sample size reduced the level of confidence in the effect. However, when both sites were pooled, the effect was robust. The analysis of the effects of the FYA treatment in Oakland County did not indicate any benefit to pedestrians.
The overall results of this study indicate that installations of the PHB and RRFB in Michigan are not producing levels of driver yielding to pedestrians as high as those documented in cases evaluated as part of the literature review. The weak performance of these devices in Michigan is likely the result of poor driver and pedestrian understanding of how to respond to the device. The results of the driver and pedestrian survey provided additional evidence that drivers and pedestrians do not fully comprehend how they should respond to the PHB and RRFB. This conclusion further is supported by the improved performance of the devices on the WSU campus, a location that has been associated with significant outreach efforts.
Furthermore, as previously indicated, the PCT was found to assist in the reduction of pedestrian crashes, whereas the FYA suggested no benefit to pedestrians.

8
INTRODUCTION In 2009, the Michigan Department of Transportation (MDOT) initiated a multi-year study with Western Michigan University (WMU) and T.Y. Lin International (TYLI) in order to evaluate engineering and design solutions intended to reduce the number of pedestrian crashes in Michigan. These solutions included signage and traffic control countermeasures. The purpose of the multi-year study was to evaluate the impact of these installations on pedestrian crashes that then could assist in informing future pedestrian safety initiatives. These data considered along with national guidance and current practices would allow for the development of best practices and help MDOT prioritize funding for the implementation of improvements throughout the state. As MDOT would like to increase its focus on reducing the number of pedestrian crashes in Michigan, the WMU/TYLI team (hereafter the “WMU team” or “research team”) proposed the following objectives:
1. Identify national practices with regard to pedestrian safety countermeasures that can influence practice in Michigan.
2. Obtain an understanding of the effectiveness of current Michigan countermeasures in reducing pedestrian crashes.
3. Gauge public response to the pedestrian safety improvements. 4. Develop recommendations for application of future pedestrian safety improvements in
Michigan. In order to address these objectives, the WMU team conducted a number of activities; each is captured as an individual chapter of this report. The following provides an outline of the individual chapters and thereby the actions taken as part of this multi-year study: Chapter 1 – Literature Review: The literature review focuses on the description of existing installations at uncontrolled crosswalk locations and improvements at traffic signals. The first portion provides a description and review of pedestrian hybrid beacons (PHB), the Rectangular Rapid Flashing Beacon (RRFB), in-street signs, and advance yield/stop markings. The second portion of the literature review includes a description and review of pedestrian countdown timers (PCT), flashing yellow arrows (FYA), no right-turn-on-red (RTOR) signage at signals, leading pedestrian signal phases, advance/offset stop bars, midblock traffic signals, and push buttons that confirm the press. Chapter 2 – Evaluation of Innovative Safety Improvements: This chapter begins with a discussion of the data collection methods used by the WMU team to evaluate PHB, RRFB, and in-street signs at existing locations within the State of Michigan. The discussion also includes the evaluation of the yielding behavior at each of these installations.

9
Chapter 3 – Evaluation of In-street signs in a Gateway Configuration: This evaluation focuses on the use of a Gateway treatment using three in-street signs. The WMU team conducted an evaluation at sites within East Lansing at the Michigan State University (MSU) campus and in Farmington Hills. Chapter 4 - Enhancing the Efficacy of the PHB and the RRFB: This chapter reports the results of studies conducted by the WMU team to determine the efficacy of adding in-street signs to more expensive treatments (i.e., the PHB and RRFB). The research team also provides a comparison of the Gateway treatment to the PHB and RRFB. Chapter 5 – Outreach and Enforcement Techniques for Innovative Countermeasures: This chapter provides an examination of the potential outreach efforts to improve the efficacy of the PHB and RRFB. It includes a review of existing literature, posters and print material, and enforcement efforts used in other states.
Chapter 6 – Driver and Pedestrian Survey Results: This chapter provides documentation of the intercept surveys conducted at three Michigan universities at locations with PHB, RRFB, and in-street signage. Sample questions from the surveys are included in the description of each pedestrian and driver survey. Chapter 7 – Statistical Analysis of Countermeasures: A statistical analysis was conducted by the WMU team in order to evaluate the effectiveness of the PCT and FYA. The research team utilized existing data for the cities of Detroit and Kalamazoo and Oakland County. As shown in this chapter, the most extensive data was available for Detroit. Chapter 8 – Conclusions: The final chapter provides an overview of the conclusions reached by the research team as part of each task of the multi-year study. It provides a general comparison between the findings in Michigan as compared to the case studies presented in the literature review.

10
CHAPTER 1 – LITERATURE REVIEW The research literature for the traffic control devices to improve pedestrian safety that were studied in this evaluation was reviewed to determine the potential effect on increasing driver yielding behavior and reducing pedestrian crashes. Each traffic control device is described and accompanied by a photograph of a typical installation. Many roadway characteristics are related to driver and pedestrian behavior at crosswalks. Roadway characteristics such as average daily traffic volume, speed limit, gap size, number of lanes, lane width, the presence or absence of median or refuge islands, multilane vs. one way flow, and pedestrian volumes have been demonstrated to influence motorist and pedestrian behavior at crosswalks. Data indicate that wider crosswalks are associated with more crashes than narrow crosswalks (Baltes & Chu, 2002; Petritch et. al, 2005; Zegeer, et al., 2006; Harwood et. al., 2008); crosswalks with median islands or refuge islands have fewer crashes than comparable roadways without these features (Lindley, 2008); and yielding decreases, and crashes increase with higher speed limits (Garder, 2004; Zegeer et. al, 2006). Higher traffic volumes also have been shown to be associated with more multiple threat pedestrian crashes on multilane roads (Zegeer et. al. 2006; Harwood, 2008). This literature review focuses on several innovative methods to increase yielding and to decrease crashes at crosswalks.
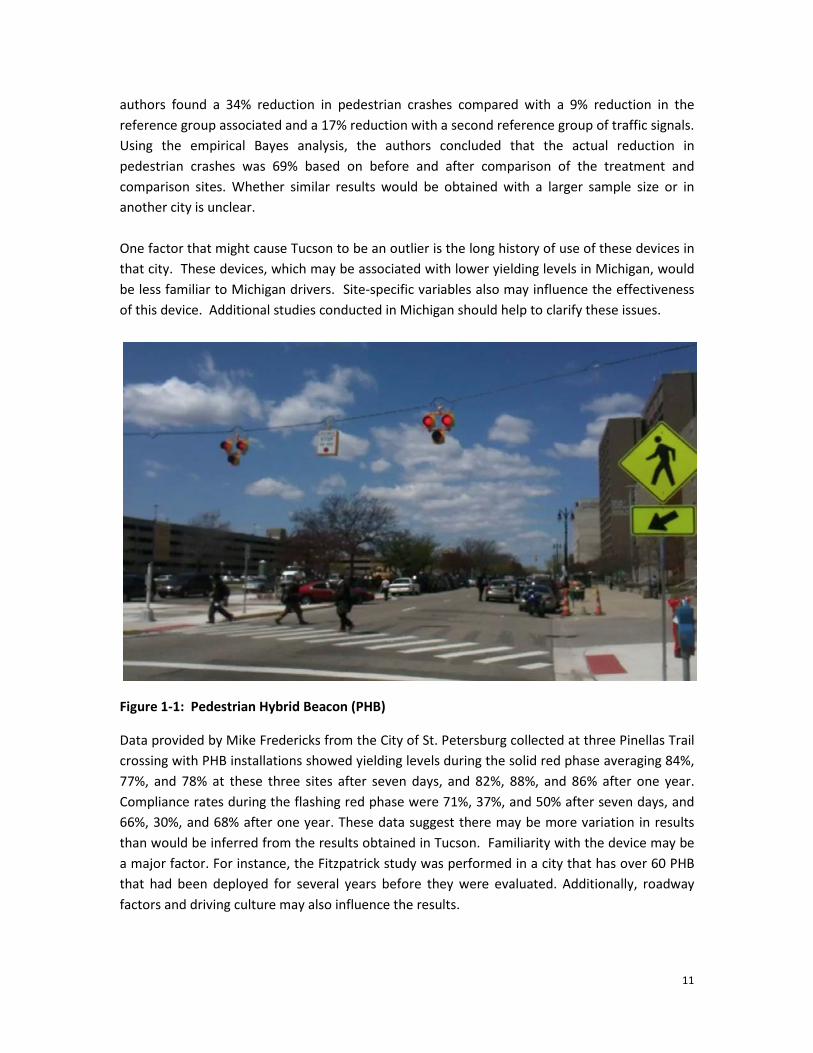
IMPROVEMENTS AT UNSIGNALIZED CROSSINGS Improvements at unsignalized crossings include unsignalized intersections and midblock locations. Pedestrian Hybrid Beacon The Pedestrian Hybrid Beacon (PHB) consists of two red lights above a single yellow light. All lights are dark when it is not in use. When activated, the yellow light begins to flash. It is followed by a solid yellow phase and then a solid red phase with both red signal heads activated. At the end of the WALK interval, the signal begins a wig-wag flashing red phase until the end of the pedestrian clearance interval. This treatment is used with the R10-23 STOP ON RED sign. The PHB is shown in Figure 1-1. This Treatment is new in the 2009 Manual on Uniform Traffic Control Devices (MUTCD). Fitzpatrick et. al. (2006) showed yielding rates above 95% on multilane streets with higher speeds and a relatively high levels of average daily traffic (ADT) after the installation of the PHB. All PHBs evaluated in their study were located in Tucson, Arizona. In a second study, the authors evaluated whether the installation of PHBs in Tucson was associated with a reduction in pedestrian crashes using the empirical Bayes method. Tucson and the State of Arizona, like Michigan, have a yield to pedestrians in the crosswalk law. The
11
authors found a 34% reduction in pedestrian crashes compared with a 9% reduction in the reference group associated and a 17% reduction with a second reference group of traffic signals. Using the empirical Bayes analysis, the authors concluded that the actual reduction in pedestrian crashes was 69% based on before and after comparison of the treatment and comparison sites. Whether similar results would be obtained with a larger sample size or in another city is unclear. One factor that might cause Tucson to be an outlier is the long history of use of these devices in that city. These devices, which may be associated with lower yielding levels in Michigan, would be less familiar to Michigan drivers. Site-specific variables also may influence the effectiveness of this device. Additional studies conducted in Michigan should help to clarify these issues.
Figure 1-1: Pedestrian Hybrid Beacon (PHB)
Data provided by Mike Fredericks from the City of St. Petersburg collected at three Pinellas Trail crossing with PHB installations showed yielding levels during the solid red phase averaging 84%, 77%, and 78% at these three sites after seven days, and 82%, 88%, and 86% after one year. Compliance rates during the flashing red phase were 71%, 37%, and 50% after seven days, and 66%, 30%, and 68% after one year. These data suggest there may be more variation in results than would be inferred from the results obtained in Tucson. Familiarity with the device may be a major factor. For instance, the Fitzpatrick study was performed in a city that has over 60 PHB that had been deployed for several years before they were evaluated. Additionally, roadway factors and driving culture may also influence the results.

12
Other studies conducted to evaluate driver comprehension of the PHB performed in Kansas, Portland, and Oregon indicated that drivers understood the dark signal (94%) and steady red signal (91%) (Godavarthy & Russell, 2010). The flashing and steady yellow signals were less well understood (76% and 67% respectively). Only 58% of respondents stated that they understood the flashing red signal. Driver comprehension survey data also were validated within the context of studies conducted to observe driver behavior at PHB locations (City of Portland Bureau of Transportation 2010; Godavarthy & Russell, 2010). For example, as shown in the Portland studies, motorists who stopped for the red phase often proceeded in platoons during the flashing red phase regardless of whether pedestrians were still crossing.
Installed Cost The cost of a PHB is considerably less than a full signal; it is between $60,000 and $100,000 for a typical signal installation, depending on whether a mast arm or span wire system is used. (The Michigan MUTCD considers the PHB to be a signal and requires signals to be overhead mounted. The span wire cost estimate would be more likely in Michigan.)
Rectangular Rapid Flashing Beacon The rectangular rapid flashing beacon (RRFB) device is a pedestrian-activated yellow light emitting diode (LED) beacon system located at the roadside directly below side-mounted pedestrian crosswalk signs. These beacons employ a “stutter flash” pattern similar to flashing lights on emergency vehicles. The left LED flashes two times in a volley each time it is energized (124 ms on and 76 ms off per flash). This is followed by the right LED, which flashes four times in a rapid volley when energized (25 ms on and 25 ms off per flash) and then has a longer flash for 200 ms. The RRFB received Interim Approval from the Federal Highway Administration (FHWA) in 2009. A RRFB installation is shown in Figure 1-2.
Figure 1-2: RRFB system on Davison Avenue in Detroit

13
The effectiveness of the RRFB was evaluated in a study conducted by the FHWA in 2010. All of the sites evaluated in this study were located on roadways with two lanes of traffic in each direction. The RRFB was not evaluated on six or eight-lane roads.
Another study (Shurbutt, Van Houten, Turner & Huitema, 2009) included an examination of whether the treatment was more effective when used as a Gateway treatment by installing beacons in the median or pedestrian refuge island in addition to the beacons that typically are mounted on the right of the roadway. The authors’ results showed significantly better yielding when beacons were mounted on the median or refuge island than when the center beacon was not used.
The additional beacons may have contributed to improved yielding in two ways. First, adding a beacon on an island helps ensure that a beacon is visible to drivers in both lanes when in the adjacent lane could screen the motorist’s view. Second, the use of multiple beacons may more clearly identify the crosswalk. Data also suggest that the RRFB system is more effective at night than during the day (Shurbutt et. al., 2009; Van Houten, Ellis, & Marmolejo, 2008).
The FHWA study also compared the efficacy of the standard incandescent overhead beacon and a standard incandescent side mounted beacon with an RRFB. Baseline yielding increased from 11% to 16% after a standard overhead beacon was installed, and increased further to 88% when the standard beacon was replaced with the RRFB. Baseline yielding increased from 0% to 15% after the installation of a standard side mounted beacon and to 87% after it was replaced with an RRFB.
In another study, an RRFB system with a direct aim capability was compared with an RRFB with a straight alignment with the road (Shurbutt et. al., 2009). The direct aim capability allowed the beacon to be aimed at drivers just beyond the dilemma zone. Preliminary evidence suggests direct aim capability may lead to better yielding. One variable that was not adequately addressed in this study was whether the presence of RRFB devices on an advance warning sign at the dilemma zone would influence device effectiveness. Ideally, such a device should be activated prior to the devices at the crosswalk so that vehicles that do not have time to safely stop have cleared the intersection before the RRFB at the crosswalk are activated.
One interesting finding was that the highest yielding levels were obtained on streets that had other traffic calming features such as narrow lanes. This suggests that operating speed may also influence the effectiveness of the system (Shurbutt et. al., 2009).
The RRFB, like the hybrid beacon, has been evaluated primarily in one city, St. Petersburg, Florida, and involved education and outreach efforts, which impacted compliance. The FHWA (2010) study also included data from one site in the Washington, D.C. area and several sites in a suburb of Chicago. In addition, authors of one study in Portland, Oregon evaluated the RRFB at two sites on a four-lane road with a median island with a posted speed of 45 mph (Ross et al. 2011). Yielding increased from 23% and 25% to 83% at both sites. Evasive conflicts also were
14
reduced from 9.8% to 0.9% at one crosswalk and from 5.8% to 0% at the second crosswalk. These findings are similar to those reported by Van Houten, Ellis and Marmolejo (2008).
Other authors also have examined the percentage of pedestrians trapped in the roadway before and after the introduction of the RRFB. Two teams that examined this type of conflict found that the introduction of an RRFB was associated with a large reduction in the percentage of pedestrians trapped in the roadway (Hunter, et. al. 2009; Van Houten, Ellis & Marmolejo, 2008).
Like the PHB, additional studies would be useful to determine the range of results that might be expected with the RRFB in a variety of locations in Michigan. In particular, these studies may help to determine the following: 1) Does the RRFB system work as well at crosswalks with three lanes in each direction, as it does on roads with two lanes in each direction? 2) Is RRFB effectiveness influenced by operating speed? 3) Is RRFB performance influenced by ADT?
Installed Cost The cost of the RRFB is approximately $20,000 for a typical installation of four solar powered units.
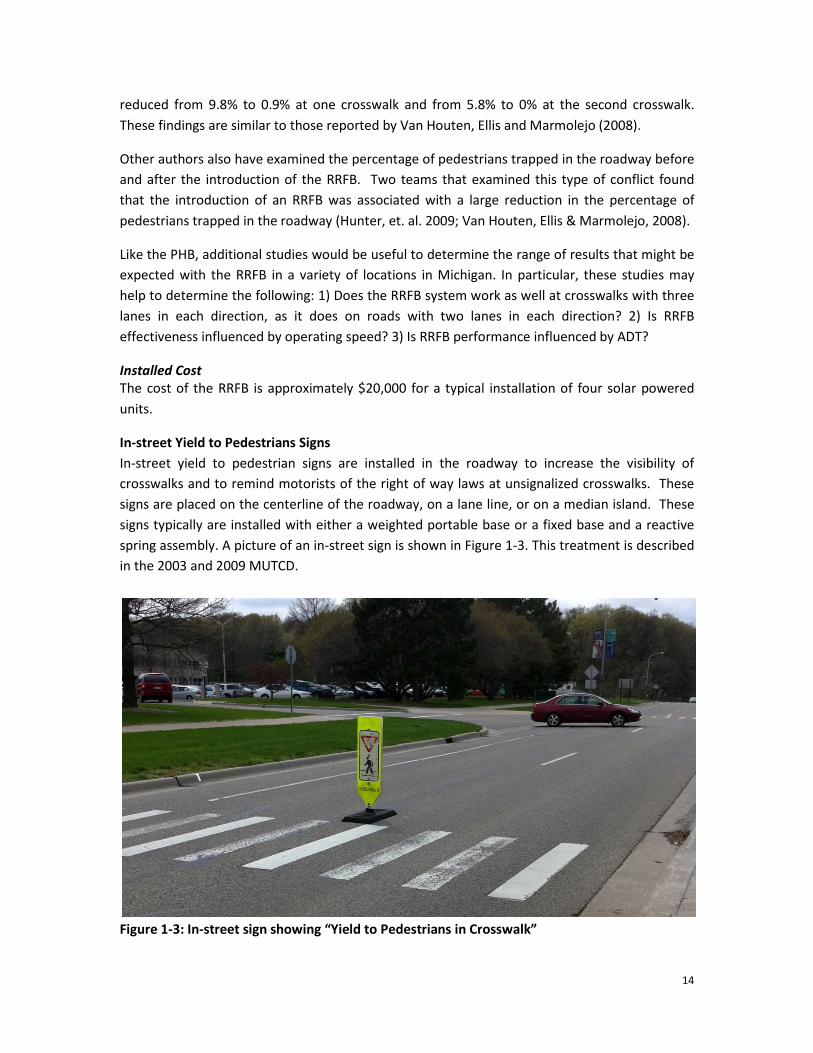
In-street Yield to Pedestrians Signs In-street yield to pedestrian signs are installed in the roadway to increase the visibility of crosswalks and to remind motorists of the right of way laws at unsignalized crosswalks. These signs are placed on the centerline of the roadway, on a lane line, or on a median island. These signs typically are installed with either a weighted portable base or a fixed base and a reactive spring assembly. A picture of an in-street sign is shown in Figure 1-3. This treatment is described in the 2003 and 2009 MUTCD.
Figure 1-3: In-street sign showing “Yield to Pedestrians in Crosswalk”
15
The in-street sign has proven to be effective when installed at the center of a two-lane road with one travel lane in each direction, and less effective on multilane roads with two or more travel lanes in each direction (Turner, Fitzpatrick, Brewer, and Park, 2006). Van Houten, Ellis & Kim, (2007) examined the effect on driver yielding behavior of placing these signs at the crosswalk, 20 feet in advance of the crosswalk, and 40 feet in advance of the crosswalk at three crosswalks on a two lane road. The data revealed that the sign produced a marked increase in yielding behavior at all three crosswalks and that installing the signs at the crosswalk line was as effective as or more effective than installing it 20 or 40 feet in advance of the crosswalk. Data also indicated that placing the signs at all three locations together was no more effective than placing the sign at the crosswalk line. These data suggest that the in-street signs are likely effective because the in-street placement is particularly visible to drivers. Available research has not indicated whether placing a series of these signs across the roadway at a crosswalk to form a Gateway treatment would increase their efficacy on multilane roads. Currently, the 2009 edition of the MUTCD specifies that in-street signs may be installed on the center-line, on a lane line, or on a median island. The manual further states that they should not be pole mounted, installed on the left-hand or right-hand side of the road, but can be placed on the right and left side of the road, if placed in the roadway. Additional research may be initiated to determine if such a Gateway treatment can increase the effectiveness of this type of sign at multilane sites with two travel lanes in each direction. The use of advance yield/stop lines also should be evaluated with this treatment, because data show that this treatment can increase yielding behavior, as well as reduce the probability of multiple threat conflicts (Van Houten, McCusker and Malenfant, 2001). Although these signs are relatively inexpensive to install, they must be removed in winter and may be costly to maintain. Tom Maleck (personal communication) has indicated that motorist yielding has increased and pedestrian crashes have decreased since these signs have been installed on the Michigan State campus in East Lansing, as well as more effectively directing pedestrians to the marked crosswalk. He also thinks that these signs provide an educational effect that persists over time. Based upon this information, the recommendation is that these signs only be installed at existing marked crosswalk locations. In Street signs can be installed with a rubber base or with a fixed base attached to the asphalt. In both cases they can be removed in winter. A reactive spring assembly that springs back upon impact prevents the sign from breaking apart if it is struck. A quick release pin is available for signs attached to a base in the asphalt. Installed Cost The cost of each double sided in street sign is about $350 to $450 for a fixed base and an additional $50 for a rubber base. Typical installation involves one sign, or three signs for a Gateway treatment (see Chapter 3).

16
Advance Yield/Stop Markings Advance yield/stop markings at multilane uncontrolled crosswalks sites have been shown to reduce the frequency of conflicts that involve a multiple threat. These markings and their associated signs encourage motorists to stop well in advance of the crosswalk and thereby help prevent screening crashes (Huybers, Van Houten, & Malenfant, 2004; Van Houten, 1988; Van Houten & Malenfant, 1992; Van Houten et. al., 2003; Van Houten, McCusker, & Malenfant, 2001). A picture of a site with advance yield markings is shown in Figure 1-4. This treatment is described in the 2009 MUTCD.
Figure 1-4: A photograph of a site with advance yield markings
Advance yield markings should be used in states with a “yield to pedestrian” law, and advance stop markings should be used in states with a “stop for pedestrians” law. Data show that this treatment is very effective at influencing drivers to yield further in advance of the crosswalk and significantly reduces the percentage of conflicts between motor vehicles and pedestrians that involve the driver or pedestrian taking evasive action to avoid a crash. Data also indicate that this treatment increases the percentage of drivers yielding to pedestrians. For instance, Van Houten & Malenfant (1992) demonstrated that the advance yield markings used with a “Yield Here To Pedestrians” sign are just as effective as the yield markings alone in increasing yielding distance and reducing conflicts. However, their study was conducted in a city where the markings paired with the signs were in use at many other locations. In this regard, the drivers may have learned the meaning of the markings through earlier association of the markings with the sign at other locations. Therefore, the recommendation would be to employ the R1-5a or R1-5c “Yield Here to Pedestrian” signs with this treatment, particularly in jurisdictions where this use of the marking is not particularly common. A strong recommendation is that these signs or markings NOT be installed directly adjacent to the crosswalk at multilane locations, because this use of the treatment would

17
encourage drivers to yield at the crosswalk line (thereby establishing a visual screen) rather than well in advance of the crosswalk. These markings should instead be placed 30 to 50 feet in advance of the crosswalk. This type of pavement marking typically costs between $200 and $300 depending on the length of the crossing.

18
IMPROVEMENTS AT SIGNALIZED CROSSINGS The next category describes pedestrian improvements installed at signalized intersections. Pedestrian Countdown Timers Pedestrian countdown timers (PCT) display the available crossing time in seconds to complement the conventional flashing DON’T WALK phase of a traffic signal cycle. The MUTCD now provides guidance on the pedestrian countdown timer and presents it as the standard signal configuration in Section 4E-07.01 of the 2009 MUTCD. A picture of a PCT is shown in Figure 1-5.
Figure 1-5: A picture of a pedestrian countdown signal
Pedestrian countdown signals were shown to be more intuitive for users in communicating the amount of available crossing time at intersections, which also may result in better levels of service for pedestrians at signalized intersections. The Florida Department of Transportation (FDOT), for example, conducted a study to determine pedestrians’ understanding of the traditional flashing DON’T WALK sign versus the pedestrian countdown timer. The study showed that the pedestrian countdown timer was more intuitive than the traditional flashing DON’T WALK display, which contributed to pedestrians making better decisions about when to begin crossing and when to wait for the next WALK signal. The study showed that, under the traditional flashing DON’T WALK signal, pedestrians were more likely to start crossing during the flashing DON’T WALK phase, run out of time while crossing, return to the starting side of the crossing, or even stop in the roadway when the light changed (Huang & Zegeer, 2000). Other studies have shown that a pedestrian countdown timer reduces crashes when compared to a traditional flashing DON’T WALK signal (Eccles, Tao, & Mangum, 2007; Markowitz, Sciotino, Fleck, & Yee, 2006).
19
The Minnesota Department of Transportation (MnDOT) measured the change in pedestrian understanding by measuring the number of pedestrians who successfully crossed an intersection before the flashing DON’T WALK phase ended. Their research showed an average 12% increase in successful pedestrian crossings with the implementation of pedestrian countdown timers (Institute of Transportation Engineers (ITE), 2007).
Additionally, the use of pedestrian countdown timers showed that pedestrians were less likely to cross near the end of a pedestrian WALK phase, if it appeared that there was insufficient time, and that pedestrians that were crossing during the flashing DON’T WALK phase increased their walking speed in an attempt to finish the crossing within the amount of time shown on the countdown signal (ITE, 2007).
A summary report of various crash reduction methods and their effectiveness was prepared by the FHWA (2007) and included pedestrian countdown timers. When countdown timers are added to existing pedestrian signals, crashes have been shown to decrease by 25% (FHWA, 2007).
Installed Cost Pedestrian countdown timers can be added to signalized intersections for approximately $800 per signal head. A typical installation involves two signal heads for each crosswalk (or two signal heads per corner).
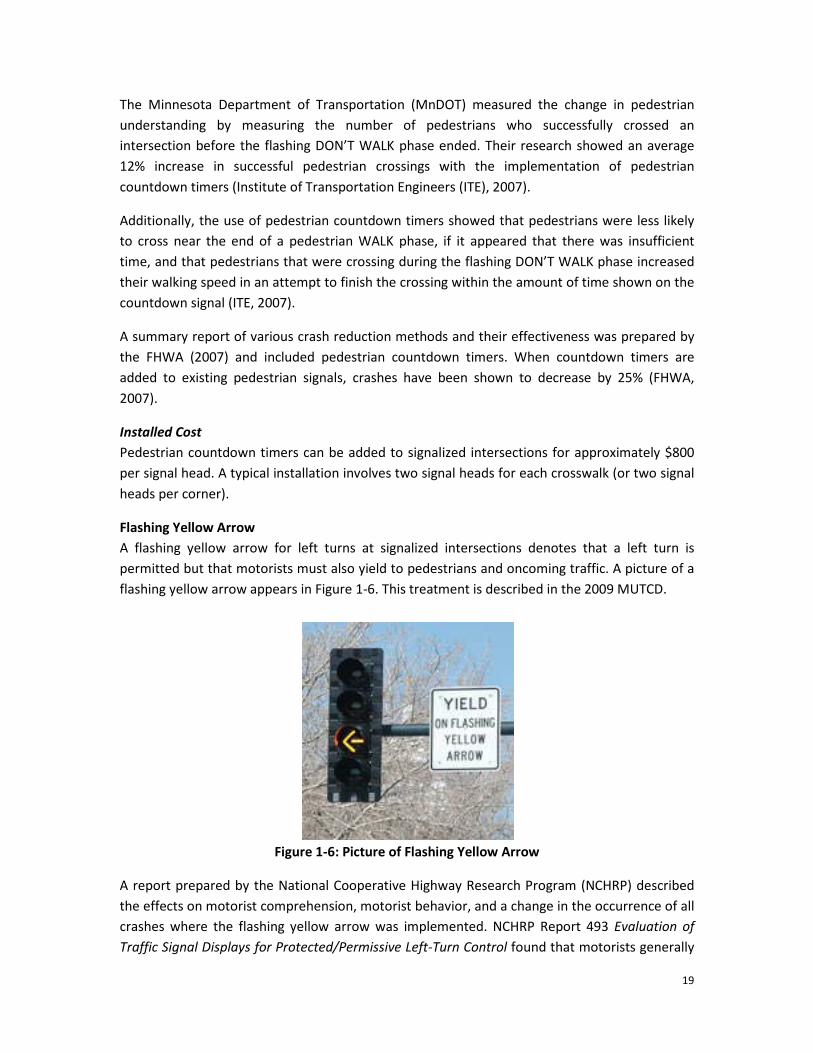
Flashing Yellow Arrow A flashing yellow arrow for left turns at signalized intersections denotes that a left turn is permitted but that motorists must also yield to pedestrians and oncoming traffic. A picture of a flashing yellow arrow appears in Figure 1-6. This treatment is described in the 2009 MUTCD.
Figure 1-6: Picture of Flashing Yellow Arrow
A report prepared by the National Cooperative Highway Research Program (NCHRP) described the effects on motorist comprehension, motorist behavior, and a change in the occurrence of all crashes where the flashing yellow arrow was implemented. NCHRP Report 493 Evaluation of Traffic Signal Displays for Protected/Permissive Left-Turn Control found that motorists generally

20
understood the meaning of a flashing yellow arrow for left turns at signalized intersections. Crash data were analyzed to determine the rate of all crashes at intersections with flashing yellow arrows and intersections with the conventional circular green indicator that denotes permitted left turns. The following four measures of effectiveness were tested:
• Average number of crashes per year • Average number of crashes per year per 100 left-turning vehicles • Average number of crashes per year per 100,000 left-turning vehicles times opposing
through traffic • Average crash rate per left-turning vehicles Each of the four measures of effectiveness showed that intersections with flashing yellow arrows had lower average crash rate than intersections with conventional circular green light permitting left-turns (FHWA, 2006). Driving simulation and field studies conducted in test environments showed that drivers correctly identified the meaning of a flashing yellow arrow for left-turns in 83% of cases. The FHWA study identified that there also was an increase in driver awareness and an increase in yielding to pedestrians and oncoming traffic in the presence of a flashing yellow arrow. However, crash rates in this study referenced all crashes, and there still is no good data at this time on the effect that the FYA has on pedestrian crashes.
Installed Cost The cost to install the FYA is minimal; signals that already contain a lens for the yellow arrow can be adjusted to flash. However, the addition of an explanatory sign can improve motorist understanding for about $200.
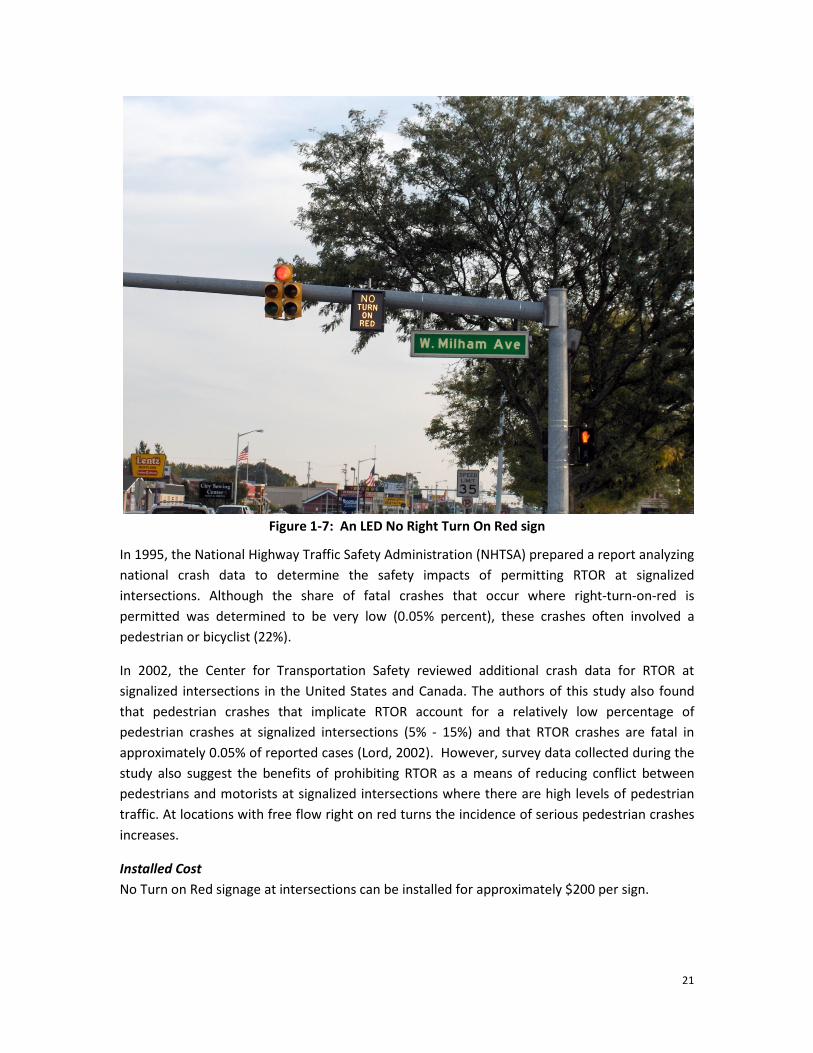
No Right Turn on Red Prohibiting right-turn-on-red (RTOR) maneuvers by motorists is a traffic law enforcement strategy that has been implemented in urban areas to reduce pedestrian crashes. Signs are posted at signalized intersections to prohibit motorists from making right turns at red lights, either during specific times, when pedestrians are present, or at all times. An illustration of a LED No Right Turn On Red sign is shown in Figure 1-7.
21
Figure 1-7: An LED No Right Turn On Red sign
In 1995, the National Highway Traffic Safety Administration (NHTSA) prepared a report analyzing national crash data to determine the safety impacts of permitting RTOR at signalized intersections. Although the share of fatal crashes that occur where right-turn-on-red is permitted was determined to be very low (0.05% percent), these crashes often involved a pedestrian or bicyclist (22%).
In 2002, the Center for Transportation Safety reviewed additional crash data for RTOR at signalized intersections in the United States and Canada. The authors of this study also found that pedestrian crashes that implicate RTOR account for a relatively low percentage of pedestrian crashes at signalized intersections (5% - 15%) and that RTOR crashes are fatal in approximately 0.05% of reported cases (Lord, 2002). However, survey data collected during the study also suggest the benefits of prohibiting RTOR as a means of reducing conflict between pedestrians and motorists at signalized intersections where there are high levels of pedestrian traffic. At locations with free flow right on red turns the incidence of serious pedestrian crashes increases.
Installed Cost No Turn on Red signage at intersections can be installed for approximately $200 per sign.

22
Leading Pedestrian Signal Phase A leading pedestrian signal begins the pedestrian WALK phase three or four seconds before beginning the green phase for automobiles. This gives pedestrians a head start to establish themselves in the crosswalk before vehicles begin turning. The objective of this treatment is to separate the time at which pedestrians and turning vehicles begin moving. When combined with a no right-turn-on-red condition, it completely separates pedestrian and right-turning motorist movements. In the absence of no right-turn-on-red, it provides complete separation from left turning vehicles, but only increases the likelihood that drivers turning right will come to a complete stop before proceeding. In the U.S., 20% of pedestrian crashes involve vehicles making turns at signalized intersections. The largest proportion of these crashes (60%) involves faster, left-turning vehicles. Van Houten, Retting, Farmer, Van Houten, & Malenfant (1999) examined the behavioral effects of installing a leading pedestrian phase. Their results indicated that the introduction of a brief exclusive pedestrian signal phase decreased conflicts involving pedestrians who started crossing at the beginning of the WALK and turning vehicles, as well as decreased the percentage of pedestrians that surrendered the right of way to motorists. Furthermore, Fayish and Gross (2010) found that the implementation of a leading pedestrian signal phase was associated with a reduction in crashes between pedestrians and turning vehicles. Installed Cost The leading pedestrian interval can be installed at signalized intersections that already contain pedestrian signals. However, if explanatory signs are needed, they can be installed at the approximate cost of $200 per sign.

23
Advance/Offset Stop Bars Advance or offset stop bars involve moving stop bars back at traffic signals beyond the standard MUTCD four-foot minimum in advance of the crosswalk. Offset stop bars increase the physical separation of vehicles and pedestrians. A picture of an advance stop bar at a signalized intersection is shown in Figure 1-8.
Figure 1-8: A picture of an advance stop bar at a traffic signal
Retting and Van Houten (2000) examined stop bars that were moved back 20 feet from the crosswalk at four intersections. This treatment decreased the percentage of drivers that stopped in the crosswalk from 25% to 7%. This treatment also added 0.7 seconds to the elapsed time between the start of the green phase and the first vehicle entering the intersection. This change could help reduce the incidence of right-angle crashes.
Zegeer and Cynecki (1986) also found that offset stop lines reduced the incidence of right-turn-on-red conflicts between vehicles and pedestrians. Moving back the bar for through and left turning vehicles from six to ten feet improved the sight distance of drivers turning right on red making a complete stop behind the stop line.
Installed Cost The cost of advance or offset stop bars is approximately $200 - $300 depending on the length of the crossing.

24
Midblock Traffic Signals Midblock traffic signals are traffic signals that are installed at locations with pedestrian generators that are not close to a traffic signal location. Typically, these signals are associated with transit stops or other high use pedestrian facilities that are separated by a high volume multilane road. A picture of a midblock traffic signal is shown in Figure 1-9.
Figure 1-9: A picture of a midblock traffic signal.
Although this treatment has the potential to greatly improve safety by completely separating vehicles and pedestrians, if the wait time is too long pedestrians increase their risk by crossing against the signal. Many variables are present that may influence how long a pedestrian will wait for the WALK indication at a traffic signal. All of these factors are associated with either perceived risk or level of physical discomfort. Some of these variables are the number of lanes, the frequency of gaps in the traffic, the width of the road, vehicle speed, whether two-way or one-way traffic needs to be crossed, absence of shade, and temperature.
For example, Van Houten, Ellis and Kim (2007) found that most pedestrians would wait for the WALK to cross at a midblock signal if speeds were high, gaps were infrequent, and many lanes had to be crossed. However, a parametric analysis of the effect of varying minimum green time revealed an inverse relationship between compliance and wait time. When wait times were 30 seconds or less (i.e., a hot button condition) almost all pedestrians waited for the WALK sign to cross. Violations, however, increased to nearly 20% for wait times of one minute and nearly 40% for wait times for two minutes. In addition, the authors found that the percentage of pedestrians trapped in the middle of the road increased with pedestrian delay, with no pedestrians trapped during the 30 second minimum green condition and 23% trapped when the wait time was up to two minutes.

25
Although the hot button treatment was very effective, it necessitates the operation of the midblock signal in isolation from other signals to provide wait times of 30 seconds or less. Another consideration is the effect of increasing signal cycles on pedestrian compliance. The effects observed at mid- block signals likely would apply at signal locations at intersections.
Installed Cost The cost of a midblock signal is similar to a new signal at an intersection and typically costs between $200,000 and $250,000 depending on the number of signal heads that are required.
Push Buttons That Confirm the Press Pedestrian call buttons that confirm they have been pressed operate like call buttons for elevators. Pedestrians often will press a push button multiple times. Confirming the button press assures the pedestrian that a call has been placed and that the signal will eventually change. A photograph of a push button that provides feedback to the pedestrian is shown in Figure 1-10.
Figure 1-10: A photograph of a push button that confirms it has been pressed
Van Houten, Ellis, Sanda, and Kim (2006) found that installing push buttons that confirmed they were activated with a sound and light was associated with a statistically significant increase in the percentage of cycles that pedestrians pressed the button over time, as well as a significant increase in the percentage of pedestrians pressing the button that then waited for the WALK sign. The button presses likely increased over time because pedestrians were learning that they

26
provided feedback. The push buttons were installed at different points in time to rule out the effects of possible confounding variables such as weather or traffic flow. Behavior only changed at each site after the new buttons were installed.
The installation of the treatment at each site also was associated with a decrease in signal violations, as well as the percentage of pedestrians trapped in the center of the road. All accessible push buttons confirm that they have been pressed. The results of this study suggest that accessible signals also confer safety benefits to sighted pedestrians.
Installed Cost Push buttons can be installed for approximately $400 - $600 for each push button that is needed. A typical installation involves two push buttons per corner. An all-way intersection would contain eight push buttons for an installed cost of $3,200 - $4,800.
COST SUMMARY
Improvements at Unsignalized Crossings Pedestrian Hybrid Beacon (PHB) $60,000 - $100,000 Rectangular Rapid Flashing Beacon (RRFB) $20,000 In-street Sign $350 - $500 (includes base) Advance Yield/Stop Markings $200 - $300 Improvements at Signalized Crossings Pedestrian Countdown Timer (PCT) $800 Flashing Yellow Arrow (FYA) Minimal (add $200 for each optional sign) No Right Turn on Red (RTOR) Signage $200 Leading Pedestrian Interval Minimal (add $200 for each optional sign) Advance/Offset Stop Bar $200 - $300 Midblock Traffic Signal $200,000 - $250,000 Push Buttons That Confirm the Press $400 - $600 per push button

27
CHAPTER 2 - EVALUATIONS OF INNOVATIVE SAFETY IMPROVEMENTS AT
EXISTING SITES
In order to evaluate innovative pedestrian traffic control devices in Michigan, the Michigan Department of Transportation (MDOT) Contracting Office Technical Representative (COTR) provided the research team with a list of sites that recently received or were in the final stage of implementing pedestrian safety improvements. The research team contacted the relevant agencies and made efforts to identify where additional devices were installed. At the end of this chapter, Figure 2-13 shows the locations in Michigan where data were collected for this study. Data Collection Methods Field evaluations were conducted at a number of locations for each installation. These treatments were implemented in the more populated, southeastern area of the state. Data were collected on the percentage of drivers yielding to pedestrians at each of the field evaluation sites. In all conditions, researchers placed one foot inside the crosswalk, maintained eye contact with each motorist in all conditions, and always followed a safe crossing protocol designed to minimize conflicts with motorists (Van Houten & Malenfant, 2004). Researchers were trained to use an operational definition of yielding behavior to maintain objectivity during data collection. This method included the definition of a dilemma zone, the space on the roadway approaching an intersection or crosswalk where it may be difficult for the driver to decide whether to proceed or brake to be safe. In order for data to be collected, motorists needed to be just beyond the dilemma zone when the pedestrian entered the crosswalk. This procedure ensured that motorists traveling at the speed limit had adequate time to yield to a pedestrian. This procedure was used to collect data at unsignalized crossings with and without in-street signs. At PHB or RRFB locations, this method was used when the button was not pressed. When the button was pressed, data were collected separately for violations of the solid red phase and the alternating flash, or “wigwag” red phase. Drivers were only scored as violating the signal during the solid red phase if they proceeded through the intersection after the WALK sign was displayed. Drivers who yielded after the onset of the solid red indication were scored as complying with PHB. Drivers were scored as violating the wigwag flashing red signal if they proceeded through the intersection after the onset of the wigwag flashing red phase and if a pedestrian was crossing the street and the pedestrian had not yet cleared the drivers travel lane. Drivers were scored as complying with the wigwag flashing red signal if they remained stopped until the pedestrian had crossed the lane in front of their vehicle. Drivers were also scored as violators if the proceeded through the intersection without stopping.

28
A walking wheel was used to measure the distance from the nearest crosswalk edge to the dilemma zones prior to the crosswalks. A cone or another form of marking was used to mark each dilemma zone. The research team employed a formula to determine whether a driver could have safely stopped at a traffic signal to determine whether the driver could have stopped for a pedestrian standing with one foot in the crosswalk. Calculating the distance beyond which a motorist can safely stop for a pedestrian is the same as calculating the distance in advance of a traffic signal at which a motorist driving the speed limit can stop if the traffic signal changes to yellow. Traffic engineers use the signal-timing formula (Institute of Transportation Engineers, 1985), which takes into account driver reaction time, safe deceleration rate, the posted speed, and the grade of the road to calculate this interval for the amber indication. This formula was used to determine the distance to the dilemma zone boundary by multiplying the time by the speed limit in feet per second. Motorists who had passed the dilemma zone (identified by a landmark or traffic cone) when a pedestrian entered the crosswalk were scored as yielding to pedestrians. Motorists who had not passed the dilemma zone boundary when the pedestrian entered the crosswalk were scored as yielding or not yielding because they had sufficient distance to safely stop given the speed limit. Once a pedestrian indicated an intention to cross the street (i.e., by standing at the curb between the crosswalk lines facing the roadway or oncoming traffic with one foot in the roadway between the crosswalk lines and the other foot on the curb), the behavior of motorists who had not yet crossed the dilemma zone boundary was scored as not yielding to pedestrians if they failed to yield. When the pedestrian began to cross, motorists in the first half of the roadway were scored for yielding. Once the pedestrian was within a half lane of the center of the road, yielding behavior of motorists in the remaining lane(s) was scored. This procedure is consistent with the obligation of motorists specified in the Uniform Vehicle Code. If a median or refuge island was installed at the crosswalk crossing the second half of the roadway was treated as a new crossing, and initiated in the same way as crossing the first half of the roadway. The observers used a clipboard and data sheets to record their observations of the researchers posing as pedestrians. Observers scored motorist yielding behavior for crossings staged by researchers, as well as any naturally occurring crossings that took place during each data collection period. These data were disaggregated for analysis purposes. Data were recorded in sets of 20 staged crossings when vehicles were present that could yield or fail to yield during each session. Each data point was based on a sample of 20 staged pedestrian crossings.

29
Inter-observer Agreement (IOA) Inter-observer agreement (IOA) is a method used to check the consistency of observations collected by different researchers. Approximately 20% of the data sheets were checked for IOA. Each event was scored by two observers, and the results were compared. The rate of IOA was calculated by dividing the number of agreements in each session by the sum of agreements and disagreements for that session. Results were multiplied by 100 to obtain a percentage. Observers stood several meters apart at a location with an unobstructed view of the crosswalk. When more than one pedestrian was crossing at a particular crosswalk, the primary observer identified the pedestrian for whom yielding behavior was to be scored. An agreement on yielding was scored only if both observers scored all vehicles the same for each pedestrian. An agreement on the occurrence of conflicts was scored if both observers scored an event as a conflict, and an agreement for a pedestrian being trapped at the centerline is scored if both observers scored the pedestrian as trapped. IOA at the PHB sites averaged 97% during baseline with a range of 89% to 100% and averaged 96% during treatment with a range of 90% to 100%. IOA for the RRFB condition averaged 95% during baseline with a range of 81% to 100% and 95% during treatment with a range of 80% to 100%. IOA for In-Street signs averaged 90% during baseline with a range of 75% to 100% and 91% during treatment with a range of 89% to 95%.
Treatments Evaluated Pedestrian Hybrid Beacon Evaluation Pedestrian hybrid beacons (PHB) were developed to increase motorist yielding to pedestrians at uncontrolled multilane crosswalks that do not warrant a traffic signal. The PHB was evaluated at ten Michigan locations. Three were located on the campus of Wayne State University (WSU): Anthony Wayne Drive, Canfield by the Detroit receiving hospitals, and Cass Street south of Palmer. The speed limit at all three locations was 25 mph. Yielding at these streets was markedly better than baseline but did not exceed 95%. The remaining locations evaluated in this study were located in Ann Arbor, Ypsilanti, West Bloomfield, and Oakland County. Figure 2-1 shows data sets obtained when the button was pressed activating the device and when the button was not pressed. Each data point represents 20 crossings. Although baseline (i.e., crossing when the PHB was not activated) yielding was higher at the Canfield site (mean of 53%) than the Anthony Wayne site (mean of 17%), the PHB were associated with high levels of yielding at both sites (95% and 90%), respectively. Baseline yielding was similar at the Cass Avenue site (10%) to the Anthony Wayne Drive site. However, yielding was considerably lower at this site when the PHB was activated (mean of 73%). WSU initiated outreach efforts to educate drivers about the PHB. Many drivers at these sites were students, faculty, or staff at

30
WSU. Fewer of the drivers on Cass likely were associated with WSU. Yielding at these sites was lower than that reported for the Tucson, AZ sites described within the literature review.
Figure 2-1: Percent of motorists yielding to pedestrians at three PHB sites at Wayne State University
0%
20%
40%
60%
80%
100%
1 2 3
% D
river
s Yie
ldin
g to
Ped
estr
ians
Data Set
PHB Cass
Without lights
With lights
0%
20%
40%
60%
80%
100%
1 2 3
% o
f Driv
ers
Yiel
ding
to P
edes
tria
ns
Data Set
PHB Anthony Wayne Drive
Without lights
With lights
0%
20%
40%
60%
80%
100%
1 2 3
% o
f Driv
ers
Yiel
ding
to P
edes
tria
ns
Data Set
PHB Canfield Wayne State
Without lights
With lights

31
Figure 2-2 shows data sets from three sites along Livernois Avenue. These sites unlikely received outreach or enforcement efforts to improve driver and pedestrian comprehension of the PHB. At all three sites, yielding increased from at or near 0% to 61% north of 7 Mile Road, 62% at Chalfonte Street, and 66% at Chippewa Avenue. The effectiveness of the PHB at these three sites is considerably lower than that reported from the Tucson studies, and somewhat lower than data reported for the WSU campus sites. Richard Nassi (personal communication), the engineer responsible for the development and evaluation of the hybrid beacon in Tucson, reported to Dr. Van Houten that outreach and enforcement activities were associated with the deployment of hybrid beacons in Tucson.
Figure 2-2: The percentage of motorists yielding to pedestrians at three PHB sites on Livernois Street
0%
20%
40%
60%
80%
100%
1 2 3
% D
river
s Yie
ldin
g to
Ped
estr
ians
Data Set
PHB Livernois and Chippewa
Without lights
With lights
0%
20%
40%
60%
80%
100%
1 2 3
% o
f Driv
ers
Yiel
ding
to
Pede
stria
ns
Data Set
PHB Livernois and Chalfonte
Without lights
With lights
0%
20%
40%
60%
80%
100%
1 2 3 % D
river
s Yie
ldin
g to
Ped
estr
ians
Data Set
PHB Livernois and 7 Mile
Without lights
With lights

32
Figure 2-3 shows data from a PHB installation in Ann Arbor on West Huron Street at Chapin Street in Ann Arbor and East Michigan Avenue at Greenbriar Street in Ypsilanti. West Huron has four lanes with a 10-foot right lane and an 11-foot left lane. Yielding on West Huron Street increased from 0% when the call button was not pressed to 75% when the device was activated. At the site on East Michigan Avenue, yielding increased from 0% when the call button was not activated to 83% when it was activated. Yielding increased further to 85% when an advance stop bar was added. It is interesting to note that outreach efforts were carried out for the Ann Arbor PHB and a press release and brochure was distributed to the surrounding communities on how to operate the PHB at the Ypsilanti site. However it is unclear how many people made contact with these efforts.
Although the addition of the advance stop bar at the Ypsilanti site had little influence on the level of yielding, it had a marked influence on the percentage of drivers that yielded further in advance of the crosswalk (see Figure 2-4). Yielding in advance of the crosswalk produced a large decrease in conflicts between motor vehicles and pedestrians because it reduces screening and the chance of a multiple threat crash.
Figure 2-3: The level of yielding at the PHB site on Huron and at the Ypsilanti site. (More data were collected at the Ypsilanti site.)
0%
20%
40%
60%
80%
100%
1 2 3 4 5 6 7 8 9 10 11 12 13 14 15 16 17 18
% D
river
s Yie
ldin
g to
Ped
estr
ians
Data Points
Ypsilanti PHB
Series1
PHB without stop bars
PHB with stop bars Baseline

33
Figure 2-4: The percentage of drivers yielding at various distances in advance the crosswalk with and without the presence of an advance stop bar
Figure 2-5 shows the results for hybrid beacon installations at a multilane roundabout in West Bloomfield. A PHB was installed on the north side of Drake Road at West Maple Road. Drake Road had two lanes entering the roundabout; the right lane was 12 feet wide, and the left lane was 14 feet wide. The speed limit on Drake road was 45 mph, but motorists typically reduced their speed to enter the roundabout. When the PHB was not activated, 23% of drivers yielded to pedestrians; when the device was activated, 86% of drivers yielded to pedestrians. The second PHB was installed on the east side of West Maple Road at Drake Road. West Maple had three lanes entering the roundabout. The left lane was 14 feet wide, the middle lane was 11 feet wide, and the right lane was 13.5 feet wide. When the device was not activated, 7% of drivers yielded to pedestrians; when the device was activated, 78% of drivers yielded to pedestrians. The lower yielding level at this location may have been influenced by greater lane width and the increased number of lanes. Although the PHB at these roundabout locations produced a marked increase in yielding, it did not approach the level obtained in Tucson.
5% 8%
17%
71%
0% 1% 1%
98%
0%
10%
20%
30%
40%
50%
60%
70%
80%
90%
100%
<10 ft 10-20 ft 20-30 ft >30 ft
% o
f Driv
ers Y
ield
ing
to P
edes
tria
ns
Ypsilanti Yielding Distances
Without stop bars
With stop bars

34
Figure 2-5: The percentage of drivers yielding right-of-way to pedestrians at two-lane and three-lane crossings when the PHB was activated and when it was not activated.
These data suggest that the efficacy of the hybrid beacon may depend in part on outreach and enforcement activity associated with the introduction of this device. This occurrence is not unusual when new technology is introduced, since the public is unfamiliar with the device and the expectations associated with it. Cultural or demographic factors also may influence the efficacy of new devices. Another variable affecting the efficacy of the device includes the
0%
20%
40%
60%
80%
100%
1 2 3
% o
f Driv
ers Y
ield
ing
to P
edes
tria
ns
Data Set
PHB on Drake Road at Maple Road
Without lights
With lights
0%
20%
40%
60%
80%
100%
1 2 3
% D
river
s Yie
ldin
g to
Ped
estr
ians
Data Set
PHB on West Maple Road at Drake Road
Without lights
With lights
35
geometric design of the location, such as the number of lanes, the speed limit, and other site characteristics.
Rectangular Rapid Flashing Beacon Evaluation Rectangular rapid flashing beacons (RRFB) were developed to increase motorist yielding on multilane roads at a lower cost than PHB. The RRFB was evaluated at eight Michigan locations, including South Lyon, Ann Arbor, and West Bloomfield.
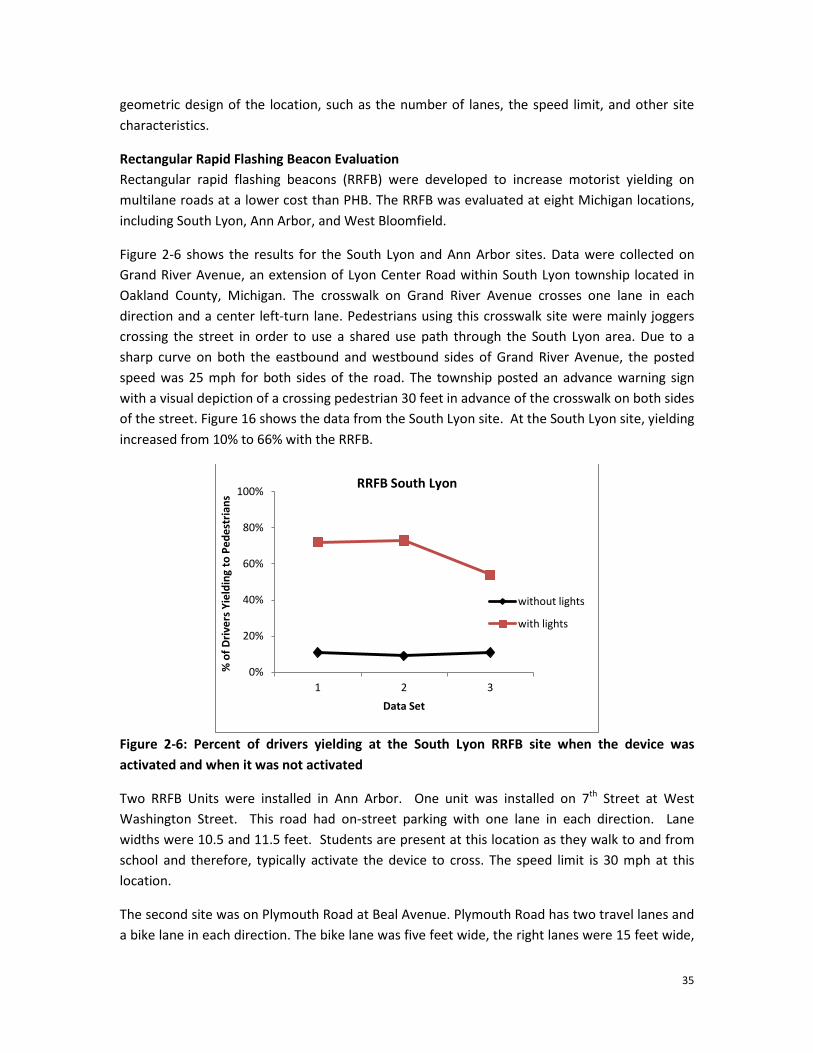
Figure 2-6 shows the results for the South Lyon and Ann Arbor sites. Data were collected on Grand River Avenue, an extension of Lyon Center Road within South Lyon township located in Oakland County, Michigan. The crosswalk on Grand River Avenue crosses one lane in each direction and a center left-turn lane. Pedestrians using this crosswalk site were mainly joggers crossing the street in order to use a shared use path through the South Lyon area. Due to a sharp curve on both the eastbound and westbound sides of Grand River Avenue, the posted speed was 25 mph for both sides of the road. The township posted an advance warning sign with a visual depiction of a crossing pedestrian 30 feet in advance of the crosswalk on both sides of the street. Figure 16 shows the data from the South Lyon site. At the South Lyon site, yielding increased from 10% to 66% with the RRFB.
Figure 2-6: Percent of drivers yielding at the South Lyon RRFB site when the device was activated and when it was not activated
Two RRFB Units were installed in Ann Arbor. One unit was installed on 7th Street at West Washington Street. This road had on-street parking with one lane in each direction. Lane widths were 10.5 and 11.5 feet. Students are present at this location as they walk to and from school and therefore, typically activate the device to cross. The speed limit is 30 mph at this location.
The second site was on Plymouth Road at Beal Avenue. Plymouth Road has two travel lanes and a bike lane in each direction. The bike lane was five feet wide, the right lanes were 15 feet wide,
0%
20%
40%
60%
80%
100%
1 2 3
% o
f Driv
ers Y
ield
ing
to P
edes
tria
ns
Data Set
RRFB South Lyon
without lights
with lights

36
and the left lanes were 11 feet wide. The speed limit is 35 mph, but it transitions from 40 mph nearby the evaluated location. A bus stop also was located next to the crosswalk, and people usually pushed the button to activate the RRFB. This site had more traffic than the crossing on 7th Street.
The results obtained at the two Ann Arbor sites are presented in Figure 2-7. The City of Ann Arbor has an ordinance which states that a motorist shall stop for pedestrians in crosswalks as opposed to the yield requirement that is state law. Additionally, the City of Ann Arbor conducted an outreach and enforcement campaign aimed at improving motorist yielding behavior. Yielding to pedestrians averaged 45% during baseline at the 7th Street at Washington site and 82% when the RRFB was activated. At the Plymouth at Beal site, yielding averaged 9% during baseline and 84% after when the RRFB was activated. The RRFB produced similar yielding at both sites even though the baseline was lower at the Plymouth site. These results are similar to those obtained in the FHWA study at the Florida sites. The outreach efforts carried out in Ann Arbor may be a significant factor in common to the Florida sites. Ann Arbor also has a stop for pedestrians law, while the rest of the state has a yield law like Florida.
Figure 2-7: The percentage yielding at the two Ann Arbor RRFB sites when the devices were activated and when they were not activated (baseline)
0%
20%
40%
60%
80%
100%
1 3 5 7 9 11 13
7th and Washington RRFB Baseline RRFB Baseline RRFB
0%
20%
40%
60%
80%
100%
1 3 5 7 9 11
Plymouth and Beal RRFB Baseline RRFB Baseline RRFB
37
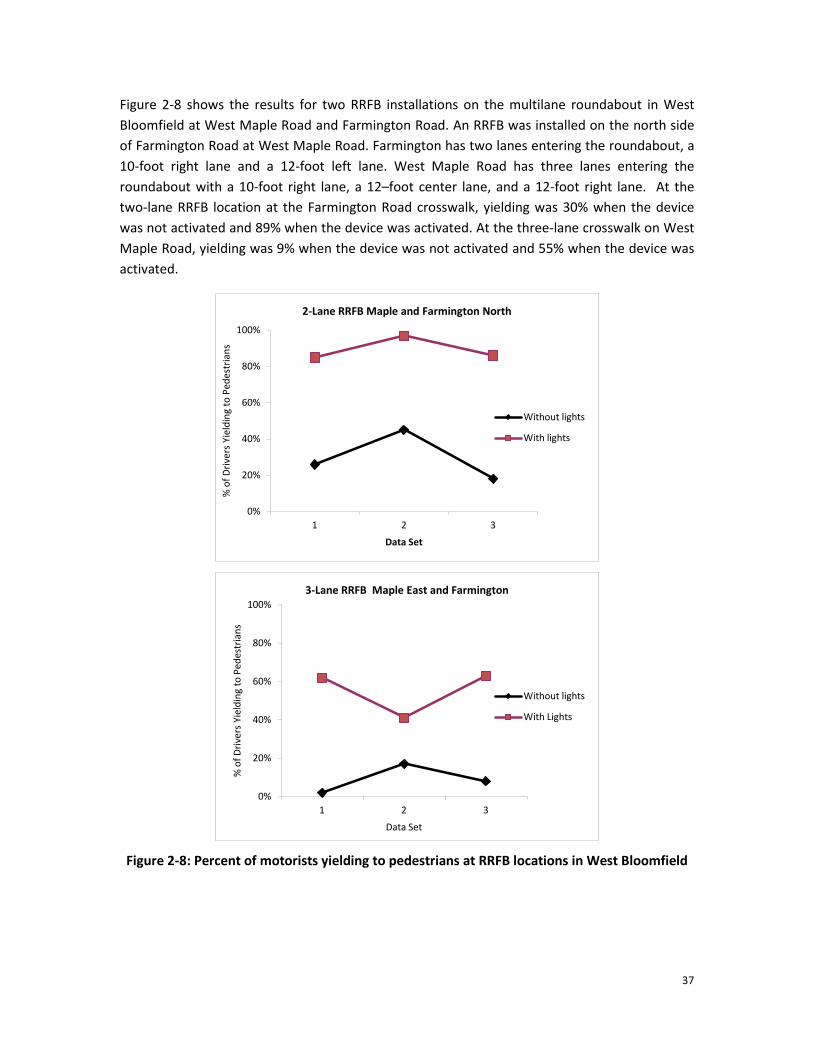
Figure 2-8 shows the results for two RRFB installations on the multilane roundabout in West Bloomfield at West Maple Road and Farmington Road. An RRFB was installed on the north side of Farmington Road at West Maple Road. Farmington has two lanes entering the roundabout, a 10-foot right lane and a 12-foot left lane. West Maple Road has three lanes entering the roundabout with a 10-foot right lane, a 12–foot center lane, and a 12-foot right lane. At the two-lane RRFB location at the Farmington Road crosswalk, yielding was 30% when the device was not activated and 89% when the device was activated. At the three-lane crosswalk on West Maple Road, yielding was 9% when the device was not activated and 55% when the device was activated.
Figure 2-8: Percent of motorists yielding to pedestrians at RRFB locations in West Bloomfield
0%
20%
40%
60%
80%
100%
1 2 3
% o
f Driv
ers
Yiel
ding
to P
edes
tria
ns
Data Set
2-Lane RRFB Maple and Farmington North
Without lights
With lights
0%
20%
40%
60%
80%
100%
1 2 3
% o
f Driv
ers
Yiel
ding
to P
edes
tria
ns
Data Set
3-Lane RRFB Maple East and Farmington
Without lights
With Lights

38
As observed in this study, the RRFB and the PHB performed similarly at the two-lane roundabout installations, but the PHB appeared to outperform the RRFB at the three-lane installations. The poorer yielding level at this site is likely the result of the increased road width and the increased number of lanes. Although the RRFB produced a marked increase in yielding at the three-lane site, it did not approach the level attained on three lane road segments in the St. Petersburg study identified in the literature review. One reason for the different results may be the absence of significant outreach and enforcement efforts to support the installation of a new traffic control device.
The RRFB also was evaluated at three sites along Davison Street in Detroit; Holmur Avenue, Lawton Street, and Linwood Avenue. The speed limit at each of these sites was 35 mph and Davison Street had three lanes in each direction. In the eastbound directions, the right lanes were 13.4 feet wide, the center lanes were 11.7 feet wide, and the left lanes were 13.9 feet wide. In the westbound direction, the left lanes were 12.9 feet wide, the center lanes were 11.2 feet wide, and the right lanes were 14 feet wide.
At all three locations, the RRFB in the median had been vandalized and were not functional. On Davison Street at Holmur Avenue, both side units appeared to have been vandalized, but were still functional. At the remaining two sites, only one side unit on the north side of the road was functional. At all three sites, no drivers yielded when the device was inactive. At the Linwood site, yielding was 0% when the device was not operated and 5% when the device was activated, and at the other two sites there was no motorist yielding to the devices that were operational. Although the largest factor contributing to the low yielding levels of RRFB at these sites was that the devices were not functional or only partially functional due to vandalism, other roadway or environmental factors, such as wider lane widths likely may also contribute to these results.
In-street Signs In-street signs originally were developed as a low cost traffic control device to increase motorist yielding on streets with one lane in each direction. In-street signs were evaluated at six locations; four were on the campus of Michigan State University (MSU) in East Lansing and two of the locations were in Farmington.
The four in-street sign locations studied at MSU were on roads with two lanes in each direction. The first crosswalk, located on Wilson Road, had two 10-foot travel lanes and a 5–foot bike lane in each direction with a 25 mph speed limit. The second crosswalk at Red Cedar Road had one 11-foot and one 12-foot lane in each direction with a median island and a 25 mph speed limit. In-street signs were installed on the lane lines between travel lanes going in the same direction on each side of the roadway.

39
Figure 2-9 shows yielding when the sign was present and when it was absent at each of these sites. At Red Cedar Road, the percentage of drivers yielding to pedestrians averaged 7% when the sign was absent and 33% when the sign was present. At Wilson Road, yielding to pedestrians increased from 8% when the sign was absent to 42% when the sign was present.
Figure 2-9: Percent of drivers yielding to pedestrians at two MSU in-street sign installations when the signs were present and when they were absent.
The third crosswalk on Clinical Center Service Road was located by the Clinical Center and had a 10-foot and 11-foot travel lane, along with a five-foot bike lane in each direction. The fourth crosswalk was on Trowbridge Road and had two 11–foot travel lanes and a 5-foot bike lane in each direction. The third and fourth sites both had a median island separating traffic in each direction and a speed limit of 30 mph.
0
20
40
60
80
100
1 2 3 4 5 6 7 8 9 10 11 12 13 14 15 16 17 18 19 20 % o
f Driv
ers Y
ield
ing
to P
edes
tria
ns
Data Set
Wilson In-Street Sign MSU
Sign Absent
Sign Present
0
20
40
60
80
100
1 2 3 4 5 6 7 8 9 10 11 12 13 14 15 16 17 18 19 20
% D
river
s Yie
ldin
g to
Ped
estr
ians
Data Set
Red Cedar In-Street Sign MSU
Sign Absent Sign Present

40
Figure 2-10 shows yielding when the in-street sign was absent and when the sign was present at each of these 30 mph multilane sites. At Trowbridge Road, the percentage of drivers yielding to pedestrians increased from 18% without the in-street sign to 46% when the in-street sign was present. At the Service Road, yielding was 12% in the absence of the sign and 53% when the sign was present. These results show that the in-street sign consistently produced an increase in yielding behavior, even at multilane crosswalks, but also confirmed previous studies that found that in-street signs do not produce consistently high levels of yielding at multilane sites (Turner, Fitzpatrick, Brewer, & Park, 2006).
Figure 2-10: Percent of drivers yielding to pedestrians at two in-street sign installations at MSU on roads with a 30 mph speed limit when the signs were present and when they were absent
0
20
40
60
80
100
1 2 3 4 5 6 7 8 9 10 11 12 13 14 15 16 17 18 19 20
% D
river
s Yie
ldin
g to
Ped
estr
ians
Data Set
Trowbridge In-Street MSU Sign Absent
Sign Present
0
20
40
60
80
100
1 2 3 4 5 6 7 8 9 10 11 12 13 14 15 16 17 18 19 20
% D
river
s Yie
ldin
g to
Ped
estr
ians
Data Set
Service Road In-Street MSU Sign Absent
Sign Present

41
The two in-street signs systems installed in Farmington were installed on Farmington Road at State Street and on Grand River Avenue at Warner Street. Farmington Road had a 12-foot through lane/left-turn lane in the northbound direction and an 11–foot through lane in the southbound direction. The speed limit on Farmington Road was 25 mph. Grand River Road had two 11–foot lanes in the westbound direction and one 12-foot lane and one left turn lane in the eastbound direction. Although the speed limit was 25 mph, eastbound traffic entered this zone from a 35 mph speed limit zone; vehicle speeds frequently exceeded 35 mph. The in-street sign was placed on the centerline at both sites.
Figure 2-11 and 2-12 show that the in-street signs increased yielding at both Farmington sites. The in-street sign produced a modest improvement in yielding at the Farmington Road site from an average of 23% to an average of 44%. On Grand River Avenue, the in-street sign produced a smaller increase in yielding from an average of 27% to an average of 43%. These effects are consistent with the modest result produced by in-street signs at crosswalks on roads with multiple lanes.
Figure 2-11: Yielding at the Farmington Road location when the in-street sign was present and when it was absent.
0%
20%
40%
60%
80%
100%
1 2 3 4 5 6 7 8 9 10 11 12 13 14 15 16 17 18 19 20 21 22 23 24
% D
river
s Yie
ldin
g to
Ped
estr
ians
Data Set
Farmington Road
Sign Absent
Sign Present
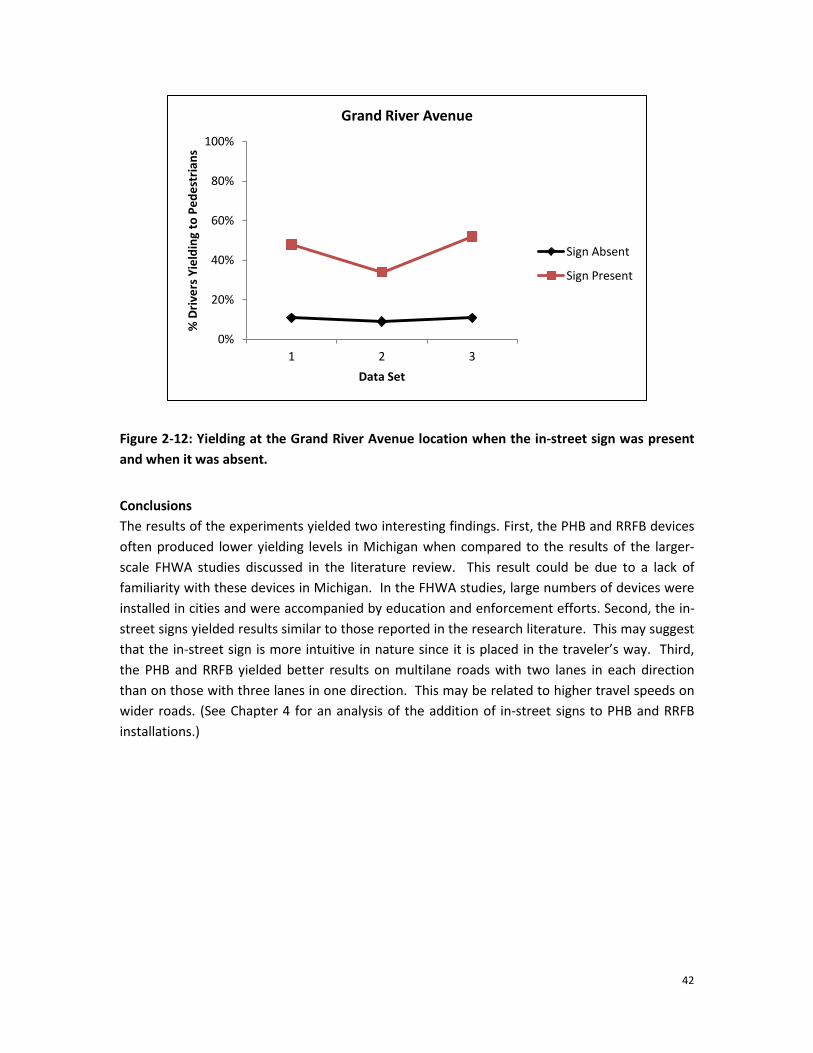
42
Figure 2-12: Yielding at the Grand River Avenue location when the in-street sign was present and when it was absent.
Conclusions The results of the experiments yielded two interesting findings. First, the PHB and RRFB devices often produced lower yielding levels in Michigan when compared to the results of the larger-scale FHWA studies discussed in the literature review. This result could be due to a lack of familiarity with these devices in Michigan. In the FHWA studies, large numbers of devices were installed in cities and were accompanied by education and enforcement efforts. Second, the in-street signs yielded results similar to those reported in the research literature. This may suggest that the in-street sign is more intuitive in nature since it is placed in the traveler’s way. Third, the PHB and RRFB yielded better results on multilane roads with two lanes in each direction than on those with three lanes in one direction. This may be related to higher travel speeds on wider roads. (See Chapter 4 for an analysis of the addition of in-street signs to PHB and RRFB installations.)
0%
20%
40%
60%
80%
100%
1 2 3
% D
river
s Yie
ldin
g to
Ped
estr
ians
Data Set
Grand River Avenue
Sign Absent
Sign Present

43
Figure 2-13 Data Collection Location Map. Not to Scale ⇑ Detroit 1. Anthony Wayne Drive one quarter block northwest of Warren Avenue at the Engineering building on the campus of Wayne State University
· PHB 2. Cass Avenue at Ferry Mall
· PHB · PHB and In-Street Sign
3. Canfield Street between Brush Street and St. Antoine Street
· PHB 4. Livernois Avenue at Chippewa Avenue
· PHB 5. Livernois Avenue at Chalfonte Street
· PHB 6. Livernois Avenue at 7 Mile Road
· PHB · In Street Sign · In Street Sign Gateway · PHB + In Street Sign · PHB + In Street Sign Gateway
Ypsilanti 7. East Michigan Avenue between Wiard Road and Greenbriar Trailer Park
· PHB West Bloomfield Township 8. Drake Road at West Maple Road, northbound
· PHB 9. West Maple Road at Drake Road, southbound
· PHB 10. West Maple Road at Farmington Road, eastbound
· RRFB
11. West Maple Road at Farmington Road, westbound · RRFB
South Lyon Township 12. Lyon Center Drive at Huron Valley Trail Crossing
· RRFB Ann Arbor 13. 7th Street at Washington Street
· RRFB 14. Plymouth Road near Beal Street
· RRFB East Lansing 15. Red Cedar Road at the Michigan State Campus Police Department
· In-Street Sign 16. Wilson Road between Red Cedar Road and Farm Lane
· In-Street Sign 17. Trowbridge Road between Harrison Road and Chestnut Road
· In-Street Sign · In-Street Sign Gateway
18. Service Road crosswalk at 138 Service Road (east of Bogue Street)
· In-Street Sign Farmington 19. Farmington Road and State Street (at the Firestone)
· In-Street Sign · In-Street Sign Gateway
20. Grand River Road at Warner Street · In-Street Sign · RRFB · In-Street Sign Gateway · RRFB + In-Street Sign Gateway

44
CHAPTER 3 - EVALUATION OF IN-STREET SIGNS USING A GATEWAY CONFIGURATION On multilane roads with two lanes in each direction, the in-street sign typically is placed on the lane line separating the two travel lanes in each direction. Currently, the MUTCD states that the signs should only be placed in the roadway and its typical placement is at the centerline or on a median island. The purpose of the first study is to compare the effects of using one Local Law Yield to Pedestrians in Crosswalk (MUTCD sign type R1-6) sign placed between the two lanes in the same direction and placing them between the two lanes in each direction plus additional signs on the right and left side of the road at each approach.
The use of three in-street signs in each direction is referred to in this study as a Gateway treatment. The Gateway treatment was studied to determine if three signs are more effective than only placing the signs between the lanes traveling in each direction. The research team hypothesizes that installing a Gateway treatment will increase the percentage of drivers yielding to pedestrians on multilane roads over the traditional method of installation. The Gateway treatment was evaluated at three multilane sites.
The first site is located in East Lansing on Trowbridge Road, located on the MSU campus. Trowbridge Road has two lanes in each direction separated by a median island. The second site is located on Farmington Road in Farmington. Farmington Road has two lanes in one direction and one lane and a left turn lane in the other direction.
The in-street signs are labeled on both sides and are composed of two pieces. The signs are affixed to a pole that is attached to a base. The signs and pole detach from the base. In the one sign condition, the sign was placed between the two lanes carrying traffic in each direction as shown on the reader’s left in Figure 3-1. In the Gateway condition, three signs were placed in each direction with one sign between the two lanes and two signs in the gutter pan on each side of the road as shown in Figure 3-1.
Inter-observer Agreement IOA at these sites averaged 97% with a range of 91% to 100% during baseline and 91% with a range of 86% to 93% during treatment.

45
Figure 3-1: The left frame shows the installation with one sign and the right frame shows the Gateway installation with three signs.
Results The results of this study for the Trowbridge Road site are presented in Figure 23. Yielding at this site averaged 25% during the baseline condition when no signs were present, 57% with one in-street sign present, and 79% with the Gateway treatment. These results indicated that the Gateway treatment was more effective than the single sign condition.
Figure 3-2: Drivers yielding to pedestrians without the sign (BL), with one sign, and with the Gateway treatment.
0%
20%
40%
60%
80%
100%
1 3 5 7 9 11 13 15 17 19 21 23 25 27 29 31 33 35 37 39 41 43 45 47 49 51 53 55 57 59
Perc
ent Y
ield
ing
Beha
vior
Sessions
Trowbridge Road BL 1 Sign Gateway 1 Sign Gateway BL 1 Sign Gateway Base 1 Sign Gateway
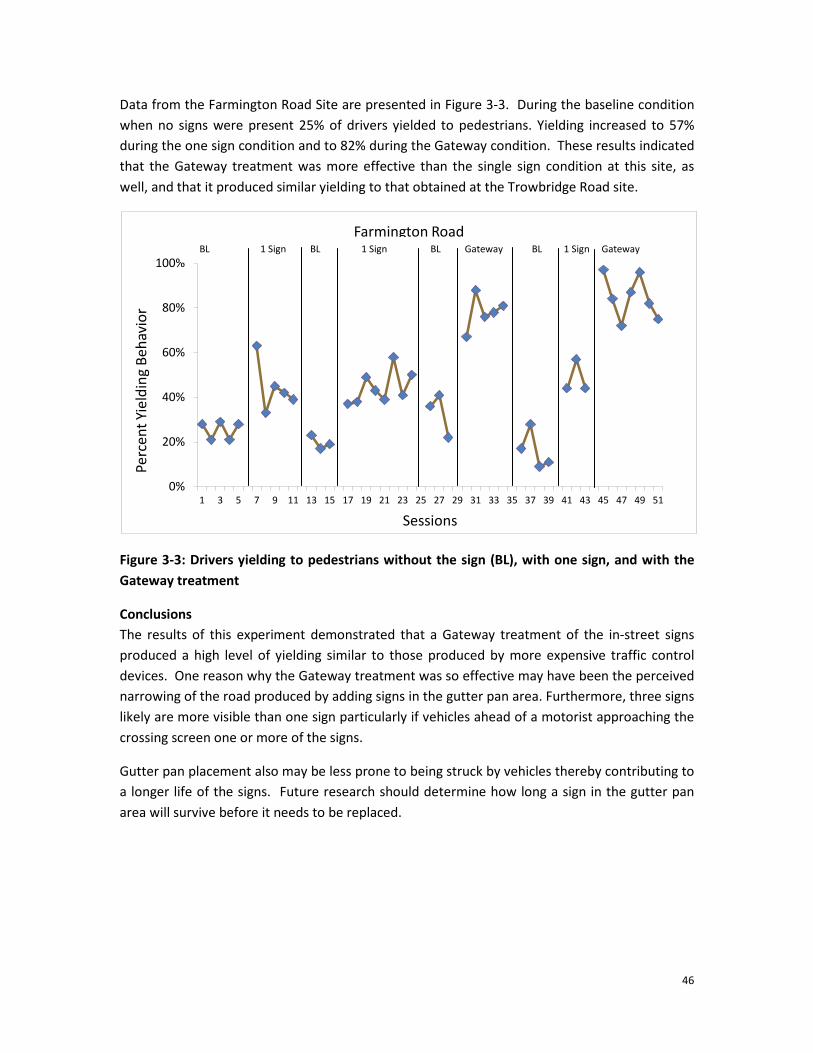
46
Data from the Farmington Road Site are presented in Figure 3-3. During the baseline condition when no signs were present 25% of drivers yielded to pedestrians. Yielding increased to 57% during the one sign condition and to 82% during the Gateway condition. These results indicated that the Gateway treatment was more effective than the single sign condition at this site, as well, and that it produced similar yielding to that obtained at the Trowbridge Road site.
Figure 3-3: Drivers yielding to pedestrians without the sign (BL), with one sign, and with the Gateway treatment
Conclusions The results of this experiment demonstrated that a Gateway treatment of the in-street signs produced a high level of yielding similar to those produced by more expensive traffic control devices. One reason why the Gateway treatment was so effective may have been the perceived narrowing of the road produced by adding signs in the gutter pan area. Furthermore, three signs likely are more visible than one sign particularly if vehicles ahead of a motorist approaching the crossing screen one or more of the signs.
Gutter pan placement also may be less prone to being struck by vehicles thereby contributing to a longer life of the signs. Future research should determine how long a sign in the gutter pan area will survive before it needs to be replaced.
0%
20%
40%
60%
80%
100%
1 3 5 7 9 11 13 15 17 19 21 23 25 27 29 31 33 35 37 39 41 43 45 47 49 51
Perc
ent Y
ield
ing
Beha
vior
Sessions
Farmington Road BL 1 Sign BL 1 Sign BL Gateway BL 1 Sign Gateway
47
CHAPTER 4 - ENHANCING THE EFFICACY OF THE PHB AND RRFB WITH
IN-STREET SIGNS
Because the isolated use of the PHB and RRFB were not as effective in applications in Michigan as they were in other parts of the country, the team, in consultation with MDOT, determined that it would be valuable to investigate low cost methods for enhancing the results of these treatments. The following two research paths were identified:
1) Combining low cost treatments like the in-street sign with the PHB and RRFB 2) Introduction of outreach and enforcement tools to educate the public on these devices.
This chapter reports the results of studies conducted to determine the efficacy of adding in-street signs to more expensive treatments (the PHB and RRFB) and compared the more intuitive Gateway treatment to the PHB and RRFB. Chapter 5 examines the possible outreach efforts to improve the efficacy of the PHB and RRFB.
COMBINING THE IN-STREET SIGN WITH THE PHB
Participants and Settings The participants of this study were motorists driving through the crosswalk and confederate pedestrians using the crosswalk. The confederate pedestrians conducting the research were two males and two females of college age. Crosswalks with PHB at two multilane road locations in Detroit were identified for this study. The first crosswalk was on Livernois Avenue at 7 Mile Road. Livernois Avenue has a posted speed limit of 30 mph with on-street parking and one 11-foot and one 12-foot lane in each direction. The second crosswalk was on Cass Road on the WSU Campus and has a push button-activated PHB. The speed limit on Cass Road is 25 mph, and has on-street parking with one 14-foot lane in each direction.
Independent Variables The independent variable in this experiment was the addition of the in-street R1-6 sign to the PHB. The in-street sign was placed on the lane line separating the two lanes traveling in the same direction on Livernois Avenue and at the centerline on Cass Road. The five experimental conditions at the Livernois Avenue site were as follows:
1. Marked crosswalk alone 2. Marked crosswalk, in-street sign 3. Marked crosswalk, PHB 4. Marked crosswalk, in-street sign and PHB 5. Marked crosswalk, Gateway treatment
At the Cass Road Site, the PHB alone was compared with the PHB plus an in-street sign.

48
Dependent Variables The researchers posing as pedestrians were trained on proper crossing protocol. This involves placing one foot in the crosswalk before the targeted vehicle reached the dilemma zone. The dilemma zone was calculated using the same formula as described in Chapter 3. This formula indicates the time that would be required for a vehicle to stop and then is converted to a distance by multiplying the time by the posted speed limit. This formula provides the distance in which a motorist should be able to safely stop in advance of the crosswalk when a pedestrian begins to cross. Yielding behavior was scored if the motorist was beyond the dilemma zone when the pedestrian initiated the crossing by placing a foot in the crosswalk. For streets with a level grade and speed limits of 25 mph, the dilemma zone was marked 104 feet from the crosswalk, and for streets with level grade and a speed limit of 30 mph, the dilemma zone was marked 141 feet from the crosswalk. The dilemma zone was measured using a measuring wheel and marked with orange flags placed in the grass along the street or by using a landmark to indicate the point at which the vehicle must be to initiate the staged pedestrian cross.
Training occurred at the site between the lead researcher and the research assistant by first explaining the dilemma zone, how to place a foot in the crosswalk in order to initiate a yield, and how to determine yielding distances while crossing. Training involved explaining crossing protocol and then completing sets of 20 unofficial crossings together until 85% inter-observer agreement was obtained.
Dependent Variable and Experimental Design The dependent variable of interest was the percentage of drivers that yielded to pedestrians in the crosswalk. Each data sheet had two columns to score yielding and non-yielding driver behavior. Yielding behavior was recorded in the same way as reported for previous experiments. The design was based on reversal design where each treatment was introduced and removed several times to confirm the effects on motorist yielding behavior. IOA at the Cass site averaged 90% with a range of 88% to 92% during baseline and 89% with a range of 85% to 93% during treatment. IOA at the Livernois site averaged 95% during baseline and 100% during the treatment conditions.

49
Results The results of the Livernois Avenue and 7 Mile Road site are presented in Figure 4-1. Yielding at this site averaged 1% during the crosswalk markings alone condition, 37% during the in-street sign condition, 62% during the PHB alone condition, 85% during the in-street sign plus PHB treatment condition, and 72% during the Gateway treatment. These results indicated that the PHB alone was more effective than the in-street sign alone, but the Gateway treatment was more effective than the PHB alone condition. The PHB plus the in-street sign was the most effective of all of the treatments producing 13% more yielding than the Gateway treatment. From a cost benefit perspective, the Gateway treatment may be the most effective treatment.
Figure 4-1: The percentage of drivers yielding to pedestrians without the sign (BL), with one sign, with the PHB alone, with one sign plus the PHB, and with the Gateway in-street sign treatment.
0%
20%
40%
60%
80%
100%
1 6 11 16 21 26 31 36 41 46 51 56
Perc
ent Y
ield
ing
Beha
vior
Sessions
PHB - Livernois and 7 Mile BL 1 Sign PHB Sign+PHB BL 1 Sign PHB Sign + PHB BL PHB Gateway PHB Gateway

50
The results for the Cass Road site are presented in Figure 4-2. Yielding at this site averaged 10% during the crosswalk markings alone condition, 84% during the PHB condition alone condition, and 94.5% during the PHB plus in-street sign condition. Even though yielding for the PHB was far better at this site than the Livernois Avenue site, the addition of the in-street sign still increased yielding to higher levels. This site was on the WSU campus where the posted speed limit was 25 mph. At the Livernois Avenue site the speed limit was 30 mph, and less yielding was obtained during both the marked crosswalk alone condition and the PHB activation conditions.
The in-street sign likely produced increased yielding because it reduced vehicle speed at this crosswalk. However, this hypothesis could not be evaluated because no speed data were collected. In addition, the number of travel lanes also was a critical factor. At the Cass Road site, there was only one travel lane in each direction, while Livernois Avenue had two travel lanes in each direction. This hypothesis is consistent with the better results obtained for both the PHB and RRFB at the two travel lane roundabout sites compared to the three travel lane roundabout sites. Future research efforts should collect speed data at these sites. The Gateway treatment alone likely may have produced high yielding at the Cass Road site. Future research should examine these treatments at a larger number of sites with many different geometric and contextual conditions.
Figure 4-2: The percentage of drivers yielding to pedestrians with no treatment (BL), with the PHB alone, and with the PHB plus an in-street sign.
0%
20%
40%
60%
80%
100%
1 2 3 4 5 6 7 8 9 10 11 12 13 14 15 16 17 18 19 20 21 22 23 24 25 26 27 28
Perc
ent Y
ield
ing
Beha
vior
Sessions
PHB Results on Cass BL PHB Sign+PHB PHB Sign + HB

51
COMBINING THE IN-STREET SIGN WITH THE RRFB
Participants and Setting Data were collected at an RRFB site located on Grand River Avenue in South Lyon Township. The crosswalk on Grand River Avenue crosses one lane in the westbound direction and one lane in the eastbound direction, as well as a turning lane in the center. Pedestrians using this crosswalk were mainly joggers crossing the street in order to use a shared use path through the South Lyon area. Due to a sharp curve on both the eastbound and westbound sides of Grand River Avenue, the posted speed was 25 mph for both sides of the road. The township posted an advance pedestrian crossing warning sign 30 feet in advance of the crosswalk on both sides of the street.
During the baseline condition, the in-street sign was not used and the pedestrians crossed without activating the RRFB. The advance yield signs installed by the township remained in place. In the RRFB alone condition, the pedestrian pressed the button to activate the RRFB, but the Gateway treatment was not installed. For the Gateway treatment, in-street signs were installed on the lane line on both sides of the turn lane immediately beyond the crosswalk. The RRFB was not activated. During the RRFB plus Gateway treatment, in-street signs were installed, and the RRFB was activated.
Dependent Variables The dependent variables were the same as those described from the earlier experiments. Each data sheet contained 20 crossings and represented a single percentage yielding point. A minimum of three data points was collected for each condition, if the average variation between data points was less than 15%. Additional data points were collected if the average variation from the first three points was greater than 15% until the data stabilized at a level with average variation over three data points was less than 15%.
Data Analysis A visual inspection of the data was performed in which the level and the variation in the data were carefully inspected (Parsonson & Baer, 1986). In addition to visual analysis, level change and slope change statistics based on a model discussed in Huitema (2011) were calculated to determine the significance of each change during the reversal design. The model also provided an overall measure of change for the entire study, p-values for each change calculated, and a standardized effect size.
In order to determine the necessity of the slope change statistic, a model selection procedure was performed in which the full regression model and reduced model were compared to reveal if the slope change was a relevant parameter within the model. The overall slope-change statistic was used to statistically determine if the introduction and withdrawal of the treatments affected the steepness of the slope of the dependent variable, whereas the overall level-change statistic was used to statistically determine if the introduction and withdrawal of the treatments changed the level of the dependent variable.

52
The level change predictions were organized before data collection began and were utilized within this analysis. The research team hypothesized that the baseline would result in the lowest percentage of yielding and that the RRFB would produce similar levels of yielding as the Gateway treatment. The combination treatment incorporating the RRFB and Gateway signs was predicted to yield the highest levels of yielding for this series. Additionally, the research team hypothesized that the transition from the combination treatment back to the baseline would result in a negative level change.
Inter-observer Agreement IOA was assessed within each condition. Each observer completed one data sheet independently. A single agreement constituted an identical yielding and non-yielding number for each of the 20 observations on the single data sheet. Once the pedestrian entered the crosswalk, an unlimited opportunity was present for non-yielding, which was scored and at most, two opportunities for yielding. Once a yield occurred, the pedestrian would cross the street. Research assistants collected at least one data point (20 observations) for each condition along with a second observer to ensure IOA reached 85%.
IOA for yielding agreements was calculated by dividing the number of total agreements by the total number of disagreements and agreements and multiplying this number by 100 to convert it to a percentage. IOA on yielding occurrence averaged 99% (range 98% to 100%) during baseline, 100% during the Gateway treatment phases, and 100% during the combination of the RRFB and Gateway treatment phases.

53
Results Figure 4-3 shows the percentage of drivers yielding during each of the conditions. During baseline when the signs were absent and the RRFB was not activated, yielding averaged 20% at this site. The RRFB alone produced an average yielding level of 69%. The Gateway treatment produced 80% yielding, and the combination of the Gateway and RRFB produced 85% yielding. These data show that the Gateway treatment produces effects that are similar to the RRFB and the Gateway and RRFB together may produce even higher yielding levels.
Figure 4-3: The percentage of drivers yielding to pedestrians during with no treatment (BL), with the RRFB alone, with the Gateway alone, and with the RRFB plus the Gateway treatment.
A model comparison for a reversal design was calculated to determine whether the slope change parameters included in the full model were necessary within the model used to analyze the reversal design (Huitema, 2011). The data analysis revealed that Model II was the appropriate model, meaning that the justification for including the overall slope change was not strong (F=1.44, p=.23). A Durbin Watson statistic was calculated before choosing the second model to make sure that the Model II assumption of independent errors was met. The calculated Durbin Watson statistic of 2.17 revealed that the residuals were uncorrelated, and the assumptions were met for the original least squares method.
The difference between baseline and RRFB alone, the Gateway treatment alone, and the Gateway plus RRFB were all significant (p=.000). No significant difference between the Gateway treatment alone and the RRFB alone is present. The final level change associated with the change for the RRFB to the Gateway treatment plus RRFB combination was associated with a significant level change, showing that combining these two treatments is significantly better than the RRFB alone (p=.011).
0%
20%
40%
60%
80%
100%
1 3 5 7 9 11 13 15 17 19 21 23 25 27 29 31 33 35 37 39 41 43 45 47 49 51 53
Perc
ent Y
ield
ing
Beha
vior
Sessions
Grand River Avenue BL RRFB BL Gateway RRFB BL Gateway BL RRFB BL RRFB+Gateway

54
Conclusions The results of this study show that the PHB and RRFB produce large increases in motorist yielding, which can be further enhanced by the presence of an in-street sign. These data also show that the use of the in-street sign as a Gateway treatment can produce effects on multilane roads that are similar to those produced by the PHB and the RRFB alone.
The Gateway treatment required no outreach efforts to motorists to improve comprehension of the device, and survey questions showed that the devices were understood by a majority of respondents. Another application for the Gateway treatment could be at crosswalks at intersections with corner turning islands. If the slip lane is a single lane, signs could be placed on the each side of the lane. A similar application could be tested at freeway off ramp locations.
The Gateway treatment offers several advantages over the PHB. First, the Gateway treatment is less expensive than the PHB. Second, it does not require special outreach efforts to educate the public on how they should respond to it. Third, it does not require a push button or pedestrian detector to activate, which makes it effective during all crossings.
However, two disadvantages of the in-street sign were found. First, it cannot be left in place during the winter at locations that receive snowfall that requires plowing, and second, the sign needs to be replaced if struck by a vehicle. Although in-street signs are subject to damage when struck, even the frequent replacement of these signs could be more cost effective than installing a PHB or RRFB. Further research is needed to determine the durability of the Gateway in-street sign treatment. Vehicles may be less likely to strike in-street signs that are placed at the edge of the roadway. The signs on the lane line are most vulnerable and may limit the application of this device on higher speed roads.

55
CHAPTER 5 - OUTREACH AND ENFORCEMENT TECHNIQUES FOR INNOVATIVE
PEDESTRIAN COUNTERMEASURES
EDUCATION AND OUTREACH
Outreach efforts can educate the public about pedestrian countermeasures in several ways. Temporary or permanent signs help improve the public’s understanding of a countermeasure when they are installed at an intersection where a countermeasure is installed. This approach has the advantages of being present when the driver needs the message, as well as a high probability of being seen. Materials mailed out or shared though other media also can help, but might not be seen at all. If the materials are seen, motorists and pedestrians may not remember this information when approaching an intersection where the countermeasure is installed.
For instance, an instructional sign was used by the city of Phoenix to prompt motorists that they should come to a complete stop facing a wigwag red phase of the hybrid beacon and may proceed when it is clear. An example of this sign is shown in Figure 5-1 and Figure 5-2. Supplementary explanation signs do not need to receive experimental approval, even if they are not in the MMUTCD, as long as the message does not conflict with the intent of the sign or considerations within the MMUTCD.
These signs should be evaluated to determine their effectiveness at increasing motorist and pedestrian understanding of the PHB. One weakness of this sign is that it does not indicate that the intersection should be clear of pedestrians in order for motorists to proceed. The addition of a pedestrian symbol may help convey this information.

56
Figure 5-1: An example of a sign to explain the flashing red indication at a PHB.
Figure 5-2: A picture of a PHB showing an overhead sign instructing drivers to stop during the solid red indication.

57
Similar signs can be designed to inform pedestrians how to respond to RRFB or pedestrian signals. The in-street sign likely will help to explain to drivers that the purpose of the RRFB and PHB is to assist pedestrians to cross the street, as well as remind drivers of their responsibility to yield when it is used in conjunction with these devices. Ideally, signs and markings that improve comprehension and the appropriate use of traffic signals should be intuitive to road users.
Other studies have demonstrated that pavement markings and signs targeting drivers and pedestrians can change their behavior at crosswalks. For example, Van Houten, Retting, Van Houten, Farmer & Malenfant (1999) showed that an animated eyes display at the start of the WALK indication increased the percentage of pedestrians looking for turning vehicles, and signs and pavement markings have been shown to change the behavior or drivers at crosswalks (Retting, Van Houten, Malenfant, Van Houten & Farmer, 1996; Abdulsattar, Tarawneh, McCoy, & Kachman, 1996).
Because the PHB and RRFB are typically deployed on multilane roads, screening crashes are a major concern when drivers yield too close to crosswalks. One type of screening crash is the multiple threat crash (Snyder, 1972). In a multiple threat crash, a motorist on a multilane road yields to a pedestrian very close to the crosswalk. Drivers in the next travel lane do not see the pedestrians as they step out from behind the yielding vehicle, and the driver collides with the pedestrian, typically at a relatively high speed. These crashes are much more likely to result in a fatal or incapacitating injury for the pedestrian. The best way to avoid screening crashes is to remove the screen.
Evidence of the seriousness of multiple threat crashes comes from a comparison of marked and unmarked crosswalks. Zegeer, Stewart, and Huang (2001) compared crashes at 1,000 marked and 1,000 matched unmarked crosswalks in 30 U.S. cities. They observed no significant difference in crashes between marked and unmarked crosswalks with one exception: marked crosswalks on multilane roads with an uncontrolled approach were associated with significantly more crashes than unmarked crosswalks, if the road had an ADT of more than 12,000 vehicles. Zegeer et al. (2001) also found that the greatest difference in pedestrian crash types between marked and unmarked crosswalks involved multiple threat crashes. As shown in these studies, ADT is one surrogate for the risk of a multiple threat crash, because the higher the ADT the greater the probability that another vehicle will be present who could pass the yielding vehicle in the next travel lane.
One enhancement to address the issue of screening crashes is the use of signs and markings that encourage motorists to yield in advance of the crosswalk. The underlying principle behind advance yield lines is that they increase the safety of pedestrians by reducing the screening effect of vehicles yielding to pedestrians too close to the crosswalk. When motorists yield in advance of the crosswalk, they enhance pedestrian safety in three ways. First, the yielding vehicle does not screen the view of motorists in the pedestrian’s next lane of travel. Second, advance stop lines reduce the likelihood that a vehicle traveling behind the yielding vehicle that attempts to pass it will fail to see the pedestrian crossing in front of the yielding vehicle. Third,

58
they reduce the chance that a driver who strikes a yielding vehicle from behind will push it into the pedestrian crossing in front of the yielding vehicle (also known as a billiard ball crash).
A number of studies have shown that advance stop or yield markings set 40 to 50 feet in advance of a crosswalk on multilane roads can reduce evasive conflicts that are a surrogate for a multiple threat crash (Van Houten, 1988; Van Houten & Malenfant, 1992; Van Houten, McCusker, Huybers, Malenfant, & Rice-Smith, 2003; Van Houten, McCusker, & Malenfant, 2001). Data from these studies also show that the percentage of drivers yielding to pedestrians showed a modest increase when advance yield markings and “Yield Here to Pedestrians” signs were introduced. Because of these findings, the research team strongly recommends that an advance stop bar be placed 50 feet in advance of any PHB installation, and advance yield markings be placed 40 to 50 feet in advance of any RRFB or Gateway treatment installed on a multilane road.
Another way to educate the public is through a mass mailing of flyers and printed and electronic coverage of programs. These are low-cost interventions; however, media outlets are most likely to cover events that attract the attention of readers and viewers. One way to attract repeated coverage is to introduce some degree of novelty or interest to the event to be covered. For instance, the mass mailing of flyers with power bills involves only the cost to produce the flyers because mailing costs are saved if the flyers are mailed with city utility bills.
Posters are most useful when there is a specific target population that needs to be addressed, such as transit users. In this case, the posters would be most effective when posted where the target population will see them, such as in bus shelters or on buses. One way to reach parents is to send a message home with their children.
ENFORCEMENT
Enforcement is another way to improve the credibility of traffic control devices. Recognized knowledge shows that poor compliance occurs for laws that are not enforced. Therefore, police enforcement is one of the most direct ways to improve credibility of pedestrian countermeasures and one of the most effective ways to educate drivers to obey traffic laws. In general, many police departments do not have a history of vigorously enforcing pedestrian safety or crosswalk legislation. A comparison of traffic violations in most jurisdictions reveals that traffic citations for drivers that fail to yield to pedestrians at crosswalks are clearly underrepresented when compared to other traffic violations.
The lack of enforcement is not due to low levels of fatalities and injuries; pedestrian fatalities represent about 13% of all traffic fatalities (2010 National Highway Traffic Safety Administration (NHTSA) Traffic Safety Facts), and the lack of enforcement is not due to high levels of driver compliance. For example, Crowley Koch, Van Houten, & Lim (2011) found that yielding at crosswalks in Southwest Michigan varied between 5% and 16%.

59
Van Houten, Malenfant & Rolider (1985) first developed the police enforcement operation, which was described as a pedestrian decoy enforcement operation, to increase the efficacy of pedestrian right of way enforcement. In 1989, Malenfant and Van Houten replicated their earlier work in three Canadian cities and reported increases in yielding in each city, as well as a reduction in pedestrian crashes. These results were later replicated in a NHTSA study in Miami Beach, Florida (Van Houten & Malenfant, 2004).
A recently completed NHTSA study carried out in Gainesville, Florida, developed and evaluated strategies to increase driver yielding to pedestrians on a citywide basis through high visibility pedestrian right of way enforcement. The program evaluation consisted of crash analyses, weekly measurement of driver yielding behavior at treated and untreated sties, an intercept survey of knowledge and attitudes, and program exposure conducted by the Police Explorers and supervised by sworn officers. The treatment consisted of high visibility crosswalk operations that included decoy pedestrian crossing, inexpensive engineering improvements (e.g., advance yield markings, and In-street State Law Yield to Pedestrians signs) and education, media outreach efforts to elements within the community, and road signs that provided feedback on the percentage of drivers yielding to pedestrians during the preceding week. The introduction of high visibility enforcement over the course of a year lead to an increase in yielding to pedestrians from a baseline level of 32% to 62% at enforcement crosswalk sites for staged crossing, and an increase from 54% to 83% for regular crosswalk users. At unenforced crosswalk locations, yielding by drivers increased from 37% to 59% for crossings by decoy pedestrians and from 50% to 73% for regular crosswalk users. These results demonstrate that a high visibility, multifaceted approach that includes engineering, education and outreach, and enforcement can change the driving culture on a citywide basis. This study is currently being replicated in Orlando, Florida.
A “triple-E” approach that includes Engineering, Education and Enforcement ensures that all three efforts are designed to be complementary through the use of a shared and consistent message. Examples of the materials for the Orlando program are provided below in Figure 30 and Figure 5-3. In these examples, the in-street sign is associated with enforcement at crosswalks, in enforcement information flyers given to drivers warned or cited for failing to yield to pedestrians, and in information shared with the community. Figure 30 shows an information flyer that accompanies a written warning ticket or a citation for failing to yield to pedestrians, and Figure 5-3 shows information flyers for the general public and a bus wrap.

60
Figure 5-3: Flyer given to motorists who were stopped for yielding to pedestrians.

61
Figure 5-4: A flyer and a bus wrap advertisement used to promote yielding to pedestrians in
crosswalks.
62
CHAPTER 6 – DRIVER AND PEDESTRIAN SURVEY RESULTS The research team conducted an intercept survey of 300 drivers and 300 pedestrians at three locations: MSU, the University of Michigan (U of M), and WSU. A total of 100 drivers and 100 pedestrians were interviewed at each site. Interviews at MSU were conducted at crosswalks with a standard in-street sign installation or a Gateway treatment and at parking areas near these crosswalks. Interviews at U of M were conducted in Ann Arbor near a crosswalk equipped with an RRFB and a PHB. Intercept surveys were conducted near the crosswalks on the university campus, at parking areas on campus, or in the downtown area near the sites. Interviews at WSU were conducted on campus near crosswalk sites equipped with a PHB or an in-street sign. At all three sites, surveyors approached drivers entering or exiting their vehicles or pedestrians near the crosswalks to conduct the surveys. Surveys were conducted from the middle of April to the end of July between the hours of 10:00 am and 5:00 pm. If participants asked the purpose of the survey, the surveyor would inform them that MDOT was conducting a study on pedestrian safety technology. The refusal rate averaged 70%. Typical reasons given for refusing to participate in the survey was that people were on their way to some other destination and did not have time to participate. If a respondent agreed to be surveyed the surveyor recorded the respondent’s sex (male or female) and estimated age (young adult, middle-aged adult, or senior). Drivers were administered the driver survey, and pedestrians were administered either the driver or pedestrian survey.
DRIVER SURVEY The driver survey respondent was shown pictures of a nearby device and asked a series of questions about the nearby device. Drivers near an RRFB site were shown a photograph of an RRFB and asked what they would do if they were approaching and saw both lights flashing. If they answered “Look for a pedestrian,” they were asked what they would do if they saw one. If the driver was near a PHB, they were shown a picture of a PHB in the dark phase and asked five questions. First, they were asked, “What do you do when you are driving and you see the following signal overhead? All the lights on the signal are dark, none are lighted.” Second, they were shown a picture of a PHB with the yellow light on and told it was flashing on and off. They were then asked what they would do in this case. Third, they were asked what they would do if the yellow light was on and not flashing. Fourth, they were shown a picture with both red lights illuminated and asked what they would do if both red lights were illuminated and not flashing. Fifth, they were shown a picture and asked what they would do if they saw the signal overhead where the two red lights are flashing back and forth (right then left then right then left, etc). If the respondent was near a standard in-street sign site they were shown a picture with two travel lanes in the same direction with an in-street sign between the lanes and asked the following questions. “What would they do if they were approaching and saw this sign in the roadway? “ If they answered, “Look for a pedestrian,” they were asked what they would do if

63
they saw one. The same procedure was followed for the Gateway treatment with the exception that they were shown a picture of half of a multilane roadway with a Gateway treatment in place.
PEDESTRIAN SURVEY The pedestrian survey respondent was shown pictures of a nearby device and asked a series of questions about the nearby device. Pedestrians near an RRFB site were shown a photograph of an RRFB and asked if they ever cross in crosswalks with this beacon. If they responded “no,” the respondent proceeded to the next question. If they responded “yes,” they were asked what they needed to do when crossing. Pedestrian survey respondents at the PHB site were shown a picture of a PHB and asked a series of questions. First, they were asked, “Do you ever cross in crosswalks with this beacon?” If they responded “yes,” they were asked what they needed to do when they cross at this site. Next, pedestrian survey respondents were shown a picture of an in-street sign and asked if they ever cross in crosswalks with this sign in the road. If they responded “yes,” they were asked what they needed to do when crossing at this site. , as well as to rate drivers yielding or stopping to let them cross when this sign is present. Results for PHB
The PHB was evaluated at the WSU and U of M locations. Driver and pedestrian surveys were conducted at both locations for comparison purposes.

64
Driver Responses The response to the question of how the driver should respond if the signal is dark is presented in for WSU in the top frame of Figure 6-1 and for the Ann Arbor (i.e., U of M) site in the lower frame of Figure 6-1. Although 21% of respondents at WSU and 6% of respondents in Ann Arbor said they would stop for pedestrians in crosswalks at PHB locations, the research team did not witness this behavior at these sites.
Figure 6-1: The top frame shows drivers responses on how they should respond when the PHB is in the dark phase at the WSU sites and the bottom frame shows responses from the Ann Arbor (U of M) sites.
38.54%
13.54% 14.58% 10.42% 12.50% 9.38%
1.04% 0.00%
20.00%
40.00%
60.00%
80.00%
Keep Going Proceed with caution
Look for pedestrians and yield if
present
Slow/Yield if peds
Stop Stop then go Unsure
PHB Dark (Wayne State)
44.68%
1.06% 5.32% 8.51% 6.38%
0.00%
34.04%
0.00%
20.00%
40.00%
60.00%
80.00%
Keep Going Proceed with caution
Look for pedestrians and yield if
present
Slow/Yield if peds
Stop Stop then go Unsure
PHB Dark (Ann Arbor)

65
The response to the question of how the driver should respond during the flashing yellow phase is presented for WSU in the top frame of Figure 6-2 and for the Ann Arbor site in the lower frame of Figure 6-2. These data show that 30% of drivers in Ann Arbor were unsure what they should do at a PHB with a flashing yellow light. Less than 2% of driver survey respondents at WSU were unsure what they would do.
Figure 6-2: The top frame shows how drivers from WSU thought they should respond to the flashing yellow PHB phase. The bottom frame shows how drivers at the Ann Arbor site thought they should respond.
15.79%
36.84% 26.32%
84.21%
5.26% 1.75% 0%
20%
40%
60%
80%
100%
Keep Going Proceed with caution
Look for pedestrians and yield if
present
Slow/Yield if peds
Stop Unsure
Yellow Light Flashing (Wayne State)
15.24% 7.62% 8.57%
39.05%
0.00%
29.52%
0%
20%
40%
60%
80%
100%
Keep Going Proceed with caution
Look for pedestrians and yield if
present
Slow/Yield if peds
Stop Unsure
Yellow Light Flashing (Ann Arbor)

66
The response to the question of how the driver should respond if the yellow became a steady yellow display is presented for WSU in the top frame of Figure 6-3 and for the Ann Arbor site in the lower frame of Figure 6-3. These data show that drivers at the WSU site were more likely to know that they should slow, stop, or yield than drivers in Ann Arbor.
Figure 6-3: The top frame shows how drivers from Wayne State thought they should respond to the solid yellow PHB phase. The bottom frame shows how drivers at the Ann Arbor site thought they should respond.
12.07% 18.97% 15.52%
86.21%
29.31%
8.62%
0%
20%
40%
60%
80%
100%
Keep Going Proceed with caution
Look for pedestrians and yield if
present
Slow/Yield if peds
Stop Unsure
PHB Solid Yellow (Wayne State)
13.21% 5.66% 6.60%
34.91%
8.49%
31.13%
0%
20%
40%
60%
80%
100%
Keep Going Proceed with caution
Look for pedestrians and yield if
present
Slow/Yield if peds
Stop Unsure
PHB Solid Yellow (Ann Arbor)

67
The response to the question of how the driver should respond if both lights are red is presented for WSU in the top frame of Figure 6-4 and for the Ann Arbor site in the lower frame of Figure 6-4.
Figure 6-4: The top frame shows how drivers from WSU thought they should respond to the solid red PHB phase. The bottom frame shows how drivers at the Ann Arbor site thought they should respond.
0.00% 1.14% 1.14% 1.14%
95.45%
1.14% 0%
20%
40%
60%
80%
100%
Keep Going Proceed with caution
Slow/Yield Stop then go Stop Unsure
Driver Responses at PHB Both lights Red (Wayne State)
0.00% 0.85% 0.85%
43.59%
27.35% 27.35%
0%
20%
40%
60%
80%
100%
Keep Going Proceed with caution
Slow/Yield Stop then go Stop Unsure
Driver Responses at PHB Both Lights Red (Ann Arbor)

68
The response to the question of how the driver should respond if both lights are flashing in a wigwag fashion is presented for WSU in the top frame of Figure 6-5 and for the Ann Arbor site in the lower frame of Figure 6-5.
Figure 6-5: The top frame shows how drivers from WSU thought they should respond to the wigwag flashing red PHB phase. The bottom frame shows how drivers at the Ann Arbor site thought they should respond.
1.85% 5.56% 7.41%
46.30%
5.56%
0%
20%
40%
60%
80%
100%
Keep Going Proceed with caution
Slow/Yield Stop Stop then go unless ped
crossing
Unsure
PHB Wig wag flashing red (Wayne State)
0.00% 1.06% 2.13%
40.43%
21.28%
35.11%
0%
20%
40%
60%
80%
100%
Keep Going Proceed with caution
Slow/Yield Stop Stop then go unless ped
crossing
Unsure
PHB Red wig wag flashing red (Ann Arbor)

69
Pedestrian Reponses Pedestrians were first asked how they were supposed to respond to the PHB. The data in the top frame of Figure 6-6 shows responses to the first questions at the WSU sites, and bottom frame shows responses at the Ann Arbor sites.
Figure 6-6: The top frame shows what pedestrians at WSU thought they should do when crossing at a PHB and the bottom frame shows what students at the Ann Arbor sites thought they should do.
4.62% 13.85%
24.62%
10.77%
33.85%
1.54% 10.77%
0%
20%
40%
60%
80%
100%
Just cross Push button and then wait
Look both ways then cross
Drivers are confused/Wait until cars pass
Wait for walking light
Cross street as quickly as possible
Confused as a pedestrian
What do you do to cross at a site with a PHB (Wayne State)
5.88% 5.88% 11.76%
0.00%
52.94%
0.00%
23.53%
0%
20%
40%
60%
80%
100%
Just cross Push button and then wait
Look both ways then cross
Drivers are confused/Wait until cars pass
Wait for walking light
Cross street as quickly as possible
Confused as a pedestrian
What do you do to cross at a site with a PHB (Ann Arbor)

70
Results for RRFB The RRFB was evaluated at the Ann Arbor (U of M) locations. Driver and pedestrian survey data is presented for the Ann Arbor sites in Figure 6-7. These data show that the common responses were “Yield to a pedestrian,” “Look for a Pedestrian,” “Slow down,” and “Stop.” These data suggest that the RRFB is somewhat intuitive.
Figure 6-7: What drivers thought they should do when the approaching an RRFB site with the yellow flashers activated.
Pedestrian data on what to do at an RRFB site are presented in Figure 6-8. The most common response to this question was to look both ways and then cross. The next most frequent response “Just cross.”
Figure 6-8: What pedestrians at the Ann Arbor Sites thought they should do when crossing at an RRFB site.
2.10%
23.08%
39.86%
1.40%
18.18% 9.09% 6.29%
0%
20%
40%
60%
80%
100%
Keep going Look for pedestrians
Yield to pedestrians
Pay extra attention
Slow down Stop Unsure
As a driver, what would you do at a site with an RRFB the yellow lights flashing? (Ann Arbor)
23.88%
46.27%
1.49% 8.96% 13.43%
1.49% 4.48% 0%
20%
40%
60%
80%
100%
Just cross Look both ways then
cross
Drivers are confused/Ped
must be aware
Don't cross until all cars
pass
See if lights are on then
cross
Stick hand out to stop
traffic
Unsure
What do you do when you want to cross at a site with an RRFB? (Ann Arbor)

71
Results for In-street sign The in-street sign was evaluated at the MSU and WSU locations. Participants could have more than one response to this question. Driver data collected at WSU are presented in Figure 6-9. The most common response was “Yield to pedestrians,” with the second most common response “Look for pedestrians.” The third and fourth most common responses were “Stop” and “Slow down.”
Figure 6-9: Responses to “As a driver, what would you do at an in-street sign?” at the WSU site. Data for the MSU survey site are presented in Figure 6-10. The results for MSU look similar to the results obtained at WSU. This finding indicates that the in-street sign is understood reasonably well. There are two reasons why this device has good comprehension. First, its instructions are direct. Second, it has been in use for a longer period of time, and motorists are reasonably familiar with it.
Figure 6-10: Responses to “As a driver, what do you do at an in-street sign?” at the MSU site.
1.14%
29.55%
79.55%
17.05% 25.00%
0%
20%
40%
60%
80%
100%
Keep going Look for pedestrians
Yield to pedestrians
Slow down Stop
As a driver, what would you do at an In-street sign? (Wayne State)
0.66%
21.05%
55.92%
11.18% 11.18%
0%
20%
40%
60%
80%
100%
Keep going Look for pedestrians
Yield to pedestrians
Slow down Stop
As a driver, what would do you do at an In-street sign? (Michigan State)?

72
Pedestrian survey responses to the question of how to cross at a site with an in-street sign for the WSU site is presented in Figure 6-11.
Figure 6-11: Responses to “What do you do to cross at a site with an in-street sign?” at the WSU site.
Data obtained from pedestrians at the MSU site are presented in Figure 6-12. These data closely resemble the data obtained at the WSU site. It is interesting that 25% of pedestrians at the WSU site and 13% of the pedestrians at the MSU site say they would wait until there are no cars present before crossing. Because drivers often yield at these sites, these pedestrians likely do not enter the crosswalk unless there is a gap in traffic. A similar percentage of pedestrians, 9% and 8%, indicate that they think drivers are confused. This is likely because all drivers do not yield at a standard in-street sign installation.
Figure 6-12: Responses to “What do you do to cross at a site with an in-street sign?” at the MSU site.
7.89%
86.84%
9.21% 25.00%
2.63% 1.32% 0%
20%
40%
60%
80%
100%
Just cross Look both ways then cross
Drivers are confused/Ped must be aware
Don't cross until all cars pass
Walk to a different
crosswalk with better
technology
Unsure
What do you do to cross at a site with an in-street sign? (Wayne State)
10.42%
66.67%
8.33% 12.50% 1.04% 1.04%
0%
20%
40%
60%
80%
100%
Just cross Look both ways then
cross
Drivers are confused/Ped must be aware
Don't cross until all cars
pass
Use caution Unsure
What do you do to cross at a site with an in-street sign? (Michigan State)

73
SUMMARY AND ANALYSIS OF SURVEY DATA The intercept survey of drivers and pedestrians at three locations, Ann Arbor, East Lansing and in Detroit near WSU, examined driver and pedestrian comprehension of the PHB, the RRFB and In Street signs. All interviews with pedestrians and drivers were conducted in close proximity to a crosswalk with an installation of the specific device that was the focus of the survey. In order to further assure that participants understood the questions, they were shown photographs of the devices that were relevant to each of the questions. PHB Data collected on driver comprehension of the PHB suggested better comprehension at the WSU sites then the Ann Arbor site. For example, during the dark phase more drivers at the WSU site understood they should continue driving and many more indicated a need to yield when the signal was in the dark phase if they saw a pedestrian in the crosswalk. Many more drivers at the Ann Arbor site were unsure of how to respond to the dark phase. In response to the flashing yellow light more drivers at the WSU site understood they should either slow or yield to a pedestrian, look for a pedestrian and yield if present or proceed with caution. A similar difference was observed to for the solid yellow phase of the beacon. The most striking difference was in response to the questions of what do when both lights were in a steady red and wig wag flashing red conditions. Almost all respondent at the WSU site said to stop and remain stopped, while at the Ann Arbor site a little over a quarter of respondent responded stop and remain stopped. At the Ann Arbor site the most common response (44%) was stop and then go. All respondents at the WSU site said stop then go unless a pedestrian was crossing while only 21% made this response at the Ann Arbor site. It is interesting to compare survey results with actual compliance data collected at these sites. Yielding results at the WSU sites (86%) was lower than the survey results which showed nearly perfect comprehension, while at the Ann Arbor site, motorist yielding behavior was 75%, which was actually higher than the survey results collected in Ann Arbor. In regard to pedestrian comprehension there were mixed results with more pedestrians responded they needed to push the button and wait at the WSU site and more pedestrians indicating wait for the WALK at the Ann Arbor site. About a quarter of pedestrians at the WSU sites responded they should look both ways before crossing while only 6% gave this response at the Ann Arbor site. It is clear from the survey results that the PHB requires greater public education as well as high visibility enforcement of pedestrian right-of-way. The survey results are supported by the relatively poor performance of the beacons at many of the Michigan sites studied. Yielding to pedestrians varied considerably with a mean of 77% and a range of 61% to 95%. While these results are considerably lower than those obtained in the FHWA study in Tucson, they are similar to those reported at other sites across the country. Because the PHB is a relatively
74
complex device with five distinct phases, it is critical that public education include signing at the site that explains how drivers are required to respond the solid red and wig wag flashing red phases. Data collected in this study also indicate that combining an in-street sign with the PHB may be another way to improve performance at these sites. High visibility pedestrian right-of-way enforcement would also be helpful in raising the percentage of drivers that yield right-of-way when this device is activated. RRFB The RRFB was only evaluated at the Ann Arbor sites because there were no installations at WSU or in East Lansing at the time the surveys were conducted. When asked how to respond when the device was activated 40% of drivers responded they should yield to pedestrians, 23% responded look for pedestrians, 18% responded slow down and 9% responded stop. Since the RRFB alerts drivers to the presence of a pedestrian in the crosswalk, it would have been interesting to determine the percentage of drivers that understood they were required to yield right-of-way to pedestrians in a crosswalk. Less education is likely required with the RRFB because it is a relatively simple warning device and does not have a variety of phases with different requirement like the PHB. Combining an in-street sign with the RRFB and high visibility enforcement of pedestrian right-of-way at RRFB sites would be the best ways to improve driver performance at these sites. The most common pedestrian response (46%) was to look both ways then cross. The second most common response was just cross, and the third most common response was see if the light are on then cross (13%). Only 4% of respondents indicated they were unsure what to do. In-Street Sign In-street signs were compared at WSU and MSU locations in East Lansing. The most common driver response at both locations was Yield to pedestrians (80% at WSU and 56% at MSU). Drivers also indicated Look for pedestrians, stop, and slow down as additional responses at both sites. When the respondent indicated that they should stop it was always in conjunction with yield to pedestrians. The most common pedestrians response at both sites to the question of what they should do when crossing at a site with an In Street sign was look both ways and then cross (87% at WSU and 67% at MSU). A somewhat greater percentage of pedestrians indicated that they should cross when they see a gap in traffic at the WSU site (25%) then at the MSU site (13%). Because the in-street sign is self-explanatory it is not likely that it requires significant public education. A more effective strategy would be to pair new sign installations with high visibility enforcement targeting drivers who fail to yield right-of-way to pedestrians. Another approach would be to employ the gateway in-street sign installation evaluated in Chapter 3.

75
CHAPTER 7 - STATISTICAL CRASH ANALYSIS OF PEDESTRIAN COUNTDOWN TIMERS AND FLASHING YELLOW ARROWS This chapter presents the findings of a statistical analysis of crashes at locations where Pedestrian Countdown Timers (PCT) and Flashing Yellow Arrows (FYA) were installed in Michigan. After meeting with MDOT, the research team conducted crash evaluations to determine the efficacy of a number of pedestrian countermeasures as per the MDOT recommendations. In most cases, crash data sets were too small to conduct crash evaluations. However, enough data was available to analyze crashes for locations in Michigan, where the PCT and FYA were installed. Crashes were analyzed for PCT locations in Detroit and Kalamazoo and the FYA in Oakland County.
DETROIT PCT ANALYSIS Statistical Background The method for analyzing the safety of roadways and intersections that is most commonly recommended by safety researchers is some version of Bayesian modeling (either full or empirical). The essential purpose of these models is to provide a sound estimate of the expected frequency of crashes (or some other outcome) for some site or sites that will be exposed to some intervention. Once this estimate is available, it can be used as a baseline against which the actual accident frequency is compared in a Before-After Intervention design. Usually the number of sites that receive the intervention of interest is relatively small, and the number of untreated comparison sites is substantial. Estimating expected frequency frequently involves two types of information. First, a model of the expected frequency of crashes is computed for each untreated site (i.e., using the number of days in the Before-Intervention period as the predictor variable in a negative binominal regression). This estimate and the associated dispersion measure are acknowledged in an evaluation of the adequacy of the estimate of the number of crashes to be expected at the end of the Before-Intervention period for each intervention site. The second type of information used to estimate the expected number of crashes for each to-be-treated site is the actual number of crashes in the pre-intervention period for the site. The two types of information are then combined in such a way that the reliability of each source of information is acknowledged in an optimal estimate. This optimal estimate is then subtracted from the actual frequency of crashes. This difference is computed for each treated site. Then, an overall effect estimate is computed by integrating the information from the individual sites; statistical inference is applied to this measure. Although the Bayesian approaches are now acknowledged as the preferred approach for typical limited data structures in safety research, the approach used in the current study is different.

76
The reason for this departure is that this study has an unusually rich database that includes ten years of monthly crash information at 449 sites in Detroit. Before and after intervention data were collected on 362 of these sites; the remaining 87 were used as control sites. The PCT intervention was initiated on different dates; information regarding these dates and sites was available and was utilized in a new comprehensive intervention model. New Analysis Since the research team had the luxury of (a) very extensive crash data for both those sites that were exposed (nT = 362) and those not exposed (nC = 87) to the PCT intervention and (b) the interventions were characterized by staggered intervention dates with both slow and rapid periods of intervention introduction, the research team was able to develop an analytic procedure that provides two different types of control: within-site and between-site. Both within- and between-site aspects of the design were acknowledged in the outcome analysis. The focus of the within-site aspect is on evaluating the intervention effect that occurs across time using an approach that relies on what the team calls an intervention penetration variable (described subsequently). The between site analysis allows the team to compare the within-site change in the intervention sites with the within-site change in control sites that were not exposed to the countdown timer intervention. In addition, the large number of sites resulted in an outcome measure (i.e., the number of crashes per month in the whole sampling unit) having a disturbance distribution that was exceeding close to normal. This distribution is shown below in the lower left panel of Figure 7-1. Exact normality, which never happens in practice, is present when all of the dots in the normal probability plot (shown in the upper left panel) are on the straight line.

77
Figure 7-1: Diagnostic Plots for Evaluating the Adequacy of the Adopted Model.
A more detailed look at the normality issue is shown below in Figure 7-2; this figure includes both the confidence interval on the normal probability estimates and the results of the Anderson-Darling test for normality.
Figure 7-2: Probability Plot and AD Test that Confirm the Assumed Normality.
The p-value for this test is 0.94, which demonstrates that no evidence is present for a departure of the disturbance distribution from normality (i.e., strong evidence for non-normality is

78
demonstrated when the p-value is ≤ 0.05). This is important because it supports the argument that the data conform to the assumptions underlying the general interrupted time-series model used for the within sites analysis (McKnight, McKean, and Huitema, 2000). A Major Distinction Between the Time-Series Intervention Model and the Empirical Bayes Approach: Dynamic Change Pattern vs. Simple Pre-Post Difference The adopted time-series regression model assumes autoregressive errors and normal disturbances. Because the within sites analysis examines the dynamics of change over a 120-month period rather than a single before-after change estimate (i.e., the typical estimator using the more traditional Empirical Bayes approach), a detailed examination of the nature of intervention effects throughout the duration of the experiment was possible. Intervention Penetration Variable The PCT intervention was introduced according to a schedule that began with a six-month baseline period during which the PCT were not introduced to any sites. Next, the PCT were gradually introduced to a small number of sites across several years, and then, in the last two years of the study were two different periods were included during which several PCT were introduced to many sites simultaneously. This complex and varied intervention introduction schedule can be captured by using what is called the intervention penetration variable. It is a measure that indicates the extent to which the intervention penetrates the sampling unit (i.e., the set of 362 treatment sites that eventually received the intervention) across the 120 months of the study. The penetration variable ranges from zero through one. Zero indicates months during which no interventions are applied to any of the treatment sites; one indicates the month at which all treatment sites received the intervention. The penetration function for the installation of PCT is shown Figure 7-3.
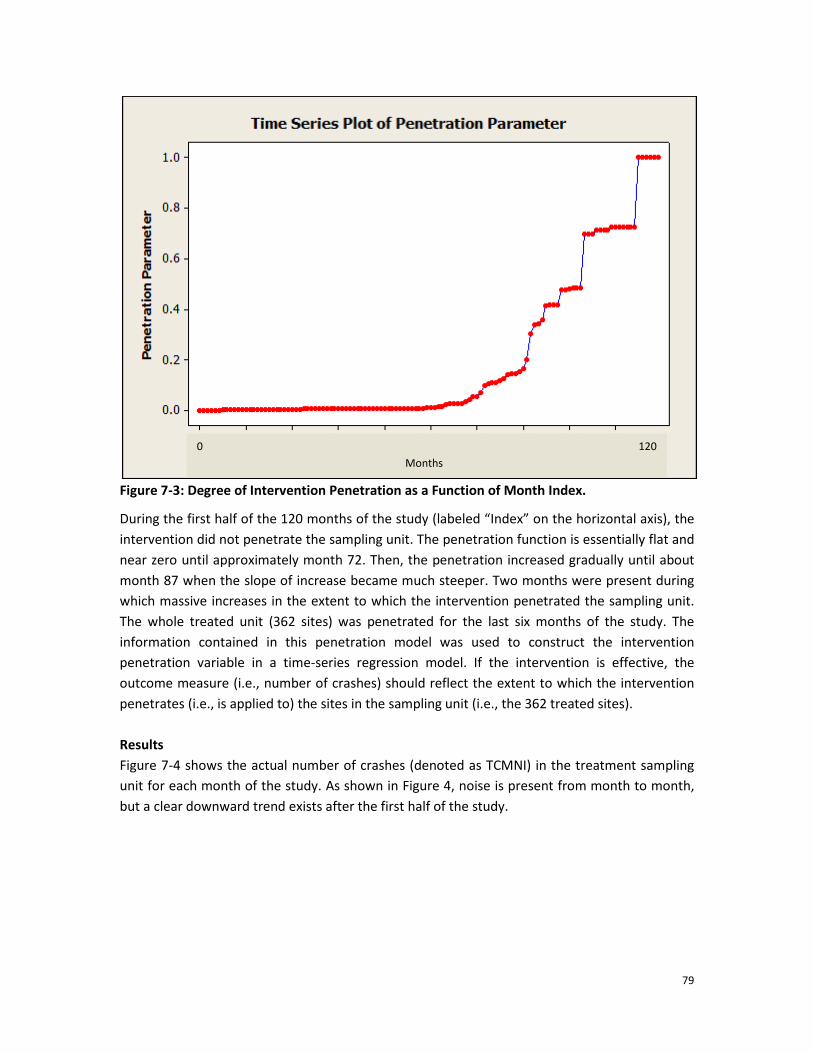
79
Figure 7-3: Degree of Intervention Penetration as a Function of Month Index.
During the first half of the 120 months of the study (labeled “Index” on the horizontal axis), the intervention did not penetrate the sampling unit. The penetration function is essentially flat and near zero until approximately month 72. Then, the penetration increased gradually until about month 87 when the slope of increase became much steeper. Two months were present during which massive increases in the extent to which the intervention penetrated the sampling unit. The whole treated unit (362 sites) was penetrated for the last six months of the study. The information contained in this penetration model was used to construct the intervention penetration variable in a time-series regression model. If the intervention is effective, the outcome measure (i.e., number of crashes) should reflect the extent to which the intervention penetrates (i.e., is applied to) the sites in the sampling unit (i.e., the 362 treated sites). Results Figure 7-4 shows the actual number of crashes (denoted as TCMNI) in the treatment sampling unit for each month of the study. As shown in Figure 4, noise is present from month to month, but a clear downward trend exists after the first half of the study.
0 120 Months
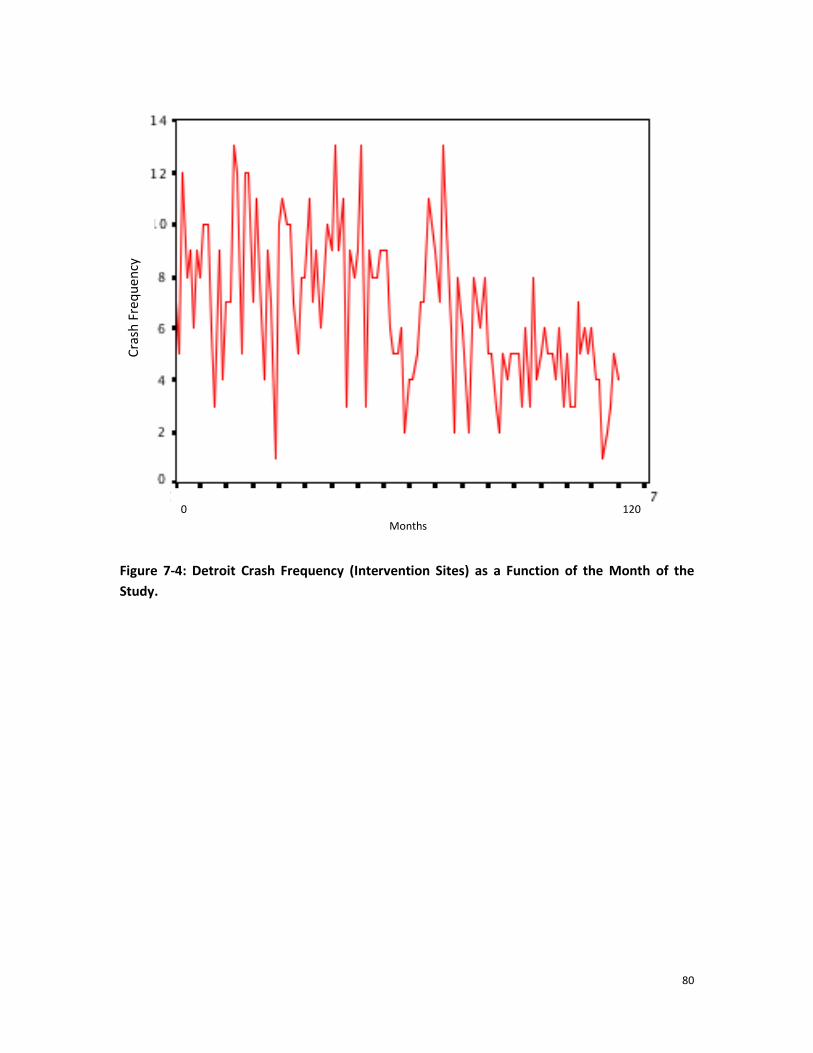
80
Month
Figure 7-4: Detroit Crash Frequency (Intervention Sites) as a Function of the Month of the Study.
Cras
h Fr
eque
ncy
0 120 Months
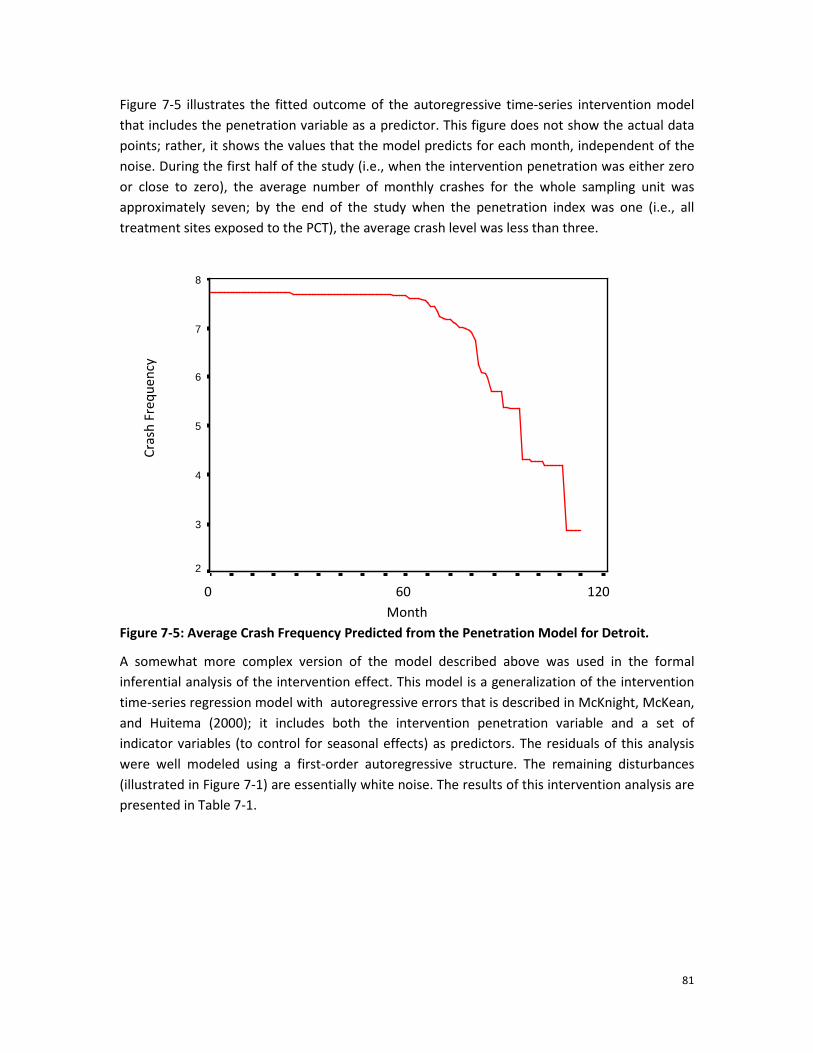
81
Figure 7-5 illustrates the fitted outcome of the autoregressive time-series intervention model that includes the penetration variable as a predictor. This figure does not show the actual data points; rather, it shows the values that the model predicts for each month, independent of the noise. During the first half of the study (i.e., when the intervention penetration was either zero or close to zero), the average number of monthly crashes for the whole sampling unit was approximately seven; by the end of the study when the penetration index was one (i.e., all treatment sites exposed to the PCT), the average crash level was less than three.
0 60 120
Month Figure 7-5: Average Crash Frequency Predicted from the Penetration Model for Detroit.
A somewhat more complex version of the model described above was used in the formal inferential analysis of the intervention effect. This model is a generalization of the intervention time-series regression model with autoregressive errors that is described in McKnight, McKean, and Huitema (2000); it includes both the intervention penetration variable and a set of indicator variables (to control for seasonal effects) as predictors. The residuals of this analysis were well modeled using a first-order autoregressive structure. The remaining disturbances (illustrated in Figure 7-1) are essentially white noise. The results of this intervention analysis are presented in Table 7-1.
8
7
6
5
4
3
2
Cras
h Fr
eque
ncy

82
Table 7-1: Full Intervention Effect Estimates for PCT in Detroit.
Descriptive Outcome Measure Estimate Initial Level of Crashes 6.96 Change in Level Associated with Intervention (i.e., the level change coef.)
-4.88 (t = -5.45; p = .0000003)
Level at End of Study 2.08 Percentage reduction in crashes 70% Standardized Within Site Effect Size 2.03 (Large) Amount of Total Variation Explained by the Intervention (that is not explained by seasonality and autocorrelation)
17% (Large)
The initial (baseline) level is estimated to be about seven crashes per month. The intervention effect coefficient associated with the ultimate level change is -4.88. This means that the crash level declined by almost five points by the end of the study. The product of this level change coefficient multiplied by a penetration variable score can be used to provide an estimate of the number of crashes associated with any specified degree of intervention penetration. When the intervention penetrates all sites in the sampling unit of 362 sites, the value of the penetration index is 1.0 and the regression coefficient (i.e., -4.88) is equal to the ultimate level-change statistic; it is interpreted as the average change in crashes that has occurred between the baseline level and the ultimate level at the end of the study. Correspondingly, the decrease predicted when only half of the sites have a PCT is 0.50 x -4.88 = -2.44. Three alternative outcome metrics (in addition to the level-change statistic) also are shown in Table 1. All three yield values (i.e., percentage reduction from baseline, standardized within sites effect size, and variation explained by treatment) that are considered “large” using conventional statistical rules of thumb (e.g., Cohen, 1988).

83
An empirical display of the relationship between the actual crash frequency and the penetration variable is presented in Figure 7-6. As shown in the figure, intermediate degrees of the intervention (e.g., penetration scores of, say, 0.5 or 0.7) are associated with smaller reductions in crashes than when the full intervention (i.e., a penetration score of 1.0) is applied. This valuable information is not provided in a conventional before-after design and analysis.
Figure 7-6: Scatterplot of Crashes on Penetration of the PCT Intervention.
Between Group Comparisons Although the major interest in the study is on the data from the PCT treated sites, another valuable interest was to evaluate change in similar sites that have not been exposed to the PCT intervention. Because time-series designs are susceptible to the effects of confounding events that occur concommitantly with the intervention, the availability of such controls can provide a basis of comparison that helps rule out alternative explanations for the apparent effect. This section provides results based on comparisons between the PCT treated sites and non-treated (control) sites. Potential Confounding. The -4.88 point change from the baseline level of crashes is a meaningful intervention effect estimate as long as no confounding events are likely to have occurred during the same time interval that the PCT were introduced. Many events other than the intervention occurred during the study, but the concern is whether these events are correlated with the frequency of crashes.

84
If they are correlated, they may be confounders. One potential confounding variable is traffic volume. This is a concern because if there is a decrease in volume that parallels the observed decrease in crashes in both the treated and control sites, the relationship may be causal. Hence an attempt was made to obtain local and general traffic volume measures. Local data were quite sparse, but the research team was supplied with estimated Detroit traffic volume data for a 10-year period. Although complete annual data were not available for all years of the study, the team developed a model of likely annual volume from the incomplete traffic data provided by the Southeast Michigan Council of Governments (SEMCOG) (2012). Estimated traffic volume in Detroit decreased over the ten-year period. The decrease from year to year was not linear. Rather, it was modeled as a quadratic function of time with a small curvature component. This function then was used to estimate total Detroit traffic volume for each year and month of the study. The annual estimates are shown in Table 2. Once these estimates were calculated, the team was able to correlate estimated traffic volume with observed crash frequency.
Table 7-2: Estimated Detroit Traffic Volume for Years 2001-2010.
Year Estimated Traffic Volume (Millions)
2001 18.00 2002 17.89 2003 17.77 2004 17.69 2005 17.59 2006 17.50 2007 17.41 2008 17.32 2009 17.24 2010 17.16
The correlation of crash frequency with general Detroit traffic volume is essentially zero (-0.03, p = 0.72) for the control sites and 0.50 (p < 0.001) for the PCT intervention sites. A test on the difference between these two correlations yields a p-value < 0.001. An inspection of the two scatterplots associated with these correlations (see Figures 7-7 and 7-8) reveals an obvious difference that confirms the test results.

85
Figure 7-7: Scatterplot of the Relationship Between Traffic Volume and Crash Frequency for Control sites. (Sampling unit = month)
Figure 7-8: Scatterplot of the Relationship Between Traffic Volume and Crash Frequency for Treatment (PCT) Sites. (Sampling unit = month)
(Millions)
(Millions)

86
The lack of correlation for the untreated (i.e., control) sites is of great interest because the data suggests that the drop in total Detroit traffic does not cause a decrease in the crash measure used in this study. In contrast, the substantial correlation between traffic volume and crashes in the PCT treated sites does not mean that traffic volume causes crashes. Rather, the traffic volume measure used here is simply a marker for the introduction of the PCT. Since the penetration of the PCT is an increasing function of time, and time is correlated with traffic volume, traffic volume is an indirect way to determine the extent to which the intervention has penetrated the sampling unit. This claim that the volume measure is a surrogate for the penetration measure is based on the almost perfect monotonic decreasing relationship (rSpearman = -0.98) between these two measures. This relationship is illustrated in Figure 7-9.
Figure 7-9: Illustration of Monotonic Decreasing Relationship between PCT Intervention Penetration and Detroit Traffic Volume.
Because the volume measure is an almost perfect proxy for intervention penetration in the treated sites, one interpretation is that the difference between the volume-crash correlations in the treated and untreated sites can be interpreted as evidence of an intervention effect. Consequently, the test result on this difference (reported above) is strong evidence of an intervention effect. An approach that requires less circuitious reasoning, however, is more desirable. A more direct approach is described herein.
(Millions)

87
Between Unit Comparison: Intervention Unit vs. Control Unit Outcomes Although the outcome information already presented \is strong evidence of an intervention effect, a more straightforward approach is to compare the intervention outcome results from the PCT Treated sites with the outcome results on the control sites that were measured over the same time interval and in the same general locations as were the treated sites. The Control (i.e., no PCT) sampling unit consisted of 87 sites. The analysis of this unit (using the same intervention model as was applied to the intervention data) yields a nonsignificant (p > 0.10) level change estimate. However, a comparison of test conclusions from the intervention and control units (i.e., statistically significant vs. not significant) is not a valid approach for testing the difference in results found for these two units. What is called for is a method of testing the significance of the difference between the p-value from the intervention unit and the p-value from the control unit. Hence, a test developed for this purpose (Huitema, 2011) was applied. This test results in an obtained z-statistic that is associated with p < 0.01. The research team concluded that the evidence supporting a change in the intervention unit is significantly stronger than the evidence for change in the control unit. This test renders implausible the potential argument that the reduction in crashes in the PCT sites is explainable by the reduction in traffic volume that also affects the control sites. Detroit PCT Conclusions The intervention penetration model developed for this study indicates that a strong effect of the PCT intervention is present and that the size of this effect is a decreasing function of the extent to which the intervention has penetrated the sampling unit of 362 sites. As the number of PCT sites in this unit increases, the overall trend for crashes tends to decrease. When the intervention is fully introduced (i.e., the PCT penetration is 100 percent), the effect is a reduction in the average number of crashes from about seven per month to a little over two per month, resulting in a 70% reduction in all crashes. This change cannot plausibly be attributed to change in some unknown nonintervention variable that affects both PCT sites and control sites. In addition, the common problem of regression effects that plague many versions of Before-After studies are not an issue in this long term time-series design because such effects are a decreasing function of time. That is, regression effects typically last for only a few time periods; they disappear in long time-series designs such as this one in which outcome measurements are obtained from the total number of sites at each of many time points. No general drop-off in crash frequency was found throughout a baseline interval of over five years; only when the PCT were introduced in large numbers was a consistent crash reduction observed. Because the magnitude of the crash reduction was shown to be a function of the extent to which the timers were introduced, the evidence for an intervention effect is strong.

88
Kalamazoo PCT Analysis
The analysis of the Kalamazoo PCT data differs from that used for the Detroit data in three ways. First, because the number of sites is much smaller in Kalamazoo than in Detroit, the form of the outcome distribution differs greatly from normality. This affects the development of an appropriate analytic model for the data. Second, the errors of the model are not autocorrelated, as they were in the Detroit analysis. Third, there were no control sites to use as a comparison for the intervention sites. Consequently, these differences in the nature of the data led to the need for alternative analytic approaches that are appropriate for non-normal distributions, independent errors, and an absence of a control group.
Another difference between the Detroit and Kalamazoo installations is the confounding of the installation of accessible signals with PCTs in Kalamazoo. Accessible signals can help reduce violations at signalized crosswalks (Van Houten, Ellis, Sanda & Kim, 2006), which could possibly lead to a larger reduction in crashes in Kalamazoo rather than the smaller reduction found. However it is likely that the smaller reduction in crashes observed in Kalamazoo is related to the smaller sample size and the lower level of baseline crashes in Kalamazoo (0.51 vs. 6.98). It is likely that any crash reductions would be somewhat dependent upon the initial level of crashes. However, this possibility has not been extensively studied.
However, one key aspect was present that was common to the analyses used in both cites. The construction and use of the intervention penetration variable followed the same approach described previously. Nonetheless, because the timers were introduced on a schedule that was unique to Kalamazoo, the values of the penetration coefficient associated with each month differed from those used for the Detroit analysis. Penetration Function A plot of the penetration function can be seen in Figure 7-10. As shown, the PCT were introduced at a fairly high rate after the first three years.

89
Month
Figure 7-10: PCT Intervention Penetration Function for Kalamazoo.
Ordered Discrete Outcome Variable A modification of the type of regression model used for the Detroit analysis was required in order to adequately estimate the parameters of the intervention model. Unlike the Detroit outcome that was well modeled as a continuous function using a time-series regression model, the Kalamazoo outcome variable was treated as an ordered discrete variable. The discrete (rather than continuous) nature of the outcome can be seen in Figure 7-11. As shown in the figure, the shape of the distribution differs greatly from the distribution described previously for the Detroit data, which was normal. Instead, it is a highly positively skewed distribution of an ordered discrete outcome variable that consists of four categories (viz., 0.00, 1.00, 2.00, and 3.00).
Pene
trat
ion
Rate
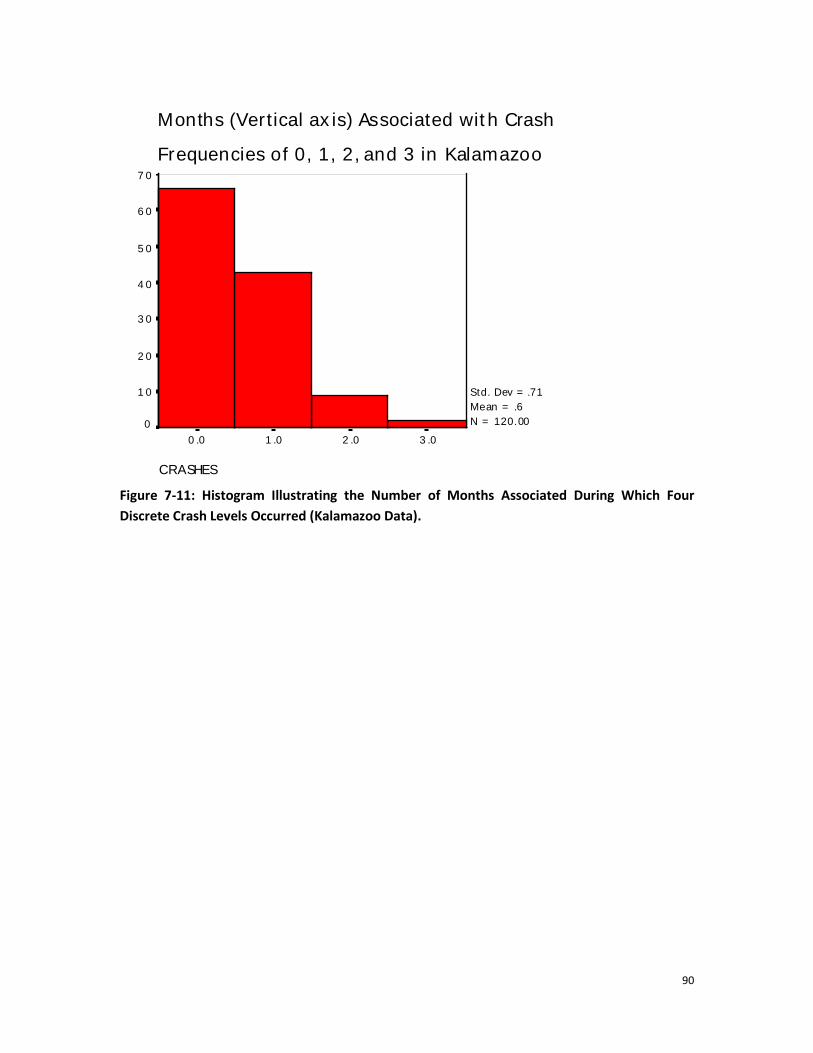
90
Figure 7-11: Histogram Illustrating the Number of Months Associated During Which Four Discrete Crash Levels Occurred (Kalamazoo Data).
CRASHES
3 .02 .01 .00 .0
Months (Vertical ax is) Associated wit h Crash
Frequencies of 0, 1, 2, and 3 in Kalamazoo7 0
6 0
5 0
4 0
3 0
2 0
1 0
0
Std. Dev = .71 Mean = .6N = 120.00

91
Simple Descriptive Results The pattern of these four response categories across the 120 months of the study can be seen below in Figure 7-12. The highest frequency crashes (i.e., 3) tend to be observed only during the early months. Similarly, the months during which two crashes occur drops off abruptly before month 80. An explanation for this pattern of a reduction in crash frequencies is presented in Figure 7-13 that illustrates crash frequency as a function of PCT penetration. No month is present during which more than a single crash occurs when the penetration parameter is 0.6 or higher.
Figure 7-12: Discrete Crash Frequency (0, 1, 2, or 3) in Kalamazoo as a Function of Month (Number of months = 120).
Cras
hes P
er M
onth

92
Figure 7-13: Kalamazoo Crash Frequency as a Function of PCT Penetration
Figure 7-14: Kalamazoo Mean Crash Scores Plotted Against Penetration Means for Five Penetration Categories.
CDT Pen et ration
1 .21.0.8.6.4.20 .0- .2
3 .5
3 .0
2 .5
2 .0
1 .5
1 .0
.5
0 .0
- .5
Cras
hes P
er M
onth
M
ean
Cras
h Ra
te

93
As shown in Figures 7-11, 7-12, and 7-13, the Kalamazoo crash data consist of ordered discrete values, therefore, the research team can reasonably treat them as continuous in order to provide crude but easily understood descriptive statistics (e.g., mean values) that allow approximate comparisons with the Detroit outcome. Figure 14 is a plot of the mean number of crashes associated with five penetration score categories. These five categories have penetration means of 0.00, 0.12, 0.32, .60, and .90. As shown in Figure 7-14, mean crash scores tend to (but do not always) decrease as the average degree of PCT penetration increases. The relationship is high (rSpearman = 0.90, p = 0.04). The results of the inferential test used to compute this p-value can be questioned, however, because the theory associated with the test assumes continuous rather than a discrete variables. For this reason, the formal inferential results presented subsequently are based on analyses that correctly assume an ordered categorical (discrete) dependent variable. Table 7-3 shows the intervention effect estimates for PCT in Kalamazoo. Table 7-3: Intervention Effect Estimates for PCT in Kalamazoo. (Estimates controlled for seasonality.)
Descriptive Outcome Measure Estimate Initial Level of Crashes per Month 0.51 Change in Level Associated with Intervention (i.e., the level change coef.) -0.28 (p = .10) Level Near End of Study 0.23 Percentage reduction in crashes 55% Standardized Within Site Effect Size 0.41 Proportion of Total Variation in Crashes (not explained by seasonality) Explained by the Intervention
0.023
Ordinal Logistic Regression Analysis of Kalamazoo Data Ordinal logistic regression was applied in order to evaluate the effects of the PCT intervention. Multiple models based on different assumptions were evaluated; the one that emerged as most appropriate was selected. The predictor variables included in the final model were parallel to those used in the Detroit analysis, but the method of modeling did not include a method to accommodate autocorrelated errors, because the errors were approximately independent. The final set of predictors included the penetration variable and 11 dummy variables that were specified to control for seasonal fluctuations. This analysis estimates the effects in a different manner than does the model used for the Detroit data. Rather than estimate the mean reduction in level associated with different degrees of PCT penetration, a description is provided of the relationship between the change in penetration and the associated change in probability of occurrence; this is done for each separate response category. For example, a point of interest would be to describe the probability of having zero crashes in a month during which no PCT are present (i.e., when the

94
penetration value = 0.00). As shown in Figure 7-15, the desired probability is about 0.50. In contrast, the probability of no crashes is about 0.63 when all PCT have been installed. Hence, the data shows that the probability of no crashes increases as the penetration of the PCT increases. Figures 7-16, 7-17, and 7-18 describe the probability of one, two, and three crashes, respectively, as a function of PCT penetration.
PCT Penetration
Figure 7-15: Probability of No Crash in Kalamazoo as a Function of PCT Penetration
Figure 7-16 describes the relationship between the probability of a single crash and PCT penetration. As shown in this figure, the probability decreases as the penetration parameter increases. As the penetration score changes from zero to one the probability changes from 0.39 to approximately 0.31. A similar pattern holds for determining the probability of there being two crashes (Figure 7-17). In addition, as shown in Figure 7-17, the change in probabilities is considerably smaller in this figure; the extremes are about 0.088 to 0.055. Figure 7-18 shows the probability of there being three crashes in a month for each penetration value. Because three crashes in a month are very rare regardless of conditions, the change in probability is very small as penetration varies; the estimated probabilities range from only 0.0197 to 0.0120.

95
Penetration
Figure 7-16: Probability of One Crash in Kalamazoo as a Function of PCT Penetration
Penetration
Figure 7-17: Probability of Two Crashes in Kalamazoo as a Function of PCT Penetration

96
Penetration
Figure 7-18: Probability of Three Crashes in Kalamazoo as a Function of PCT Penetration
The results of a somewhat simpler analysis that treats the outcome variable as dichotomous is presented herein. This analysis is based on a binary logistic regression model. The penetration variable was the predictor and a zero-one (i.e., no crash vs. at least one crash) was the dependent variable. As was the case with the ordinal logistic regression model, the result was not statistically significant (p > 0.25), but the descriptive results may clarify the previous ordinal logistic regression results. The results shown in Figure 7-19 combine the results shown above in Figures 7-16, 7-17, and 7-18. Whereas the previous results show the change in probability for each separate outcome category (i.e., 0, 1, 2, or 3 crashes), the results in Figure 7-19 show the change in probability of at least one crash as intervention penetration increases.

97
Penetration
Figure 7-19: Probability of At Least One Crash in Kalamazoo as a Function of PCT Penetration.
The probability estimates presented in Figures 7-16 to 7-19 are based on the assumption that the model is correct. They are simply descriptive approximations. The argument that the observed reduction in crashes was caused by the introduction of PCT assumes that the change cannot be explained by unknown events that occurred after the PCT were introduced or by sampling error. Because the inferential evidence for an intervention effect is not strong in Kalamazoo (i.e., the p-value for the conservative test associated with the ordinal regression model applied to these data is 0.16), the confidence one should attach to these results is not as persuasive as it is in the Detroit analysis. This result is to be expected because the Detroit data are much more extensive than the Kalamazoo data. The Detroit analysis was based on 449 (intervention plus control) sites whereas the Kalamazoo analysis included 57 intervention sites. Overall, crashes dropped by 55% in Kalamazoo after the introduction of the PCT. Detroit and Kalamazoo Meta-analysis Although the Kalamazoo results are not as persuasive as the Detroit results, one can acknowledge that the information from the Detroit study establishes a high prior probability that the relationship estimated in Kalamazoo is real. Two points seem relevant here. First, the research team is aware of no obvious logical reason for the PCT to be effective in Detroit, but not in Kalamazoo. Second, to cumulate results from multiple studies of the same intervention in a meta-analysis is possible; this analysis can provide an evaluation of overall effectiveness. The

98
results of performing a small meta-analysis that cumulates the findings of Detroit and Kalamazoo treatments are shown in Table 7-4.
Table 7-4: Meta-analysis of the effect of the full PCT treatment (based on separate analyses from Detroit and Kalamazoo).
Meta-analytic test statistic: z = -4.59 (p < 0.000004) The combined results of the two studies persuasively support the argument that change occurred after the introduction of the PCT intervention. III. Oakland FYA Analysis. Flashing Yellow Arrow (FYA) intervention was evaluated in Oakland County. Crash data for all crashes were collected for 120 months from a sampling unit of 26 intervention sites; crash data also were collected from four sites that were not exposed to FYA. The number of months during which the crash frequency (all crashes) is zero, one, or two in the Oakland intervention unit is shown in Figure 7-20.
Figure 7-20: Crash Frequencies of Zero, One, or Two, During 120 Months in Oakland.
As shown in Figure 7-20, the distribution is non-normal and only three categories of response (0, 1, and 2) are present. Consequently, the formal inferential analysis of the data can be analyzed

99
using an ordinal logistic model. Useful descriptive results, however, can be easily presented in two or three plots; for example, as a plot of crash frequency against month of the study and crash frequency against the intervention penetration. A general overview of the outcome can be seen in Figure 7-21. As shown in the figure, the crash frequency does not appear to diminish across the 120 months of the study. Although the points during which the intervention was present are not indicated on this figure, the data suggests that crash frequency never trends downward, regardless of where the intervention might have been introduced. An illustration that reveals the exact months during which the FYA were introduced would be helpful in directing attention to the start and continued penetration of the intervention, so that a more careful visual analysis can be carried out. Such an illustration is provided in Figure 7-22. As shown in this figure, the first FYA were installed during month 65, and the introduction schedule was quite rapid during subsequent months. Figure 7-23 displays both the frequency of crashes (on the ordinate) and the penetration of the intervention (on the abscissa). One would anticipate that the frequency of crashes would drop as the penetration increases, but this is not the case. The crash frequency is clearly not lower under full implementation of FYA (i.e., penetration value 1.0) than it is when the penetration value is zero.
Figure 7-21: Crash Frequency During 120 Months in Oakland.
0 120 Months

100
Figure 7-22: FYA Penetration as a Function of the Time Index (Months).
Figure 7-23: Crash Frequency Plotted Against FYA Penetration in Oakland.
0 120 Months
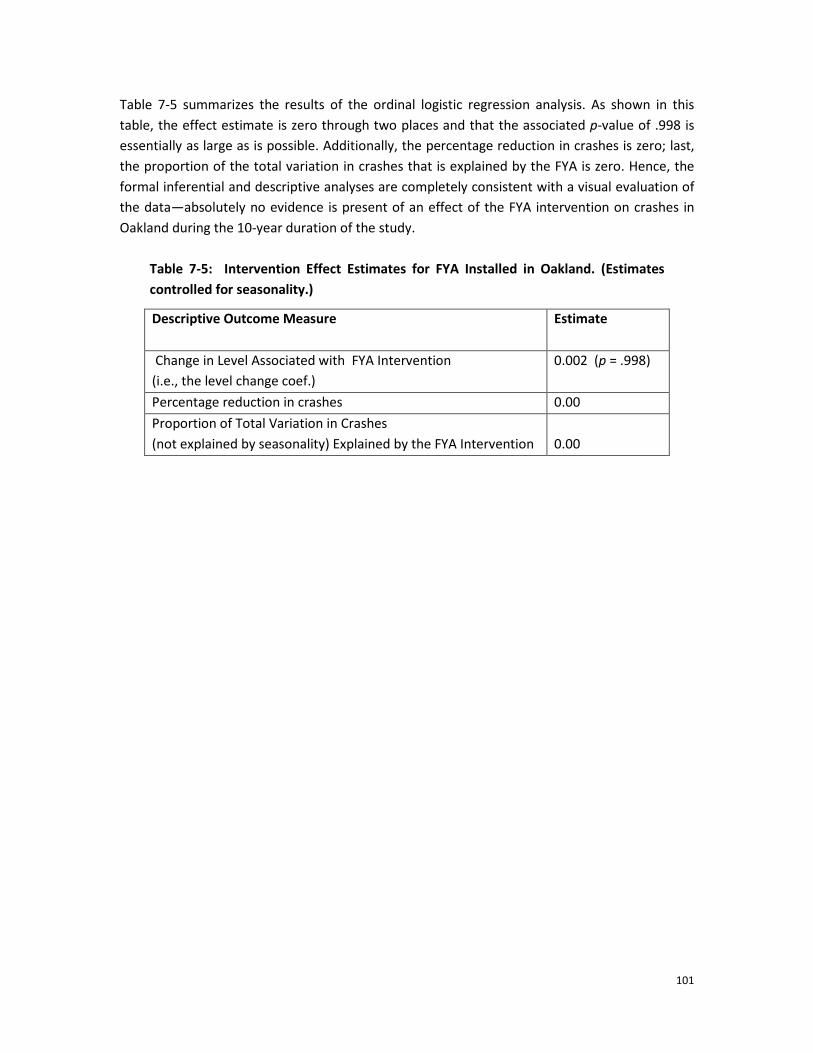
101
Table 7-5 summarizes the results of the ordinal logistic regression analysis. As shown in this table, the effect estimate is zero through two places and that the associated p-value of .998 is essentially as large as is possible. Additionally, the percentage reduction in crashes is zero; last, the proportion of the total variation in crashes that is explained by the FYA is zero. Hence, the formal inferential and descriptive analyses are completely consistent with a visual evaluation of the data—absolutely no evidence is present of an effect of the FYA intervention on crashes in Oakland during the 10-year duration of the study.
Table 7-5: Intervention Effect Estimates for FYA Installed in Oakland. (Estimates controlled for seasonality.)
Descriptive Outcome Measure Estimate
Change in Level Associated with FYA Intervention (i.e., the level change coef.)
0.002 (p = .998)
Percentage reduction in crashes 0.00 Proportion of Total Variation in Crashes (not explained by seasonality) Explained by the FYA Intervention
0.00

102
CHAPTER 8 - CONCLUSIONS
The results of this study indicate that installations of the RRFB and PHB in Michigan did not producing levels of driver yielding to pedestrians as high as those documented in FHWA studies. Yielding in Michigan averaged 75% at RRFB installations and 76% at PHB locations. The results of the FHWA study found that the RRFB increased motorist yielding to pedestrians to 84% in St. Petersburg, where there were 19 installed sites and between 62% and 74% at two other locations with only a few installations. Yielding results at the RRFB sites in the two FHWA locations with few RRFB installations are similar to the results obtained at the Michigan sites. The PHB was only evaluated in the city of Tucson where there were 60 installations at the start of the evaluation. In this study, yielding to the steady red and wig-wag red indications was greater than 95%, which far exceeded the results obtained at the Michigan installations. The cities of St. Petersburg and Tucson also included significant outreach efforts along with limited enforcement activities at treatment locations.
It is not surprising then, that yielding to both these devices was lower at Michigan sites where fewer devices were installed and the level of outreach and enforcement was less concentrated than in the FHWA study sites. The lower performance of these devices in Michigan is likely the result of lower levels of driver and pedestrian understanding of how to respond to the device, and lower understanding of the requirements of drivers to pedestrians in the crosswalk. Support for this hypothesis is provided by the improved performance of the PHB on the WSU Campus (86%), a location that has been associated with significant outreach efforts. The driver comprehension survey results also support this hypothesis. It can be anticipated that both devices will perform at higher levels once they are in more general use as drivers become more familiar with them.
The in-street sign performed at levels more in agreement with the reviewed literature. One reason for the better performance of this device is its intuitive nature. The message is clear and the location makes it difficult to miss. The Gateway treatment using three in-street signs for each two-lane leg on a four-lane divided road produced yielding levels equal to or superior to the PHB or RRFB. Additional research should explore the cost effectiveness of this solution, ways to reduce the probability that the signs are struck by vehicles, and additional, potential applications, such as crosswalks at slip lanes. One advantage of the in-street sign and Gateway treatment is that they do not require any response from the pedestrian to activate the device.
Another finding was the increased yielding produced when a single in-street sign was added in each direction to the PHB. This combined treatment led to levels of yielding similar to those reported in the research literature. These results indicate that the addition of the in-street sign may serve as an effective outreach measure to enhance the efficacy of the PHB. Similar effects also were obtained at one site when the in-street sign was added to an RRFB installation. The addition of in-street signs to a PHB or RRFB at multilane roundabouts also may serve to increase yielding for sighted and blind pedestrians.

103
The results of the driver and pedestrian survey provided additional evidence that drivers and pedestrians do not fully comprehend how they should respond to the PHB and RRFB. Better results were obtained for the in-street sign.
The results of the PCT statistical analysis provided unequivocal evidence that the pedestrian countdown timers reduced pedestrian crashes. The size of the effect in the Detroit sample was quite large (70% crash reduction). Although crash reductions (55%) also were observed in Kalamazoo, the much smaller sample size reduced the level of confidence of the effect. These data demonstrated that the PCT is a very cost effective method of reducing pedestrian crashes in urban areas and should be retrofitted throughout the state of Michigan.
The analysis of the effects of the FYA treatment in Oakland County did not indicate any benefit to pedestrians.
BIBLIOGRAPHY Abdulsattar, N.A., Tarawneh, M.S., McCoy, P.T., & Kachman, S.D. (1996). Effect on Vehicle-
Pedestrian Conflicts of "Turning Traffic Must Yield to Pedestrians" Sign. Transportation Research Record. 1553, 38-45.
Baltes, M.R., & Chu, X. (2010). Pedestrian Level of Service for Mid-block Street Crossings.
Transportation Research Record: Journal of the Transportation Research Board. 1818. Washington D.C.: Transportation Research Board of the National Academies.2002. City of Portland Bureau of Transportation. FHWA Experimentation #4-298(E) Modified HAWK Signal and Bike Signal. Draft Report.
Cohen, J. (1988). Statistical Power Analysis for the Behavioral Sciences (2nd edition.). Hillsdale, NJ: Lawrence Erlbaum. Eccles, K.A., Tao, R., & Mangum, B.C. (2007). Evaluation of Pedestrian Signals in Montgomery
County, Maryland. Transportation Research Record, 1878, 36-41. Fayish, A.C., & Gross, F. (2010). Safety effectiveness of leading pedestrian intervals using a
before-after with comparison group method. Transportation Research Record, 2198, 15-22. Federal Highway Administration (FHWA). (2006). Interim Approval for Optional Use of Flashing
Yellow Arrow for Permissive Left Turns (IA-10).
FHWA (2007). Desktop Reference for Crash Reduction Factors. Washington, DC.

104
FHWA. (2010). Effects of Yellow Rectangular Rapid-Flashing Beacons on Yielding at Multilane Uncontrolled Crosswalks. Publication No. FHWA-HRT.10-043, Washington, D.C.
Fitzpatrick, K., Turner, S., Brewer, M., Carlson, P., Lalani, N., Ullman, B., Trout, N.,
Park, E.S., Lord, D., and Whitacre, J. (2006). Improving Pedestrian Safety at Unsignalized Crossings, TCRP/NCHRP Report 112/562, Transportation Research Board, Washington, DC.
Gårder, P. E. "The Impact of Speed and Other Variables on Pedestrian Safety in Maine."
Accident Analysis and Prevention. 36(4): 533-542.2004.
Harwood, D. W., Torbic, D.J. Gilmore, D.K., Bokenkroger, C. D., Dunn, J.M., Zegeer, C.V., Srinivasan, R., Carter, D., Raborn, C. Lyon, C., & Persaud, B. (2008). Pedestrian Safety Prediction
Methodology, Final Report. National Cooperative Highway Research Program Project 17-28. Huang, H. and Zegeer, C. The Effects of Pedestrian Countdown Signals in Lake Buena Vista.
Florida Department of Transportation. 2000. Huitema, B. E. (2011). The Analysis of Covariance and Alternatives: Statistical Methods for
Experiments, Quasi-Experiments, and Single-Case Studies (2nd ed.) Hoboken, NJ: Wiley.
Hunter-Zaworski, K. & Mueller, J. (2012). Evaluation of Alternative Pedestrian Traffic Control Devices. Oregon Department of Transportation Research Section and Federal Highway Administration, FHWA-OR-RD-12-09.
Huybers, S., Van Houten, E. & Malenfant, J.E.L. (2004). Reducing conflicts between motor
vehicles and pedestrians: The separate and combined effects of pavement markings and a sign prompt. Journal of Applied Behavior Analysis. 37, 445-456.
Institute of Transportation Engineers (ITE). (2007). Pedestrian Signal Safety for Older Persons.
Washington, DC. Karkee. G, Pulugurtha, S.S & Nambisan, S. (2006). Evaluating the effectiveness of
“Turning Traffic Must Yield to Pedestrians (R 10-15) Sign,” American Society of Civil Engineers Proceedings. pp 400-405.
Lord, D. (2002). Synthesis on the Safety of Right Turn on Red in the United States and Canada.
Center for Transportation Safety, Texas Transportation Institute. College Station, Texas. Malenfant, L. and Van Houten, R. (1989). Increasing the percentage of drivers yielding to
pedestrians in three Canadian cities with a multifaceted safety program. Health Education Research. 5, 274-279.

105
Markowitz, F., Sciortino, S., Fleck, J.L. & Yee, B.M. (2006) Pedestrian countdown timers:
experience with an extensive pilot installation. ITE Journal, 76, 43-48. McKnight, S., McKean, J. W., & Huitema, B. E. (2000). A double bootstrap method to analyze linear models with autoregressive error terms. Psychological Methods,5, 87-101. Michigan Department of Transportation. Flashing Yellow Arrow Left-Turn Signal. State of
Michigan, 2011. http://www.michigan.gov/mdot/0,1607,7-151-9620_10694-157538--,00.html.
Nassi, Richard. (2012, April). Personal interview. Petritsch, T. A., Landis, B.W. McLeod, P.S. Huang, H. Challa, S. and Guttenplan. M. (2005). -
Service Model for Pedestrians at Signalized Intersections. Transportation Research Record: Journal of the Transportation Research Board. 1939. Washington D.C.: Transportation Research Board of the National Academies.
Retting, R.A., & Van Houten, R. (2000). Safety Benefits of Advance Stop Lines at Signalized Intersections: Results of a Field Evaluation. ITE Journal. 70, 47-54.
Retting, R.A., Van Houten, R., Malenfant, L., Van Houten, J. & Farmer, C.M. (1996). Special signs
and pavement markings improve pedestrian safety. ITE Journal, 66, 28-35. Ross, J. Serpico, D., & Lewis, R. (2011). Assessment of Driver Yielding Rates Pre- and Post-RRFB
Installation, Bend, Oregon. Salem, OR: Oregon Department of Transportation. 2011.
Shurbutt, J., Van Houten, R., Turner, S. & Huitema, B. (2009). An Analysis of the Effects of Stutter Flash LED Beacons to Increase Yielding to Pedestrians Using Multilane Crosswalks. Transportation Research Record. No. 2073, 69-78.
Snyder, M. B. (1972). Traffic engineering for pedestrian safety: Some new data and solutions.
Highway Research Record, 406, 21–27. Traffic Safety Facts: Research Notes (2010). NHTSA, DOT HS 811 552. Washington, D.C. Turner, S., Fitzpatrick, K., Brewer, M., & Eun Sug Park, S. (2006). Motorist yielding to pedestrians
at unsignalized intersections: Findings form a national study on improving pedestrian safety. Transportation Research Record, 1982, 1-12.

106
Van Houten, R. (1988). The effects of advance stop lines and sign prompts on pedestrian safety in crosswalk on a multilane highway. Journal of Applied Behavior Analysis. 21, 245-251.
Van Houten, R., Ellis, R. and Kim, J.L. (2007). The Effects of Varying Minimum Green on the
Percentage of Pedestrians Waiting to Cross with the WALK Signal at Midblock Crosswalks. Transportation Research Record. No.2002-10, 78-83.
Van Houten, R., Ellis, Sanda, J. & Kim, J.L (2006). Pedestrian push button confirmation increases call button usage and compliance. Transportation Research Record. No. 1982, 99-
103. Van Houten, R., Ellis, R. & Marmolejo, E. (2008). The Use of Stutter Flash LED Beacons to Increase Yielding to Pedestrians at Crosswalks. Transportation Research Record, 2073, 69-
78. Van Houten, R. & Malenfant, L. (1992). The Influence of signs prompting motorists to yield 50
feet (15.5 m) before marked crosswalks on motor vehicle-pedestrian conflicts at crosswalks with pedestrian activated flashing lights. Accident Analysis and Prevention, 24, 217-225.
Van Houten, R., & Malenfant, L. (2004). Effects of a driver enforcement program on yielding to
pedestrians. Journal of Applied Behavior Analysis, 37, 351-363. Van Houten, R., Malenfant, L. and Rolider, A. (1985). Increasing Driver Yielding and Pedestrian
Signaling with prompting, feedback and enforcement. Journal of Applied Behavior Analysis, 18, 103-115.
Van Houten, R., Malenfant, J.E., & Steiner, R. (2001). Scanning 'eyes' symbol as part of the
WALK signal: Examination across several intersection geometries and timing parameters. Transportation Research Record 1773. 75-81.
Van Houten, R., Malenfant, L., Van Houten, J., & Retting, R. A. (1998). Auditory pedestrian
signals increase pedestrian observing behavior and reduce conflicts at a signalized intersection. Transportation Research Record, 1578, 20–22.
Van Houten, R., McCusker, D., and Malenfant, J.E.L. (2001). Reducing motor vehicle-pedestrian
conflicts at multilane crosswalks with uncontrolled approach. Transportation Research Record 1773. p 69-74.
Van Houten, R. McCusker, D. Huybers, S., Malenfant, J.E.L., & Rice-Smith, D. (2003). An
examination of the use of advance yield markings and fluorescent yellow green RA 4 signs at crosswalks at with uncontrolled approaches. Transportation Research Record 1818, p. 119-124.
107
Van Houten, R., McCusker, D., and Malenfant, J.E.L. (2001). Reducing motor vehicle-pedestrian
conflicts at multilane crosswalks with uncontrolled approach. Transportation Research Record 1773. p 69-74.
Van Houten, R. & Retting, R.A. (2001). Increasing Motorist Compliance and Caution at Stop
Signs. Journal of Applied Behavior Analysis, 34, 185-193. Van Houten, R., Retting, R.A., Farmer, C.M., Van Houten, R. & Malenfant, J.E.L. (2000). Field
evaluation of a leading pedestrian interval signal phase at three suburban Intersections. Transportation Research Record. No 1734, p. 86-91.
Van Houten, R., Retting, R. A., Van Houten, J., Farmer, C. M., & Malenfant, J. E. L. (1999). The use
of animation in LED pedestrian signals to improve pedestrian safety. ITE Journal, 69, 30–38. Zegeer, C.V., & Cynecki, M.J. (1986). Evaluation of countermeasures related to RTOR accidents
that involve pedestrians. Transportation Research Record. 1059, 24-34. Zegeer, C.V., Sandt, L., Scully, M. Ronkin, M. Cynecki, M. Lagerwey, P. Chaney, H.
Schroeder, B. & Snyder, E. (2006). How to Develop a Pedestrian Safety Action Plan: Final Report. Publication FHWA-SA-05-12.U.S. Department of Transportation, FHWA.
Zegeer, C. V., Stewart, J. R., & Huang, H. (2001). Safety effects of marked versus unmarked crosswalks at uncontrolled locations: Analysis of pedestrian crashes in 30 cities. Transportation Research Record, 1773, 56–68.