raymond james us south homebuilding & wood … · forward-looking statements & non-ifrs...
TRANSCRIPT

Raymond James US South Homebuilding & Wood Conference Presentation September 29, 2015
Forward-Looking Statements & Non-IFRS Financial Information
• All financial references are expressed in US$ unless otherwise noted.
• This presentation contains forward-looking statements and estimates.
• Actual company results could differ materially from a conclusion, forecast or projection in the forward-looking information.
• Certain material factors or assumptions were applied in drawing a conclusion or making a forecast or projection as reflected in the forward-looking information.
• Additional information can be found in the Company’s annual information form, annual MD&A, and on Norbord’s website (www.norbord.com) about the material factors that could cause actual results to differ materially from the conclusion, forecast or projection in the forward-looking information, and the material factors or assumptions that were applied in drawing a conclusion or making a forecast or projection as reflected in the forward-looking information.
• During the course of this presentation, certain non-IFRS financial information will be presented. Definitions and reconciliation of terms can be found in the Company’s annual and quarterly MD&A.
2
Notices

Company Overview
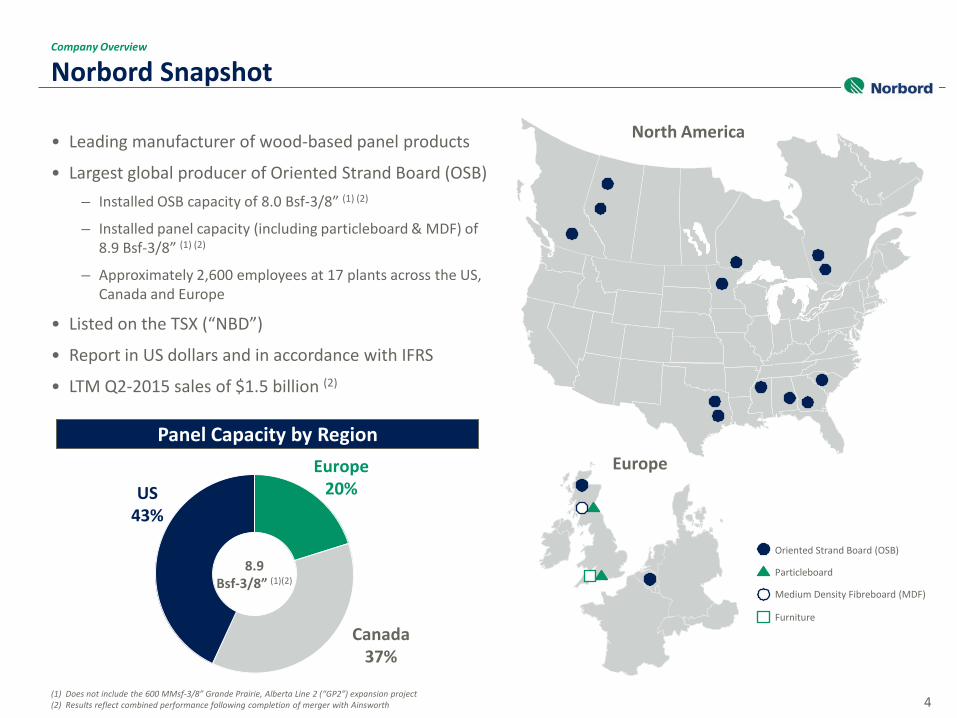
Norbord Snapshot
• Leading manufacturer of wood-based panel products
• Largest global producer of Oriented Strand Board (OSB) – Installed OSB capacity of 8.0 Bsf-3/8” (1) (2)
– Installed panel capacity (including particleboard & MDF) of 8.9 Bsf-3/8” (1) (2)
– Approximately 2,600 employees at 17 plants across the US, Canada and Europe
• Listed on the TSX (“NBD”)
• Report in US dollars and in accordance with IFRS
• LTM Q2-2015 sales of $1.5 billion (2)
4
Company Overview
North America
Europe
Oriented Strand Board (OSB)
Particleboard
Medium Density Fibreboard (MDF)
Furniture
Europe 20%
Canada 37%
US 43%
8.9 Bsf-3/8” (1)(2)
Panel Capacity by Region
(1) Does not include the 600 MMsf-3/8” Grande Prairie, Alberta Line 2 (“GP2”) expansion project (2) Results reflect combined performance following completion of merger with Ainsworth

$-
$1,000
$2,000
$3,000
$4,000
$5,000
$6,000
West Fraser Canfor Corp. Louisiana-Pacific Norbord Interfor Western Forest Products Conifex
Ente
rpris
e Va
lue
($U
Smm
) The Leading Global OSB Company
5
Company Overview
Top 10 Global OSB Producers
Enterprise Value
Source: Bloomberg and company filings. Enterprise values as at Q2 2015
0.0
1.0
2.0
3.0
4.0
5.0
6.0
7.0
8.0
9.0
Norbord Louisiana-Pacific Georgia-Pacific Weyerhaeuser Kronospan Huber Tolko KronoSwiss Egger Martco
OSB
Cap
acity
(Bsf
-3/8
")
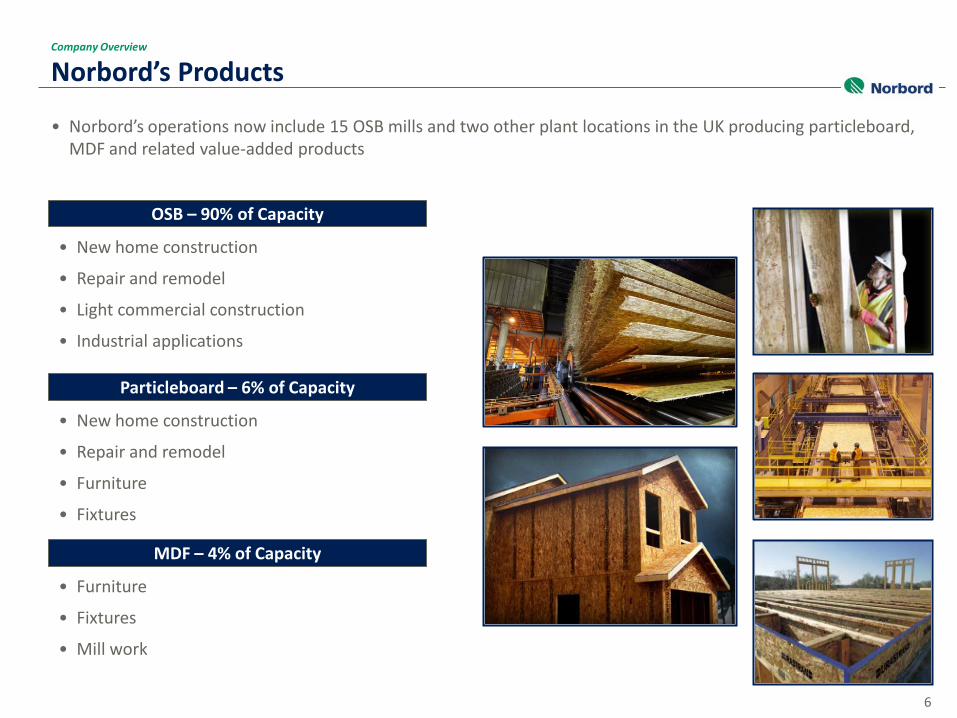
Norbord’s Products
6
Company Overview
OSB – 90% of Capacity
• Norbord’s operations now include 15 OSB mills and two other plant locations in the UK producing particleboard, MDF and related value-added products
• New home construction
• Repair and remodel
• Light commercial construction
• Industrial applications
Particleboard – 6% of Capacity
• New home construction
• Repair and remodel
• Furniture
• Fixtures
MDF – 4% of Capacity
• Furniture
• Fixtures
• Mill work

Industry Overview

Typical Uses for OSB Products
8
Industry Overview
Wall Sheathing
Webstock
Flooring
Rimboard Door Header
Roof
Window Header
Garage Door Header
• OSB is an innovative, affordable and environmentally “sustainable” structural panel – Serves many of the same uses as plywood, but produced at a lower cost
• Norbord expects OSB will continue to capture market share from plywood – Currently, OSB represents 66% of total North American structural panels
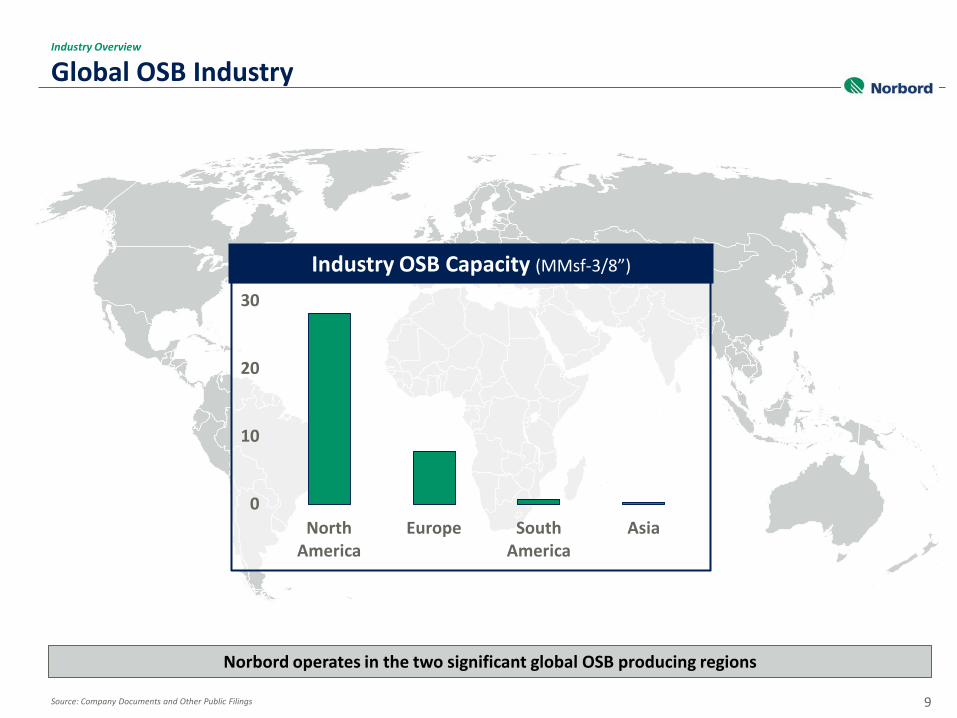
Global OSB Industry
9
Industry Overview
Industry OSB Capacity (MMsf-3/8”)
0
10
20
30
North America
Europe South America
Asia
Norbord operates in the two significant global OSB producing regions
Source: Company Documents and Other Public Filings
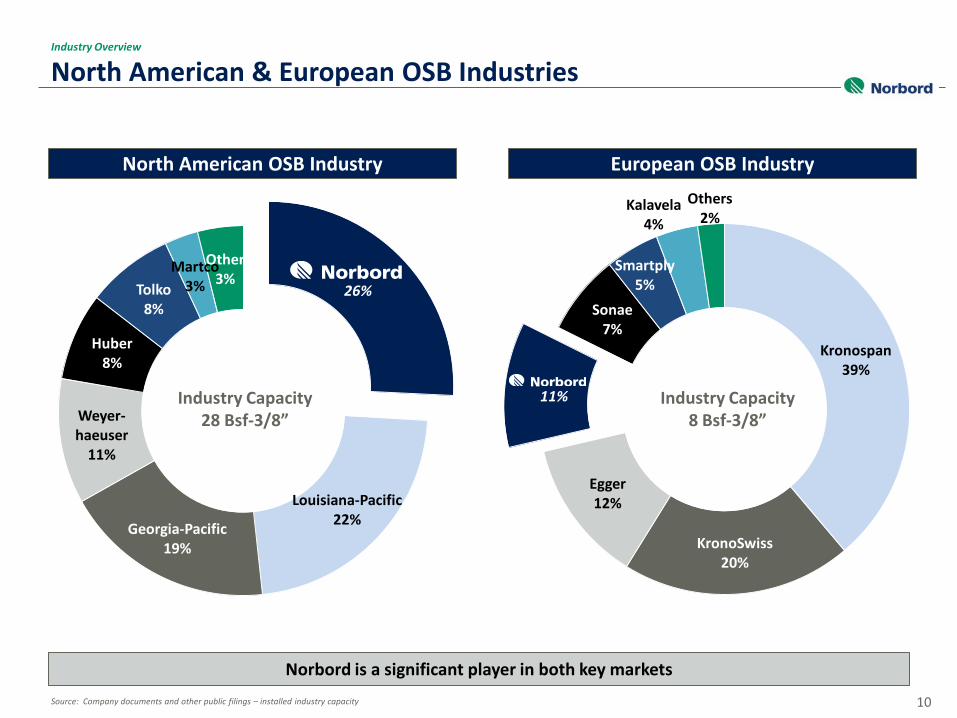
Kronospan 39%
KronoSwiss 20%
Egger 12%
Sonae 7%
Smartply 5%
Kalavela 4%
Others 2%
Industry Capacity 8 Bsf-3/8”
North American & European OSB Industries
10
Industry Overview
Louisiana-Pacific 22% Georgia-Pacific
19%
Weyer- haeuser
11%
Huber 8%
Tolko 8%
Martco 3%
Other 3%
Industry Capacity 28 Bsf-3/8”
North American OSB Industry
26%
Source: Company documents and other public filings – installed industry capacity
European OSB Industry
11%
Norbord is a significant player in both key markets
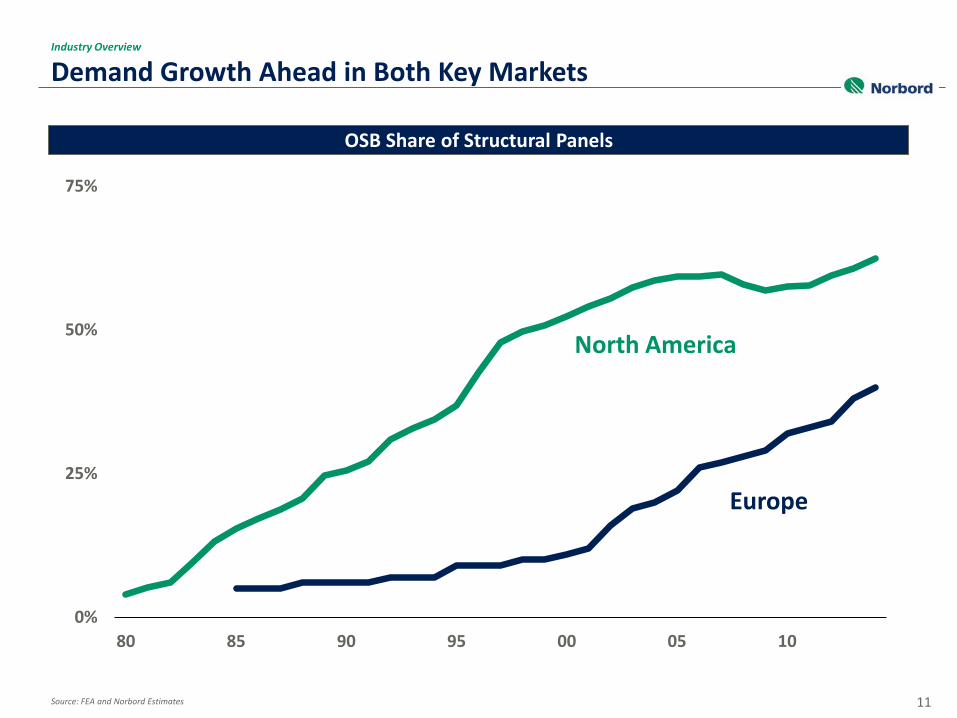
Demand Growth Ahead in Both Key Markets
11
Industry Overview
OSB Share of Structural Panels
Source: FEA and Norbord Estimates
0%
25%
50%
75%
80 85 90 95 00 05 10
North America
Europe

US Housing Recovery is Real
12
Industry Overview
0.5
1.0
1.5
2.0
2.5
1970 1975 1980 1985 1990 1995 2000 2005 2010 2015F
US
Hous
ing
Star
ts (m
m)
U.S. Housing Starts Underlying Demand
Favourable long-term OSB industry fundamentals
US Housing Starts and Underlying Demand
1.5 mm Over-Built
21.4 22.8 24.0 24.8 25.9 26.9 28.0 28.6 29.2 28.4 27.8 27.1 26.9 27.1 28.0 28.4 28.7 29.0
30%
40%
50%
60%
70%
80%
90%
100%
–
5.0
10.0
15.0
20.0
25.0
30.0
35.0
2000 2001 2002 2003 2004 2005 2006 2007 2008 2009 2010 2011 2012 2013 2014 2015F 2016F 2017F
Effective Demand / Capacity
Capa
city
(Bsf
-3/8
")
Effective Capacity Mothballed Capacity Effective Demand / Capacity
North American OSB Demand and Capacity
3.7 mm Under-Built
Source: US Census Bureau and Forest Economic Advisors, LLC (FEA); As of September 2015

North American Capacity Restarted to Meet Growing Demand
13
Industry Overview
39 Mills in Operation
8 Mills Indefinitely Curtailed
North American OSB Installed Capacity:
Norbord Mill
6 Mills (Re)started in 2013
Source: Company documents and other public filings
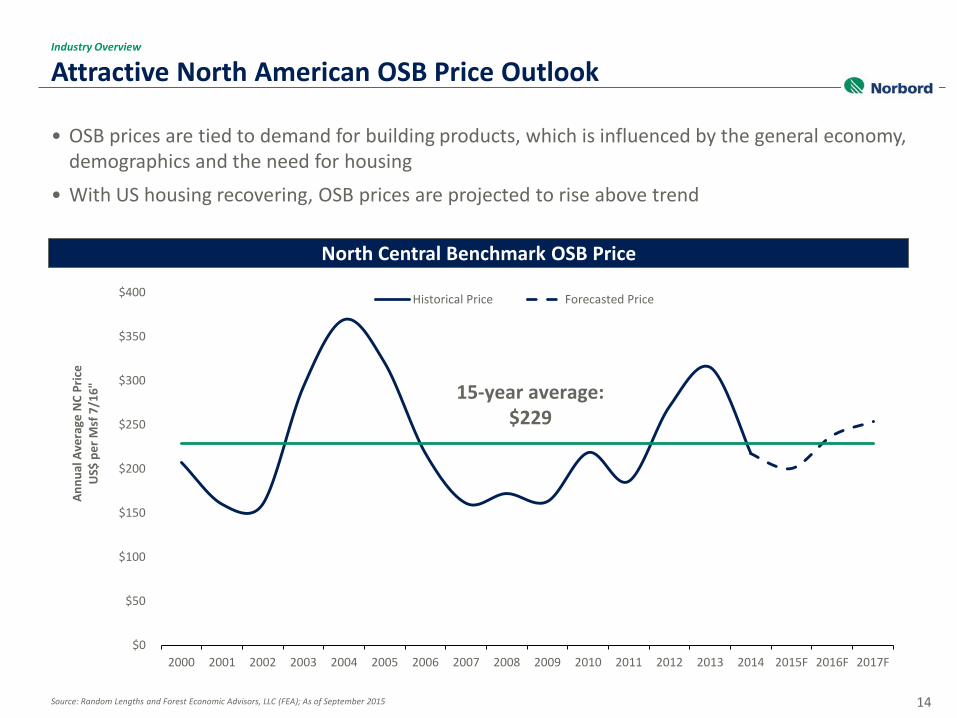
Attractive North American OSB Price Outlook
14
Industry Overview
North Central Benchmark OSB Price
Source: Random Lengths and Forest Economic Advisors, LLC (FEA); As of September 2015
$0
$50
$100
$150
$200
$250
$300
$350
$400
2000 2001 2002 2003 2004 2005 2006 2007 2008 2009 2010 2011 2012 2013 2014 2015F 2016F 2017F
Annu
al A
vera
ge N
C Pr
ice
US$
per
Msf
7/1
6"
Historical Price Forecasted Price
15-year average: $229
• OSB prices are tied to demand for building products, which is influenced by the general economy, demographics and the need for housing
• With US housing recovering, OSB prices are projected to rise above trend

Core European Housing Markets Recovering
15
Industry Overview
50
75
100
125
150
175
200
225
250
275
2009 2010 2011 2012 2013 2014
Housing Starts (000’s)
UK +9% in 2014
Germany +4% in 2014
0%
5%
10%
15%
20%
25%
30%
35%
40%
45%
80 85 90 95 00 05 10
European OSB Share of Structural Panels
Source: National House Builder Confederation (NHBC), Construction Products Association (CPA) & Bundesbank

• Significant growth opportunity – OSB accounts for only ~8% of the structural panel market in Japan compared to >60% in North America
543 556 505 517 430 460 465 487
550 489
693 729
556 577
358 353 369 396
430
403
1,236 1,285
1,061 1,093
788 813 834 883
980
892
2005 2006 2007 2008 2009 2010 2011 2012 2013 2014
Wooden All Other
Japanese Housing Market Stable
16
Industry Overview
Japanese Housing Starts (000’s)
Source: Japanese Ministry of Land, Infrastructure, Transport and Tourism

Business Strategy

Norbord’s Strategy is Well Defined
18
Business Strategy
Pursue growth in OSB 2
Own high-quality assets with low-cost positions 3
Maintain a margin-focused operating culture 4
Focus on growth customers through best-in-class service and product development
5
Allocate capital with discipline 6
Develop a world-class safety culture 1

Norbord’s Growth Focused on OSB
19
Business Strategy
0
1
2
3
4
5
6
7
8
92 93 94 95 96 97 98 99 00 01 02 03 04 05 06 07 08 09 10 11 12 13 14 15
Norbord OSB Capacity (Bsf-3/8”)
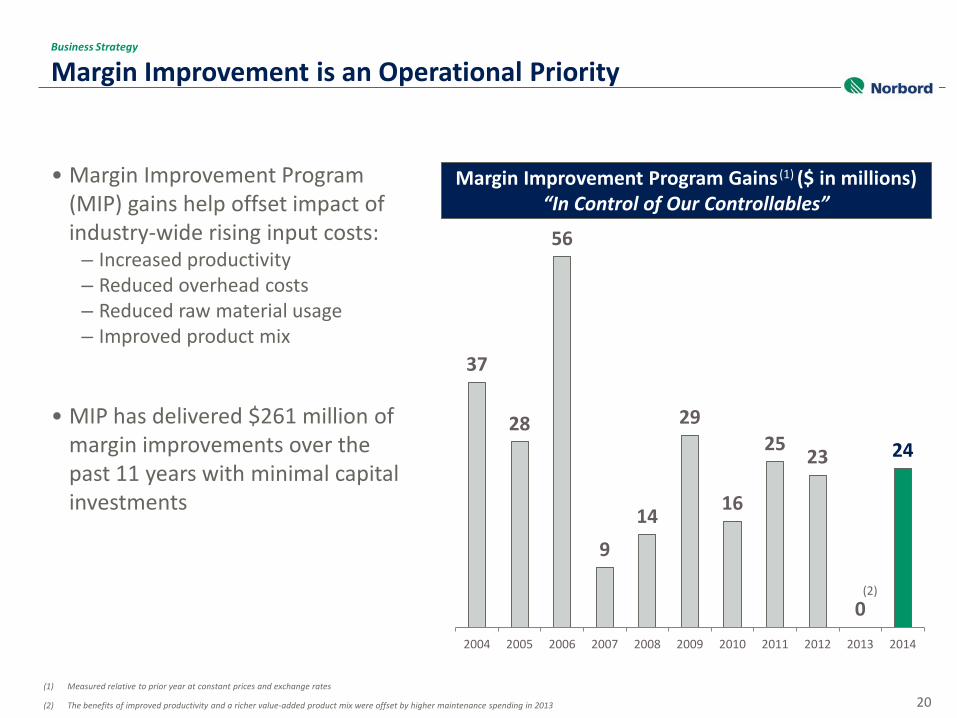
Margin Improvement is an Operational Priority
20
Business Strategy
37
28
56
9 14
29
16
25 23
0
24
2004 2005 2006 2007 2008 2009 2010 2011 2012 2013 2014
(1) Measured relative to prior year at constant prices and exchange rates
(2) The benefits of improved productivity and a richer value-added product mix were offset by higher maintenance spending in 2013
(2)
Margin Improvement Program Gains ($ in millions) “In Control of Our Controllables”
• Margin Improvement Program (MIP) gains help offset impact of industry-wide rising input costs:
– Increased productivity – Reduced overhead costs – Reduced raw material usage – Improved product mix
• MIP has delivered $261 million of margin improvements over the past 11 years with minimal capital investments
(1)

Further MIP Ahead Through Identified Merger Synergies
21
Business Strategy
Operational Best
Practices Corporate Overhead
Sales & Logistics
Purchasing Savings
Product Specialization
Single Public Company
$45 Million in Annual Merger Synergies (1)
Achievable over 18-24 months
Ainsworth’s Forming Technology
Operational Standardization
Continuous Press Experience
Order File Optimization
(1) Costs to achieve ~50%
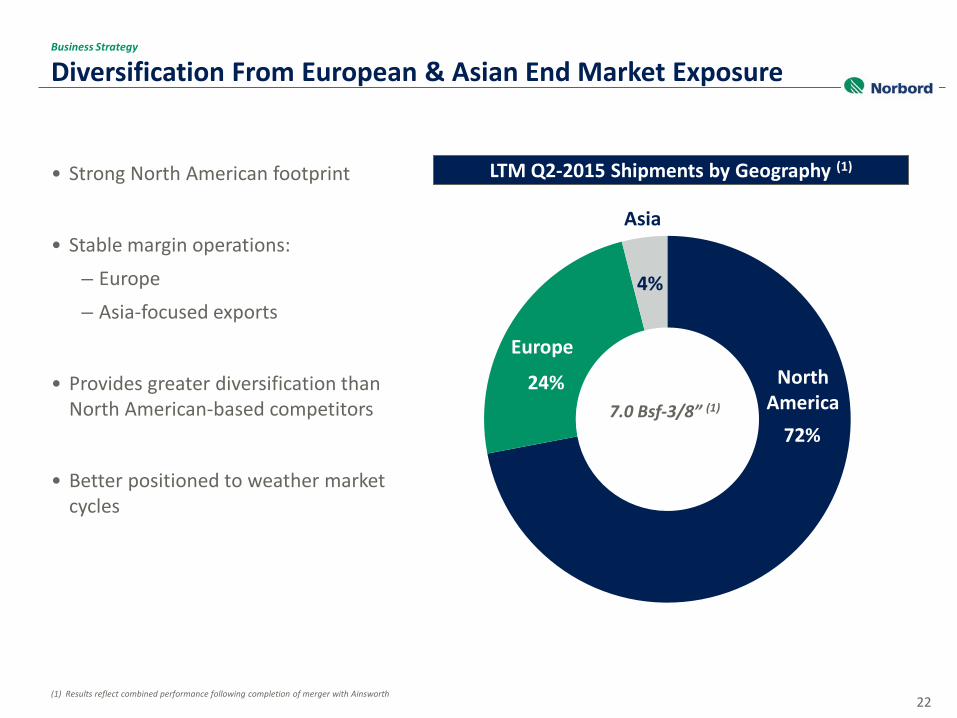
Diversification From European & Asian End Market Exposure
22
Business Strategy
72%
24%
4%
7.0 Bsf-3/8” (1)
LTM Q2-2015 Shipments by Geography (1)
(1) Results reflect combined performance following completion of merger with Ainsworth
• Strong North American footprint
• Stable margin operations: – Europe – Asia-focused exports
• Provides greater diversification than North American-based competitors
• Better positioned to weather market cycles
Europe North
America
Asia
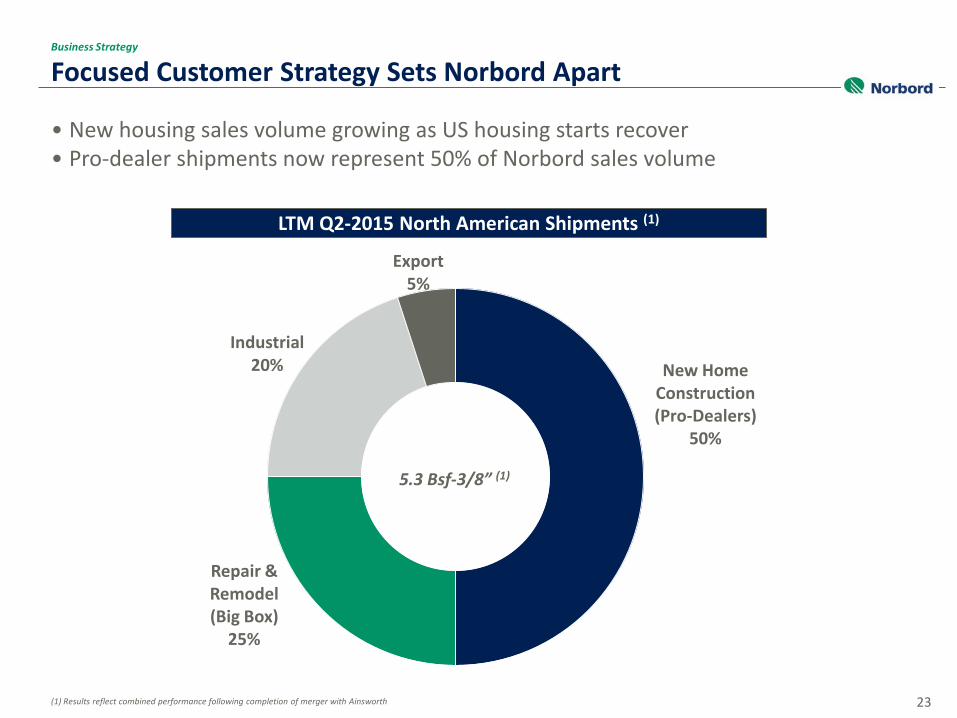
Focused Customer Strategy Sets Norbord Apart
23
Business Strategy
(1) Results reflect combined performance following completion of merger with Ainsworth
New Home Construction (Pro-Dealers)
50%
Repair & Remodel (Big Box)
25%
Industrial 20%
Export 5%
5.3 Bsf-3/8” (1)
LTM Q2-2015 North American Shipments (1)
• New housing sales volume growing as US housing starts recover • Pro-dealer shipments now represent 50% of Norbord sales volume

$0
$20
$40
$60
$80
$100
$120
$140
$160
$180
2004 2005 2006 2007 2008 2009 2010 2011 2012 2013 2014 2015 Target
Capex Greenfield Expansion
24
Business Strategy
Capex Investment (US$ millions) • Three main priorities:
– Investing in our mills
–Optimizing debt profile
–Returning cash to
shareholders
Business Strategy
(1)
(1) 2015 target reflects Norbord following completion of merger with Ainsworth. Pre 2015 reflects Norbord excluding Ainsworth.

Financial Overview

631
495
247
42 -60
107 45
188
287
290
307
48
-23 5
58
13
106
145
802
295
19
-60
5
165
58
294
432
117 67
2004 2005 2006 2007 2008 2009 2010 2011 2012 2013 2014 LTM Q2-2015
Norbord Combined Adjusted EBITDA (2)
Ainsworth Adjusted EBITDA (1)
Norbord (excluding Ainsworth) Adjusted EBITDA
Strong Operating Cash Flow Through The Cycle
26
Financial Overview
North Central Benchmark OSB Price $369 $320 $217 $161 $172 $163 $219 $186 $271 $315 $218 $204
US Housing Starts (000s) 1,956 2,068 1,801 1,355 906 554 587 609 781 925 1,003 1,058
Total Adjusted EBITDA (US$ millions)
11-year average: $277 million
(1) As disclosed in Ainsworth’s historical MD&As; converted to USD using annual average exchange rate (2) As disclosed in the Q2-2015 MD&A
Norbord Sensitivity to North American OSB Price Changes:
+$10/Msf 7/16” = +$58 million Adjusted EBITDA (at full capacity)
921
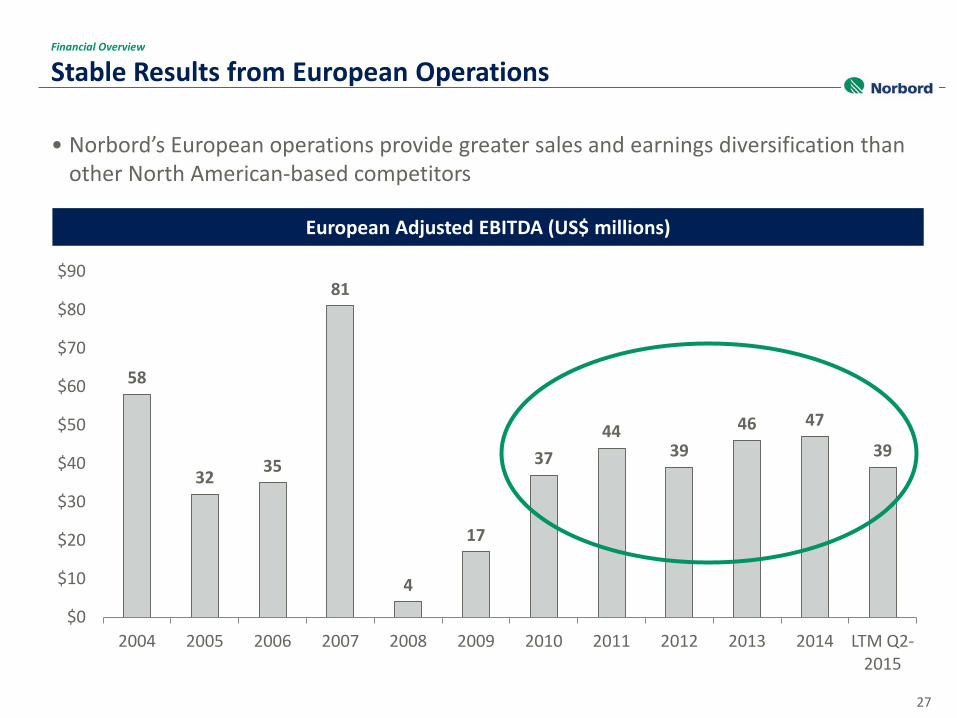
Stable Results from European Operations
27
Financial Overview
• Norbord’s European operations provide greater sales and earnings diversification than other North American-based competitors
European Adjusted EBITDA (US$ millions)
58
32 35
81
4
17
37 44
39 46 47
39
$0
$10
$20
$30
$40
$50
$60
$70
$80
$90
2004 2005 2006 2007 2008 2009 2010 2011 2012 2013 2014 LTM Q2-2015

Strong Balance Sheet & Liquidity
28
Financial Overview
Q2 2015
Cash $10
Bank Lines (1) 241
A/R Securitization(2) 75
Liquidity $326
Manageable Debt Maturities (US$ millions) Strong Liquidity Profile (US$ millions)
Moody’s Ba2 (Stable)
S&P BB- (Stable)
DBRS BB (Negative)
Stable Issuer Credit Ratings
$200
$240
$315
2015 2016 2017 2018 2019 2020 2021 2022 2023
7.70
%
5.37
5%
6.25
%
(1) $245 million of bank lines less $4 million outstanding letters of credit drawn at quarter-end (2) $125 million of A/R Securitization limit less $50 million drawn at quarter-end

Attractive Investment Opportunity
29
Summary
Leverage to unfolding US housing recovery Every +$10 in NA OSB price = +$58 million in Adjusted EBITDA at full capacity
Diversification from European operations and Asian export sales
High quality asset base with low operating costs
Focused customer strategy and strong customer partnerships
Superior margins versus peers
Track record of disciplined capital allocation
Strong financial liquidity and comfortable debt maturities

Norbord Inc.
Suite 600 One Toronto Street
Toronto, Ontario, M5C 2W4 Canada
Tel: 416-365-0705 Fax: 416-365-3292
www.norbord.com