raymond james financial reports second quarter …
TRANSCRIPT

April 28, 2021 FOR IMMEDIATE RELEASEMedia Contact: Steve Hollister, 727.567.2824
Investor Contact: Kristina Waugh, 727.567.7654raymondjames.com/news-and-media/press-releases
RAYMOND JAMES FINANCIAL REPORTS SECOND QUARTEROF FISCAL 2021 RESULTS
• Record quarterly net revenues of $2.37 billion, up 15% over the prior year’s fiscal second quarter and 7% over the preceding quarter
• Record quarterly net income of $355 million, or $2.51 per diluted share, up 110% over net income in the prior year’s fiscal second quarter and 14% over the preceding quarter
• Record client assets under administration of $1.09 trillion, financial assets under management of $178.2 billion, and net loans at Raymond James Bank of $22.9 billion
• Record Private Client Group assets in fee-based accounts of $567.6 billion, increases of 48% over March 2020 and 7% over December 2020
• Record Private Client Group financial advisors of 8,327, net increases of 179 over March 2020 and 94 over December 2020
• Annualized return on equity for the quarter of 19.0% and annualized return on tangible common equity for the quarter of 21.2%(1)
ST. PETERSBURG, Fla – Raymond James Financial, Inc. (NYSE: RJF) today reported net revenues of $2.37 billion and net income of $355 million, or $2.51 per diluted share, for the fiscal second quarter ended March 31, 2021. The 15% increase in quarterly net revenues compared to the prior year’s fiscal second quarter was primarily driven by higher asset management and related administrative fees, investment banking revenues and brokerage revenues partially offset by the impact of lower short-term interest rates on net interest income and Raymond James Bank Deposit Program (“RJBDP”) fees from third-party banks. The 7% sequential increase in quarterly net revenues was primarily due to higher asset management and related administrative fees and brokerage revenues.
Record quarterly net income grew 110% over the prior year’s fiscal second quarter and 14% over the preceding quarter driven by the aforementioned record revenues and a $32 million bank loan benefit for credit losses. The effective tax rate of 20.6% for the quarter benefited from non-taxable gains on the corporate-owned life insurance portfolio.
For the first six months of the fiscal year, record net revenues of $4.59 billion increased 13% and record earnings per diluted share of $4.74 increased 53% over the first half of fiscal 2020. The Private Client Group, Capital Markets and Asset Management segments generated record net revenues and pre-tax income during the first six months of the fiscal year.
“Our continued focus on serving advisors and clients with industry-leading tools and resources led to record results for the first six months of the fiscal year, including record revenues and pre-tax income in our Private Client Group, Capital Markets and Asset Management segments,” said Chairman and CEO Paul Reilly. “Moreover, we are well positioned entering the second half of the fiscal year, with records for client assets under administration of $1.09 trillion, total number of Private Client Group financial advisors of 8,327, and net loans at Raymond James Bank of $22.9 billion.”
Please refer to the footnotes at the end of this press release for additional information.1

Segment Results
Private Client Group
• Record quarterly net revenues of $1.65 billion, up 10% over the prior year’s fiscal second quarter and 12% over the preceding quarter
• Record quarterly pre-tax income of $192 million, up 13% compared to the prior year’s fiscal second quarter and 37% over the preceding quarter
• Record Private Client Group assets under administration of $1.03 trillion, up 40% over March 2020 and 6% over December 2020
• Record Private Client Group assets in fee-based accounts of $567.6 billion, up 48% over March 2020 and 7% over December 2020
• Record Private Client Group financial advisors of 8,327, net increases of 179 over March 2020 and 94 over December 2020
• Quarter-end record clients’ domestic cash sweep balances of $62.8 billion, up 19% over March 2020 and 2% over December 2020
Growth in quarterly net revenues was primarily attributable to record assets in fee-based accounts and higher brokerage revenues, largely driven by equity market appreciation and the net addition of financial advisors.
“With our continued focus on supporting, retaining and attracting high-quality financial advisors, we generated a solid net increase in the number of financial advisors during the quarter,” said Reilly. “Recruiting activity remains strong across all of our affiliation options, as prospective advisors continue to be attracted to our advisor- and client-focused culture, leading technology solutions, and robust product and service offerings.”
Capital Markets
• Quarterly net revenues of $433 million, up 49% over the prior year’s fiscal second quarter and down 4% compared to the preceding quarter
• Quarterly pre-tax income of $105 million, up 275% over the prior year’s fiscal second quarter and down 19% compared to the preceding quarter
• Quarterly investment banking revenues of $226 million, up 65% over the prior year’s fiscal second quarter and down 11% compared to the preceding quarter
• Record quarterly brokerage revenues of $176 million, up 35% over the prior year’s fiscal second quarter and 2% over the preceding quarter
Record brokerage revenues were driven by continued strength in fixed income brokerage revenues which increased 58% over the prior-year period and 8% over the preceding quarter. While lower than the record set in the preceding quarter, investment banking revenues grew 65% over the prior-year period primarily driven by record equity underwriting revenues and strong M&A revenues.
“The strong investment banking results reflect the significant investments made over the past several years to deepen and expand our platform,” said Reilly. “At quarter-end, we completed the previously-announced acquisition of Financo, further strengthening our M&A capabilities with its extensive expertise and relationships in the consumer sector. We are excited to welcome the Financo team to the Raymond James family.”
RAYMOND JAMES FINANCIAL, INC. Fiscal Second Quarter of 2021
Please refer to the footnotes at the end of this press release for additional information.2

Asset Management
• Record quarterly net revenues of $209 million, up 14% over the prior year’s fiscal second quarter and 7% over the preceding quarter
• Record quarterly pre-tax income of $87 million, up 19% over the prior year’s fiscal second quarter and 5% over the preceding quarter
• Record financial assets under management of $178.2 billion, up 39% over March 2020 and 5% over December 2020
Record quarterly results were primarily attributable to growth of financial assets under management driven by equity market appreciation and net inflows into fee-based accounts in the Private Client Group. Carillon Tower Advisers also generated significant net inflows during the quarter.
Raymond James Bank
• Quarterly net revenues of $160 million, down 24% compared to the prior year’s fiscal second quarter and 4% compared to the preceding quarter
• Quarterly pre-tax income of $111 million, up 693% compared to the prior year’s fiscal second quarter and 56% over the preceding quarter
• Record net loans of $22.9 billion, up 5% over March 2020 and 4% over December 2020 • Net interest margin (NIM) of 1.94% for the quarter, down 108 basis points compared to the prior
year’s fiscal second quarter and 8 basis points compared to the preceding quarter
Quarterly net revenues declined 24% compared to the prior year’s fiscal second quarter primarily due to the impact of lower short-term interest rates. Pre-tax income growth was primarily due to the $32 million loan loss reserve release in the quarter compared to provision for credit losses in both comparative periods.
The Bank’s NIM declined 8 basis points during the quarter to 1.94%, largely due to the growth of the agency-backed securities portfolio. Nonperforming assets remained low at 0.09% of total assets. Net charge-offs of $2 million were related to opportunistic loan sales in the quarter. The bank loan loss benefit was largely attributable to improving macroeconomic conditions. The bank loan allowance for credit losses as a percent of total loans ended the quarter at 1.50%.
Other
In the fiscal second quarter, the firm repurchased 500,000 shares for $60 million, an average price of approximately $120 per share, leaving $680 million available under the authorization as of April 28, 2021. At the end of the quarter, the total capital ratio was 24.7% and the tier 1 leverage ratio was 12.2%, both well above the regulatory requirements.
A conference call to discuss the results will take place tomorrow morning, Thursday, April 29, at 8:15 a.m. ET. The live audio webcast, and the presentation which management will review on the call, will be available at www.raymondjames.com/investor-relations/financial-information/quarterly-earnings. For a listen-only connection to the conference call, please dial: 800-757-5680 (conference code: 21993654). An audio replay of the call will be available at the same location until June 30, 2021.
About Raymond James Financial, Inc.
Raymond James Financial, Inc. (NYSE: RJF) is a leading diversified financial services company providing private client group, capital markets, asset management, banking and other services to individuals, corporations and municipalities. The company has approximately 8,300 financial advisors. Total client assets are $1.09 trillion. Public since 1983, the firm is listed on the New York Stock Exchange under the symbol RJF. Additional information is available at www.raymondjames.com.
RAYMOND JAMES FINANCIAL, INC. Fiscal Second Quarter of 2021
Please refer to the footnotes at the end of this press release for additional information.3

Summary results of operations
Three months ended % change from
$ in millions, except per share amountsMarch 31,
2021March 31,
2020December 31,
2020March 31,
2020December 31,
2020Net revenues $ 2,372 $ 2,068 $ 2,222 15% 7%Pre-tax income $ 447 $ 239 $ 399 87% 12%Net income $ 355 $ 169 $ 312 110% 14%
Earnings per common share: (2)
Basic $ 2.58 $ 1.22 $ 2.27 111% 14%Diluted $ 2.51 $ 1.20 $ 2.23 109% 13%
Non-GAAP measures: (1)
Adjusted pre-tax income NA NA $ 401 NA 11%Adjusted net income NA NA $ 314 NA 13%Adjusted earnings per common share -
basic (2) NA NA $ 2.29 NA 13%Adjusted earnings per common share -
diluted (2) NA NA $ 2.24 NA 12%
Six months ended
$ in millions, except per share amountsMarch 31,
2021March 31,
2020 % changeNet revenues $ 4,594 $ 4,077 13%Pre-tax income $ 846 $ 598 41%Net income $ 667 $ 437 53%
Earnings per common share: (2)
Basic $ 4.85 $ 3.15 54%Diluted $ 4.74 $ 3.09 53%
Non-GAAP measures: (1)
Adjusted pre-tax income $ 848 NA 42%Adjusted net income $ 669 NA 53%Adjusted earnings per common share - basic (2) $ 4.87 NA 55%Adjusted earnings per common share - diluted (2) $ 4.76 NA 54%
RAYMOND JAMES FINANCIAL, INC. Fiscal Second Quarter of 2021
Selected Financial Highlights(Unaudited)
Please refer to the footnotes at the end of this press release for additional information.4

Consolidated Statements of Income (Unaudited)
Three months ended % change from
in millions, except per share amountsMarch 31,
2021March 31,
2020December 31,
2020March 31,
2020December 31,
2020Revenues:Asset management and related administrative fees $ 1,173 $ 1,006 $ 1,067 17% 10%Brokerage revenues:
Securities commissions 443 410 381 8% 16%Principal transactions 148 105 147 41% 1%
Total brokerage revenues 591 515 528 15% 12%Account and service fees 159 172 145 (8)% 10%Investment banking 242 148 261 64% (7)%Interest income 200 285 203 (30)% (1)%Other (3) 44 (15) 56 NM (21)%
Total revenues 2,409 2,111 2,260 14% 7%Interest expense (37) (43) (38) (14)% (3)%
Net revenues 2,372 2,068 2,222 15% 7%Non-interest expenses:Compensation, commissions and benefits 1,648 1,422 1,500 16% 10%Non-compensation expenses:
Communications and information processing 107 99 99 8% 8%Occupancy and equipment 57 56 57 2% —Business development 21 41 23 (49)% (9)%Investment sub-advisory fees 31 26 28 19% 11%Professional fees 24 23 30 4% (20)%Bank loan provision/(benefit) for credit losses (4) (32) 109 14 NM NMAcquisition-related expenses (5) — — 2 — (100)%Other (3) 69 53 70 30% (1)%
Total non-compensation expenses 277 407 323 (32)% (14)%Total non-interest expenses 1,925 1,829 1,823 5% 6%
Pre-tax income 447 239 399 87% 12%Provision for income taxes 92 70 87 31% 6%Net income $ 355 $ 169 $ 312 110% 14%
Earnings per common share – basic (2) $ 2.58 $ 1.22 $ 2.27 111% 14%Earnings per common share – diluted (2) $ 2.51 $ 1.20 $ 2.23 109% 13%Weighted-average common shares outstanding –
basic 137.8 138.4 136.8 — 1%Weighted-average common and common equivalent
shares outstanding – diluted 141.2 141.1 139.7 — 1%
RAYMOND JAMES FINANCIAL, INC. Fiscal Second Quarter of 2021
Please refer to the footnotes at the end of this press release for additional information.5

Consolidated Statements of Income (Unaudited)
Six months ended
in millions, except per share amountsMarch 31,
2021March 31,
2020 % changeRevenues:Asset management and related administrative fees $ 2,240 $ 1,961 14%Brokerage revenues:
Securities commissions 824 773 7%Principal transactions 295 202 46%
Total brokerage revenues 1,119 975 15%Account and service fees 304 350 (13)%Investment banking 503 289 74%Interest income 403 582 (31)%Other (3) 100 14 614%
Total revenues 4,669 4,171 12%Interest expense (75) (94) (20)%
Net revenues 4,594 4,077 13%Non-interest expenses:Compensation, commissions and benefits 3,148 2,773 14%Non-compensation expenses:
Communications and information processing 206 193 7%Occupancy and equipment 114 113 1%Business development 44 85 (48)%Investment sub-advisory fees 59 52 13%Professional fees 54 44 23%Bank loan provision/(benefit) for credit losses (4) (18) 107 NMAcquisition-related expenses (5) 2 — NMOther (3) 139 112 24%
Total non-compensation expenses 600 706 (15)%Total non-interest expenses 3,748 3,479 8%
Pre-tax income 846 598 41%Provision for income taxes 179 161 11%Net income $ 667 $ 437 53%
Earnings per common share – basic (2) $ 4.85 $ 3.15 54%Earnings per common share – diluted (2) $ 4.74 $ 3.09 53%Weighted-average common shares outstanding – basic 137.3 138.4 (1)%Weighted-average common and common equivalent shares outstanding – diluted 140.4 141.3 (1)%
RAYMOND JAMES FINANCIAL, INC. Fiscal Second Quarter of 2021
Please refer to the footnotes at the end of this press release for additional information.6

As of % change from
$ in millions, except per share amountsMarch 31,
2021March 31,
2020December 31,
2020March 31,
2020December 31,
2020Total assets $ 56,066 $ 49,809 $ 53,657 13% 4%Total equity attributable to Raymond James
Financial, Inc. $ 7,592 $ 6,798 $ 7,363 12% 3%Book value per share (6) $ 55.34 $ 49.69 $ 53.59 11% 3%Tangible book value per share (1) (6) $ 49.42 $ 45.50 $ 47.93 9% 3%
Capital ratios:Tier 1 capital 23.6 % (7) 24.1 % 23.4 %Total capital 24.7 % (7) 25.3 % 24.6 %Tier 1 leverage 12.2 % (7) 14.2 % 12.9 %
Three months ended Six months endedMarch 31,
2021March 31,
2020December 31,
2020March 31,
2021March 31,
2020Return on equity (8) 19.0 % 9.9 % 17.2 % 18.1 % 13.0 %Adjusted return on equity (1) (8) NA NA 17.3 % 18.2 % NAReturn on tangible common equity (1) (8) 21.2 % 10.8 % 19.0 % 20.1 % 14.2 %Adjusted return on tangible common equity (1) (8) NA NA 19.1 % 20.2 % NAPre-tax margin (9) 18.8 % 11.6 % 18.0 % 18.4 % 14.7 %Adjusted pre-tax margin (1) (9) NA NA 18.0 % 18.5 % NATotal compensation ratio (10) 69.5 % 68.8 % 67.5 % 68.5 % 68.0 %Effective tax rate 20.6 % 29.3 % 21.8 % 21.2 % 26.9 %
Client asset metrics ($ in billions) As of % change fromMarch 31,
2021March 31,
2020December 31,
2020March 31,
2020December 31,
2020Client assets under administration $ 1,085.4 $ 773.9 $ 1,024.8 40% 6%Private Client Group assets under administration $ 1,028.1 $ 734.0 $ 974.2 40% 6%Private Client Group assets in fee-based accounts $ 567.6 $ 383.5 $ 532.7 48% 7%Financial assets under management $ 178.2 $ 128.2 $ 169.6 39% 5%
Clients’ domestic cash sweep balances ($ in millions) As of % change from
March 31,2021
March 31,2020
December 31,2020
March 31,2020
December 31,2020
Raymond James Bank Deposit Program (“RJBDP”): (11)
Raymond James Bank $ 28,174 $ 28,711 $ 26,697 (2)% 6%Third-party banks 25,110 20,379 26,142 23% (4)%
Subtotal RJBDP 53,284 49,090 52,839 9% 1%Client Interest Program 9,517 3,782 8,769 152% 9%
Total clients’ domestic cash sweep balances $ 62,801 $ 52,872 $ 61,608 19% 2%
Three months ended Six months endedMarch 31,
2021March 31,
2020December 31,
2020March 31,
2021March 31,
2020Average yield on RJBDP - third-party banks (12) 0.30 % 1.33 % 0.31 % 0.31 % 1.48 %
Private Client Group financial advisors As of % change fromMarch 31,
2021March 31,
2020December 31,
2020March 31,
2020December 31,
2020Employees 3,375 3,376 3,387 — —Independent contractors 4,952 4,772 4,846 4% 2%
Total advisors 8,327 8,148 8,233 2% 1%
RAYMOND JAMES FINANCIAL, INC. Consolidated Selected Key MetricsFiscal Second Quarter of 2021 (Unaudited)
Please refer to the footnotes at the end of this press release for additional information.7

The following tables present our consolidated average interest-earning asset and interest-bearing liability balances, interest income and expense and the related rates.
Consolidated Net Interest Three months ended March 31, 2021 March 31, 2020 December 31, 2020
$ in millionsAveragebalance Interest
Annualized average
rateAveragebalance Interest
Annualized average
rateAveragebalance Interest
Annualized average
rate
Interest-earning assets:
Cash and cash equivalents $ 5,284 $ 2 0.20 % $ 4,601 $ 16 1.40 % $ 5,712 $ 4 0.25 %
Assets segregated pursuant to regulations 10,087 5 0.18 % 2,820 11 1.64 % 5,816 3 0.21 %
Available-for-sale securities 7,997 21 1.08 % 3,443 19 2.28 % 7,478 23 1.21 %
Brokerage client receivables 2,222 19 3.36 % 2,366 21 3.57 % 2,082 18 3.48 %
Bank loans, net of unearned income and deferred expenses:
Loans held for investment:
Commercial and industrial (“C&I”) loans (13) 7,540 48 2.56 % 8,017 81 3.99 % 7,535 51 2.63 %
Commercial real estate (“CRE”) loans (13) 2,665 17 2.54 % 2,620 26 3.93 % 2,582 17 2.59 %
Real estate investment trust (“REIT”) loans (13) 1,309 8 2.50 % 1,322 12 3.69 % 1,235 8 2.43 %
Tax-exempt loans (14) 1,227 8 3.35 % 1,212 8 3.36 % 1,237 8 3.35 %
Residential mortgage loans 5,005 34 2.72 % 4,847 38 3.13 % 5,001 35 2.77 %
Securities-based loans and other 4,638 26 2.23 % 3,469 31 3.60 % 4,286 25 2.29 %
Loans held for sale 177 1 1.89 % 142 2 3.85 % 141 1 2.94 %
Total bank loans, net 22,561 142 2.56 % 21,629 198 3.67 % 22,017 145 2.62 %
All other interest-earning assets 2,201 11 1.87 % 2,487 20 2.96 % 2,288 10 2.00 %
Total interest-earning assets $ 50,352 $ 200 1.61 % $ 37,346 $ 285 3.06 % $ 45,393 $ 203 1.78 %
Interest-bearing liabilities:
Bank deposits:
Savings, money market and Negotiable Order of Withdrawal accounts $ 27,662 $ 2 0.02 % $ 22,877 $ 6 0.12 % $ 26,637 $ 1 0.02 %
Certificates of deposit 898 4 1.88 % 1,094 6 2.03 % 952 5 1.93 %
Total bank deposits 28,560 6 0.08 % 23,971 12 0.21 % 27,589 6 0.09 %
Brokerage client payables 11,485 1 0.02 % 3,827 3 0.35 % 7,324 1 0.06 %
Other borrowings 862 5 2.18 % 895 5 2.23 % 866 5 2.19 %
Senior notes payable 2,045 24 4.80 % 1,556 19 4.74 % 2,045 24 4.70 %
All other interest-bearing liabilities 600 1 0.88 % 911 4 1.82 % 574 2 1.14 %
Total interest-bearing liabilities $ 43,552 $ 37 0.34 % $ 31,160 $ 43 0.56 % $ 38,398 $ 38 0.39 %
Net interest income $ 163 $ 242 $ 165
RAYMOND JAMES FINANCIAL, INC. Consolidated Net InterestFiscal Second Quarter of 2021 (Unaudited)
Please refer to the footnotes at the end of this press release for additional information.8

Consolidated Net Interest Six months ended March 31, 2021 March 31, 2020
$ in millionsAveragebalance Interest
Annualized average
rateAveragebalance Interest
Annualized average
rate
Interest-earning assets:
Cash and cash equivalents $ 5,500 $ 6 0.23 % $ 4,227 $ 33 1.55 %
Assets segregated pursuant to regulations 7,954 8 0.19 % 2,583 22 1.75 %
Available-for-sale securities 7,735 44 1.14 % 3,265 37 2.29 %
Brokerage client receivables 2,152 37 3.42 % 2,402 48 4.04 %
Bank loans, net of unearned income and deferred expenses:
Loans held for investment:
C&I loans (13) 7,537 99 2.60 % 8,039 167 4.07 %
CRE loans (13) 2,623 34 2.56 % 2,572 53 4.04 %
REIT loans (13) 1,272 16 2.47 % 1,330 25 3.77 %
Tax-exempt loans (14) 1,232 16 3.35 % 1,218 16 3.36 %
Residential mortgage loans 5,003 69 2.75 % 4,743 75 3.16 %
Securities-based loans and other 4,460 51 2.26 % 3,403 65 3.78 %
Loans held for sale 159 2 2.36 % 151 3 3.97 %
Total bank loans, net 22,286 287 2.59 % 21,456 404 3.76 %
All other interest-earning assets 2,247 21 1.93 % 2,511 38 2.89 %
Total interest-earning assets $ 47,874 $ 403 1.69 % $ 36,444 $ 582 3.19 %
Interest-bearing liabilities:
Bank deposits:
Savings, money market and Negotiable Order of Withdrawal accounts $ 27,144 $ 3 0.02 % $ 22,260 $ 18 0.16 %
Certificates of deposit 925 9 1.90 % 937 10 2.10 %
Total bank deposits 28,069 12 0.08 % 23,197 28 0.24 %
Brokerage client payables 9,403 2 0.04 % 3,513 6 0.40 %
Other borrowings 864 10 2.21 % 894 10 2.23 %
Senior notes payable 2,045 48 4.75 % 1,553 37 4.71 %
All other interest-bearing liabilities 587 3 1.01 % 1,023 13 2.02 %
Total interest-bearing liabilities $ 40,968 $ 75 0.36 % $ 30,180 $ 94 0.61 %
Net interest income $ 328 $ 488
RAYMOND JAMES FINANCIAL, INC. Consolidated Net InterestFiscal Second Quarter of 2021 (Unaudited)
Please refer to the footnotes at the end of this press release for additional information.9

Three months ended % change from
$ in millionsMarch 31,
2021March 31,
2020December 31,
2020March 31,
2020December 31,
2020Net revenues:
Private Client Group $ 1,647 $ 1,495 $ 1,467 10% 12%Capital Markets 433 290 452 49% (4)%Asset Management 209 184 195 14% 7%Raymond James Bank 160 210 167 (24)% (4)%Other (3) (15) (12) (44) 4 73% NMIntersegment eliminations (65) (67) (63) NM NM
Total net revenues $ 2,372 $ 2,068 $ 2,222 15% 7%
Pre-tax income/(loss):Private Client Group $ 192 $ 170 $ 140 13% 37%Capital Markets 105 28 129 275% (19)%Asset Management 87 73 83 19% 5%Raymond James Bank 111 14 71 693% 56%Other (3) (5) (15) (48) (46) (24) (4)% (100)%
Pre-tax income $ 447 $ 239 $ 399 87% 12%
Six months ended
$ in millionsMarch 31,
2021March 31,
2020 % changeNet revenues:
Private Client Group $ 3,114 $ 2,909 7%Capital Markets 885 558 59%Asset Management 404 368 10%Raymond James Bank 327 426 (23)%Other (3) (15) (8) (52) 85%Intersegment eliminations (128) (132) NM
Total net revenues $ 4,594 $ 4,077 13%
Pre-tax income/(loss):Private Client Group $ 332 $ 323 3%Capital Markets 234 57 311%Asset Management 170 146 16%Raymond James Bank 182 149 22%Other (3) (5) (15) (72) (77) 6%
Pre-tax income $ 846 $ 598 41%
RAYMOND JAMES FINANCIAL, INC. Segment ResultsFiscal Second Quarter of 2021 (Unaudited)
Please refer to the footnotes at the end of this press release for additional information.10
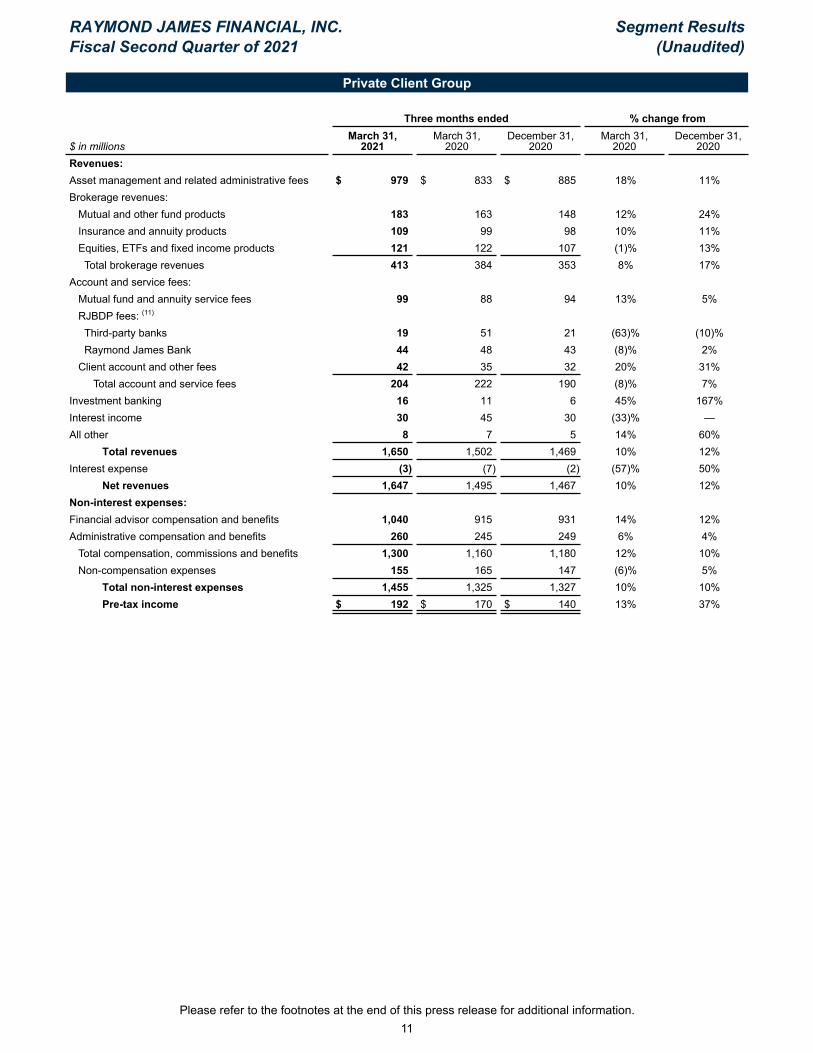
Private Client Group
Three months ended % change from
$ in millionsMarch 31,
2021March 31,
2020December 31,
2020March 31,
2020December 31,
2020Revenues: Asset management and related administrative fees $ 979 $ 833 $ 885 18% 11%Brokerage revenues:
Mutual and other fund products 183 163 148 12% 24%Insurance and annuity products 109 99 98 10% 11%Equities, ETFs and fixed income products 121 122 107 (1)% 13%
Total brokerage revenues 413 384 353 8% 17%Account and service fees:
Mutual fund and annuity service fees 99 88 94 13% 5%RJBDP fees: (11)
Third-party banks 19 51 21 (63)% (10)%Raymond James Bank 44 48 43 (8)% 2%
Client account and other fees 42 35 32 20% 31%Total account and service fees 204 222 190 (8)% 7%
Investment banking 16 11 6 45% 167%Interest income 30 45 30 (33)% —All other 8 7 5 14% 60%
Total revenues 1,650 1,502 1,469 10% 12%Interest expense (3) (7) (2) (57)% 50%
Net revenues 1,647 1,495 1,467 10% 12%Non-interest expenses: Financial advisor compensation and benefits 1,040 915 931 14% 12%Administrative compensation and benefits 260 245 249 6% 4%
Total compensation, commissions and benefits 1,300 1,160 1,180 12% 10%Non-compensation expenses 155 165 147 (6)% 5%
Total non-interest expenses 1,455 1,325 1,327 10% 10%Pre-tax income $ 192 $ 170 $ 140 13% 37%
RAYMOND JAMES FINANCIAL, INC. Segment ResultsFiscal Second Quarter of 2021 (Unaudited)
Please refer to the footnotes at the end of this press release for additional information.11

Private Client Group
Six months ended
$ in millionsMarch 31,
2021March 31,
2020 % changeRevenues: Asset management and related administrative fees $ 1,864 $ 1,615 15%Brokerage revenues:
Mutual and other fund products 331 307 8%Insurance and annuity products 207 200 4%Equities, ETFs and fixed income products 228 224 2%
Total brokerage revenues 766 731 5%Account and service fees:
Mutual fund and annuity service fees 193 178 8%RJBDP fees: (11)
Third-party banks 40 109 (63)%Raymond James Bank 87 95 (8)%
Client account and other fees 74 64 16%Total account and service fees 394 446 (12)%
Investment banking 22 22 —Interest income 60 94 (36)%All other 13 16 (19)%
Total revenues 3,119 2,924 7%Interest expense (5) (15) (67)%
Net revenues 3,114 2,909 7%Non-interest expenses: Financial advisor compensation and benefits 1,971 1,772 11%Administrative compensation and benefits 509 492 3%
Total compensation, commissions and benefits 2,480 2,264 10%Non-compensation expenses 302 322 (6)%
Total non-interest expenses 2,782 2,586 8%Pre-tax income $ 332 $ 323 3%
RAYMOND JAMES FINANCIAL, INC. Segment ResultsFiscal Second Quarter of 2021 (Unaudited)
Please refer to the footnotes at the end of this press release for additional information.12

Capital Markets
Three months ended % change from
$ in millionsMarch 31,
2021March 31,
2020December 31,
2020March 31,
2020December 31,
2020Revenues: Brokerage revenues:
Fixed income $ 142 $ 90 $ 131 58% 8%Equity 34 40 42 (15)% (19)%
Total brokerage revenues 176 130 173 35% 2%Investment banking:
Merger & acquisition and advisory 122 72 149 69% (18)%Equity underwriting 67 43 60 56% 12%Debt underwriting 37 22 46 68% (20)%
Total investment banking 226 137 255 65% (11)%Interest income 5 10 3 (50)% 67%Tax credit fund revenues 24 12 16 100% 50%All other 4 7 7 (43)% (43)%
Total revenues 435 296 454 47% (4)%Interest expense (2) (6) (2) (67)% —
Net revenues 433 290 452 49% (4)%Non-interest expenses:Compensation, commissions and benefits 259 184 252 41% 3%Non-compensation expenses 69 78 71 (12)% (3)%
Total non-interest expenses 328 262 323 25% 2%Pre-tax income $ 105 $ 28 $ 129 275% (19)%
Six months ended
$ in millionsMarch 31,
2021March 31,
2020 % changeRevenues: Brokerage revenues:
Fixed income $ 273 $ 171 60%Equity 76 74 3%
Total brokerage revenues 349 245 42%Investment banking:
Merger & acquisition and advisory 271 132 105%Equity underwriting 127 82 55%Debt underwriting 83 53 57%
Total investment banking 481 267 80%Interest income 8 18 (56)%Tax credit fund revenues 40 30 33%All other 11 10 10%
Total revenues 889 570 56%Interest expense (4) (12) (67)%
Net revenues 885 558 59%Non-interest expenses:Compensation, commissions and benefits 511 350 46%Non-compensation expenses 140 151 (7)%
Total non-interest expenses 651 501 30%Pre-tax income $ 234 $ 57 311%
RAYMOND JAMES FINANCIAL, INC. Segment ResultsFiscal Second Quarter of 2021 (Unaudited)
Please refer to the footnotes at the end of this press release for additional information.13

Asset Management
Three months ended % change from
$ in millionsMarch 31,
2021March 31,
2020December 31,
2020March 31,
2020December 31,
2020Revenues:Asset management and related administrative fees:
Managed programs $ 137 $ 124 $ 129 10% 6%Administration and other 64 53 59 21% 8%
Total asset management and related administrative fees 201 177 188 14% 7%
Account and service fees 5 4 4 25% 25%All other 3 3 3 — —
Net revenues 209 184 195 14% 7%Non-interest expenses:Compensation, commissions and benefits 50 45 45 11% 11%Non-compensation expenses 72 66 67 9% 7%
Total non-interest expenses 122 111 112 10% 9%Pre-tax income $ 87 $ 73 $ 83 19% 5%
Six months ended
$ in millionsMarch 31,
2021March 31,
2020 % changeRevenues:Asset management and related administrative fees:
Managed programs $ 266 $ 249 7%Administration and other 123 104 18%
Total asset management and related administrative fees 389 353 10%Account and service fees 9 9 —All other 6 6 —
Net revenues 404 368 10%Non-interest expenses:Compensation, commissions and benefits 95 90 6%Non-compensation expenses 139 132 5%
Total non-interest expenses 234 222 5%Pre-tax income $ 170 $ 146 16%
RAYMOND JAMES FINANCIAL, INC. Segment ResultsFiscal Second Quarter of 2021 (Unaudited)
Please refer to the footnotes at the end of this press release for additional information.14

Raymond James Bank
Three months ended % change from
$ in millionsMarch 31,
2021March 31,
2020December 31,
2020March 31,
2020December 31,
2020Revenues:Interest income $ 165 $ 223 $ 168 (26)% (2)%Interest expense (10) (18) (11) (44)% (9)%
Net interest income 155 205 157 (24)% (1)%All other 5 5 10 — (50)%
Net revenues 160 210 167 (24)% (4)%Non-interest expenses:Compensation and benefits 13 13 12 — 8%Non-compensation expenses:
Bank loan provision/(benefit) for credit losses (4) (32) 109 14 NM NMRJBDP fees to Private Client Group (11) 44 48 43 (8)% 2%All other 24 26 27 (8)% (11)%
Total non-compensation expenses 36 183 84 (80)% (57)%Total non-interest expenses 49 196 96 (75)% (49)%Pre-tax income $ 111 $ 14 $ 71 693% 56%
Six months ended
$ in millionsMarch 31,
2021March 31,
2020 % changeRevenues:Interest income $ 333 $ 454 (27)%Interest expense (21) (39) (46)%
Net interest income 312 415 (25)%All other 15 11 36%
Net revenues 327 426 (23)%Non-interest expenses:Compensation and benefits 25 25 —Non-compensation expenses:
Bank loan provision/(benefit) for credit losses (4) (18) 107 NMRJBDP fees to Private Client Group (11) 87 95 (8)%All other 51 50 2%
Total non-compensation expenses 120 252 (52)%Total non-interest expenses 145 277 (48)%Pre-tax income $ 182 $ 149 22%
RAYMOND JAMES FINANCIAL, INC. Segment ResultsFiscal Second Quarter of 2021 (Unaudited)
Please refer to the footnotes at the end of this press release for additional information.15

Other
Three months ended % change from
$ in millionsMarch 31,
2021March 31,
2020December 31,
2020March 31,
2020December 31,
2020Revenues:Interest income $ 3 $ 12 $ 3 (75)% —Gains/(losses) on private equity investments (3) 8 (39) 24 NM (67)%All other 2 — 1 NM 100%
Total revenues 13 (27) 28 NM (54)%Interest expense (25) (17) (24) 47% 4%
Net revenues (12) (44) 4 73% NMNon-interest expenses:Compensation and all other (3) 36 2 26 1,700% 38%Acquisition-related expenses (5) — — 2 — (100)%
Total non-interest expenses 36 2 28 1,700% 29%Pre-tax loss $ (48) $ (46) $ (24) (4)% (100)%
Six months ended
$ in millionsMarch 31,
2021March 31,
2020 % changeRevenues:Interest income $ 6 $ 24 (75)%Gains/(losses) on private equity investments (3) 32 (41) NMAll other 3 2 50%
Total revenues 41 (15) NMInterest expense (49) (37) 32%
Net revenues (8) (52) 85%Non-interest expenses:Compensation and all other (3) 62 25 148%Acquisition-related expenses (5) 2 — NM
Total non-interest expenses 64 25 156%Pre-tax loss $ (72) $ (77) 6%
RAYMOND JAMES FINANCIAL, INC. Segment ResultsFiscal Second Quarter of 2021 (Unaudited)
Please refer to the footnotes at the end of this press release for additional information.16

The following metrics are attributable to our banking subsidiary Raymond James Bank, N.A. which is a component of our Raymond James Bank segment.
As of % change from
$ in millionsMarch 31,
2021March 31,
2020December 31,
2020March 31,
2020December 31,
2020Total assets $ 33,221 $ 33,656 $ 31,580 (1)% 5%Total equity $ 2,409 $ 2,263 $ 2,364 6% 2%Bank loans, net $ 22,879 $ 21,788 $ 21,957 5% 4%Bank loan allowance for credit losses (4) $ 345 $ 324 $ 378 6% (9)%Bank loan allowance for credit losses as a % of
loans held for investment (4) 1.50 % 1.47 % 1.71 %Total nonperforming assets $ 31 $ 27 $ 28 15% 11%Nonperforming assets as a % of total assets 0.09 % 0.08 % 0.09 %Total criticized loans $ 1,001 $ 387 $ 899 159% 11%Criticized loans as a % of loans held for
investment 4.35 % 1.76 % 4.06 %
Capital ratios:Tier 1 capital 13.1 % (7) 12.7 % 13.1 %Total capital 14.4 % (7) 13.9 % 14.4 %Tier 1 leverage 7.5 % (7) 8.1 % 7.5 %
Three months ended % change from
$ in millionsMarch 31,
2021March 31,
2020December 31,
2020March 31,
2020December 31,
2020Bank loan provision/(benefit) for credit losses (4) $ (32) $ 109 $ 14 NM NM
Net charge-offs:Charge-offs related to loan sales $ 2 $ — $ — NM NMAll other — — — — —
Total net charge-offs $ 2 $ — $ — NM NM
Net interest margin (net yield on interest-earning assets) 1.94 % 3.02 % 2.02 %
Six months ended
$ in millionsMarch 31,
2021March 31,
2020 % changeBank loan provision/(benefit) for credit losses (4) $ (18) $ 107 NM
Net charge-offs:Charge-offs related to loan sales $ 2 $ — NMAll other — — —
Total net charge-offs $ 2 $ — NM
Net interest margin (net yield on interest-earning assets) 1.98 % 3.12 %
RAYMOND JAMES FINANCIAL, INC. Raymond James Bank Selected Key MetricsFiscal Second Quarter of 2021 (Unaudited)
Please refer to the footnotes at the end of this press release for additional information.17

Reconciliation of non-GAAP financial measures to GAAP financial measures
We utilize certain non-GAAP financial measures as additional measures to aid in, and enhance, the understanding of our financial results and related measures. These non-GAAP financial measures have been separately identified in this document. We believe certain of these non-GAAP financial measures provides useful information to management and investors by excluding certain material items that may not be indicative of our core operating results. We utilize these non-GAAP financial measures in assessing the financial performance of the business, as they facilitate a comparison of current- and prior-period results. We believe that return on tangible common equity and tangible book value per share are meaningful to investors as they facilitate comparisons of our results to the results of other companies. In the following tables, the tax effect of non-GAAP adjustments reflects the statutory rate associated with each non-GAAP item. These non-GAAP financial measures should be considered in addition to, and not as a substitute for, measures of financial performance prepared in accordance with GAAP. In addition, our non-GAAP financial measures may not be comparable to similarly titled non-GAAP financial measures of other companies. The following tables provide a reconciliation of non-GAAP financial measures to the most directly comparable GAAP measures for those periods which include non-GAAP adjustments.
Three months ended Six months ended
$ in millions, except per share amountsDecember 31,
2020March 31,
2021Net income $ 312 $ 667 Non-GAAP adjustments:Acquisition-related expenses (5) 2 2 Pre-tax impact of non-GAAP adjustments 2 2 Tax effect of non-GAAP adjustments — — Total non-GAAP adjustments, net of tax 2 2 Adjusted net income $ 314 $ 669
Pre-tax income $ 399 $ 846 Pre-tax impact of non-GAAP adjustments (as detailed above) 2 2 Adjusted pre-tax income $ 401 $ 848
Pre-tax margin (9) 18.0 % 18.4 %Adjusted pre-tax margin (9) 18.0 % 18.5 %
Earnings per common share: (2)
Basic $ 2.27 $ 4.85 Adjusted basic $ 2.29 $ 4.87 Diluted $ 2.23 $ 4.74 Adjusted diluted $ 2.24 $ 4.76
RAYMOND JAMES FINANCIAL, INC. Non-GAAP Financial MeasuresFiscal Second Quarter of 2021 (Unaudited)
Please refer to the footnotes at the end of this press release for additional information.18

Reconciliation of non-GAAP financial measures to GAAP financial measures(Continued from previous page)
Book value per share As of
$ in millions, except per share amountsMarch 31,
2021March 31,
2020December 31,
2020Total equity attributable to Raymond James Financial, Inc. $ 7,592 $ 6,798 $ 7,363 Less non-GAAP adjustments:Goodwill and identifiable intangible assets, net 868 603 834 Deferred tax liabilities, net (56) (30) (56) Tangible common equity attributable to Raymond James Financial, Inc. $ 6,780 $ 6,225 $ 6,585 Common shares outstanding 137.2 136.8 137.4 Book value per share (6) $ 55.34 $ 49.69 $ 53.59 Tangible book value per share (6) $ 49.42 $ 45.50 $ 47.93
Return on equity Three months ended Six months ended
$ in millionsMarch 31,
2021March 31,
2020December 31,
2020March 31,
2021March 31,
2020Average equity (16) $ 7,478 $ 6,820 $ 7,239 $ 7,356 $ 6,740 Impact on average equity of non-GAAP adjustments:Acquisition-related expenses (5) NA NA 1 1 NAAdjusted average equity (16) NA NA $ 7,240 $ 7,357 NA
Average equity (16) $ 7,478 $ 6,820 $ 7,239 $ 7,356 $ 6,740 Less:Average goodwill and identifiable intangible assets, net 851 606 717 767 608 Average deferred tax liabilities, net (56) (31) (45) (49) (30) Average tangible common equity (16) $ 6,683 $ 6,245 $ 6,567 $ 6,638 $ 6,162 Impact on average equity of non-GAAP adjustments:Acquisition-related expenses (5) NA NA 1 1 NAAdjusted average tangible common equity (16) NA NA $ 6,568 $ 6,639 NA
Return on equity (8) 19.0 % 9.9 % 17.2 % 18.1 % 13.0 %Adjusted return on equity (8) NA NA 17.3 % 18.2 % NAReturn on tangible common equity (8) 21.2 % 10.8 % 19.0 % 20.1 % 14.2 %Adjusted return on tangible common equity (8) NA NA 19.1 % 20.2 % NA
RAYMOND JAMES FINANCIAL, INC. Non-GAAP Financial MeasuresFiscal Second Quarter of 2021 (Unaudited)
Please refer to the footnotes at the end of this press release for additional information.19

Footnotes
(1) These are non-GAAP financial measures. See the schedules on the previous pages for a reconciliation of non-GAAP financial measures to the most directly comparable GAAP measures and for more information on these measures. As there were no non-GAAP adjustments to earnings for the three months ended March 31, 2021, percent changes for earnings-related non-GAAP financial measures are calculated based on GAAP results for the three months ended March 31, 2021 as compared to non-GAAP results for the three months ended December 31, 2020. In addition, as there were no non-GAAP adjustments to earnings for the six months ended March 31, 2020, percent changes for earnings-related non-GAAP financial measures are calculated based on non-GAAP results for the six months ended March 31, 2021 as compared to GAAP results for the six months ended March 31, 2020.
(2) Earnings per common share is computed by dividing net income (less allocation of earnings and dividends to participating securities) by weighted-average common shares outstanding (basic or diluted as applicable) for each respective period or, in the case of adjusted earnings per common share, computed by dividing adjusted net income (less allocation of earnings and dividends to participating securities) by weighted-average common shares outstanding (basic or diluted as applicable) for each respective period.
(3) Other revenues included $8 million of private equity valuation gains, $39 million of private equity valuation losses, and $24 million of private equity gains for the three months ended March 31, 2021, March 31, 2020 and December 31, 2020, respectively, which were included in our Other segment. Of these amounts, an insignificant amount of the gains for the three months ended March 31, 2021, $22 million of the losses for three months ended March 31, 2020 and $10 million of the gains for the three months ended December 31, 2020 were attributable to noncontrolling interests and were offset in Other expenses. Other revenues included $32 million of private equity valuation gains and $41 million of private equity valuation losses for the six months ended March 31, 2021 and 2020, respectively, which were included in our Other segment. Of these amounts, $10 million of the gains for the six months ended March 31, 2021 and $23 million of the losses for the six months ended March 31, 2020 were attributable to noncontrolling interests and were offset in Other expenses.
(4) The allowance for credit losses as of March 31, 2021 was determined under the current expected credit loss (“CECL”) model as a result of our October 1, 2020 adoption of new accounting guidance related to the measurement of credit losses on financial instruments. The impact of adoption on October 1, 2020 resulted in an increase in our allowance for credit losses, including reserves for unfunded lending commitments, of approximately $45 million (primarily $25 million related to loans to financial advisors in the Private Client Group and approximately $10 million related to Bank loans outstanding) and a corresponding reduction in retained earnings of approximately $35 million, net of tax. The Bank loan provision/(benefit) for credit losses of $(32) million and $14 million for the three months ended March 31, 2021 and December 31, 2020, respectively, and $(18) million for the six months ended March 31, 2021, were determined under the CECL model and represented the provision/(benefit) for credit losses post the CECL adoption date.
(5) The three months ended December 31, 2020 and the six months ended March 31, 2021 included expenses in our Other segment associated with our acquisition of NWPS Holdings, Inc. and its wholly-owned subsidiaries, which was completed in December 2020, as well as our acquisition of Financo which was completed in March 2021.
(6) Book value per share is computed by dividing total equity attributable to Raymond James Financial, Inc. by the number of common shares outstanding at the end of each respective period or, in the case of tangible book value per share, computed by dividing tangible common equity by the number of common shares outstanding at the end of each respective period. Tangible common equity is defined as total equity attributable to Raymond James Financial, Inc. less goodwill and intangible assets, net of related deferred taxes.
(7) Estimated.
(8) Return on equity is computed by dividing annualized net income by average equity for each respective period or, in the case of return on tangible common equity, computed by dividing annualized net income by average tangible common equity for each respective period. Adjusted return on equity is computed by dividing annualized adjusted net income by adjusted average equity for each respective period, or in the case of adjusted return on tangible common equity, computed by dividing annualized adjusted net income by adjusted average tangible common equity for each respective period.
(9) Pre-tax margin is computed by dividing pre-tax income by net revenues for each respective period or, in the case of adjusted pre-tax margin, computed by dividing adjusted pre-tax income by net revenues for each respective period.
(10) Total compensation ratio is computed by dividing compensation, commissions and benefits expense by net revenues for each respective period.
(11) We earn fees from RJBDP, a multi-bank sweep program in which clients’ cash deposits in their brokerage accounts are swept into interest-bearing deposit accounts at Raymond James Bank and various third-party banks. Fees earned by Private Client Group on Raymond James Bank deposits are eliminated in consolidation.
(12) Average yield on RJBDP - third-party banks is computed by dividing annualized RJBDP fees - third-party banks, which are net of the interest expense paid to clients by the third-party banks, by the average daily RJBDP balances at third-party banks.
(13) As a result of our adoption of CECL, we have redefined certain of our loan portfolio segments to align with the new methodology applied in determining the allowance for credit losses, including the combination of the CRE and CRE construction loan portfolios and the separation of loans to REITs into a separate portfolio segment (previously included in CRE loans and C&I loans). Prior period loan portfolio segments have been revised to conform to the current presentation.
(14) The average yield is presented on a tax-equivalent basis for each respective period.
(15) The Other segment includes the results of our private equity investments, interest income on certain corporate cash balances, and certain corporate overhead costs of Raymond James Financial, Inc., including the interest costs on our public debt.
(16) Average equity is computed by adding the total equity attributable to Raymond James Financial, Inc. as of the date indicated to the prior quarter-end total, and dividing by two, or in the case of average tangible common equity, computed by adding tangible common equity as of the date indicated to the prior quarter-end total, and dividing by two. For the year-to-date period, average equity is computed by adding the total equity attributable to Raymond James Financial, Inc. as of each quarter-end date during the indicated period to the beginning of year total, and dividing by three, or in the case of average tangible common equity, computed by adding tangible common equity as of each quarter-end date during the indicated period to the beginning of year total, and dividing by three. Adjusted average equity is computed by adjusting for the impact on average equity of the non-GAAP adjustments, as applicable for each respective period. Adjusted average tangible common equity is computed by adjusting for the impact on average tangible common equity of the non-GAAP adjustments, as applicable for each respective period.
RAYMOND JAMES FINANCIAL, INC. Fiscal Second Quarter of 2021
20