raw lc-ms data is processed in xcms online. the xcms … · statistical analysis based on user...
TRANSCRIPT
Supplementary Figure 1
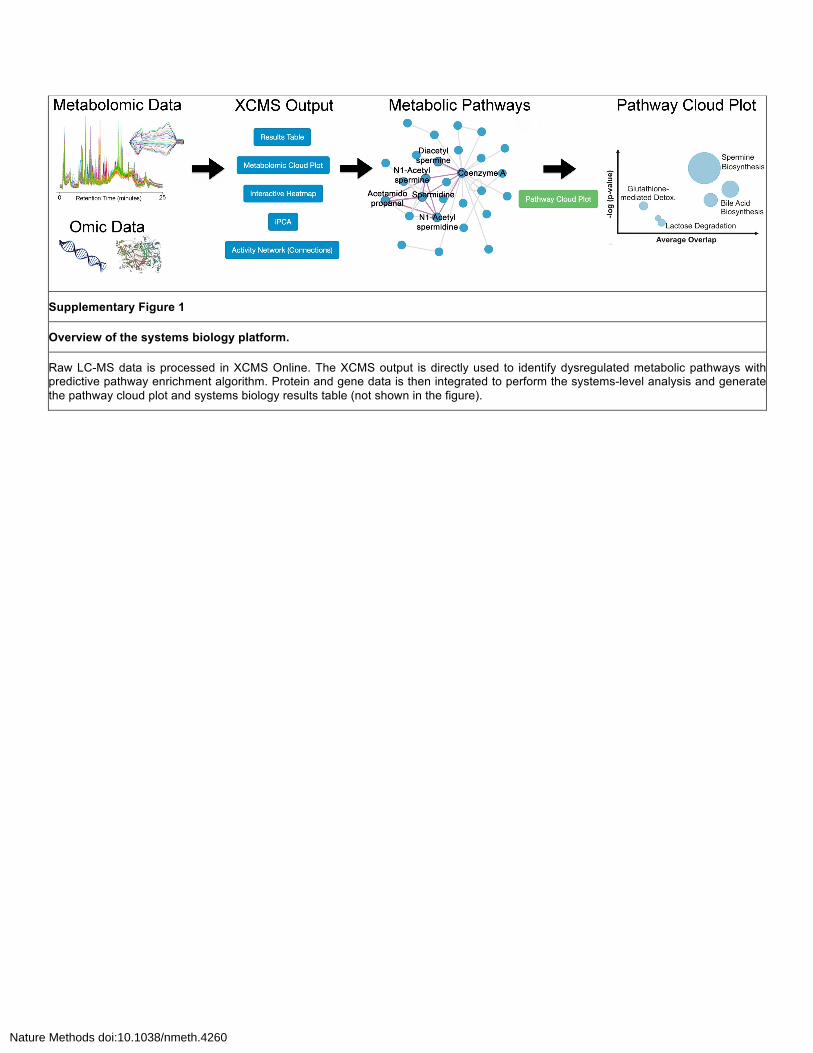
Overview of the systems biology platform.
Raw LC-MS data is processed in XCMS Online. The XCMS output is directly used to identify dysregulated metabolic pathways with predictive pathway enrichment algorithm. Protein and gene data is then integrated to perform the systems-level analysis and generate the pathway cloud plot and systems biology results table (not shown in the figure).
Nature Methods doi:10.1038/nmeth.4260
Supplementary Figure 2
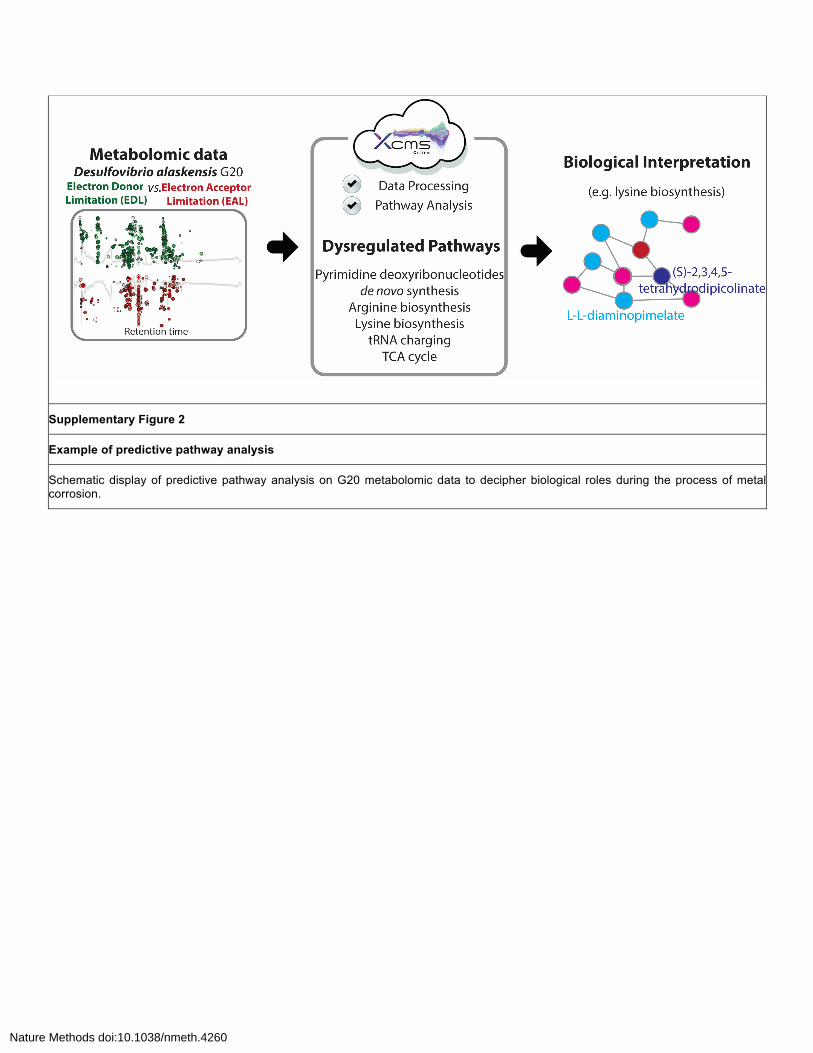
Example of predictive pathway analysis
Schematic display of predictive pathway analysis on G20 metabolomic data to decipher biological roles during the process of metal corrosion.
Nature Methods doi:10.1038/nmeth.4260
Supplementary Figure 3
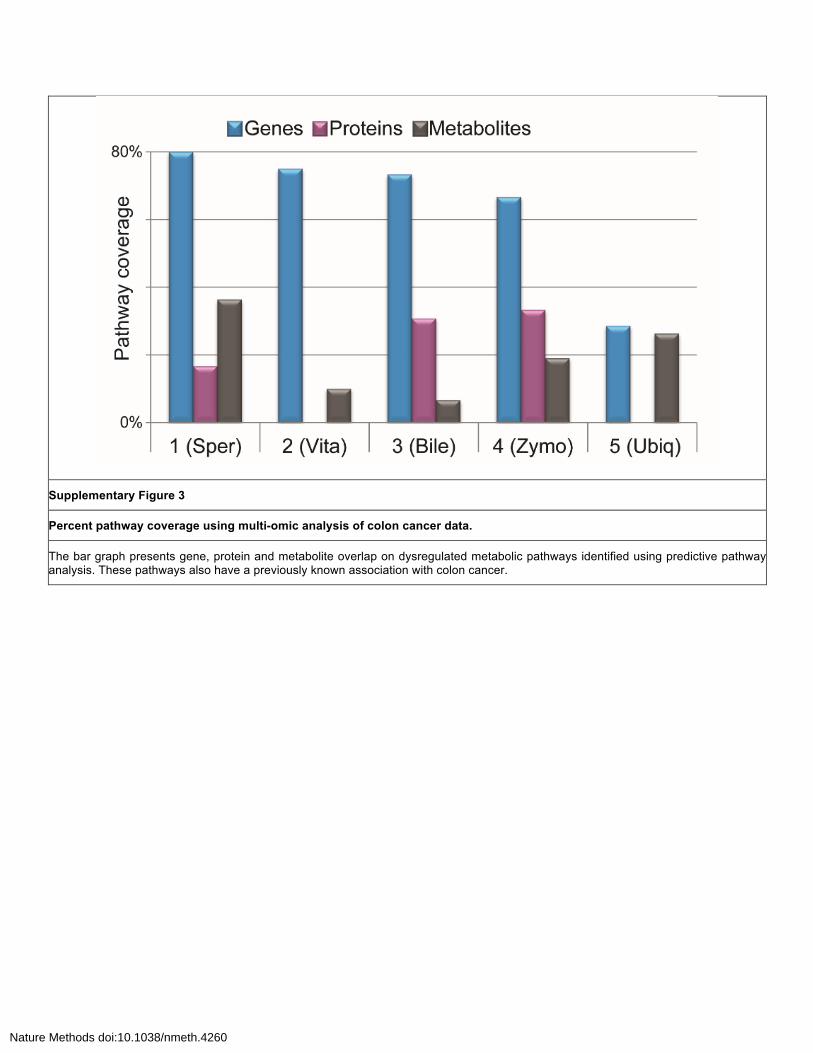
Percent pathway coverage using multi-omic analysis of colon cancer data.
The bar graph presents gene, protein and metabolite overlap on dysregulated metabolic pathways identified using predictive pathway analysis. These pathways also have a previously known association with colon cancer.
Nature Methods doi:10.1038/nmeth.4260
Supplementary Figure 4
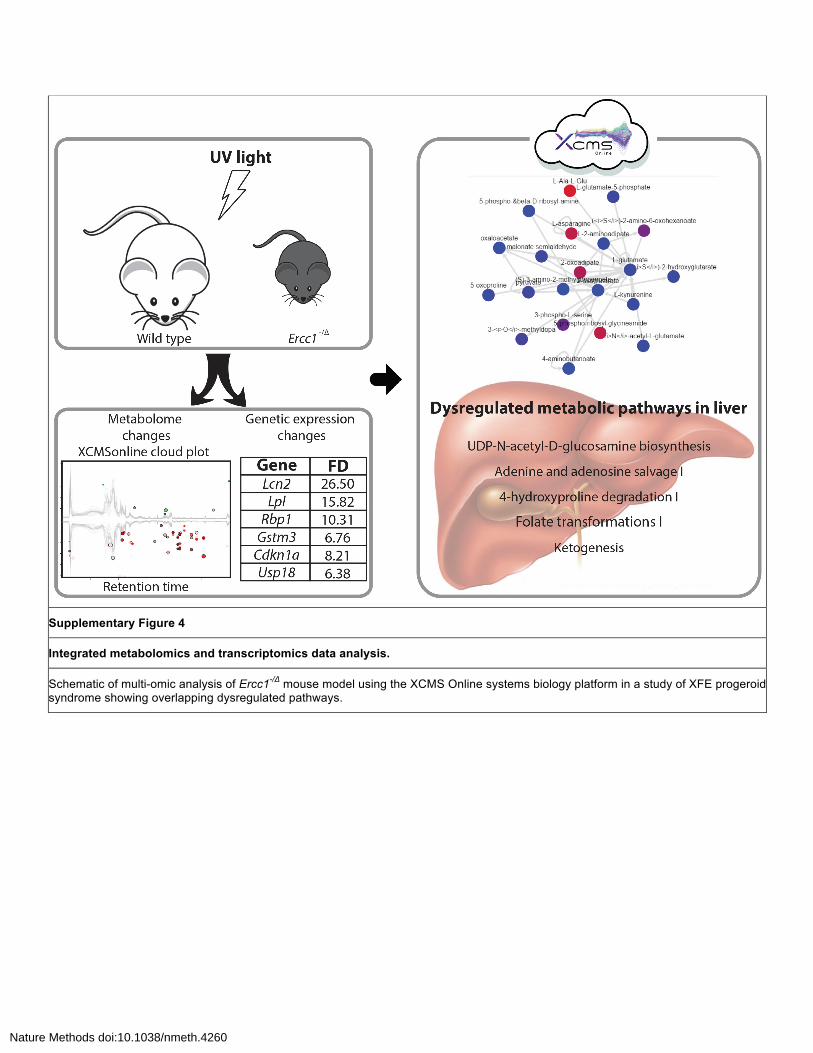
Integrated metabolomics and transcriptomics data analysis.
Schematic of multi-omic analysis of Ercc1-/Δ mouse model using the XCMS Online systems biology platform in a study of XFE progeroid syndrome showing overlapping dysregulated pathways.
Nature Methods doi:10.1038/nmeth.4260
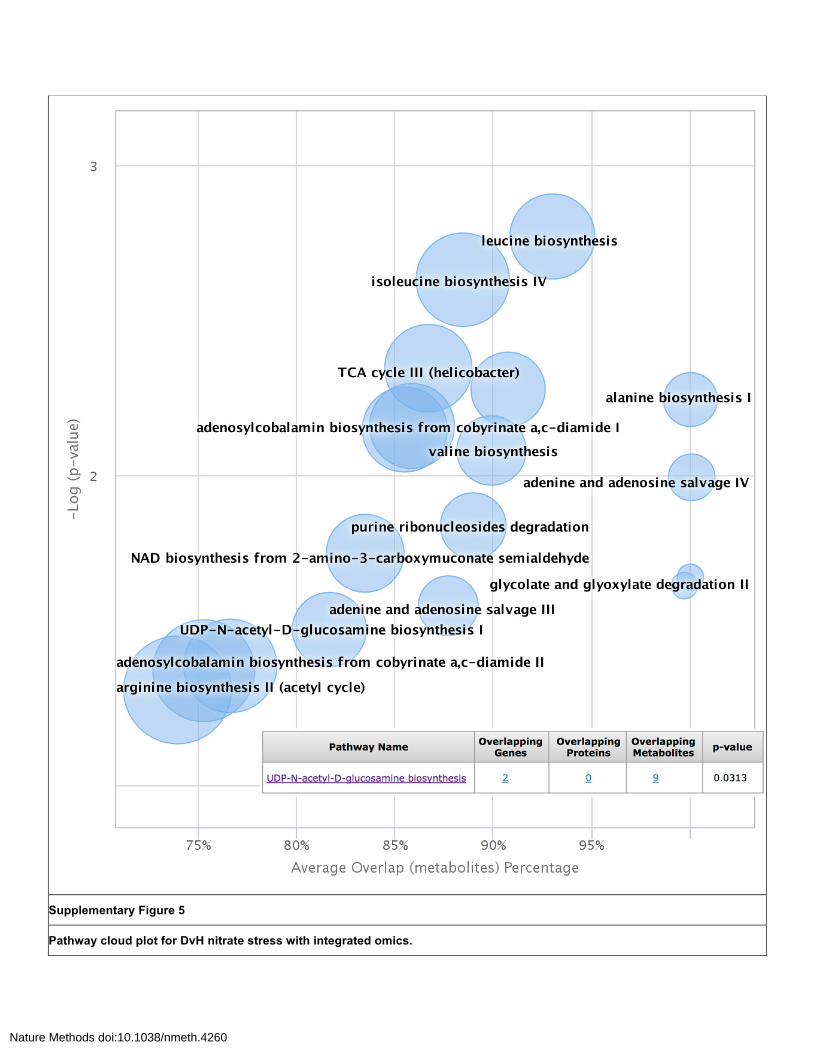
Supplementary Figure 5
Pathway cloud plot for DvH nitrate stress with integrated omics.
Nature Methods doi:10.1038/nmeth.4260

Plot focuses on p-value < 0.05 illustrating 18 dysregulated pathways and three overlapping genes leuA (leucine biosynthesis), glmU and glmS (UDP-N-acetyl-D-glucosamine biosynthesis). Pathways are plotted as a function of FET pathway significance versus average metabolic pathway overlap, with the radius of the circle representing the size of the metabolic pathway. Significantly dysregulated pathways appear in the upper right-hand quadrant of the plot. Each circle presents overlapping gene, protein and metabolite data when cursor is hovered over, as demonstrated for UDP-N-acetyl-D-glucosamine biosynthesis pathway. Clicking on these table features gives additional specific pathway, gene, protein and metabolite information.
Nature Methods doi:10.1038/nmeth.4260
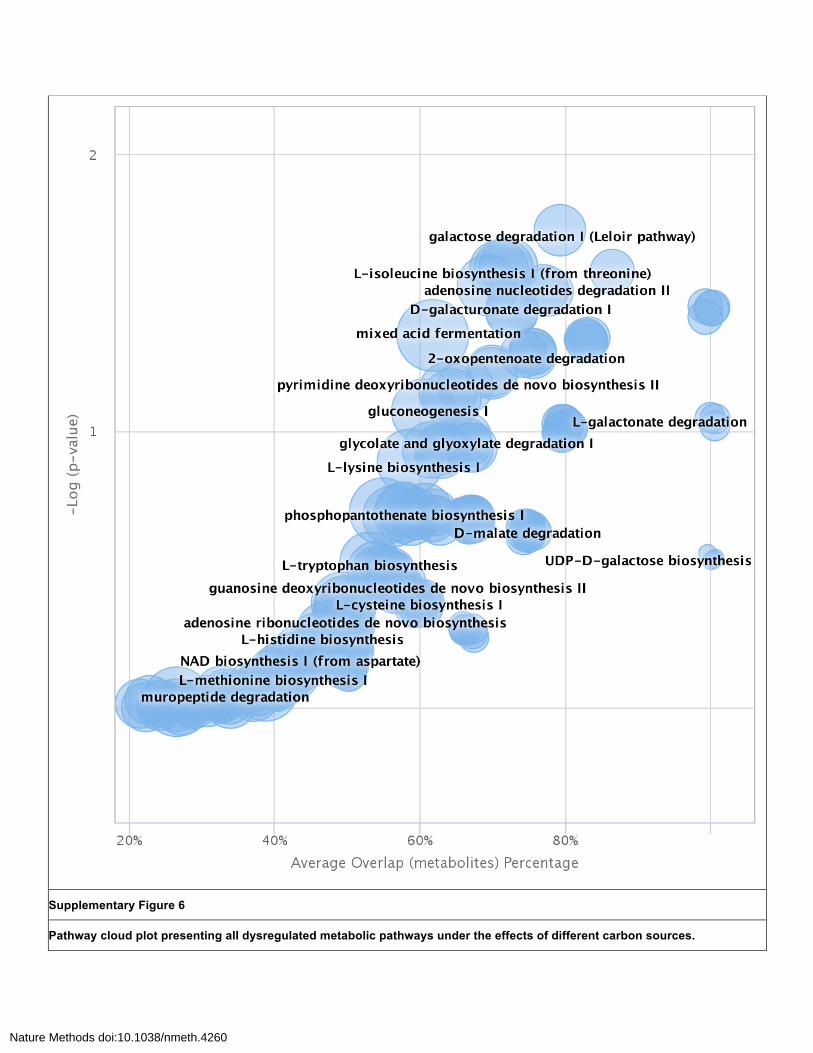
Supplementary Figure 6
Pathway cloud plot presenting all dysregulated metabolic pathways under the effects of different carbon sources.
Nature Methods doi:10.1038/nmeth.4260

Here a total overview of the pathway cloud plot is presented to illustrate the all the identified pathways ranging from 0.0055 < p-value < 1. Significance of the pathway overlap (-log(p-value)) versus the percent overlap of the metabolites found in each pathway shows dysregulated features of greater interest in the upper right-hand quadrant of the plot. The radius of the circles represents the overall size of the metabolic pathway.
Nature Methods doi:10.1038/nmeth.4260
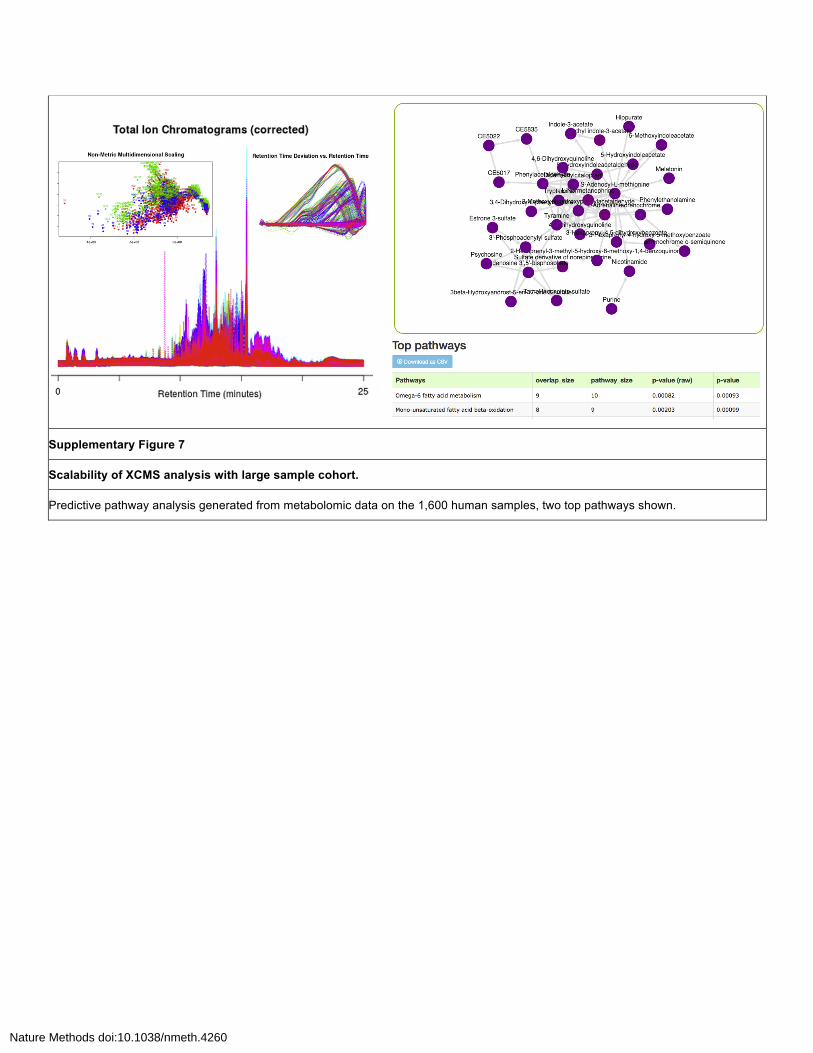
Supplementary Figure 7
Scalability of XCMS analysis with large sample cohort.
Predictive pathway analysis generated from metabolomic data on the 1,600 human samples, two top pathways shown.
Nature Methods doi:10.1038/nmeth.4260
Supplementary Methods
XCMS Systems Biology Platform Development and Multi-Omic Workflow
The metabolomics guided multi-omic workflow (Supplementary Figure 1) builds upon XCMS
analysis of metabolomics data to identify connections between metabolites, dysregulated pathways and
overlapping genes and proteins involved in those pathways. Multi-omic analysis can be performed in
pairwise, multi-group and meta XCMS jobs. Data files are uploaded into individual sample class
datasets in order to perform retention time correction, peak alignment, feature selection and univariate
statistical analysis based on user defined p-value (default = 0.01), generating a results table of
significantly dysregulated features, which is then used to metabolic network and pathway analysis
followed by multi-omic analysis with uploaded gene and/or protein data. Detailed video instructions are
provided on how to use XCMS systems biology platform, including pathway analysis and integrated
omics (https://xcmsonline.scripps.edu/landing_page.php?pgcontent=institute) as well as Pathway Cloud
Plot (https://xcmsonline.scripps.edu/landing_page.php?pgcontent=institute). Complete documentation
and instructions on how to use XCMS Online are provided
(https://xcmsonline.scripps.edu/landing_page.php?pgcontent=documentation). The code for all the
mentioned algorithms and computer programs are currently not available.
Metabolite Pathway Analysis
The mummichog algorithm1 has been improved for use with XCMS including additional
visualizations of the network results. In brief, the algorithm takes the accurate mass of significant
metabolites from the results table and uses a Fisher’s exact test (FET) to assess the significance of the
pathways with p-values, which can be specified for any of the >7600 metabolic models available on
XCMS. Meanwhile, a list of permutation features (equal length to the significant metabolite list) is
generated by randomly sampling of the results table and used to calculate the p-values for all the
pathways. This step is repeated to calculate a cumulative distribution function, which is used to adjust
the p-value per pathway calculated from the significant list.
Integrated Omics
Following the prediction of enriched metabolic pathways, the user uploads a list of significant
genes and/or proteins from transcriptomic and proteomic data to perform multi-scale omics analysis.
Differentially expressed gene and protein data should be in the form of a comma separated (.csv) or tab
separated (.tsv) file and data format should be in gene name (gene or protein data) and UniProt accession
ID (protein data). The integrated omics analysis on XCMS Online then performs gene/protein matching
onto the previously predicted pathways. A matching algorithm was developed in our lab to perform the
Nature Methods doi:10.1038/nmeth.4260
analysis. Gene and protein data are uploaded in tab separated value format using gene symbol accession
IDs for genes and either gene symbol or Uniprot accession IDs for proteins. The user defines the type of
list and runs the matching sub-job. The matching algorithm reads the user input data and known
pathway associated data in the format of strings and considers it a match if the strings are identical. The
matched genes and/or proteins are displayed and compared with the total number of associated genes
and/or proteins to obtain pathway overlap. Once the integrated omics job is completed, the result will be
presented in a table, showing both the overlapped and total number of gene/protein/metabolite for each
pathway. A web link is provided for each overlap/total number to list the detailed
genes/proteins/metabolites. Further, clicking each listed gene/protein/metabolite links to database
sources for more information (gene information from BioCyc, protein information from UniProt, and
metabolite information from KEGG and METLIN). Each pathway also has a web link connected to
BioCyc that allows the user to view more detailed information about the pathway.
Pathway Cloud Plot
Once the pathway prediction and/or multi-omic overlap analysis is completed, a multi-omic
cloud plot is generated to provide simple visualization of all the dysregulated metabolic pathways in a
single plot. Statistical significance of the pathway match is plotted versus the percent pathway overlap;
the trend towards significant pathways with more coverage are in the upper right-hand quadrant and the
radius of the bubble represents the size of pathway in terms of its metabolites. The bubble size can be
adjusted to present the best plot view by tuning the bar on the top right side of the plot. Clicking the
bubble allows the user to see a table of the overlapped genes, proteins and metabolites, linking to
database sources for more information. The user can also adjust the p-value threshold on the top left side
of the plot to refine and display only certain pathways with their p-values smaller than the threshold.
Databases Queried
Species-specific pathway information was archived from BioCyc (version 19.5 – 20.0) together
with their associated genes, proteins, and metabolites. For pathway analysis, the metabolite information
queries BioCyc. For multi-omic integration, Uniprot is archived to get the correlations between Uniprot
protein accession IDs and BioCyc protein accession IDs so that the user can upload protein data with
either Uniprot or BioCyc formats. In the display of pathway/multi-omic analysis, detailed gene/protein
information is from BioCyc and metabolite information is from both KEGG and METLIN. Currently,
over 7600 metabolic species are provided in the platform
(https://xcmsonline.scripps.edu/pathway/biosources.php). These pathway databases are organized into
tiers according to the amount of manual review and updating they have received. Among them, Tier 1
(http://biocyc.org/biocyc-pgdb-list.shtml#tier1) databases have been created through intensive manual
efforts and received at least a year of literature-based curation. In comparison, Tier 2 and Tier 3
Nature Methods doi:10.1038/nmeth.4260
databases (http://biocyc.org/biocyc-pgdb-list.shtml#tier2) contain computational predicted metabolic
pathways and underwent less than one year of literature-based curation (typically 1-4 months). Data are
stored in a relational database management system and accessed with structured query language
(SQL). The user interface of the analytical platform was programmed in PHP, HTML5, and JavaScript.
Once the user uploads transcriptomic and/or proteomic data, sub jobs are created to search against the
same identified pathways to tabulate the overlapping genes and proteins by pathway. The background
processing can be monitored by the users with log files available to confirm the job has processed
correctly. Distinct genes and proteins are counted after removing duplicates and are displayed on the
pathway summary table. Total genes and proteins are counted provided they occur at least once in the
pathway of interest.
Nature Methods doi:10.1038/nmeth.4260
Supplementary Note
Below we describe seven examples of the new XCMS Online workflow for performing systems
biology using predictive pathway analysis and integrated omics. All examples include predictive
pathway analysis, which is now performed automatically after XCMS metabolomic data processing for
retention time alignment, peak picking and statistical analysis. Additional examples are presented with
transcriptomic and proteomic data integration. As XCMS Online continues to grow, so does the demand
for processing power. To illustrate the scalability of this workflow, we also present an example on a
large dataset containing a 1600 samples.
S1. Progenitor Cell Proliferation Study Multiple sclerosis is a demyelinating disease in which the insulating covers of nerve cells in the
brain and spinal cord are progressively damaged. Previous studies have revealed that the primary
mechanism of multiple sclerosis involves the failure of the precursor oligodendrocyte cells (OPCs) to
proliferate and differentiate, which further leads to the defect of its remyelination2. In this study, OPC
differentiation is investigated on a metabolomics level to understand its molecular mechanisms, which
potentially allows to identify active small molecules to promote the myelination of the OPCs.
Cell culture and global metabolomics.
Rat primary optic nerve OPCs were isolated by panning (>99% A2B5+) and cultured in poly-D-
lysine (10 mg⋅mL-1) coated tissue culture dishes in OPC culture media (Neurobasal Media, Invitrogen)
supplemented with B27-without vitamin A (Invitrogen), non-essential amino acids, L-glutamine,
penicillin/streptomycin, β-mercaptoethanol and PDGF-AA (50 ng⋅mL-1; Peprotech)) at 37°C with 5%
CO2. The culture medium was replaced every 48h and cells were collected before the confluency
reached 60% to maintain a naive state. For differentiation, OPCs with 1.7 × 10⁵ cells/well were plated in
differentiation media (Neurobasal Media (Invitrogen) supplemented with B27-without vitamin A
(Invitrogen), non-essential amino acids, L-glutamine and PDGF-AA (2 ng⋅mL-1; Peprotech)).
Triiodothyronine (T3) and DMSO were used as the positive and negative controls, respectively. Cells
were collected at different times for in vitro myelination and metabolomics studies.
Cells incubated in the differentiation medium were collected at day 6 for both the T3 and DMSO
treated OPC. The cells were rinsed twice with PBS to completely remove the culture medium and then
scraped into a 1.5 mL Eppendorf vial using 500–1000 μL PBS. Subsequently, the cells were collected by
aspirating the supernatant after centrifugation at 12,000 rpm at 4°C for 15 min. The metabolites were
extracted from cell pellets by a methanol:acetonitrile:water (2:2:1, v/v) solvent mixture. A volume of
600 μL of cold solvent was added to each pellet, vortexed for 30 s, and soaked in liquid nitrogen for 1
Nature Methods doi:10.1038/nmeth.4260
min. The samples were then allowed to thaw at room temperature and then sonicated for 10 min. This
freeze-thaw process was repeated for additional 2X. To further precipitate proteins, the samples were
incubated for 1 h at −20°C, followed by centrifugation at 16,000 × g and 4°C for 15 min. The protein
concentrations of the cell pellets were measured after centrifugation using a bicinchoninic acid assay
(BCA assay). The resulting supernatant was removed and evaporated to dryness in a vacuum
concentrator (LABCONCO CentriVap Benchtop). The dry extracts were then reconstituted in the
appropriate volume of acetonitrile/water (1:1, v/v), normalized by the protein concentration with the
lowest concentration approximately 50 μL, sonicated for 10 min, and centrifuged for 15 min at 16,000 ×
g and 4°C to remove insoluble debris. The supernatants were transferred to HPLC vials with inserts and
stored at −80°C prior to LC-MS analysis.
Cell extracts were analyzed on a 6550 iFunnel QTOF mass spectrometer (Agilent Technologies)
coupled with a 1290 UPLC system (Agilent Technologies). HPLC was carried out on a Luna NH2,
3 μm, 150 mm × 1.0 mm I.D. HILIC column (Phenomenex). The mobile phase was composed of A = 20
mM ammonium acetate and 40 mM ammonium hydroxide in 95% water (v/v) and B = 95% acetonitrile.
The remaining 5% components were either acetonitrile or water, respectively. A linear gradient from
100% B (0–5 min) to 100% A (50–55 min) was applied. A 10 min re-equilibration time was applied to
the HILIC column for re-equilibration and maintenance of reproducibility. The flow rate was 50 μL/min,
and the sample injection volume was 5 μL. Electrospray ionization source conditions were set as
follows: dry gas temperature, 200 °C; flow, 11 L/min, fragmentor, 380 V; sheath gas temperature, 300
°C; flow, 9 L/min; nozzle voltage, 500 V; capillary voltage, −500 V in ESI negative mode. The
instrument was set to acquire data over the m/z range 50–1000, with the MS acquisition rate of 1
spectra/s. The sample sequence was randomized to avoid systematic decreases in signals over sample
sets. For the MS/MS of selected precursors, the default isolation width was set as narrow (∼1.3 m/z),
with MS acquisition rate set at 2 spectra/s and MS/MS acquisition at 2 spectra/s to acquire over the m/z
range 50–1000 and 25–1000; respectively. MS/MS data were acquired at the collision energy of 20 V.
LC-MS data were converted to mzXML files using MassHunter Acquisition Software (Agilent
MassHunter 6.0B). The mzXML files were uploaded to XCMS Online for data processing including
peak detection, retention time correction, profile alignment, and isotope annotation. Data were processed
using both pairwise and multigroup comparison and the parameter settings were as follows: centWave
for feature detection (Δ m/z = 15 ppm, minimum peak width = 10 s, and maximum peak width = 60 s);
obiwarp settings for retention time correction (profStep = 0.5); parameters for chromatogram alignment,
including mzwid = 0.015, minfrac = 0.5, and bw = 5. The relative quantification of metabolite features
was based on extracted ion chromatogram (EIC) areas. Paired parametric two-way t-test and one-way
ANOVA (post hoc Tukey test) were used to test the variation pattern of metabolite features between and
Nature Methods doi:10.1038/nmeth.4260
across cell samples collected at different times after being treated with T3 and DMSO. Multigroup
analysis and pairwise comparisons between DMSO and T3 at individual incubation times were
conducted. The results output, including EICs, pairwise/multigroup cloud plot, multidimensional scaling
plots, and principle components were exported directly from XCMS Online. Generally, the numbers of
total pairwise dysregulated features and significantly altered features (statistically defined as p < 0.01,
including both upregulated and downregulated features) were reported in this study.
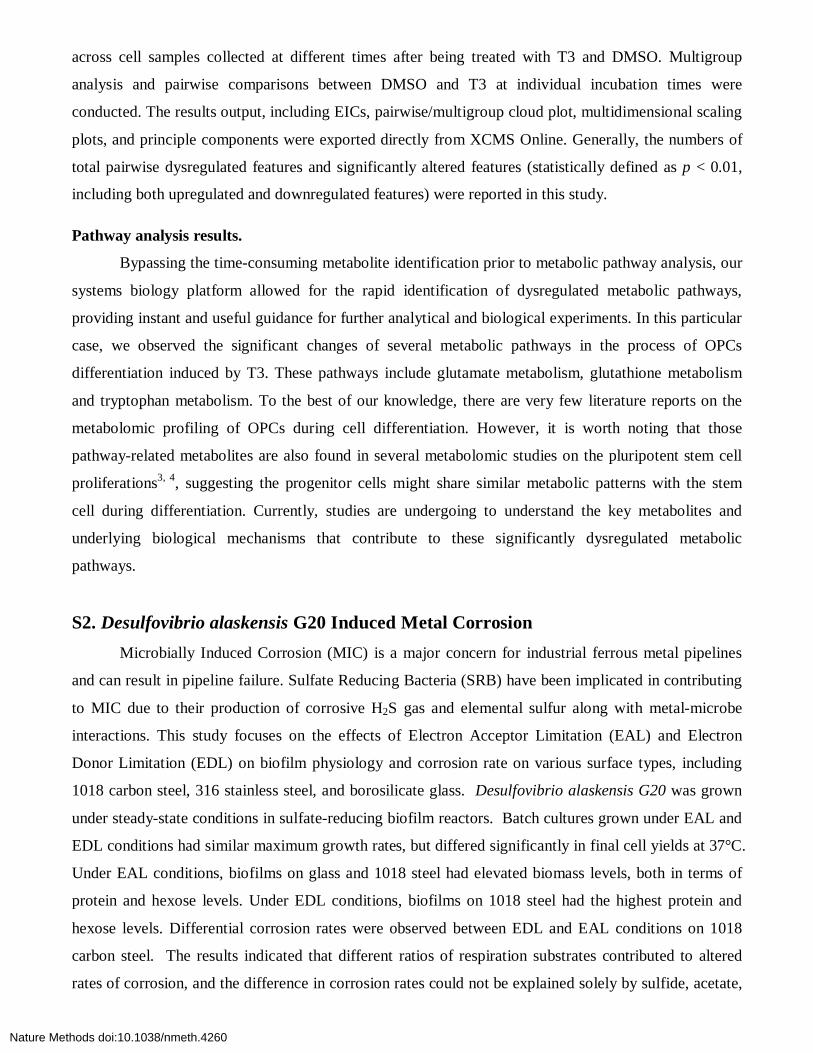
Pathway analysis results.
Bypassing the time-consuming metabolite identification prior to metabolic pathway analysis, our
systems biology platform allowed for the rapid identification of dysregulated metabolic pathways,
providing instant and useful guidance for further analytical and biological experiments. In this particular
case, we observed the significant changes of several metabolic pathways in the process of OPCs
differentiation induced by T3. These pathways include glutamate metabolism, glutathione metabolism
and tryptophan metabolism. To the best of our knowledge, there are very few literature reports on the
metabolomic profiling of OPCs during cell differentiation. However, it is worth noting that those
pathway-related metabolites are also found in several metabolomic studies on the pluripotent stem cell
proliferations3, 4, suggesting the progenitor cells might share similar metabolic patterns with the stem
cell during differentiation. Currently, studies are undergoing to understand the key metabolites and
underlying biological mechanisms that contribute to these significantly dysregulated metabolic
pathways.
S2. Desulfovibrio alaskensis G20 Induced Metal Corrosion Microbially Induced Corrosion (MIC) is a major concern for industrial ferrous metal pipelines
and can result in pipeline failure. Sulfate Reducing Bacteria (SRB) have been implicated in contributing
to MIC due to their production of corrosive H2S gas and elemental sulfur along with metal-microbe
interactions. This study focuses on the effects of Electron Acceptor Limitation (EAL) and Electron
Donor Limitation (EDL) on biofilm physiology and corrosion rate on various surface types, including
1018 carbon steel, 316 stainless steel, and borosilicate glass. Desulfovibrio alaskensis G20 was grown
under steady-state conditions in sulfate-reducing biofilm reactors. Batch cultures grown under EAL and
EDL conditions had similar maximum growth rates, but differed significantly in final cell yields at 37°C.
Under EAL conditions, biofilms on glass and 1018 steel had elevated biomass levels, both in terms of
protein and hexose levels. Under EDL conditions, biofilms on 1018 steel had the highest protein and
hexose levels. Differential corrosion rates were observed between EDL and EAL conditions on 1018
carbon steel. The results indicated that different ratios of respiration substrates contributed to altered
rates of corrosion, and the difference in corrosion rates could not be explained solely by sulfide, acetate,
Nature Methods doi:10.1038/nmeth.4260
or carbohydrate levels. Protecting the 1018 metal coupon from biofilm colonization while maintaining
exposure to sulfide was shown to dramatically reduce corrosion.
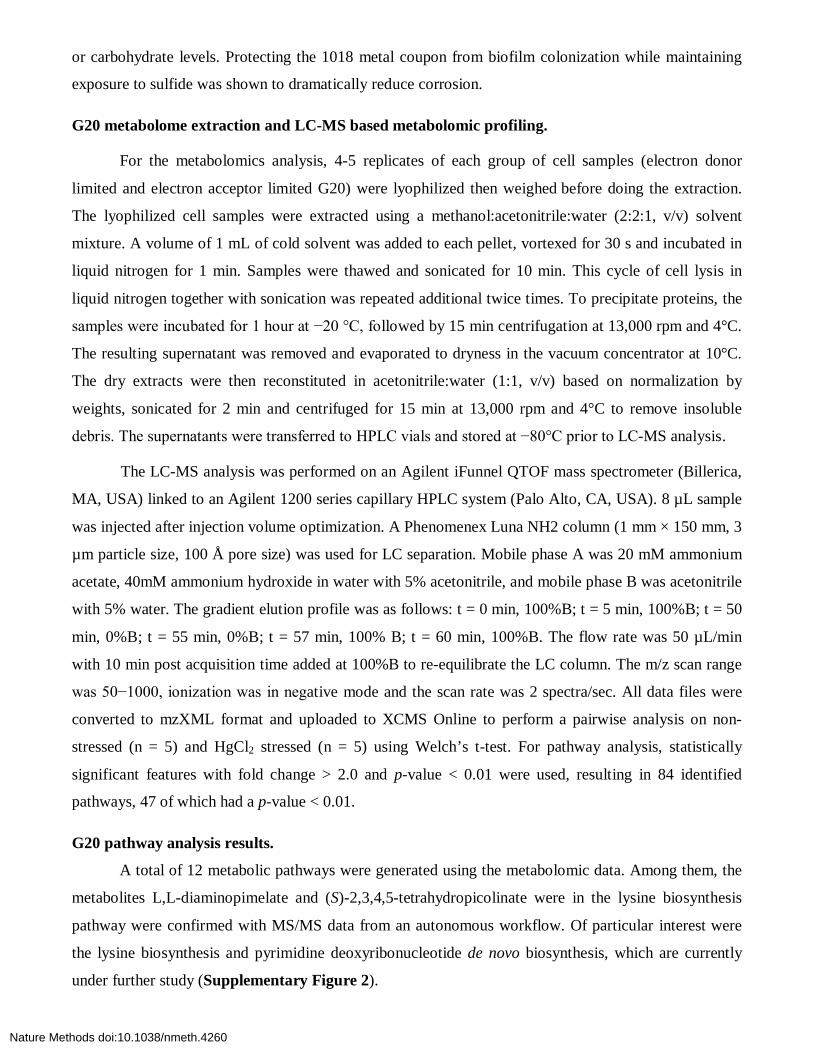
G20 metabolome extraction and LC-MS based metabolomic profiling.
For the metabolomics analysis, 4-5 replicates of each group of cell samples (electron donor
limited and electron acceptor limited G20) were lyophilized then weighed before doing the extraction.
The lyophilized cell samples were extracted using a methanol:acetonitrile:water (2:2:1, v/v) solvent
mixture. A volume of 1 mL of cold solvent was added to each pellet, vortexed for 30 s and incubated in
liquid nitrogen for 1 min. Samples were thawed and sonicated for 10 min. This cycle of cell lysis in
liquid nitrogen together with sonication was repeated additional twice times. To precipitate proteins, the
samples were incubated for 1 hour at −20 °C, followed by 15 min centrifugation at 13,000 rpm and 4°C.
The resulting supernatant was removed and evaporated to dryness in the vacuum concentrator at 10°C.
The dry extracts were then reconstituted in acetonitrile:water (1:1, v/v) based on normalization by
weights, sonicated for 2 min and centrifuged for 15 min at 13,000 rpm and 4°C to remove insoluble
debris. The supernatants were transferred to HPLC vials and stored at −80°C prior to LC-MS analysis.
The LC-MS analysis was performed on an Agilent iFunnel QTOF mass spectrometer (Billerica,
MA, USA) linked to an Agilent 1200 series capillary HPLC system (Palo Alto, CA, USA). 8 µL sample
was injected after injection volume optimization. A Phenomenex Luna NH2 column (1 mm × 150 mm, 3
µm particle size, 100 Å pore size) was used for LC separation. Mobile phase A was 20 mM ammonium
acetate, 40mM ammonium hydroxide in water with 5% acetonitrile, and mobile phase B was acetonitrile
with 5% water. The gradient elution profile was as follows: t = 0 min, 100%B; t = 5 min, 100%B; t = 50
min, 0%B; t = 55 min, 0%B; t = 57 min, 100% B; t = 60 min, 100%B. The flow rate was 50 µL/min
with 10 min post acquisition time added at 100%B to re-equilibrate the LC column. The m/z scan range
was 50−1000, ionization was in negative mode and the scan rate was 2 spectra/sec. All data files were
converted to mzXML format and uploaded to XCMS Online to perform a pairwise analysis on non-
stressed (n = 5) and HgCl2 stressed (n = 5) using Welch’s t-test. For pathway analysis, statistically
significant features with fold change > 2.0 and p-value < 0.01 were used, resulting in 84 identified
pathways, 47 of which had a p-value < 0.01.
G20 pathway analysis results.
A total of 12 metabolic pathways were generated using the metabolomic data. Among them, the
metabolites L,L-diaminopimelate and (S)-2,3,4,5-tetrahydropicolinate were in the lysine biosynthesis
pathway were confirmed with MS/MS data from an autonomous workflow. Of particular interest were
the lysine biosynthesis and pyrimidine deoxyribonucleotide de novo biosynthesis, which are currently
under further study (Supplementary Figure 2).
Nature Methods doi:10.1038/nmeth.4260
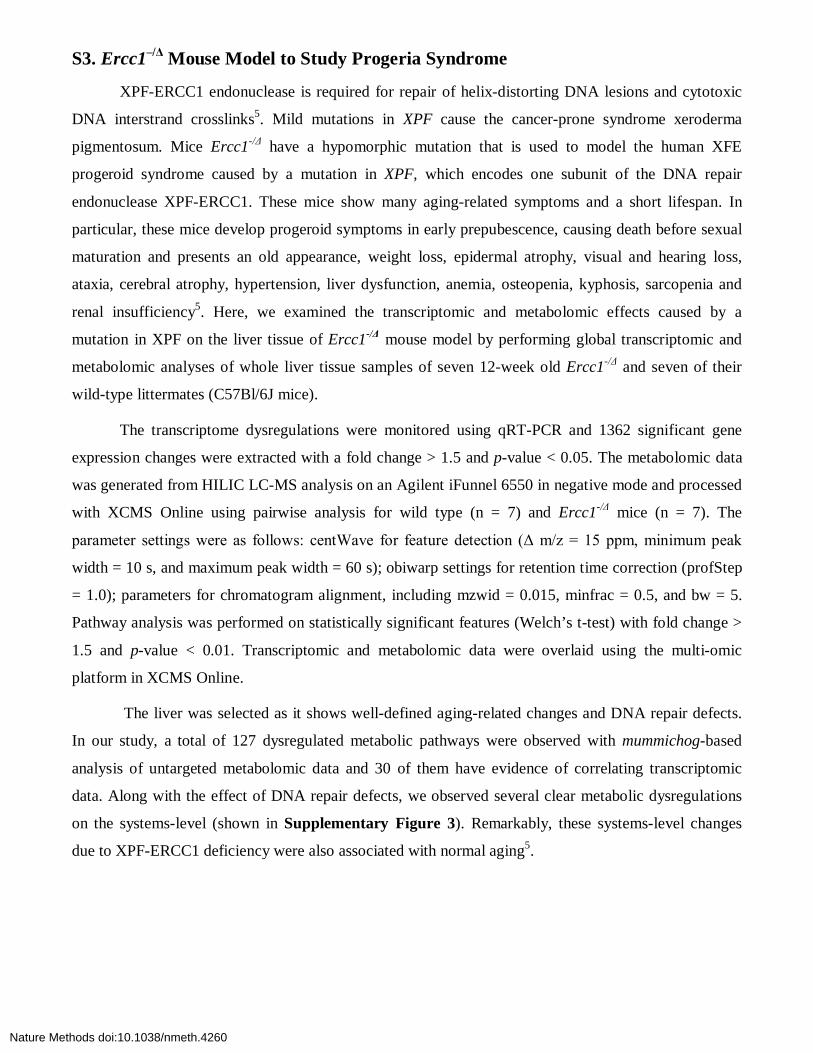
S3. Ercc1–/Δ Mouse Model to Study Progeria Syndrome
XPF-ERCC1 endonuclease is required for repair of helix-distorting DNA lesions and cytotoxic
DNA interstrand crosslinks5. Mild mutations in XPF cause the cancer-prone syndrome xeroderma
pigmentosum. Mice Ercc1-/Δ have a hypomorphic mutation that is used to model the human XFE
progeroid syndrome caused by a mutation in XPF, which encodes one subunit of the DNA repair
endonuclease XPF-ERCC1. These mice show many aging-related symptoms and a short lifespan. In
particular, these mice develop progeroid symptoms in early prepubescence, causing death before sexual
maturation and presents an old appearance, weight loss, epidermal atrophy, visual and hearing loss,
ataxia, cerebral atrophy, hypertension, liver dysfunction, anemia, osteopenia, kyphosis, sarcopenia and
renal insufficiency5. Here, we examined the transcriptomic and metabolomic effects caused by a
mutation in XPF on the liver tissue of Ercc1-/Δ mouse model by performing global transcriptomic and
metabolomic analyses of whole liver tissue samples of seven 12-week old Ercc1-/Δ and seven of their
wild-type littermates (C57Bl/6J mice).
The transcriptome dysregulations were monitored using qRT-PCR and 1362 significant gene
expression changes were extracted with a fold change > 1.5 and p-value < 0.05. The metabolomic data
was generated from HILIC LC-MS analysis on an Agilent iFunnel 6550 in negative mode and processed
with XCMS Online using pairwise analysis for wild type (n = 7) and Ercc1-/Δ mice (n = 7). The
parameter settings were as follows: centWave for feature detection (Δ m/z = 15 ppm, minimum peak
width = 10 s, and maximum peak width = 60 s); obiwarp settings for retention time correction (profStep
= 1.0); parameters for chromatogram alignment, including mzwid = 0.015, minfrac = 0.5, and bw = 5.
Pathway analysis was performed on statistically significant features (Welch’s t-test) with fold change >
1.5 and p-value < 0.01. Transcriptomic and metabolomic data were overlaid using the multi-omic
platform in XCMS Online.
The liver was selected as it shows well-defined aging-related changes and DNA repair defects.
In our study, a total of 127 dysregulated metabolic pathways were observed with mummichog-based
analysis of untargeted metabolomic data and 30 of them have evidence of correlating transcriptomic
data. Along with the effect of DNA repair defects, we observed several clear metabolic dysregulations
on the systems-level (shown in Supplementary Figure 3). Remarkably, these systems-level changes
due to XPF-ERCC1 deficiency were also associated with normal aging5.
Nature Methods doi:10.1038/nmeth.4260
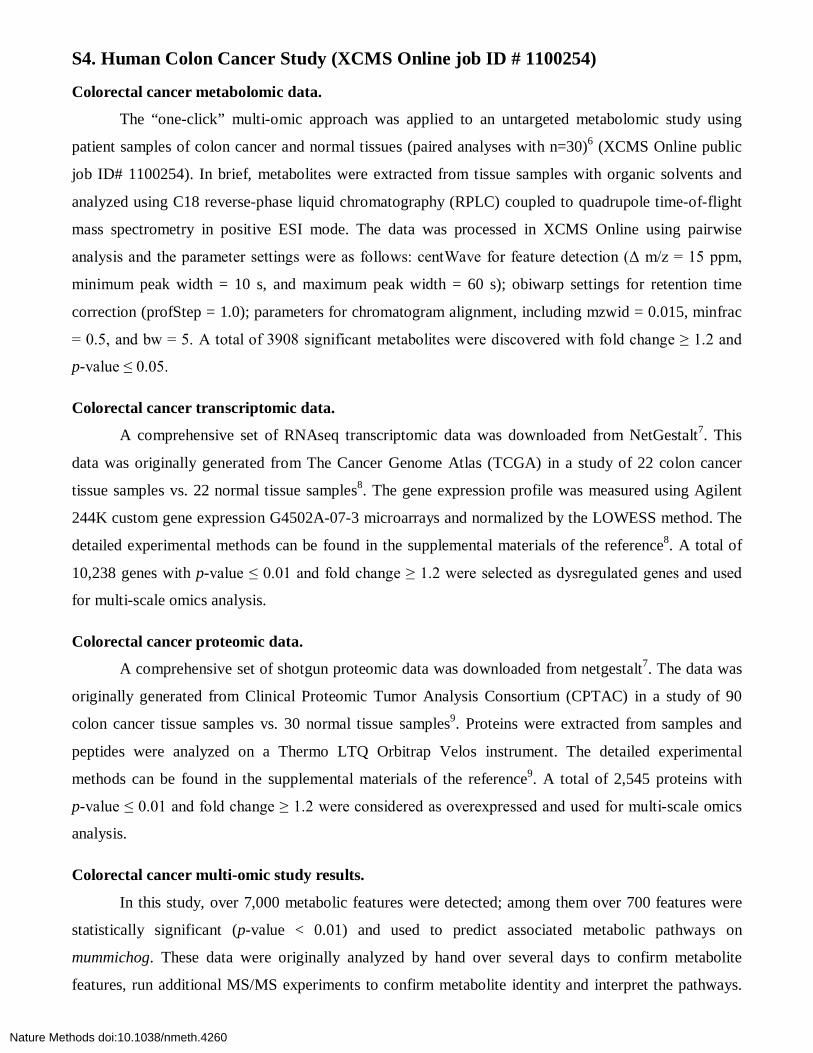
S4. Human Colon Cancer Study (XCMS Online job ID # 1100254)
Colorectal cancer metabolomic data.
The “one-click” multi-omic approach was applied to an untargeted metabolomic study using
patient samples of colon cancer and normal tissues (paired analyses with n=30)6 (XCMS Online public
job ID# 1100254). In brief, metabolites were extracted from tissue samples with organic solvents and
analyzed using C18 reverse-phase liquid chromatography (RPLC) coupled to quadrupole time-of-flight
mass spectrometry in positive ESI mode. The data was processed in XCMS Online using pairwise
analysis and the parameter settings were as follows: centWave for feature detection (Δ m/z = 15 ppm,
minimum peak width = 10 s, and maximum peak width = 60 s); obiwarp settings for retention time
correction (profStep = 1.0); parameters for chromatogram alignment, including mzwid = 0.015, minfrac
= 0.5, and bw = 5. A total of 3908 significant metabolites were discovered with fold change ≥ 1.2 and
p-value ≤ 0.05.
Colorectal cancer transcriptomic data.
A comprehensive set of RNAseq transcriptomic data was downloaded from NetGestalt7. This
data was originally generated from The Cancer Genome Atlas (TCGA) in a study of 22 colon cancer
tissue samples vs. 22 normal tissue samples8. The gene expression profile was measured using Agilent
244K custom gene expression G4502A-07-3 microarrays and normalized by the LOWESS method. The
detailed experimental methods can be found in the supplemental materials of the reference8. A total of
10,238 genes with p-value ≤ 0.01 and fold change ≥ 1.2 were selected as dysregulated genes and used
for multi-scale omics analysis.
Colorectal cancer proteomic data.
A comprehensive set of shotgun proteomic data was downloaded from netgestalt7. The data was
originally generated from Clinical Proteomic Tumor Analysis Consortium (CPTAC) in a study of 90
colon cancer tissue samples vs. 30 normal tissue samples9. Proteins were extracted from samples and
peptides were analyzed on a Thermo LTQ Orbitrap Velos instrument. The detailed experimental
methods can be found in the supplemental materials of the reference9. A total of 2,545 proteins with
p-value ≤ 0.01 and fold change ≥ 1.2 were considered as overexpressed and used for multi-scale omics
analysis.
Colorectal cancer multi-omic study results.
In this study, over 7,000 metabolic features were detected; among them over 700 features were
statistically significant (p-value < 0.01) and used to predict associated metabolic pathways on
mummichog. These data were originally analyzed by hand over several days to confirm metabolite
features, run additional MS/MS experiments to confirm metabolite identity and interpret the pathways.
Nature Methods doi:10.1038/nmeth.4260
The automated systems biology platform identified the same significant pathways in a matter of
minutes.
Ten metabolic pathways were identified with statistical significance (p-value ≤ 0.01); among
them five of the pathways (Supplementary Figure 4, Supplementary Table 1) have been previously
implicated in the progression of cancer including 1,25-dihydroxyvitamin D3 biosynthesis10, bile acid
biosynthesis11, zymosterol biosynthesis12, and ubiquinol-10 biosynthesis13 and the spermine and
spermidine pathway isolated from the original study6. Using MS/MS data, we validated three
metabolites putatively identified in the predictive pathway analysis, confirming the involvement and
upregulation of the spermine and spermidine pathway.
S5. Desulfovibrio vulgaris Hildenborough Nitrate Stress Sulfate reducing bacteria (SRB) have been shown to be useful in heavy-metal bioremediation,
yet the presence of nitrate in many contaminated sites result in hindered SRB activity. Previous gene
expression and proteomic studies14 have implicated osmotic stress and nitrite stress response to growth
inhibition by upregulation of the glycine/betaine transporter genes and relief of nitrate inhibition of
osmoprotectants. Here we look at the model SRB bacterium Desulfovibrio vulgaris Hildenborough
(DvH) to identify connections between the metabolome of nitrate induced growth inhibition and
previous reports to help identify mechanistic response pathways.
DvH cells were prepared in five separate cultures for each non-stressed and HgCl2 stressed
sample class. Cultures of DvH were grown up from freezer stocks in 7.5 mL of lactate/sulfate (60
mM/30 mM) medium containing 1% (w/v) yeast extract15. The starter cultures were subcultured at
OD600 of 0.8 after 16 h of growth by transferring 0.5 mL into 10 mL of defined lactate/sulfate medium.
Non-stressed subcultures were grown only on defined medium, and nitrate stressed cells were grown on
the same medium with the addition of 100 mM sodium nitrate. Non-stressed cells reached mid-late log,
OD600 of 0.5, after 40 h and were harvested, pelleted and decanted. Pellets were immediately flash
frozen in liquid nitrogen and stored on dry ice or at -80˚C. Nitrate stressed cells reached mid-late log
after 100 h and were harvested in the same manner.
Metabolomic and Pathway Analysis
Metabolomic analysis was performed in triplicate for each sample on an Agilent 1100 series
HPLC coupled to a Bruker Impact II QTOF mass spectrometer (Billerica, MA, USA). A Phenomenex
Luna NH2 column (1 mm × 150 mm, 3 µm particle size, 100 Å pore size) was used for LC separation.
Mobile phase A was 20 mM ammonium acetate, 40mM ammonium hydroxide in water with 5%
acetonitrile, and mobile phase B was acetonitrile with 5% water. The gradient elution profile was as
follows: t = 0 min, 100%B; t = 2.5 min, 100%B; t = 50 min, 0%B; t = 55 min, 0%B; t = 57 min, 100%
Nature Methods doi:10.1038/nmeth.4260
B; t = 60 min, 100%B. The flow rate was 50 µL/min with 10 min post acquisition time added at 100%B
to re-equilibrate the LC column. The m/z scan range was 50−1000, ionization was in negative mode and
the scan rate was 2 Hz. All data files were converted to mzXML format and uploaded to XCMS Online
to perform a pairwise analysis on non-stressed (n = 5) and HgCl2 stressed (n = 5) using Welch’s t-test.
For pathway analysis, statistically significant features with fold change > 1.5 and p-value < 0.01 were
used, resulting in 84 identified pathways, 47 of which had a p-value < 0.01.
Multi-omics Analysis
A compilation of gene and protein data from previous studies14, 16 were used to generate
dysregulated lists for comparison with the metabolomic data. In this data set, there was little overlap
between highly significant genes and proteins identified in microarray expression and proteomics
experiments and the dysregulated metabolic pathways (Supplementary Figure 5). Only leuA
overlapped with the significantly (p-value < 0.01) dysregulated leucine biosynthesis pathway. This may
be due to different growth stages of cells at the time harvested and length of nitrate exposure. In this
study, cells were grown and stressed with nitrate in the most recent method used to determine gene
fitness17, 18. The microarray and proteomic data set took cells that were at mid-log and only exposed the
cells to nitrate stress for four to eight hours, representing a more immediate response to nitrate stress, but
the cultures were unlikely to be actively growing14, 16. The cells in this metabolomic data set have
‘adapted’ to nitrate stress and are actively growing.
Despite the small multi-omics overlap, the pathways that were functioning in a significantly
different manner all point to a similar phenomenon. The dysregulation of amino acid biosynthesis and
central metabolism cycles can be attributed to nitrate stress via the assimilatory nitrate reduction
pathway, which reduces nitrate to ammonium and adds the amine to amino acid precursors. Assimilatory
nitrate reduction is not thought to be active in DvH, but these data suggest that it may be functional. The
possibility of an active nitrate reductase is further corroborated in the multi-omics data by the increased
expression of the second enzyme of the nitrate reduction pathway, nitrite reductase, DVU0625. For
pathways with less significant p-values, more amino acid biosynthesis was dysregulated corresponding
with the above pattern, but also dissimilatory sulfate reduction. The nitrate stressed cells do not grow as
well, so we expect to see the sulfate reduction pathway down regulated. If the assimilatory nitrate
reduction pathway is inactive, the stress response could also be attributed to energy limitation. Nitrate
may compete with sulfate for uptake and transport leaving the cells energy limited. When energy is
limiting, cells decrease amino acid biosynthesis and some of the central metabolism pathways. The
multi-omics data (dysregulation of leucine biosynthesis, sulfate reduction V, Glycolysis I, and nitrate
biosynthesis IV) agree with larger observed responses of DvH to nitrate stress, but pose questions about
active metabolic pathways that demand further experimentation.
Nature Methods doi:10.1038/nmeth.4260
S6. Bacterial Stress Response Study (XCMS Online job ID # 1133019) E. coli culture.
To test the efficacy of the multi-omic platform, a standard method for probing changes in
metabolomics was developed using E. coli K12 MG1655 cultures grown in different carbon sources
(glucose and adenosine carbon sources). Glucose and adenosine were prepared with equimolar
concentrations of carbon in 10 mL aliquots of M9 minimal media in triplicate. Carbon concentration was
based on a final concentration of 20 mM glucose or 0.12 M carbon. All carbon sources were prepared in
sterile water, then filtered through a 0.22 µm syringe filter prior to addition to M9 salts. A 10 mL culture
of E. coli was grown in LB media overnight at 37°C. To inoculate each condition, which was prepared
in triplicate, a 1 mL aliquot of cells was centrifuged at 13,000 rpm for 1 minute, the supernatant media
was removed and the pellet was washed 3X with sterile water. The cells were made up to a final volume
of 1 mL in sterile water and a 1 µL aliquot was added to 8 mL of each carbon source. The cultures were
grown until an OD600 ~1, or stopped after 72 hours if the growth rate was plateaued. Triplicate 1 mL
aliquots were taken for each replicate for metabolomics analysis and duplicate 1 mL samples were taken
for RNA sequencing.
E. coli RNA extraction and mRNA-seq.
RNA in E. coli samples were extracted using RNeasy Mini Kit (50, Cat. No. 74104) and the
extraction procedures followed the protocols inside the extraction kit. In brief, cells were lysed with the
working solution and then centrifuged. The supernatants were loaded onto spin column and spun down
multiple times to purify RNAs. RNA-seq experiment was performed with 75 bp reads generated on the
NextSeq Analyzer located at the Scripps DNA Sequencing Facility. The Genome Analyzer Pipeline
Software (currently bcl2fastq/2.16.0.10) is used to perform the early data analysis of a sequencing run,
which does the image analysis, base calling, and demultiplexing. Cutadapt software19 was used to trim
the adapter and low base-pair called scores. For mRNA-Seq, STAR 2.3.0 was used to align to genome
using the E. coli K12 genome reference. EdgeR as used with the method finds number of Differentially
Expressed transcripts (DE) significantly changed for the comparisons of different carbon sources. The
results are first filtered with False Discovery Rate (FDR) >0.15 and then by log Counts Per Million
(log2(CPM)) > 1.0. The log2 counts-per-million (log2 CPM) cutoff used to avoid undefined values and
the poorly defined log-fold-changes for low counts shrunk towards zero. Further the deviation of the
normalized counts within groups can be used to filter out the transcripts with higher variance. We noted
that almost all the transcripts were significantly up or down changed.
E. coli metabolome extraction and LC-MS based metabolomic profiling.
Nature Methods doi:10.1038/nmeth.4260
For the metabolomics analysis, triplicates of 1 mL of E. coli cells (OD600 = 1.0) were prepared at
each treatment condition (i.e., glucose and adenosine). E. coli cells were pelleted by centrifugation at
4°C and 3,200 RCF for 15 min. Subsequently, cell pellets were extracted using a
methanol:acetonitrile:water (2:2:1, v/v) solvent mixture. A volume of 1 mL of cold solvent was added to
each pellet, vortexed for 30 s and incubated in liquid nitrogen for 1 min. Samples were allowed to thaw
and sonicated for 10 min. This cycle of cell lysis in liquid nitrogen together with sonication was repeated
additional twice times. To precipitate proteins, the samples were incubated for 1 hour at −20 °C,
followed by 15 min centrifugation at 13,000 rpm and 4°C. The resulting supernatant was removed and
evaporated to dryness in the SpeedVap at 4°C. The dry extracts were then reconstituted in 100 μL of
acetonitrile:water (1:1, v/v), sonicated for 10 min and centrifuged for 15 min at 13,000 rpm and 4°C to
remove insoluble debris. The supernatants were transferred to HPLC vials and stored at −80°C prior to
LC-MS analysis.
The LC-MS analysis was performed on each sample in triplicate using a Bruker Impact QTOF
mass spectrometer (Billerica, MA, USA) linked to an Agilent 1200 series capillary HPLC system (Palo
Alto, CA, USA). 2 µL sample was injected after injection volume optimization. A Phenomenex Luna
NH2 column (1 mm × 15 cm, 3 µm particle size, 100 Å pore size) was used for LC separation. Mobile
phase A was 20 mM ammonium acetate in H2O with 5% acetonitrile (ACN), and mobile phase B was
ACN with 5% H2O. The gradient elution profile was as follows: t = 0 min, 95%B; t = 5 min, 95%B; t =
50 min, 5%B. t = 63min, 5%B. The flow rate was 50 µL/min. 20 min post acquisition time was also
added with 95%B to re-equilibrium the LC column. Injection of 1 µL sodium formate (250 mM)
occurred at t = 57 min and eluted on t = 61min. This calibration peak was used to internally calibrate the
LC-MS data and also served as the MS peak intensity quality control. The m/z scan range was 25–1500,
ionization was in negative mode and acquisition speed was 2 Hz. All data files were converted to
mzXML format and uploaded to XCMS Online to perform a pairwise analysis on non-stressed (n = 3)
and HgCl2 stressed (n = 3) using Welch’s t-test. For pathway analysis, statistically significant features
with fold change > 1.5 and p-value < 0.01 were used, resulting in 84 identified pathways, 47 of which
had a p-value < 0.01.
E. coli multi-omic analysis result.
A total of 217 dysregulated metabolic pathways were generated from metabolomic data and 195
(89.9%) of them were putatively confirmed with the analysis of E. coli transcriptome. These 195
metabolic pathways show significant changes at both transcriptomic and metabolomic levels.
Supplementary Table 2 lists the system-wide interpretation of 8 top-ranked metabolic pathways. These
metabolic pathways were observed to be significantly interrupted and dysregulated after changing the
carbon source from glucose to adenosine. As we can see, the most significantly disrupted pathways are
Nature Methods doi:10.1038/nmeth.4260
glucose and adenosine related, reflecting the complicated response and molecular regulation of E. coli
upon the extracellular aberration. In addition, we provided a list of differentially expressed proteins
compiled from the studies based on alterations in carbon sources in E. coli.20-23 There is a significant
amount of overlap with glycolysis I and II pathways, indicating that our observations are consistent with
results from the literature. Most importantly, our systems biology platform provides an opportunity to
quickly reveal and understand global molecular changes on a multi-omic level with a convenient “one-
click” as demonstrated by both the tabulated results and pathway cloud plot (Supplementary Figure 6).
We also noticed that there are another 187 metabolic pathways confirmed from the transcriptomic
analysis results. These metabolic pathways contain comprehensive details about how E. coli response to
the change of carbon source and worth further investigation to understand the underlying biology on the
systems biology level.
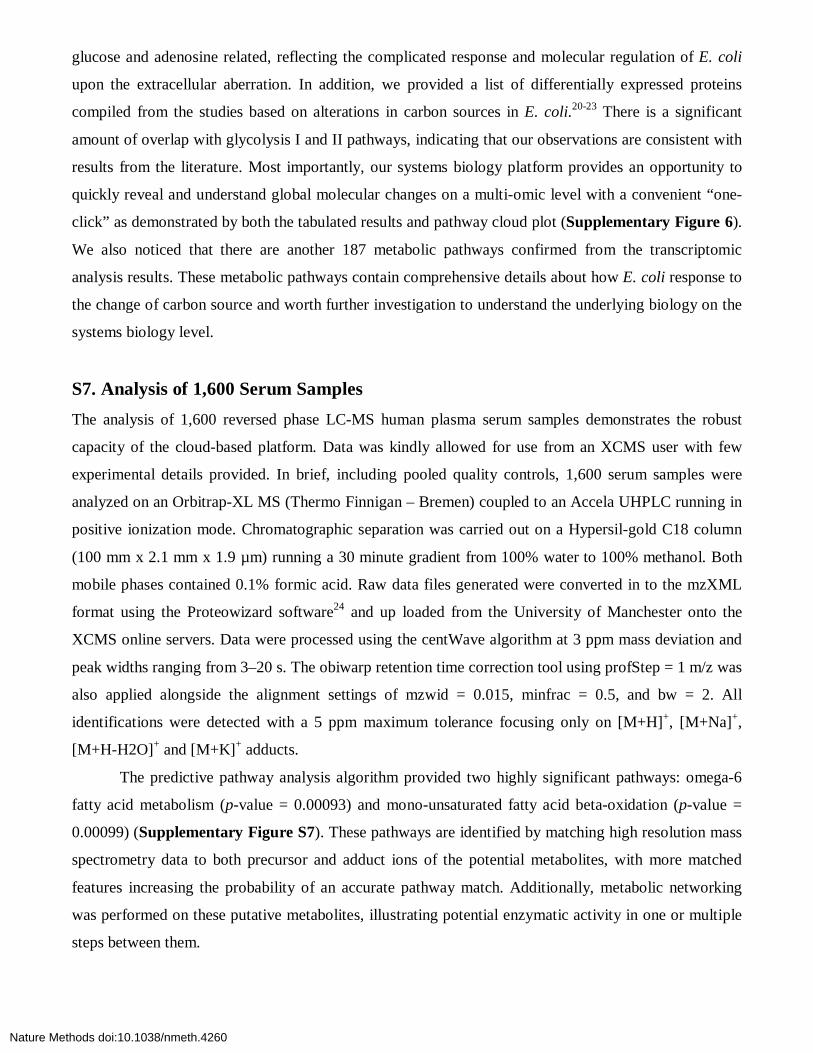
S7. Analysis of 1,600 Serum Samples The analysis of 1,600 reversed phase LC-MS human plasma serum samples demonstrates the robust
capacity of the cloud-based platform. Data was kindly allowed for use from an XCMS user with few
experimental details provided. In brief, including pooled quality controls, 1,600 serum samples were
analyzed on an Orbitrap-XL MS (Thermo Finnigan – Bremen) coupled to an Accela UHPLC running in
positive ionization mode. Chromatographic separation was carried out on a Hypersil-gold C18 column
(100 mm x 2.1 mm x 1.9 µm) running a 30 minute gradient from 100% water to 100% methanol. Both
mobile phases contained 0.1% formic acid. Raw data files generated were converted in to the mzXML
format using the Proteowizard software24 and up loaded from the University of Manchester onto the
XCMS online servers. Data were processed using the centWave algorithm at 3 ppm mass deviation and
peak widths ranging from 3–20 s. The obiwarp retention time correction tool using profStep = 1 m/z was
also applied alongside the alignment settings of mzwid = 0.015, minfrac = 0.5, and bw = 2. All
identifications were detected with a 5 ppm maximum tolerance focusing only on [M+H]+, [M+Na]+,
[M+H-H2O]+ and [M+K]+ adducts.
The predictive pathway analysis algorithm provided two highly significant pathways: omega-6
fatty acid metabolism (p-value = 0.00093) and mono-unsaturated fatty acid beta-oxidation (p-value =
0.00099) (Supplementary Figure S7). These pathways are identified by matching high resolution mass
spectrometry data to both precursor and adduct ions of the potential metabolites, with more matched
features increasing the probability of an accurate pathway match. Additionally, metabolic networking
was performed on these putative metabolites, illustrating potential enzymatic activity in one or multiple
steps between them.
Nature Methods doi:10.1038/nmeth.4260
Supplementary References
1. Li, S.Z. et al. Predicting Network Activity from High Throughput Metabolomics. PLoS Comput. Biol. 9, 11 (2013).
2. Wolswijk, G. Oligodendrocyte precursor cells in the demyelinated multiple sclerosis spinal cord. Brain 125, 338-349 (2002).
3. Panopoulos, A.D. et al. The metabolome of induced pluripotent stem cells reveals metabolic changes occurring in somatic cell reprogramming. Cell research 22, 168-177 (2012).
4. Folmes, C.D. et al. Somatic oxidative bioenergetics transitions into pluripotency-dependent glycolysis to facilitate nuclear reprogramming. Cell metabolism 14, 264-271 (2011).
5. Niedernhofer, L.J. et al. A new progeroid syndrome reveals that genotoxic stress suppresses the somatotroph axis. Nature 444, 1038-1043 (2006).
6. Johnson, C.H. et al. Metabolism links bacterial biofilms and colon carcinogenesis. Cell metabolism 21, 891-897 (2015).
7. Shi, Z., Wang, J. & Zhang, B. NetGestalt: integrating multidimensional omics data over biological networks. Nature methods 10, 597-598 (2013).
8. Muzny, D.M. et al. Comprehensive molecular characterization of human colon and rectal cancer. Nature 487, 330-337 (2012).
9. Zhang, B. et al. Proteogenomic characterization of human colon and rectal cancer. Nature 513, 382-387 (2014).
10. Feldman, D., Krishnan, A.V., Swami, S., Giovannucci, E. & Feldman, B.J. The role of vitamin D in reducing cancer risk and progression. Nature reviews cancer 14, 342-357 (2014).
11. Payne, C.M., Bernstein, C., Dvorak, K. & Bernstein, H. Hydrophobic bile acids, genomic instability, Darwinian selection, and colon carcinogenesis. Clin Exp Gastroenterol 1, 19-47 (2008).
12. Field, A.E. et al. Impact of overweight on the risk of developing common chronic diseases during a 10-year period. Archives of internal medicine 161, 1581-1586 (2001).
13. Frei, B., Kim, M.C. & Ames, B.N. Ubiquinol-10 is an effective lipid-soluble antioxidant at physiological concentrations. Proceedings of the National Academy of Sciences 87, 4879-4883 (1990).
14. He, Q. et al. Impact of elevated nitrate on sulfate-reducing bacteria: a comparative Study of Desulfovibrio vulgaris. ISME J 4, 1386-1397 (2010).
15. Zane, G.M., Yen, H.-c.B. & Wall, J.D. Effect of the Deletion of qmoABC and the Promoter-Distal Gene Encoding a Hypothetical Protein on Sulfate Reduction in Desulfovibrio vulgaris Hildenborough. Appl. Environ. Microbiol. 76, 5500-5509 (2010).
16. Redding, A.M., Mukhopadhyay, A., Joyner, D.C., Hazen, T.C. & Keasling, J.D. Study of nitrate stress in Desulfovibrio vulgaris Hildenborough using iTRAQ proteomics. Briefings in Functional Genomics & Proteomics 5, 133-143 (2006).
17. Korte, H.L. et al. Independence of Nitrate and Nitrite Inhibition of Desulfovibrio vulgaris Hildenborough and Use of Nitrite as a Substrate for Growth. Environmental Science & Technology 49, 924-931 (2015).
18. Korte, H.L. et al. Genetic basis for nitrate resistance in Desulfovibrio strains. Frontiers in Microbiology 5 (2014).
19. Martin, M. Cutadapt removes adapter sequences from high-throughput sequencing reads. 2011 17 (2011).
20. Du, Z., Nandakumar, R., Nickerson, K.W. & Li, X. Proteomic adaptations to starvation prepare Escherichia coli for disinfection tolerance. Water Res. 69, 110-119 (2015).
21. Vijayendran, C., Burgemeister, S., Friehs, K., Niehaus, K. & Flaschel, E. 2DBase: 2D-PAGE database of Escherichia coli. Biochemical and Biophysical Research Communications 363, 822-827 (2007).
22. Vijayendran, C. et al. The plasticity of global proteome and genome expression analyzed in closely related W3110 and MG1655 strains of a well-studied model organism, Escherichia coli-K12. J. Biotechnol. 128, 747-761 (2007).
23. McKee, A.E. et al. Manipulation of the carbon storage regulator system for metabolite remodeling and biofuel production in Escherichia coli. Microb. Cell. Fact. 11, 12 (2012).
24. Chambers, M.C. et al. A cross-platform toolkit for mass spectrometry and proteomics. Nature biotechnology 30, 918-920 (2012).
Nature Methods doi:10.1038/nmeth.4260
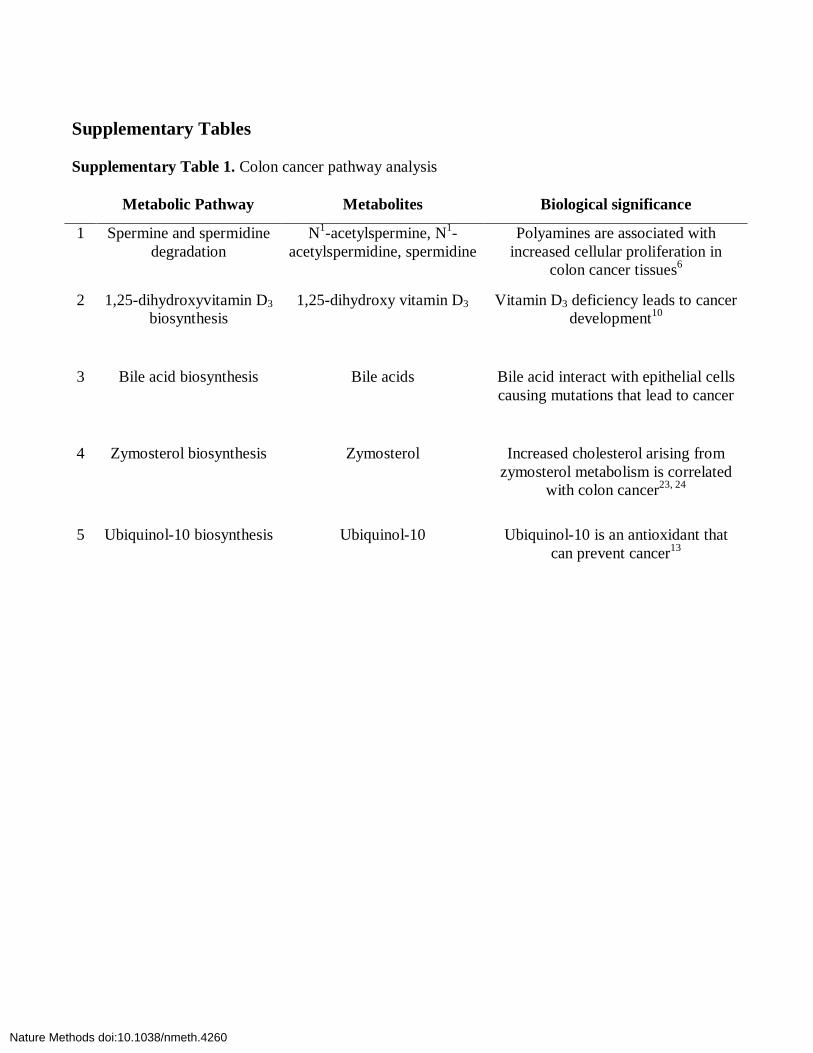
Supplementary Tables Supplementary Table 1. Colon cancer pathway analysis
Metabolic Pathway Metabolites Biological significance
1 Spermine and spermidine degradation
N1-acetylspermine, N1-acetylspermidine, spermidine
Polyamines are associated with increased cellular proliferation in
colon cancer tissues6
2 1,25-dihydroxyvitamin D3 biosynthesis
1,25-dihydroxy vitamin D3 Vitamin D3 deficiency leads to cancer development10
3 Bile acid biosynthesis Bile acids Bile acid interact with epithelial cells causing mutations that lead to cancer
4 Zymosterol biosynthesis Zymosterol Increased cholesterol arising from zymosterol metabolism is correlated
with colon cancer23, 24
5 Ubiquinol-10 biosynthesis Ubiquinol-10 Ubiquinol-10 is an antioxidant that can prevent cancer13
Nature Methods doi:10.1038/nmeth.4260
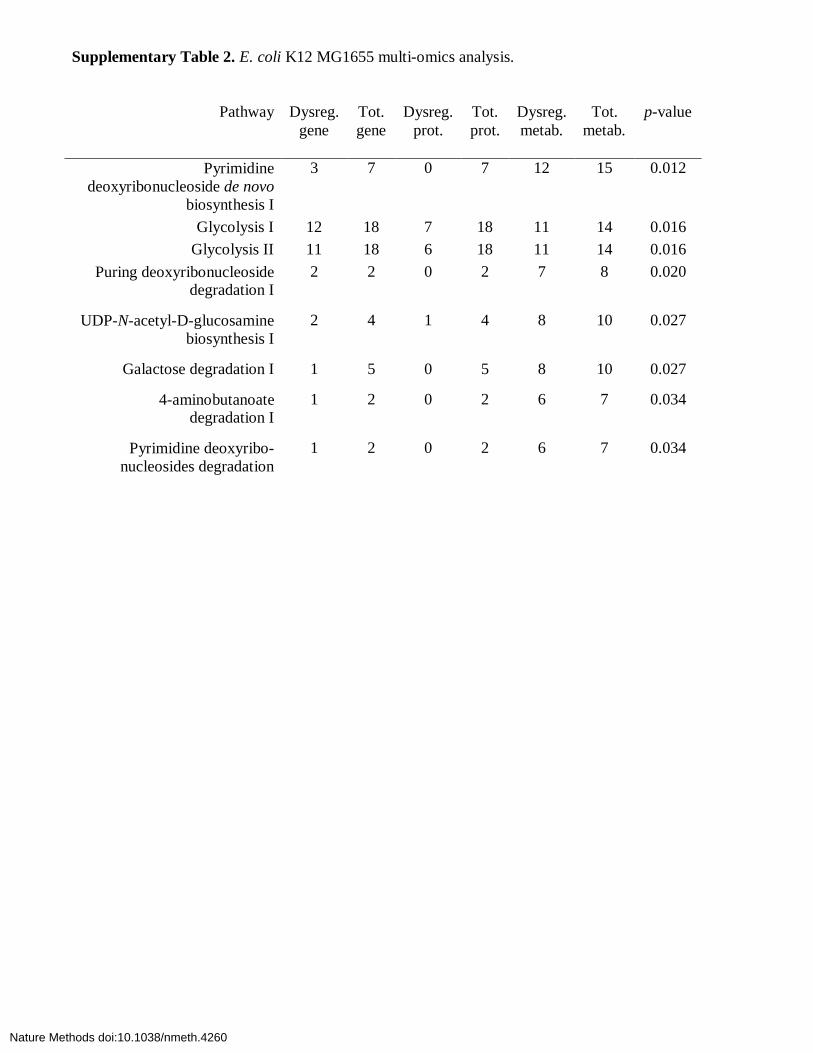
Supplementary Table 2. E. coli K12 MG1655 multi-omics analysis.
Pathway Dysreg. gene
Tot. gene
Dysreg. prot.
Tot. prot.
Dysreg. metab.
Tot. metab.
p-value
Pyrimidine deoxyribonucleoside de novo
biosynthesis I
3 7 0 7 12 15 0.012
Glycolysis I 12 18 7 18 11 14 0.016 Glycolysis II 11 18 6 18 11 14 0.016
Puring deoxyribonucleoside degradation I
2 2 0 2 7 8 0.020
UDP-N-acetyl-D-glucosamine biosynthesis I
2 4 1 4 8 10 0.027
Galactose degradation I 1 5 0 5 8 10 0.027
4-aminobutanoate degradation I
1 2 0 2 6 7 0.034
Pyrimidine deoxyribo-nucleosides degradation
1 2 0 2 6 7 0.034
Nature Methods doi:10.1038/nmeth.4260