ravensthorpe heritage project ravensthorpe west yorkshire
TRANSCRIPT
Ravensthorpe Heritage Project
Ravensthorpe
West Yorkshire
Archaeological Excavation
Report no. 2409
November 2012
Client: West Yorkshire Joint Services
Archaeological Services WYAS Report No. 2409 Ravensthorpe Heritage Project
Ravensthorpe Heritage Project, Ravensthorpe
West Yorkshire
Archaeological Excavation
Summary
A community archaeology excavation was undertaken in the grounds of The Greenwood
Centre in Ravensthorpe in July 2012. The excavations were undertaken over a two-week
period by children from local schools. The aim of the project was to identify remains
associated with a possible 18th-century house, known as Brickhouse, which previously
occupied the site. A geophysical survey and test pit evaluation undertaken prior to the
excavation identified the remains of a large rectangular structure constructed from machine-
manufactured brick. The excavation exposed two parallel brick walls spaced 1.2m apart.
Following on from the excavation, a member of the public provided a personal account of an
air raid shelter here, and the description of the structure provided corresponds well with the
archaeological remains.
Archaeological Services WYAS Report No. 2409 Ravensthorpe Heritage Project
ii
Report Information
Client: West Yorkshire Joint Services
Address: PO Box 5, Nepshaw Lane South, Morley, Leeds, LS27 0QP
Report Type: Geophysical survey and archaeological excavation
Location: Greenwood Centre, Huddersfield Road, Ravensthorpe
County: West Yorkshire
Grid Reference: SE 2238 2029
Period(s) of activity represented: Mid-20th Century
Report Number: 2409
Project Number: 3905
Site Code: RCA12
Planning Application No.: n/a
Museum Accession No.: TBC
Date of fieldwork: July 2012
Date of report: November 2012
Project Management: Louise Martin BSc
Fieldwork supervisor: Alexandra Grassam BA MSc
Report: Alexandra Grassam
Illustrations: Alexandra Grassam and David Harrison BA MSc
Photography: Alexandra Grassam and Louise Martin
Authorisation for distribution: ------------------------------------------------------
© Archaeological Services WYAS 2012
PO Box 30, Nepshaw Lane South, Morley, Leeds LS27 0UG
Telephone: 0113 383 7500.
Email: [email protected]
Archaeological Services WYAS Report No. 2409 Ravensthorpe Heritage Project
iii
Contents Report information ................................................................................................................ ii Contents................................................................................................................................ iii List of Figures .......................................................................................................................iv List of Plates..........................................................................................................................iv List of Tables .........................................................................................................................iv Acknowledgements ...............................................................................................................iv 1 Introduction.................................................................................................................1 Site location and topography ........................................................................................1 Soils, geology and land-use ..........................................................................................1 2 Archaeological and Historical Background..............................................................1 3 Aims and Objectives ...................................................................................................2 4 Methodology ................................................................................................................2 5 Results ..........................................................................................................................3 Geophysical survey.......................................................................................................3 Test Pits 1 and 2 ............................................................................................................3 Trench 1 ........................................................................................................................5 Trench 2 ........................................................................................................................6 Test Pit 3 .......................................................................................................................6 Test Pit 4 .......................................................................................................................6 6 Artefact Record...........................................................................................................7 7 Discussion and Conclusions .......................................................................................7 Figures Plates Appendices Appendix 1: Magnetic survey: technical information Appendix 2: Earth Resistance survey: technical information Appendix 3: Survey location information Appendix 4: Geophysical archive Appendix 5: Inventory of primary archive Appendix 6: Concordance of contexts yielding artefacts or environmental remains Bibliography
Archaeological Services WYAS Report No. 2409 Ravensthorpe Heritage Project
iv
List of Figures 1 Site location 2 Detailed site location plan (1:2000 @ A4) 3 Processed greyscale resistance data (1:500 @ A3) 4 Interpretation of resistance data and location of test pits and trenches (1:500 @ A3) 5 Trench plan and section
List of Plates 1 Test Pit 1, facing west 2 Test Pit 2, facing north 3 Walls 103 and 104, facing north 4 Trench 1, facing west
List of Tables 1 Summary of contexts 100 to 1 and 103 to 4, Test pit 1 2 Summary of contexts 105 to 6 and 108 to 11, Test pit 2 3 Summary of contexts 101 to 104, Trench 1
Acknowledgements
ASWYAS would like to thank the members of the West Yorkshire Joint Services Education and Promotions team for providing us with the opportunity to be part of the Ravensthorpe Heritage Project and for providing valuable help and assistance during the excavation. ASWYAS would also like to thank the children from Ravensthorpe Junior School, Ravenshall School, Westborough High School, Old Bank School and St Paulinus Catholic Primary School who participated in the fieldwork, Anthony Rooney for assisting with the geophysical survey and excavation, and Kathryn Ormston for who assisted in the finds processing. ASWYAS would like also to thank Malcolm Kenyon for his valuable recollections about the air raid shelter in Ravensthorpe Park.

Archaeological Services WYAS Report No. 2409 Ravensthorpe Heritage Project
1
1 Introduction
Archaeological Services WYAS (ASWYAS) was commissioned by West Yorkshire Joint Services (WYJS) to undertake an archaeological excavation in the grounds of the Greenwood Centre, Huddersfield Road, Ravensthorpe, West Yorkshire. The two-week long excavation formed part of the Ravensthorpe Community Heritage Project led by West Yorkshire Joint Services. The aim of the heritage project was to provide the Ravensthorpe community the opportunity the learn more about their local history. The project involved pupils from five local schools and local community groups.
Site location and topography
Ravensthorpe is located approximately 7km to the north-east of Huddersfield, 2.3km to the west of Dewsbury and 2.2km east of Mirfield. The Greenwood Centre and it grounds are bounded to the north by Huddersfield Road, to the south by Netherfield Road and to the east and west by buildings (SE 2238 2029; Figs 1 and 2).
The Greenwood Centre and grounds occupy a fairly flat site at a height of approximately 40m AOD. The land rises steeply at the northern boundary of the site, towards Huddersfield Road.
Soils, geology and land-use
The soils in Ravensthorpe are unclassified, however in the surrounding area they are classified in the Dale association (Soil Survey of England and Wales 1983) The bedrock geology consists of Pennine Lower Coal Measures overlaid by clay, silt, sand and gravel alluvial superficial deposits (http://www.bgs.ac.uk/opengeoscience/). The excavation was undertaken in the public park to the north of The Greenwood Centre.
2 Archaeological and Historical Background
The Greenwood Centre occupies the site of Brickhouse, thought to have been built in the mid-18th century. The cartographic sources reveal that the house was located in a sparsely occupied area until the later 19th century when the settlement of Ravensthorpe (known earlier as Little Mirfield and Newtown) began to be established. In the mid-19th century Brickhouse was occupied by George Tattersfield, a locally important mill owner and councillor, and his family. The story of George Tattersfield and his progression from the son of a cottage-based blanket weaver to a textile mill owner and manufacturer formed the focus of the school element of the Ravensthorpe Community Project (WYJS 2012).
The site of gardens associated with Brickhouse now comprise a small public park and it the aim of the two-week community excavation was to try to locate any archaeological deposits or finds associated with the property and its occupants.
Archaeological Services WYAS Report No. 2409 Ravensthorpe Heritage Project
2
3 Aims and Objectives
There were two aims for this excavation. The first was to provide the opportunity for children to actively participate in an archaeological excavation and to gain an understanding of the techniques and tools used. The second aim was initially to try to identify any sub-surface deposits and finds associated with the 19th century building, known as Brickhouse. The identification of the large, rectangular geophysical anomaly, however, re-focused the excavation objectives towards identifying the nature of that anomaly.
4 Methodology
Geophysical Survey
A geophysical survey (magnetometer and earth resistance) was undertaken in June 2012. The survey was undertaken by student volunteers supervised by qualified staff from ASWYAS. Technical information relating to the equipment used, data processing and survey methodologies are given in Appendix 1 to 3.
Magnetometer survey
Bartington Grad601 instruments were used to take readings at 0.25m intervals on zigzag traverses 1m apart. These readings were stored in the memory of the instrument and later downloaded to computer for processing and interpretation. Geoplot 3 (Geoscan Research) software was used to process and present the data. Further details are given in Appendix 1.
Earth resistance survey
A Geoscan RM15 resistance meter was used during the earth resistance survey, with the instrument logging each reading automatically at 1m intervals on traverses 1m apart. The mobile probe spacing was 1m with the remote probes 15m apart and at least 15m away from the grid under survey. This mobile probe spacing gives an approximate depth penetration of up to 1m for most archaeological features.
The survey grid was set-out with a Trimble 5800 VRS differential GPS to the national grid. The grid was then superimposed onto digital mapping. Temporary reference objects (small survey pins) were established upon existing fence posts and tree stumps and left in place following completion of the fieldwork for accurate geo-referencing. The locations of the temporary reference objects are shown on Figure 3 and their Ordnance Survey co-ordinates tabulated in Appendix 3.
Archaeological Excavation
A total of four test pits and two trenches were opened during the archaeological excavation. The position of all of these was set out using a Trimble VRS differential Global Positioning System. Test pits 1 and 2 were excavated before the community excavation began in order to test the results of the geophysical survey and to establish the suitability of the ground for the main excavation. Test pit 2 contained a substantial amount of a dumped deposit which included frequent fragments of industrial waste/clinker from an unknown source, along with
Archaeological Services WYAS Report No. 2409 Ravensthorpe Heritage Project
3
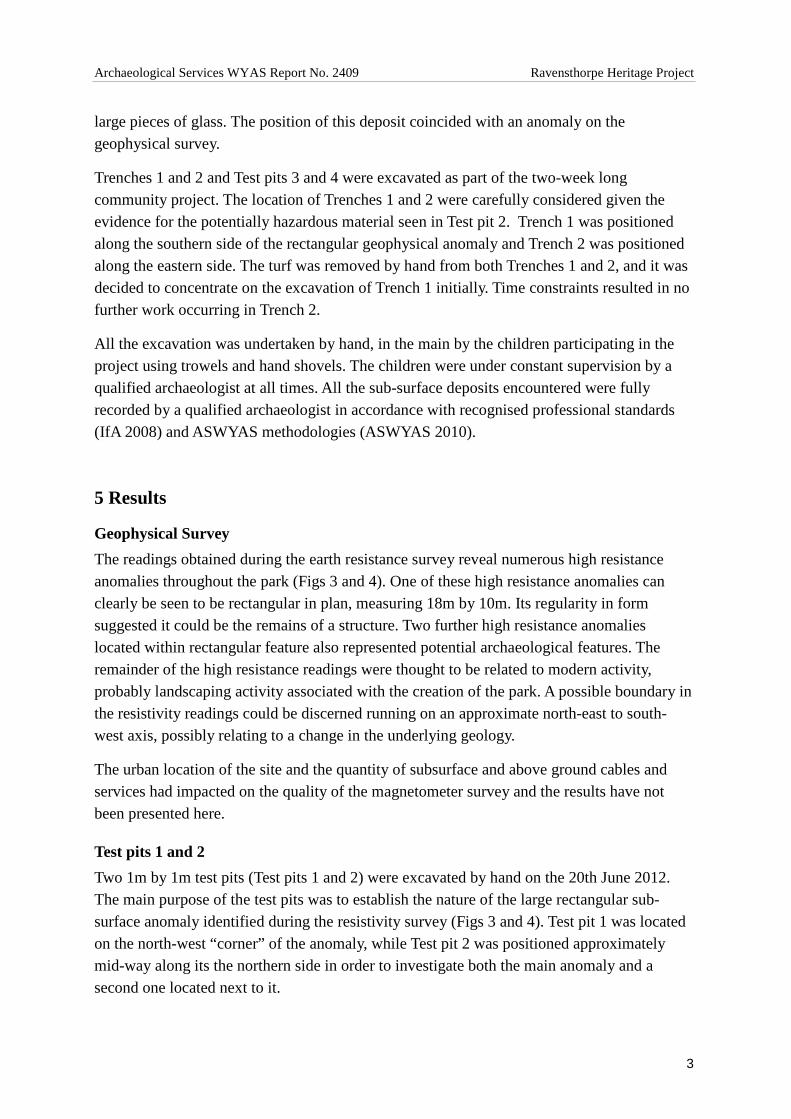
large pieces of glass. The position of this deposit coincided with an anomaly on the geophysical survey.
Trenches 1 and 2 and Test pits 3 and 4 were excavated as part of the two-week long community project. The location of Trenches 1 and 2 were carefully considered given the evidence for the potentially hazardous material seen in Test pit 2. Trench 1 was positioned along the southern side of the rectangular geophysical anomaly and Trench 2 was positioned along the eastern side. The turf was removed by hand from both Trenches 1 and 2, and it was decided to concentrate on the excavation of Trench 1 initially. Time constraints resulted in no further work occurring in Trench 2.
All the excavation was undertaken by hand, in the main by the children participating in the project using trowels and hand shovels. The children were under constant supervision by a qualified archaeologist at all times. All the sub-surface deposits encountered were fully recorded by a qualified archaeologist in accordance with recognised professional standards (IfA 2008) and ASWYAS methodologies (ASWYAS 2010).
5 Results
Geophysical Survey
The readings obtained during the earth resistance survey reveal numerous high resistance anomalies throughout the park (Figs 3 and 4). One of these high resistance anomalies can clearly be seen to be rectangular in plan, measuring 18m by 10m. Its regularity in form suggested it could be the remains of a structure. Two further high resistance anomalies located within rectangular feature also represented potential archaeological features. The remainder of the high resistance readings were thought to be related to modern activity, probably landscaping activity associated with the creation of the park. A possible boundary in the resistivity readings could be discerned running on an approximate north-east to south-west axis, possibly relating to a change in the underlying geology.
The urban location of the site and the quantity of subsurface and above ground cables and services had impacted on the quality of the magnetometer survey and the results have not been presented here.
Test pits 1 and 2
Two 1m by 1m test pits (Test pits 1 and 2) were excavated by hand on the 20th June 2012. The main purpose of the test pits was to establish the nature of the large rectangular sub-surface anomaly identified during the resistivity survey (Figs 3 and 4). Test pit 1 was located on the north-west “corner” of the anomaly, while Test pit 2 was positioned approximately mid-way along its the northern side in order to investigate both the main anomaly and a second one located next to it.
Archaeological Services WYAS Report No. 2409 Ravensthorpe Heritage Project
4
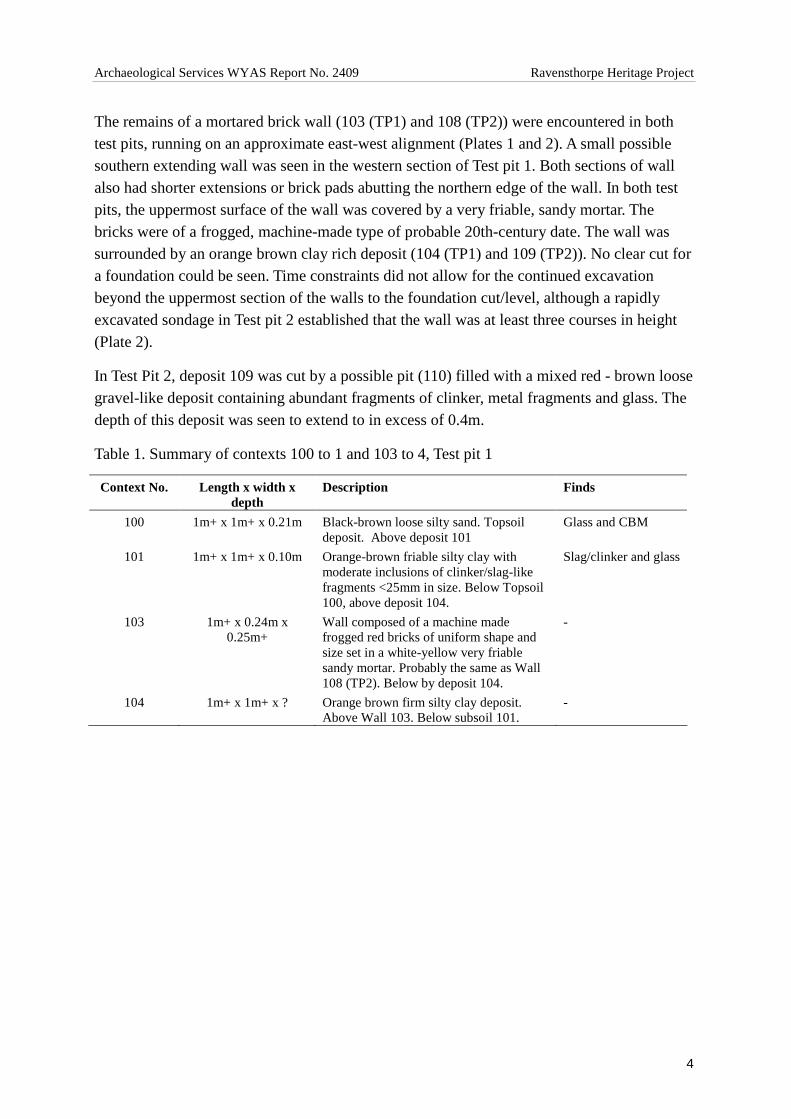
The remains of a mortared brick wall (103 (TP1) and 108 (TP2)) were encountered in both test pits, running on an approximate east-west alignment (Plates 1 and 2). A small possible southern extending wall was seen in the western section of Test pit 1. Both sections of wall also had shorter extensions or brick pads abutting the northern edge of the wall. In both test pits, the uppermost surface of the wall was covered by a very friable, sandy mortar. The bricks were of a frogged, machine-made type of probable 20th-century date. The wall was surrounded by an orange brown clay rich deposit (104 (TP1) and 109 (TP2)). No clear cut for a foundation could be seen. Time constraints did not allow for the continued excavation beyond the uppermost section of the walls to the foundation cut/level, although a rapidly excavated sondage in Test pit 2 established that the wall was at least three courses in height (Plate 2).
In Test Pit 2, deposit 109 was cut by a possible pit (110) filled with a mixed red - brown loose gravel-like deposit containing abundant fragments of clinker, metal fragments and glass. The depth of this deposit was seen to extend to in excess of 0.4m.
Table 1. Summary of contexts 100 to 1 and 103 to 4, Test pit 1
Context No. Length x width x depth
Description Finds
100 1m+ x 1m+ x 0.21m Black-brown loose silty sand. Topsoil deposit. Above deposit 101
Glass and CBM
101 1m+ x 1m+ x 0.10m Orange-brown friable silty clay with moderate inclusions of clinker/slag-like fragments <25mm in size. Below Topsoil 100, above deposit 104.
Slag/clinker and glass
103 1m+ x 0.24m x 0.25m+
Wall composed of a machine made frogged red bricks of uniform shape and size set in a white-yellow very friable sandy mortar. Probably the same as Wall 108 (TP2). Below by deposit 104.
-
104 1m+ x 1m+ x ? Orange brown firm silty clay deposit. Above Wall 103. Below subsoil 101.
-
Archaeological Services WYAS Report No. 2409 Ravensthorpe Heritage Project
5
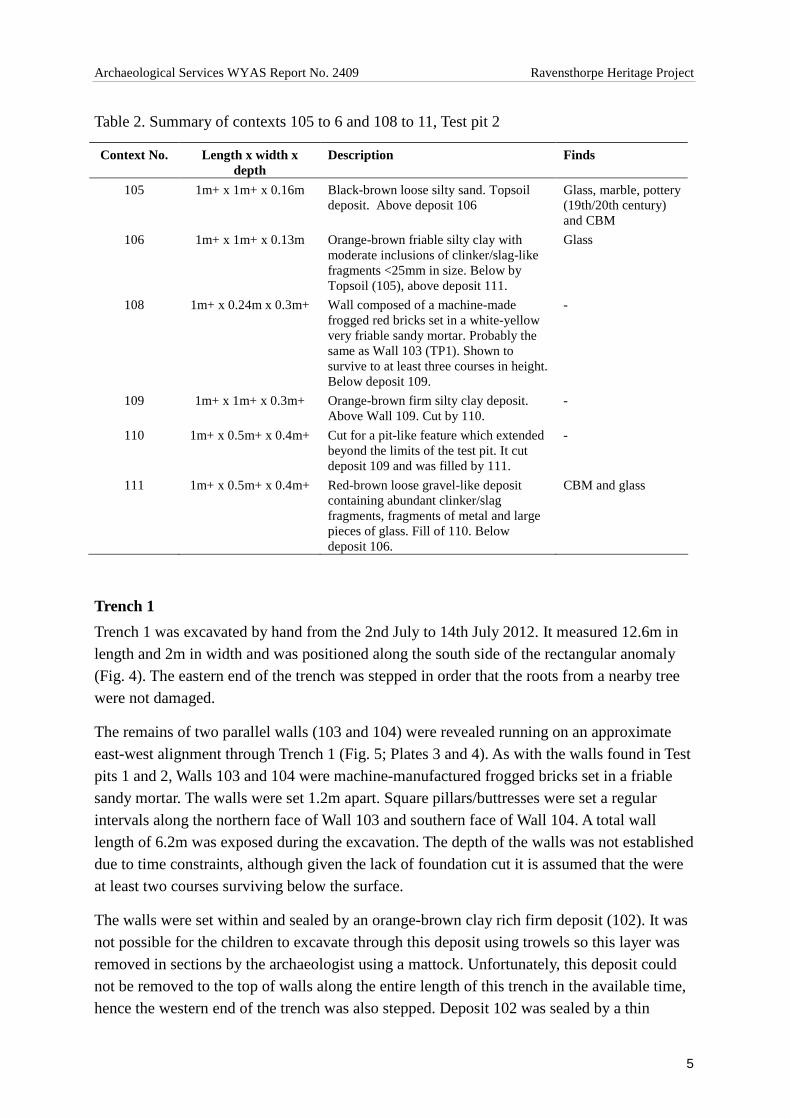
Table 2. Summary of contexts 105 to 6 and 108 to 11, Test pit 2
Context No. Length x width x depth
Description Finds
105 1m+ x 1m+ x 0.16m Black-brown loose silty sand. Topsoil deposit. Above deposit 106
Glass, marble, pottery (19th/20th century) and CBM
106 1m+ x 1m+ x 0.13m Orange-brown friable silty clay with moderate inclusions of clinker/slag-like fragments <25mm in size. Below by Topsoil (105), above deposit 111.
Glass
108 1m+ x 0.24m x 0.3m+ Wall composed of a machine-made frogged red bricks set in a white-yellow very friable sandy mortar. Probably the same as Wall 103 (TP1). Shown to survive to at least three courses in height. Below deposit 109.
-
109 1m+ x 1m+ x 0.3m+ Orange-brown firm silty clay deposit. Above Wall 109. Cut by 110.
-
110 1m+ x 0.5m+ x 0.4m+ Cut for a pit-like feature which extended beyond the limits of the test pit. It cut deposit 109 and was filled by 111.
-
111 1m+ x 0.5m+ x 0.4m+ Red-brown loose gravel-like deposit containing abundant clinker/slag fragments, fragments of metal and large pieces of glass. Fill of 110. Below deposit 106.
CBM and glass
Trench 1
Trench 1 was excavated by hand from the 2nd July to 14th July 2012. It measured 12.6m in length and 2m in width and was positioned along the south side of the rectangular anomaly (Fig. 4). The eastern end of the trench was stepped in order that the roots from a nearby tree were not damaged.
The remains of two parallel walls (103 and 104) were revealed running on an approximate east-west alignment through Trench 1 (Fig. 5; Plates 3 and 4). As with the walls found in Test pits 1 and 2, Walls 103 and 104 were machine-manufactured frogged bricks set in a friable sandy mortar. The walls were set 1.2m apart. Square pillars/buttresses were set a regular intervals along the northern face of Wall 103 and southern face of Wall 104. A total wall length of 6.2m was exposed during the excavation. The depth of the walls was not established due to time constraints, although given the lack of foundation cut it is assumed that the were at least two courses surviving below the surface.
The walls were set within and sealed by an orange-brown clay rich firm deposit (102). It was not possible for the children to excavate through this deposit using trowels so this layer was removed in sections by the archaeologist using a mattock. Unfortunately, this deposit could not be removed to the top of walls along the entire length of this trench in the available time, hence the western end of the trench was also stepped. Deposit 102 was sealed by a thin
Archaeological Services WYAS Report No. 2409 Ravensthorpe Heritage Project
6
spread of mottled brown orange silty clay which contains lots of fragments of slag and clinker (101). This in turn was sealed by a topsoil deposit (100; Fig. 5, S.1).
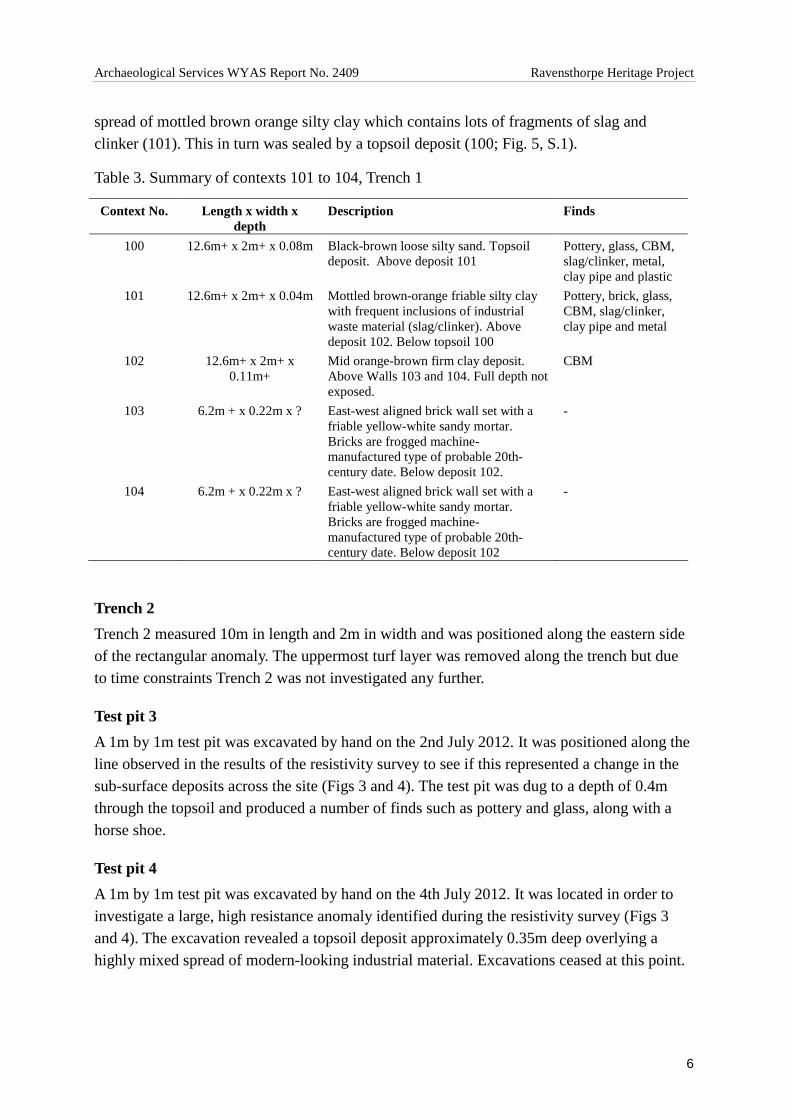
Table 3. Summary of contexts 101 to 104, Trench 1
Context No. Length x width x depth
Description Finds
100 12.6m+ x 2m+ x 0.08m Black-brown loose silty sand. Topsoil deposit. Above deposit 101
Pottery, glass, CBM, slag/clinker, metal, clay pipe and plastic
101 12.6m+ x 2m+ x 0.04m Mottled brown-orange friable silty clay with frequent inclusions of industrial waste material (slag/clinker). Above deposit 102. Below topsoil 100
Pottery, brick, glass, CBM, slag/clinker, clay pipe and metal
102 12.6m+ x 2m+ x 0.11m+
Mid orange-brown firm clay deposit. Above Walls 103 and 104. Full depth not exposed.
CBM
103 6.2m + x 0.22m x ? East-west aligned brick wall set with a friable yellow-white sandy mortar. Bricks are frogged machine-manufactured type of probable 20th-century date. Below deposit 102.
-
104 6.2m + x 0.22m x ? East-west aligned brick wall set with a friable yellow-white sandy mortar. Bricks are frogged machine-manufactured type of probable 20th-century date. Below deposit 102
-
Trench 2
Trench 2 measured 10m in length and 2m in width and was positioned along the eastern side of the rectangular anomaly. The uppermost turf layer was removed along the trench but due to time constraints Trench 2 was not investigated any further.
Test pit 3
A 1m by 1m test pit was excavated by hand on the 2nd July 2012. It was positioned along the line observed in the results of the resistivity survey to see if this represented a change in the sub-surface deposits across the site (Figs 3 and 4). The test pit was dug to a depth of 0.4m through the topsoil and produced a number of finds such as pottery and glass, along with a horse shoe.
Test pit 4
A 1m by 1m test pit was excavated by hand on the 4th July 2012. It was located in order to investigate a large, high resistance anomaly identified during the resistivity survey (Figs 3 and 4). The excavation revealed a topsoil deposit approximately 0.35m deep overlying a highly mixed spread of modern-looking industrial material. Excavations ceased at this point.
Archaeological Services WYAS Report No. 2409 Ravensthorpe Heritage Project
7
6 Artefact Record
The topsoil and subsoil deposits excavated in Trench 1 and Test Pits 1 to 3 produced many finds, including pottery, industrial material, clay tobacco pipe fragments, metal and glass. None of the finds came from a sealed or stratified deposit and thus no formal analysis has been undertaken of the finds assemblage. In the main, the material is clearly of 19th to 20th-century date, although a few pieces of possible 17th-century pottery were recovered from the topsoil (J. Hudson pers. comm.).
The finds were washed during the course of the excavation by the participants and by a volunteer following the completion of the excavation. The volunteer also assisted in the production of a detailed concordance of the finds, a summary of which is located in Appendix 6.
7 Discussion and Conclusions
The aim of the archaeological excavation was to provide children from local schools with the opportunity to discover and explore any remains associated with the former Brickhouse which was occupied from as early as the 18th century. The geophysical survey, however, revealed evidence of a large rectangular sub-surface feature measuring 18m by 10m in the south-eastern corner of the park which resulted in the investigations focussing primarily on this.
Two test pits excavated on the northern edge of this feature demonstrated that the anomaly related to a brick structure, the bricks probably dating to the 20th century. Trench 1 was positioned along the southern extent of the building and the remains of two parallel walls constructed from the same type of brick as seen in Test Pits 1 and 2 were exposed. Unfortunately, restrictions on time and poor weather conditions did not allow for anymore than the top of the surviving course of bricks to be exposed.
The idea that this building could be a World War II public air raid shelter was suggested early on in the investigations. Soon after the conclusion of the archaeological investigations, the Ravensthorpe Heritage Project team was contacted by a Ravensthorpe resident, Malcolm Kenyon, who remembers using an air raid shelter in Ravensthorpe park during the war (WYJS 2012). In an oral description provided to Dawn Mason (West Yorkshire Joint Services Educations and Promotion Department), Mr Kenyon described how the shelter was a largely sub-surface feature and consisted of four narrow corridors arranged in a rectangle. It was accessed via a ramp in the south-western corner with ladders positioned in the remaining three corners. The description provided, especially of it comprising of a series of corridors, corresponds well with the parallel layout of the walls found in Trench 1.
Soon after World War II, much of the shelter was dismantled, probably with some care given the evenness and regularity of the remaining walls. The occasional broken brick was found in

Archaeological Services WYAS Report No. 2409 Ravensthorpe Heritage Project
8
the overlying clay layer (102) which suggests that the intact bricks were taken away and probably reused. Following the removal of the building, a thick layer of clay (102) was spread across the footprint of the building. This may have been used to consolidate and level off the ground prior to landscaping.

Fig. 1. Site location
Inset see Fig. 2.
N
2km0
© Crown Copyright. All rights reserved 100019574, 2012.
SE20 22 23 24 252119
19
20
21
18
22
BradfordLeeds
Wakefield
Huddersfield
Halifax
RavensthorpeRavensthorpe
0 10km
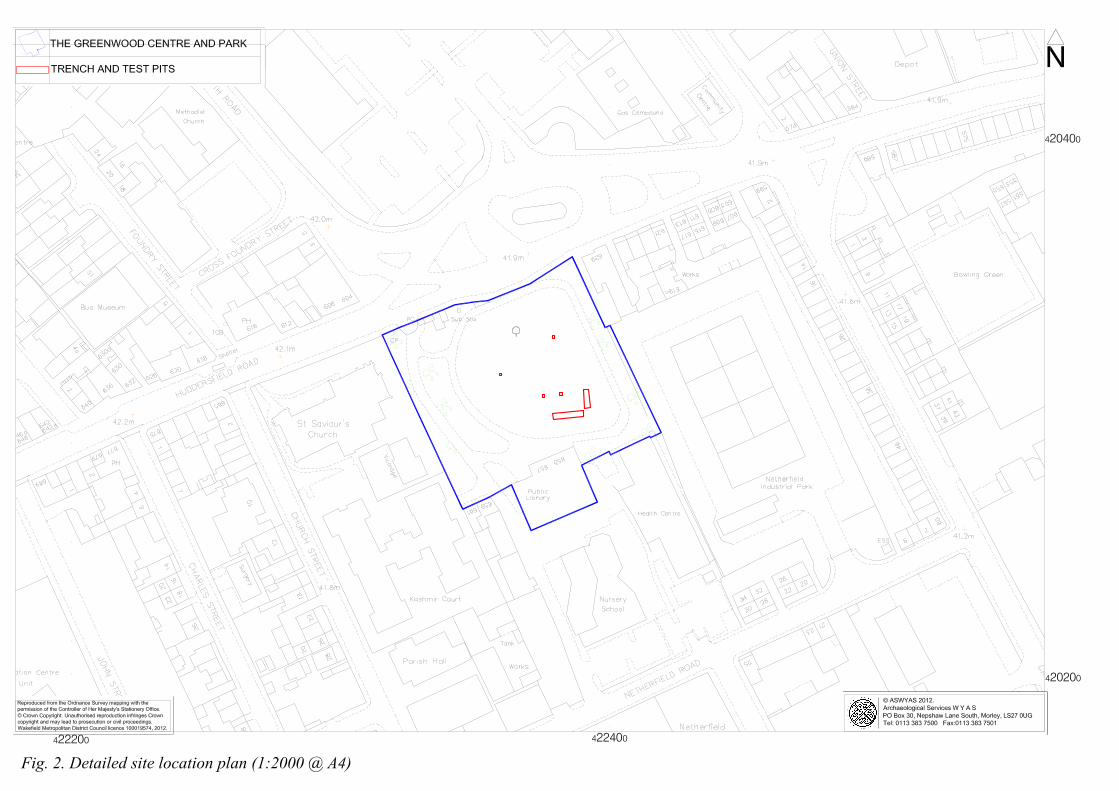
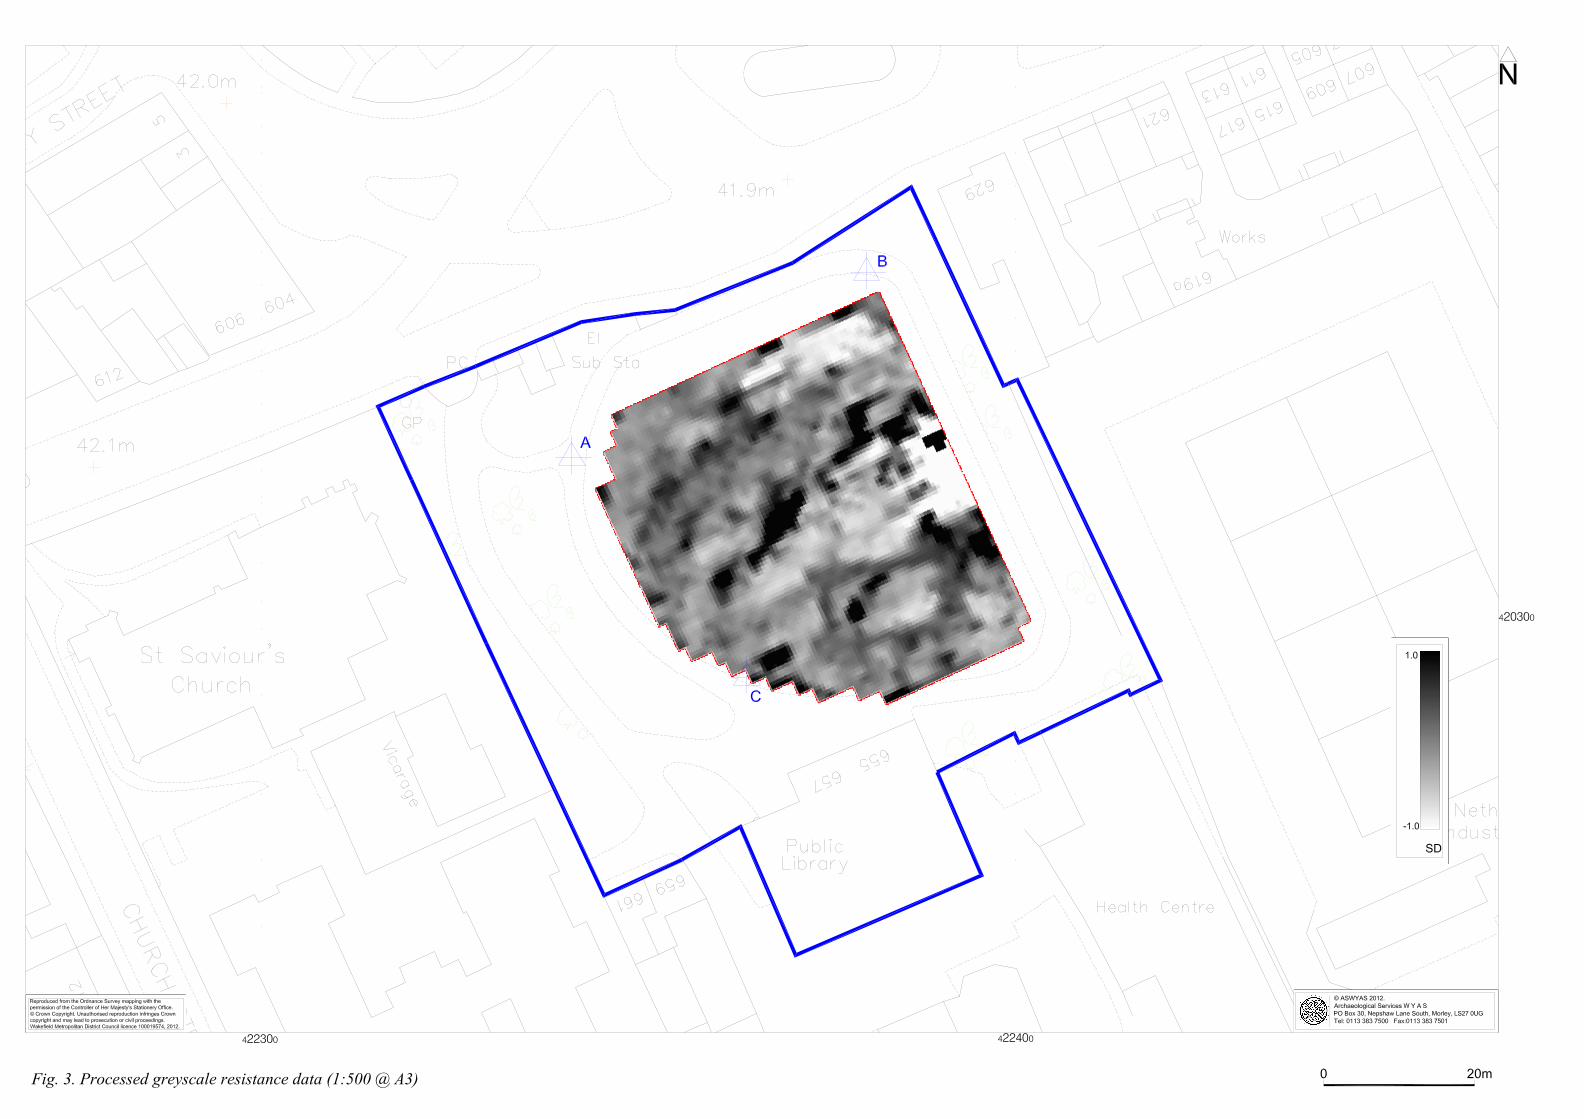
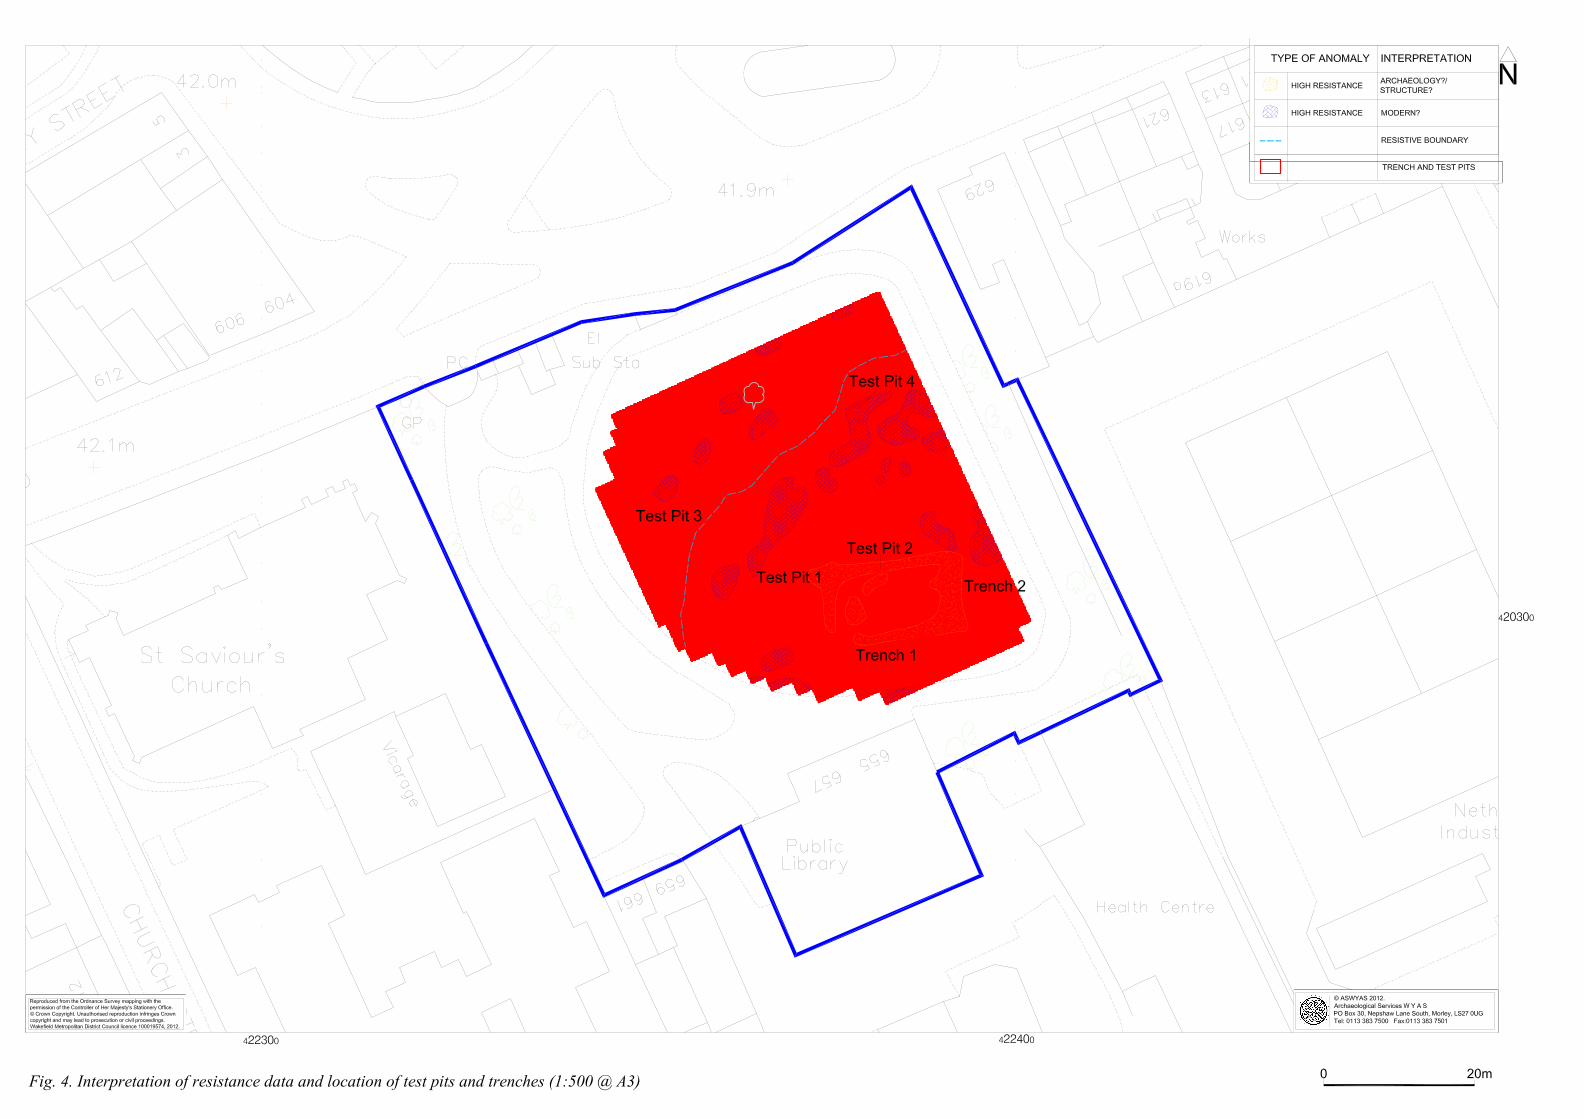
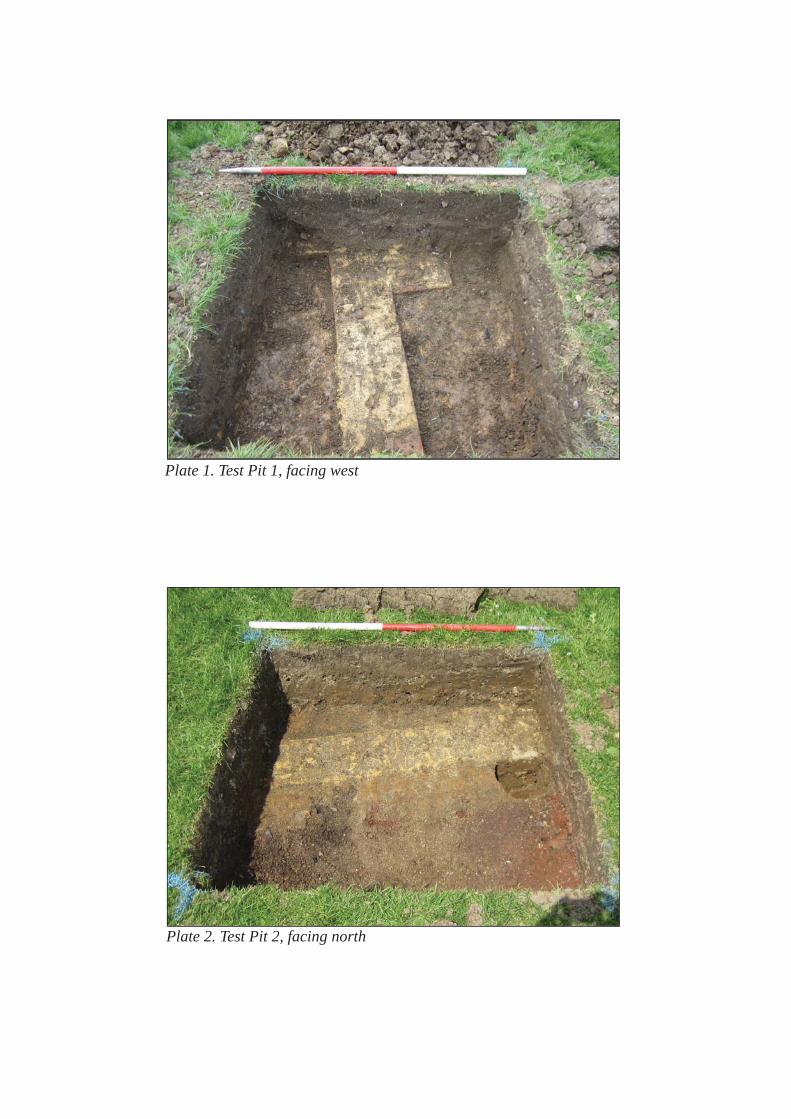
Plate 1. Test Pit 1, facing west
Plate 2. Test Pit 2, facing north
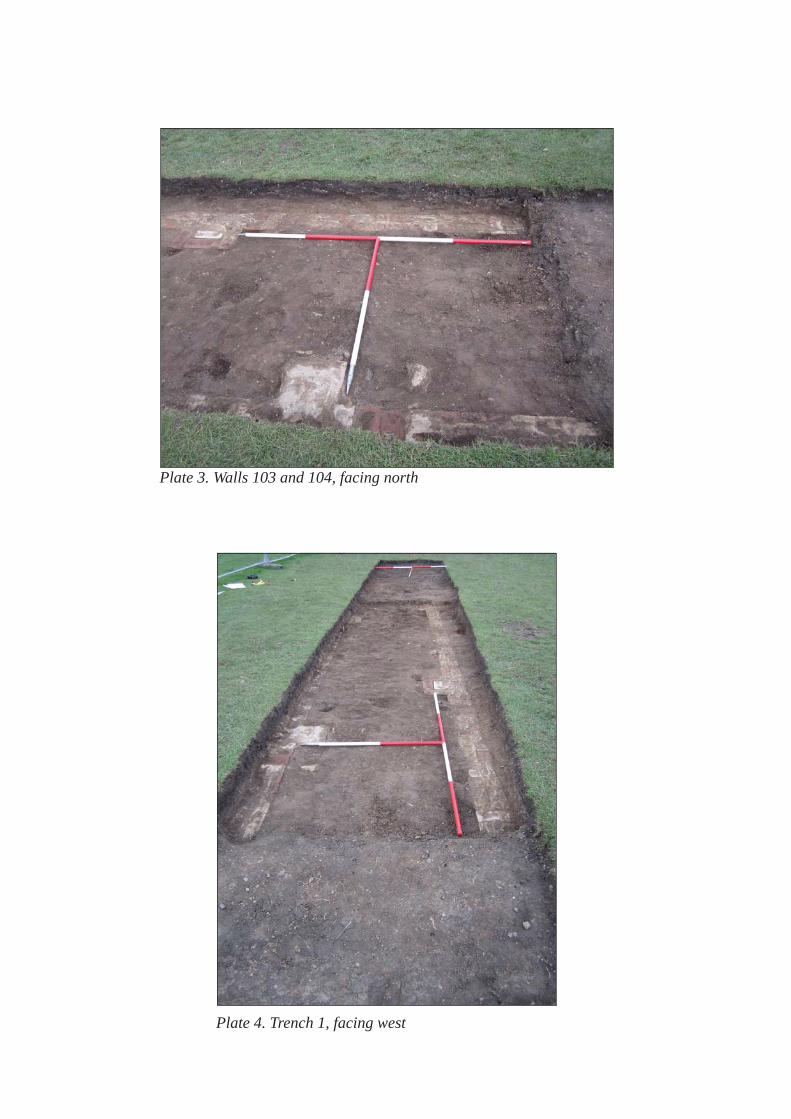
Plate 3. Walls 103 and 104, facing north
Plate 4. Trench 1, facing west
Archaeological Services WYAS Report No. 2409 Ravensthorpe Heritage Project
Appendix 1: Magnetic survey - technical information
Magnetic Susceptibility and Soil Magnetism
Iron makes up about 6% of the Earth’s crust and is mostly present in soils and rocks as minerals such as maghaemite and haemetite. These minerals have a weak, measurable magnetic property termed magnetic susceptibility. Human activities can redistribute these minerals and change (enhance) others into more magnetic forms so that by measuring the magnetic susceptibility of the topsoil, areas where human occupation or settlement has occurred can be identified by virtue of the attendant increase (enhancement) in magnetic susceptibility. If the enhanced material subsequently comes to fill features, such as ditches or pits, localised isolated and linear magnetic anomalies can result whose presence can be detected by a magnetometer (fluxgate gradiometer).
In general, it is the contrast between the magnetic susceptibility of deposits filling cut features, such as ditches or pits, and the magnetic susceptibility of topsoil’s, subsoil’s and rocks into which these features have been cut, which causes the most recognisable responses. This is primarily because there is a tendency for magnetic ferrous compounds to become concentrated in the topsoil, thereby making it more magnetic than the subsoil or the bedrock. Linear features cut into the subsoil or geology, such as ditches, that have been silted up or have been backfilled with topsoil will therefore usually produce a positive magnetic response relative to the background soil levels. Discrete feature, such as pits, can also be detected. The magnetic susceptibility of a soil can also be enhanced by the application of heat and the fermentation and bacterial effects associated with rubbish decomposition. The area of enhancement is usually quite large, mainly due to the tendency of discard areas to extend beyond the limit of the occupation site itself, and spreading by the plough. An advantage of magnetic susceptibility over magnetometry is that a certain amount of occupational activity will cause the same proportional change in susceptibility, however weakly magnetic is the soil, and so does not depend on the magnetic contrast between the topsoil and deeper layers. Susceptibility survey is therefore able to detect areas of occupation even in the absence of cut features. On the other hand susceptibility survey is more vulnerable to the masking effects of layers of colluvium and alluvium as the technique, using the Bartington system, can generally only measure variation in the first 0.15m of plough-soil.
Types of Magnetic Anomaly
In the majority of instances anomalies are termed ‘positive’. This means that they have a positive magnetic value relative to the magnetic background on any given site. However some features can manifest themselves as ‘negative’ anomalies that, conversely, means that the response is negative relative to the mean magnetic background.
Archaeological Services WYAS Report No. 2409 Ravensthorpe Heritage Project
Where it is not possible to give a probable cause of an observed anomaly a ‘?’ is appended. It should be noted that anomalies interpreted as modern in origin might be caused by features that are present in the topsoil or upper layers of the subsoil. Removal of soil to an archaeological or natural layer can therefore remove the feature causing the anomaly.
The types of response mentioned above can be divided into five main categories that are used in the graphical interpretation of the magnetic data:
Isolated dipolar anomalies (iron spikes)
These responses are typically caused by ferrous material either on the surface or in the topsoil. They cause a rapid variation in the magnetic response giving a characteristic ‘spiky’ trace. Although ferrous archaeological artefacts could produce this type of response, unless there is supporting evidence for an archaeological interpretation, little emphasis is normally given to such anomalies, as modern ferrous objects are common on rural sites, often being present as a consequence of manuring.
Areas of magnetic disturbance
These responses can have several causes often being associated with burnt material, such as slag waste or brick rubble or other strongly magnetised/fired material. Ferrous structures such as pylons, mesh or barbed wire fencing and buried pipes can also cause the same disturbed response. A modern origin is usually assumed unless there is other supporting information.
Linear trend
This is usually a weak or broad linear anomaly of unknown cause or date. These anomalies are often caused by agricultural activity, either ploughing or land drains being a common cause.
Areas of magnetic enhancement/positive isolated anomalies
Areas of enhanced response are characterised by a general increase in the magnetic background over a localised area whilst discrete anomalies are manifest by an increased response (sometimes only visible on an XY trace plot) on two or three successive traverses. In neither instance is there the intense dipolar response characteristic exhibited by an area of magnetic disturbance or of an ‘iron spike’ anomaly (see above). These anomalies can be caused by infilled discrete archaeological features such as pits or post-holes or by kilns. They can also be caused by pedological variations or by natural infilled features on certain geologies. Ferrous material in the subsoil can also give a similar response. It can often therefore be very difficult to establish an anthropogenic origin without intrusive investigation or other supporting information.
Linear and curvilinear anomalies
Such anomalies have a variety of origins. They may be caused by agricultural practice (recent ploughing trends, earlier ridge and furrow regimes or land drains); natural geomorphological features such as palaeochannels or by infilled archaeological ditches.
Archaeological Services WYAS Report No. 2409 Ravensthorpe Heritage Project
Methodology: Gradiometer Survey
There are two main methods of using the fluxgate gradiometer for commercial evaluations. The first of these is referred to as magnetic scanning and requires the operator to visually identify anomalous responses on the instrument display panel whilst covering the site in widely spaced traverses, typically 10m apart. The instrument logger is not used and there is therefore no data collection. Once anomalous responses are identified they are marked in the field with bamboo canes and located on a base plan. This method is usually employed as a means of selecting areas for detailed survey when only a percentage sample of the whole site is to be subject to detailed survey.
The disadvantages of magnetic scanning are that features that produce weak anomalies (less than 2nT) are unlikely to stand out from the magnetic background and so will be difficult to detect. The coarse sampling interval means that discrete features or linear features that are parallel or broadly oblique to the direction of traverse may not be detected. If linear features are suspected in a site then the traverse direction should be perpendicular (or as close as is possible within the physical constraints of the site) to the orientation of the suspected features. The possible drawbacks mentioned above mean that a ‘negative’ scanning result should be validated by sample detailed magnetic survey (see below).
The second method is referred to as detailed survey and employs the use of a sample trigger to automatically take readings at predetermined points, typically at 0.25m intervals, on zigzag traverses 1m apart. These readings are stored in the memory of the instrument and are later dumped to computer for processing and interpretation. Detailed survey allows the visualisation of weaker anomalies that may not have been detected by magnetic scanning.
During this survey a Bartington Grad601 magnetic gradiometer was used taking readings on the 0.1nT range, at 0.25m intervals on zigzag traverses 1m apart within 20m by 20m square grids. The instrument was checked for electronic and mechanical drift at a common point and calibrated as necessary. The drift from zero was not logged.
Data Processing and Presentation
The detailed gradiometer data has been presented in this report in XY trace and greyscale formats. In the former format the data shown is ‘raw’ with no processing other than grid biasing having been done. The data in the greyscale images has been interpolated and selectively filtered to remove the effects of drift in instrument calibration and other artificial data constructs and to maximise the clarity and interpretability of the archaeological anomalies.
An XY plot presents the data logged on each traverse as a single line with each successive traverse incremented on the Y-axis to produce a ‘stacked’ plot. A hidden line algorithm has been employed to block out lines behind major ‘spikes’ and the data has been clipped. The main advantage of this display option is that the full range of data can be viewed, dependent on the clip, so that the ‘shape’ of individual anomalies can be discerned and potentially

Archaeological Services WYAS Report No. 2409 Ravensthorpe Heritage Project
archaeological anomalies differentiated from ‘iron spikes’. Geoplot 3 software was used to create the XY trace plots. The same program was used to produce the greyscale images. All greyscale plots are displayed using a linear incremental scale.
Archaeological Services WYAS Report No. 2409 Ravensthorpe Heritage Project
Appendix 2: Earth Resistance Survey - technical information
Soil Resistance
The electrical resistance of the upper soil horizons is predominantly dependant on the amount and distribution of water within the soil matrix. Buried archaeological features, such as walls or infilled ditches, by their differing capacity to retain moisture, will impact on the distribution of sub-surface moisture and hence affect electrical resistance. In this way there may be a measurable contrast between the resistance of archaeological features and that of the surrounding deposits. This contrast is needed in order for sub-surface features to be detected by a resistance survey.
The most striking contrast will usually occur between a solid structure, such as a wall, and water-retentive subsoil. This shows as a resistive high. A weak contrast can often be measured between the infill of a ditch feature and the subsoil. If the infill material is soil it is likely to be less compact and hence more water retentive than the subsoil and so the feature will show as a resistive low. If the infill is stone the feature may retain less water than the subsoil and so will show as a resistive high.
The method of measuring variations in ground resistance involves passing a small electric current (1mA) into the ground via a pair of electrodes (current electrodes) and then measuring changes in current flow (the potential gradient) using a second pair of electrodes (potential electrodes). In this way, if a structural feature, such as a wall, lies buried in a soil of uniform resistance much of the current will flow around the feature following the path of least resistance. This reduces the current density in the vicinity of the feature, which in turn increases the potential gradient. It is this potential gradient that is measured to determine the resistance. In this case, the gradient would be increased around the wall giving a positive or high resistance anomaly.
In contrast a feature such as an infilled ditch may have a moisture retentive fill that is comparatively less resistive to current flow. This will increase the current density and decrease the potential gradient over the feature giving a negative or low resistance anomaly.
Survey Methodology
The most widely used archaeological technique for earth resistance surveys uses a twin probe configuration. One current and one potential electrode (the remote or static probes) are fixed firmly in the ground a set distance away from the area being surveyed. The other current and potential electrodes (the mobile probes) are mounted on a frame and are moved from one survey point to the next. Each time the mobile probes make contact with the ground an electrical circuit is formed between the current electrodes and the potential gradient between the mobile and remote probes is measured and stored in the memory of the instrument.
A Geoscan RM15 resistance meter was used during this survey, with the instrument logging each reading automatically at 1m intervals on traverses 1m apart. The mobile probe spacing
Archaeological Services WYAS Report No. 2409 Ravensthorpe Heritage Project
was 1m with the remote probes 15m apart and at least 15m away from the grid under survey. This mobile probe spacing of 1m gives an approximate depth of penetration of 1.5m for most archaeological features. Consequently a soil cover in excess of 1m may mask, or significantly attenuate, a geophysical response.
Data Processing and Presentation
All of the illustrations incorporating a digital map base were produced in AutoCAD 2008 ( Autodesk).
The resistance data is presented in this report in greyscale format with a linear gradation of values and was obtained by exporting a bitmap from the processing software (Geoplot v3.0; Geoscan Research) into AutoCAD 2008. The data has been processed and has also been interpolated by a value of 0.5 in both the X and Y axes using a sine wave (x)/x function to give a smoother, better defined plot.
Archaeological Services WYAS Report No. 2409 Ravensthorpe Heritage Project
Appendix 3: Survey location information
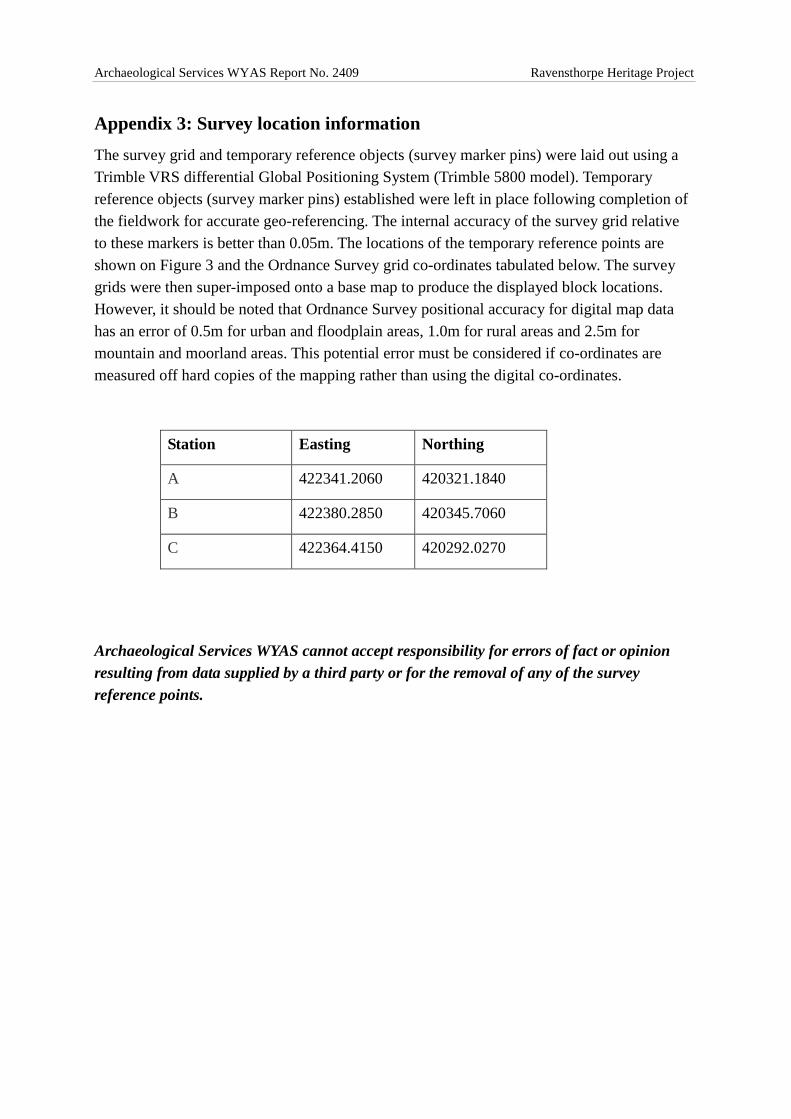
The survey grid and temporary reference objects (survey marker pins) were laid out using a Trimble VRS differential Global Positioning System (Trimble 5800 model). Temporary reference objects (survey marker pins) established were left in place following completion of the fieldwork for accurate geo-referencing. The internal accuracy of the survey grid relative to these markers is better than 0.05m. The locations of the temporary reference points are shown on Figure 3 and the Ordnance Survey grid co-ordinates tabulated below. The survey grids were then super-imposed onto a base map to produce the displayed block locations. However, it should be noted that Ordnance Survey positional accuracy for digital map data has an error of 0.5m for urban and floodplain areas, 1.0m for rural areas and 2.5m for mountain and moorland areas. This potential error must be considered if co-ordinates are measured off hard copies of the mapping rather than using the digital co-ordinates.
Station Easting Northing
A 422341.2060 420321.1840
B 422380.2850 420345.7060
C 422364.4150 420292.0270
Archaeological Services WYAS cannot accept responsibility for errors of fact or opinion resulting from data supplied by a third party or for the removal of any of the survey reference points.

Archaeological Services WYAS Report No. 2409 Ravensthorpe Heritage Project
Appendix 4: Geophysical archive
The geophysical archive comprises:-
• an archive disk containing compressed (WinZip 8) files of the raw data, report text (Microsoft Word 2000), and graphics files (Adobe Illustrator CS2 and AutoCAD 2007) files; and
• a full copy of the report.
At present the archive is held by Archaeological Services WYAS
Archaeological Services WYAS Report No. 2409 Ravensthorpe Heritage Project
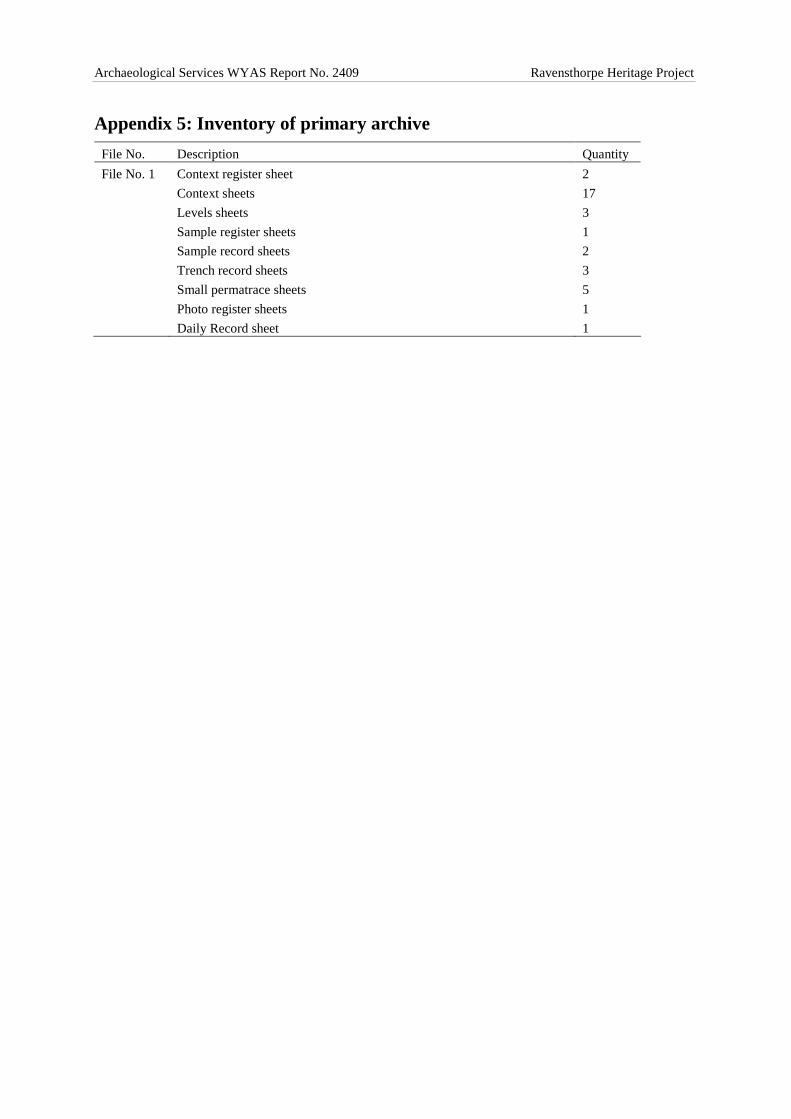
Appendix 5: Inventory of primary archive
File No. Description Quantity
File No. 1 Context register sheet 2
Context sheets 17
Levels sheets 3
Sample register sheets 1
Sample record sheets 2
Trench record sheets 3
Small permatrace sheets 5
Photo register sheets 1
Daily Record sheet 1
Archaeological Services WYAS Report No. 2409 Ravensthorpe Heritage Project
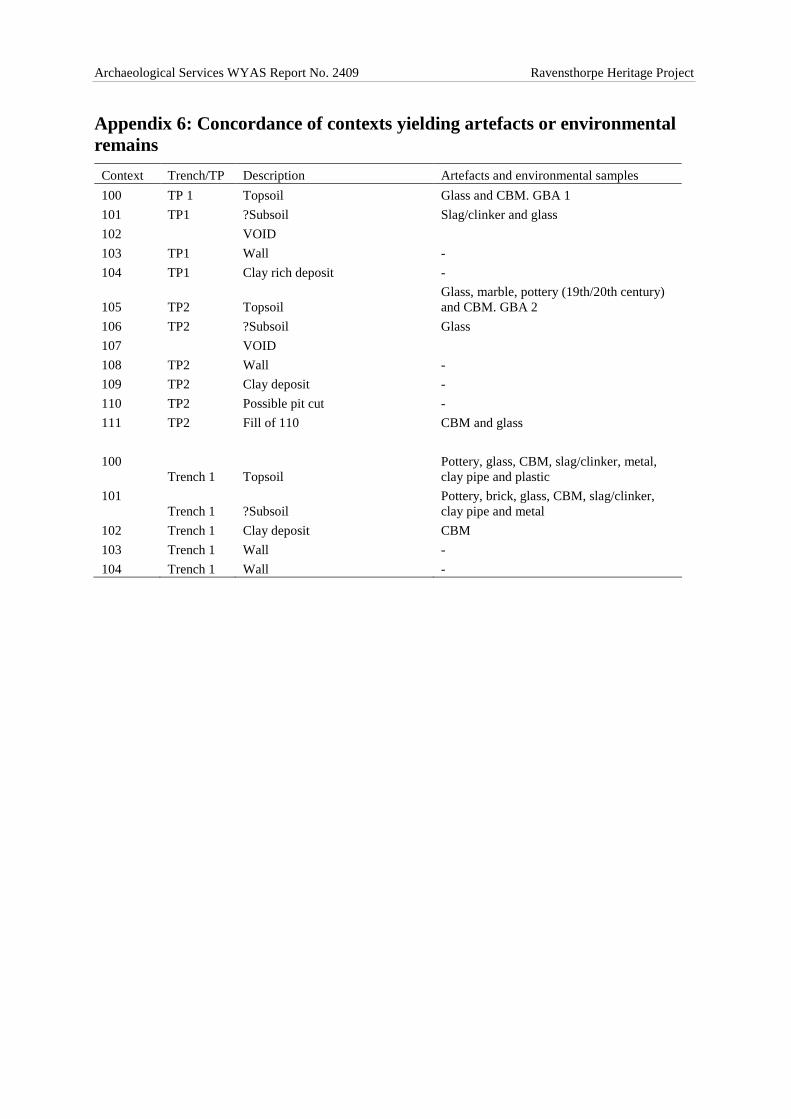
Appendix 6: Concordance of contexts yielding artefacts or environmental remains
Context Trench/TP Description Artefacts and environmental samples
100 TP 1 Topsoil Glass and CBM. GBA 1
101 TP1 ?Subsoil Slag/clinker and glass
102 VOID
103 TP1 Wall -
104 TP1 Clay rich deposit -
105 TP2 Topsoil Glass, marble, pottery (19th/20th century) and CBM. GBA 2
106 TP2 ?Subsoil Glass
107 VOID
108 TP2 Wall -
109 TP2 Clay deposit -
110 TP2 Possible pit cut -
111 TP2 Fill of 110 CBM and glass
100 Trench 1 Topsoil
Pottery, glass, CBM, slag/clinker, metal, clay pipe and plastic
101 Trench 1 ?Subsoil
Pottery, brick, glass, CBM, slag/clinker, clay pipe and metal
102 Trench 1 Clay deposit CBM
103 Trench 1 Wall -
104 Trench 1 Wall -

Archaeological Services WYAS Report No. 2409 Ravensthorpe Heritage Project
Bibliography
ASWYAS, 2010, Site Recording Manual, ASWYAS unpublished guidance document
Institute for Archaeologists, 2008, Standard and guidance for archaeological field evaluation
Soil Survey of England and Wales, 1983, Soils of Northern England Sheet 1
West Yorkshire Joint Services, 2012, Ravensthorpe Heritage Project. Project Report 2012