raven’s rock and the tanawha trail sarah dochow andrew may callie safley
TRANSCRIPT

Raven’s Rock and the Raven’s Rock and the Tanawha TrailTanawha Trail
Sarah DochowSarah Dochow
Andrew MayAndrew May
Callie SafleyCallie Safley

PurposePurpose
• Estimate Value
• Determine Demand for the Environmental Resources
• Investigate Factors– Permit– Ranger Presence– Maintenance


TheoryTheory
• Demand Curve – Created by putting trips on the horizontal axis
and the travel cost on the vertical axis
• Consumer surplus – Region below the demand curve and above
the average price level

TheoryTheory$
TRIPS
CS
ΔCS

MethodMethod
• Random Interviews– At or near Tanawha Trail and Raven’s Rock– Hypothetical questions used to establish shifts
in the demand curve
• Demand curve– Derived from interview responses
• Confirmed confidentiality – Made results available if requested

DataData
• Sample size = 38 people
• Average Number of Trips to Tanawha Trail– 3.13 ± 0.67
• Average Number of Trips to Raven’s Rock– 1.907 ± 0.464

Data (cont.)Data (cont.)
• Average Willingness to Pay for hiking permit – $7.59 – SD = $10.81
• Average Travel Cost (.36*roundtrip distance)– $79.08 – SD = $113.76

Data (cont.)Data (cont.)
• 63% were male participants
• Average Education level was 3.5 years of college
• Average age was 34
• 74% were willing to pay for a permit

Statistical ResultsStatistical Results
• We took the natural log of RP-trips and add one to get the values for the horizontal axis: ln(trips+1)
• We had travel cost on the vertical axis calculated by: (.36*roundtrip distance)
• We had three possible demand shifters but only one was statistically significant at the 92% level: (1-pvalue)= (1-.08)=.92

Demand ModelDemand Model
CoefficientStandard
Error t Stat
Intercept 0.85 0.131 6.53
Demand Slope -0.0015 0.00062 -2.40
Park Ranger 0.028 0.171 0.165
Trail Maintenance 0.313 0.171 1.83

Demand ModelDemand Model
0
100
200
300
400
500
600
0 0.5 1 1.5 2 2.5
Trips
Tra
ve
l co
st
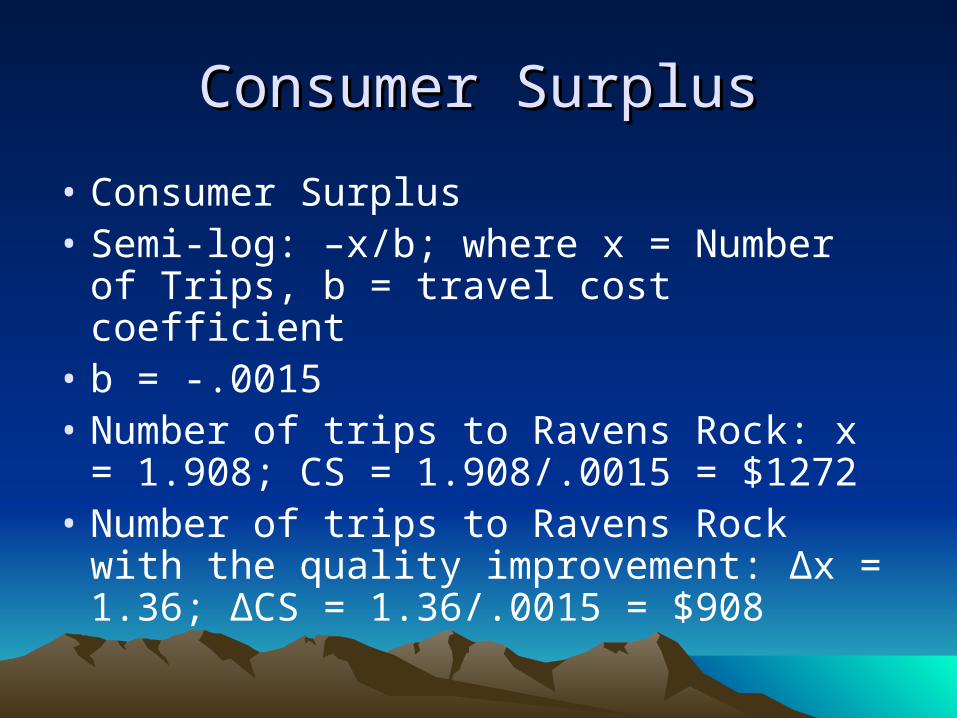
Consumer SurplusConsumer Surplus
• Consumer Surplus • Semi-log: –x/b; where x = Number of
Trips, b = travel cost coefficient• b = -.0015• Number of trips to Ravens Rock: x =
1.908; CS = 1.908/.0015 = $1272• Number of trips to Ravens Rock with the
quality improvement: Δx = 1.36; ΔCS = 1.36/.0015 = $908

Aggregate CSAggregate CS
• Individual ΔCS = $908
• Population of 5 counties = 903,568
• We assume that 5% are hikers (Outdoor Recreation Participation Study)
• Aggregate ΔCS = 41,021,987.2

AnalysisAnalysis
• Major Factor– People are more concerned with trail
maintenance than costs
• Bias – People live in these locations due to the fact
that they enjoy activities, like hiking
• Improvement for further Research– Larger sample size– More diversity among survey participants