rationales and mechanisms for revitalizing us manufacturing r
TRANSCRIPT

Rationales and mechanisms for revitalizing USmanufacturing R&D strategies
Gregory Tassey
� US Government 2010
Abstract The race to economic superiority is increasingly occurring on a global scale.
Competitors from different countries are employing new types of growth strategies in
attempts to win that race. The United States cannot, therefore, continue to rely on outdated
economic growth strategies, which include an inability to understand the complexity of the
typical industrial technology and the synergies among tiers in high-tech supply chains. In
this context, a detailed rationale is provided for maintaining a viable domestic technology-
based manufacturing capability. In the United States, the still dominant neoclassical
economic philosophy is at best ambivalent on the issue of whether a technology-based
economy should attempt to remain competitive in manufacturing or let this sector continue
to offshore in response to trends in comparative advantage, as revealed through shifts in
relative prices. The paper argues that the neoclassical view is inaccurate and that a new
innovation model is required to guide economic growth policy. Specifically, the paper
provides (1) a rationale for why an advanced economy such as the United States needs a
manufacturing sector; (2) examples of the process of deterioration of competitive positions
for individual industries and, more important, entire high-tech supply chains; (3) an
explanation of the inadequacy of current economic models for rationalizing needed new
policy strategies; and (4) a new economic framework for determining both policy mech-
anisms and targets for those mechanisms, with emphasis on the systems nature of modern
technologies and the consequent requirement for public–private innovation ecosystems to
develop and deliver these technologies. Several targets are suggested for major policy
mechanisms.
Keywords Innovation economics � Economic growth policy � Manufacturing �Innovation policy models � Policy mechanisms
JEL Classification 03 � 02
G. Tassey (&)National Institute of Standards and Technology, Gaithersburg, MD, USAe-mail: [email protected]
123
J Technol TransfDOI 10.1007/s10961-009-9150-2

1 The problem statement
US manufacturing’s competitive status is increasingly challenged by other economies.
Established industrialized nations such as Japan, Germany, Korea and Taiwan are devel-
oping state-of-the-art technologies, which range across all areas of manufacturing from
electronics to discrete parts. Products based on technologies that originated in the US
economy, such as semiconductors and robotics, are increasingly both developed and
produced elsewhere. Emerging economies, such as China, are acquiring manufacturing
capability through modest R&D intensities, tax and other incentives for foreign direct
investment, and intellectual property theft. This second group then competes through low-
cost labor and the use of exchange rate manipulation along with tariff and non-tariff
barriers.
However, emerging technology-based economies have the long-term goal of attaining
world-class status as innovators, which means they are not content to operate in the low-
technology, labor-intensive portion of manufacturing. China already is producing 30,000
patents annually and its patent application rate trails only the United States and Japan.1
Finally, event the huge US lead in biopharmaceuticals is now under attack, as an increasing
number of economies invest in supporting science and technology infrastructures and
provide financial incentives for foreign direct investment in this rapidly expanding
technology.
The combined long-term impact on the US economy of investments by both established
and newly industrialized economies has been the offshoring of substantial portions of US
manufacturing supply chains—first the labor-intensive industries but now the high-tech
ones, as well.
Technological convergence is occurring across the global economy even though the US
manufacturing sector has become somewhat more high-tech over the past three decades.
The reason is that ‘‘more high-tech’’ is a relative term in that US manufacturing’s average
R&D intensity has increased over a 25-year period from 2.6% in 1983 to 3.7% in 2007.
However, this ratio is still well below the R&D intensities of truly high-tech industries.2
Moreover, part of this modest increase is due to the offshoring of the lowest R&D-
intensive manufacturing industries, rather than to absolute increases in R&D spending by
the remaining domestic industries.
The importance of the development or acquisition of technology combined with its
effective utilization cannot be overstated. Economic studies over several decades have
demonstrated the essential role of technology in economic growth. Essentially, the high-
income economy must be the high-tech economy. However, larger manufacturing com-
panies have responded to the competitive pressures of globalization and the lack of an
adequate domestic policy response by offshoring R&D as well as processing activities.
This strategy has helped these firms but has also taken value added out of the US economy.
Smaller firms often do not have this option and are suffering to a greater degree from
increasing foreign competition (Petrick 2009). A recent study by the American Small
Manufacturers Coalition (ASMC) estimates that one-third of small manufacturers (90,000
firms with sales less than $10 million in annual revenue) are not at or near world-class in
any element of corporate strategy. For larger firms (more than $100 million in revenue), a
1 Source: Thomson Reuters’ Derwent World Patents Index.2 These R&D intensities are for company-funded R&D. Adding externally supplied R&D funding (largelyfrom the US government) increases the ratios slightly. For example, using ‘‘total R&D performed’’ as themetric raised the US manufacturing sector’s R&D intensity in 2007 to 4.1%.
G. Tassey
123

smaller share (14%) are estimated to be equally deficient. Given that the US economy has
282,000 small and midsize manufacturing firms, this deficiency is a significant threat to
overall US competitiveness.3
Moreover, the problems of this fraction of US manufacturing firms represent only a
portion of the widespread competitive deficiencies affecting the entire sector. Figure 1
clearly shows the long-term process of decline even for the ‘‘high-tech’’ portion of the
domestic manufacturing sector. The balance of trade for ‘‘advanced technology products’’
was in surplus from 1988 until 2002, when it turned negative.4 This trend has continued,
even in the face of approximately a 25% decline in the major-currency US dollar index
during this decade.5 The underlying problem is that US manufacturing firms are attempting
to compete largely as independent entities against a growing number of national economies
in Europe and Asia in which government, industry, and a broad infrastructure (technical,
education, economic, and information) are evolving into increasingly effective technology-
based ecosystems.
More specifically, such ‘‘national system’’ models of economic growth are increasingly
attractive to global companies, as they enhance the productivity of private-sector R&D and
increase access by companies to external sources of technical knowledge. Consequently,
companies are allocating more of their global R&D budgets to countries that provide more
efficient R&D infrastructures and greater financial incentives for the R&D itself. The
-600
-500
-400
-300
-200
-100
0
100
1988 1990 1992 1994 1996 1998 2000 2002 2004 2006 2008
All Manufactured Products
Advanced Technology Products
$ billions
Fig. 1 US trade balances for high-tech and all manufactured products. Source: Census Bureau, ForeignTrade Division
3 American Small Manufacturers Coalition, Next Generation Manufacturing Study (June 2009)http://www.smallmanufacturers.org/picts/NGM-Overview-and-Findings.pdf.4 The Census Bureau uses approximately 22,000 product codes to collect trade data. 500 of them are labeledas ‘‘advanced technology products’’ and a separate trade balance has been computed for this subgroup since1988. The ATP balance was positive every year until 2002, when it turned negative. The deficit has grownevery year since 2002 and provides one of several alarming indicators of the declining competitiveness ofUS manufacturing.5 Federal Reserve Board foreign exchange releases. In the period 2000–2008, the dollar declined 24.4%against an index of major foreign currencies (16.9% against all currencies).
Rationales and mechanisms for R&D strategies
123

impact of this trend is dramatically apparent in NSF survey data that show US manufac-
turing firms’ investment in R&D outside the United States grew from 1999–2007 at almost
three times the rate of these companies’ domestically funded R&D.6
Yet, no comprehensive domestic manufacturing strategy exists. A major historical
reason for the omission of manufacturing from economic growth policy initiatives is that
most economists find no problem with the progressive shrinking of manufacturing’s role in
US economic growth. These neoclassical economists, who have dominated government
policy advisory positions for decades, cite the law of comparative advantage as the
rationale for being content with the ongoing global reallocations of manufacturing assets to
other economies. Under this ‘‘law’’, resources are reallocated to wherever in the world they
can be most efficiently used, which raises aggregate global economic welfare. Special-
ization is also argued to lead to higher real wages for the US economy through a virtually
automatic adjustment mechanism that reallocates resources into new higher productivity
areas of the domestic economy.
In fact, the US economy has been the innovator of virtually all major technologies in the
post World-War-II era. Looking backward, neoclassical economists have been able to
assert that domestic resources left idle by offshoring would automatically shift to new,
higher productivity industries. And, they were right as long as the global technology-based
economy could be accurately described largely by a one-country technology-based growth
model. In such a model (no significant competition), no matter how inefficient and hence
long are domestic innovation processes, resources impacted by offshoring are eventually
reallocated to higher productivity sectors. Even when the global pace of technological
change began to accelerate and thereby threatened to restructure comparative advantage
against the United States, the domestic economy’s installed base of technology-producing
assets allowed it to extend its high-income position for a period of time.
Such experience leads to a strong ‘‘installed-wisdom effect,’’ which is characterized by
the inability of the leader to recognize the need for radical change in economic growth
strategy in response to major changes in the global economy—in particular, changes in the
nature and extent by which countries compete on the basis of technology (Schumpeter
1950; Christensen 1997; Tassey 2007a).
This effect derives in part from a related ‘‘installed-base effect,’’ whereby the leading
economy accumulates massive amounts of technological, physical, human, organizational,
marketing and other assets during the process of reaching the position of economic leader.
Consciously scrapping these assets that worked well in the past is a difficult decision to
make and is typically deferred. In contrast, emerging economies, with no such installed
base of assets and no ties to past ‘‘wisdoms,’’ more readily adopt new asset structures and
ways of competing.
The combined effect of a pluralistic technology-based global economy and the
unwillingness of the domestic policies to force adaptation is that technological change
cannot only shift comparative advantage through trade but lower real incomes in the
economies that do not develop and use new technologies to a sufficient degree. Yet, only a
few US economists, including Nobel Laureate Paul Samuelson, seem to understand this
dynamic of long-term global competition. Referring to the role of technology, Samuelson
states that ‘‘invention abroad that gives to [other countries] some of the comparative
6 Sources: National Science Foundation’s Science and Engineering Indicators 2006 and 2008 and Research& Development in Industry 2007. Between 1999 and 2007, foreign R&D funded by US manufacturing firmsgrew 191% and their funded R&D performed domestically grew 67%.
G. Tassey
123

advantage that had belonged to the United States can induce for the United States per-
manent lost per capita real income’’ (Samuelson 2004, p. 137).7
In contrast, with mainstream economists arguing that ‘‘fair free trade’’ more or less
automatically benefits all trading partners through ‘‘negotiated’’ specialization, the media
have picked up on this conventional wisdom, thereby reinforcing out-of-date economic
doctrine. For example, in a May 25, 2009 editorial, the Financial Times recommended that
Japan follow the US–UK strategy of largely giving up on manufacturing and thereby
‘‘support high-paying research and management jobs’’ in the domestic economy.
In summary, the installed wisdom effect has embodied a highly simplistic view of the
role and impact of technology, to continue to dominate US economic growth policy. In
contrast, a growing number of competing nations are adopting ‘‘innovation-economics’’
principles—an extension of ‘‘neo-Schumpeterian’’ economics (in reference to the famous
Austrian economist Joseph Schumpeter). Schumpeter’s best known concept is the process
of ‘‘creative destruction,’’ which describes how new technologies replace old ones and
thereby create new competitive advantages within and across nations. A major implication
of this body of thought is that relative incomes can and do shift across national economies
in response to technological change.
The important policy implications of innovation economics, to be described in detail in
the following sections, are (1) the potential exists for competing nations to create com-
parative advantage through technology and thereby shift relative prices and ultimately
incomes in their favor, and (2) purely private-sector reallocations based on relative prices
will result in a relentless decline in an economy’s share of global income, as other
economies with public–private technology investment strategies more rapidly and effi-
ciently innovate and acquire dominant market shares.8
The economics of the innovation economy is complex and therefore so are the required
economic growth policies. If nothing else, the remainder of this paper will demonstrate this
fact. However, there is no getting around this complexity if successful national growth
strategies are to be developed.
2 The economic rationale for high-tech manufacturing
Between 2007 and 2009, the US economy lost over 8 million jobs—the largest decline in
any recession since the Great Depression. The unemployment rate exceeded 10% for only
the second time since 1948. Particularly alarming is that approximately half of the
unemployed have been permanently terminated. Analyses by economists, Wall Street
analysts and others have been about when the severe cyclical distortions will subside,
allowing employment to stop declining and eventually start growing again. This debate
ignores the structural impediments in the US economy that will constrain domestic
employment growth long after the recession is officially over.
The unemployment rate is known to be a lagging indicator of an economic rebound
because companies use temporary workers and overtime until growth in demand is suf-
ficiently established to rationalize hiring additional workers. In the meantime, companies
pay existing workers overtime and invest in productivity enhancements. The problem
going forward is that this lag will be far longer than anticipated and even when hiring
7 See also Hira (2009).8 See Atkinson and Audretsch (2008) for a review of the differences between these two bodies of economicthought.
Rationales and mechanisms for R&D strategies
123

begins it will be tepid. Federal Reserve data show that capacity utilization in the manu-
facturing sector hit a record low in June 2009 of 65%. Due to some inventory rebuilding
and short-term government stimuli aimed at specific industries, the utilization rate rose
slightly to 68% in September, but it is still well below the average for the 1990s of more
than 80%.
One reason for a predicted sluggish recovery is the huge overhang of household debt
that will restrain consumer spending (households account for about 70% of GDP). It will
take years to rebalance household finances. But, the even more important reason because of
its long-term implications for domestic rates of economic growth is globalization. Dom-
inated by the installed-wisdom and installed-base effects, the US economy has largely
ignored the implications of global trends for decades, thereby allowing structural problems
to accumulate. Such deficiencies take decades to build up and unfortunately take a long
time to remedy. Thus, initiatives to support selected industries with short-term stimuli will
do little more than create a temporary blip in the secular decline. Some of these industries
have such inadequate overall competitive strategies and receive such little long-term
support from government for restructuring that their demise is either substantially complete
or will soon be so.
Most important, and unfortunately least understood, is the fact that the dynamics of
changing comparative advantages among nations is not accurately explained by examining
individual technologies and industries. Most modern technologies are systems, which
means interdependencies exist among a set of industries that contribute advanced mate-
rials, various components, subsystems, manufacturing systems, and eventually service
systems based on sets of manufactured hardware and software. The modern global econ-
omy is therefore constructed around supply chains, whose tiers (industries) interact in
complex ways. In the US economy, one supply chain after another has been hollowed out
by increasing foreign competition. Most of these losses have been in manufacturing. In
spite of arguments to the contrary, partial domestic supply chains often have increasing
trouble competing globally. This proposition is complex, varying among technologies and
hence high-tech supply chain. However, it is a real phenomenon that is receiving little
analysis.
More specifically, loss of competitiveness in a single tier within a supply chain is not an
isolated event. The sources of technology in the modern economy and the interdepen-
dencies among technology-based industries explain why the United States needs a man-
ufacturing sector and why this sector requires a substantial restructuring and expansion
through investment in advanced technology. Specifically, a high-tech manufacturing sector
is essential for the following reasons:
(1) Bureau of Labor Statistics data clearly show that high-tech workers in general are
paid substantially more than workers in other occupations; therefore, the high-income
economy must be the high-tech economy and this includes a competitive manufac-
turing sector, as it contains many of the most R&D-intensive industries.
(2) Manufacturing still contributes $1.6 trillion to GDP and employs 13 million workers.
Allowing this sector to decline further requires strong guarantees that high-tech (i.e.,
equal or better paying) service jobs will appear to replace the lost manufacturing
ones.
(3) The majority of trade is still in products; thus, for the foreseeable future, the US
economy cannot remove the huge and persistent overall trade deficit by relying on
services.
G. Tassey
123
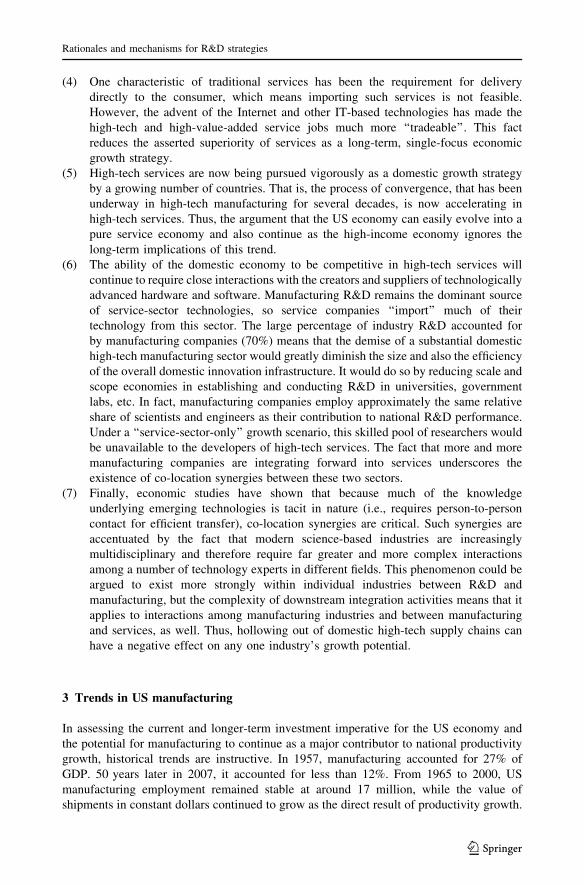
(4) One characteristic of traditional services has been the requirement for delivery
directly to the consumer, which means importing such services is not feasible.
However, the advent of the Internet and other IT-based technologies has made the
high-tech and high-value-added service jobs much more ‘‘tradeable’’. This fact
reduces the asserted superiority of services as a long-term, single-focus economic
growth strategy.
(5) High-tech services are now being pursued vigorously as a domestic growth strategy
by a growing number of countries. That is, the process of convergence, that has been
underway in high-tech manufacturing for several decades, is now accelerating in
high-tech services. Thus, the argument that the US economy can easily evolve into a
pure service economy and also continue as the high-income economy ignores the
long-term implications of this trend.
(6) The ability of the domestic economy to be competitive in high-tech services will
continue to require close interactions with the creators and suppliers of technologically
advanced hardware and software. Manufacturing R&D remains the dominant source
of service-sector technologies, so service companies ‘‘import’’ much of their
technology from this sector. The large percentage of industry R&D accounted for
by manufacturing companies (70%) means that the demise of a substantial domestic
high-tech manufacturing sector would greatly diminish the size and also the efficiency
of the overall domestic innovation infrastructure. It would do so by reducing scale and
scope economies in establishing and conducting R&D in universities, government
labs, etc. In fact, manufacturing companies employ approximately the same relative
share of scientists and engineers as their contribution to national R&D performance.
Under a ‘‘service-sector-only’’ growth scenario, this skilled pool of researchers would
be unavailable to the developers of high-tech services. The fact that more and more
manufacturing companies are integrating forward into services underscores the
existence of co-location synergies between these two sectors.
(7) Finally, economic studies have shown that because much of the knowledge
underlying emerging technologies is tacit in nature (i.e., requires person-to-person
contact for efficient transfer), co-location synergies are critical. Such synergies are
accentuated by the fact that modern science-based industries are increasingly
multidisciplinary and therefore require far greater and more complex interactions
among a number of technology experts in different fields. This phenomenon could be
argued to exist more strongly within individual industries between R&D and
manufacturing, but the complexity of downstream integration activities means that it
applies to interactions among manufacturing industries and between manufacturing
and services, as well. Thus, hollowing out of domestic high-tech supply chains can
have a negative effect on any one industry’s growth potential.
3 Trends in US manufacturing
In assessing the current and longer-term investment imperative for the US economy and
the potential for manufacturing to continue as a major contributor to national productivity
growth, historical trends are instructive. In 1957, manufacturing accounted for 27% of
GDP. 50 years later in 2007, it accounted for less than 12%. From 1965 to 2000, US
manufacturing employment remained stable at around 17 million, while the value of
shipments in constant dollars continued to grow as the direct result of productivity growth.
Rationales and mechanisms for R&D strategies
123

This growth resulted from US-based companies investing in automated process technol-
ogies while offshoring medium and low-technology production and importing these
components at cheaper prices.
During the current decade, however, a pronounced decline in manufacturing employ-
ment has occurred, largely due to the rapidly increasing attractiveness of other economies
as places to produce goods. In the 2000–2008 period, approximately 3.8 million domestic
jobs were lost in this sector.9 At the same time, the combined constant-dollar value of
shipments of durable and nondurable goods has stopped growing, remaining basically
unchanged through 2007.
An additional concern is the fact that manufacturing firms perform approximately 70%
of industry R&D, as shown in Fig. 2. In 2007, manufacturing firms employed 63.4% of all
domestic scientists and engineers (Wolfe 2009). Clearly, this sector is an essential com-
ponent of the US technology-based economy and, in particular, an essential part of an
export-led growth strategy.
Equally important, the innovative output of the manufacturing sector is the set of
components that the dominant and increasingly high-tech service sector combines into the
technological basis for the services in today’s advanced economy. One need only note the
ongoing shift from pure high-tech manufacturing to integrated manufacturing-service
strategies to appreciate the critical importance of growth policies that focus on the entire
high-tech supply chain. Doing so targets much larger potential value added and hence
much larger employment and profits for the domestic economy.
In contrast, if domestic high-tech manufacturing is allowed to move offshore, the US
lead in high-tech services will be increasingly threatened by economies that are creating
co-location synergies between the developers of hardware and software and the high-tech
services that integrate these components into the system that provides the service to
customers.
Moreover, high-tech services are not the economic panacea that is often claimed for
them. A growing number of other countries are including technology-based services in
their long-term economic growth strategies. One study estimates that 30 economies have
0%
10%
20%
30%
40%
50%
60%
70%
80%
90%
100%
Manufacturing Non-manufacturing
GDP
GDP
R&D
R&D
30.2%
86.6%
13.4%
69.8%
Fig. 2 Sector shares ofindustrial R&D performance andcontributions to GDP, 2007.Source: Bureau of EconomicAnalysis, National ScienceFoundation
9 Congressional Budget Office, ‘‘Factors Underlying the Decline in Manufacturing Employment Since2000’’ (December 23, 2008).
G. Tassey
123

policies in place to promote service exports (Kennedy and Sharma 2009). This trend
increases the imperative for a diversified and better integrated domestic economy.
Finally, service-sector R&D consists largely of systems integration, with hardware and
software being imported from manufacturing industries (Gallaher et al. 2006). Innovative
service design and hence competitive success can depend on adequate lead times with
respect to advances in components of service systems. Thus, close interaction with sup-
pliers is essential. Moreover, by virtue of being at the end of several technology supply
chains, service industries are typically far removed from the majority of the scientific
establishment, which further reduces their understanding of emerging technological trends.
These facts mean increased dependence on hardware and software firms for information on
technological opportunities and implications for strategic planning. Co-location enhances
exchanges of such information.
This is not to say that such exchanges cannot occur over long distances, overcoming
language and cultural barriers, currency swings, and differences in intellectual property
laws. Modern IT infrastructures have greatly increased the efficiency of communication.
However, for certain types of R&D, at least, the efficiency of doing so is significantly less
relative to the increased speed of information transfers made possible by new efficient
R&D infrastructures within the domestic economy that more closely integrate domestic
supply chains. Other countries are making significant investment in such R&D infra-
structures. Thus, the emphasis on global R&D networks, while important for the market
strategies of global corporations, has negative implications for domestic economic growth
policies for the simple reason that the offshoring of R&D takes valued added out of the
domestic economy and this loss is frequently followed by further loss of value added from
subsequent manufacturing that is co-located with the source of R&D.
In the end, relative effectiveness of technology investment and utilization strategies will
determine national rankings in the global economy. With current annual global R&D
expenditures of $1 trillion and many more R&D-capable economies, countries’ efforts to
‘‘tilt the flat world’’ through newly created or newly absorbed technology is an increasingly
frequent phenomenon. Nanoscience and nanotechnology research is a standout example, as
global R&D in this area is evenly distributed among North America, Europe and Asia.
The forthcoming pattern of distributed sources of nanotechnology is the forerunner of a
much more competitive global innovation economy. The higher rates of growth of new
scientists and engineers in a number of countries compared to the United States along with
faster rates of growth in R&D spending mean more of the higher paying technical jobs will
be located outside the United States. Although most of the policy literature focuses on
technology’s impact on productivity and subsequently market shares, a less-noted conse-
quence is that labor receives much higher wages on average in high-tech occupations.
These workers earn from 50 to 100% more than the average for all workers (Hecker 2005).
Thus, the global dispersion of high-tech jobs is a particularly serious trend for domestic
economic growth policy.
An important metric of an economy’s competitive position is its share of the global
valued added produced by an industry or sector. The industries making up a supply chain
all contribute valued added, which when summed up constitutes the value of ‘‘final
demand’’ collectively met by this set of industries. Thus, the policy message is to devise
and implement a supply-chain-wide growth strategy for manufacturing that captures large
shares of the most lucrative markets for manufactured goods. Over time, these markets will
be the technology-driven ones.
However, despite the massive offshoring of low-tech manufacturing over the past
four decades, many of the remaining industries are still not sufficiently R&D intensive.
Rationales and mechanisms for R&D strategies
123

Table 1 indicates the significant performance differences between R&D-intensive indus-
tries and those that are moderate-to-low R&D intensive in terms of real output. The data
show the superior performance of technology-driven economic activity.10
This long-term growth imperative, requiring structural changes in the domestic econ-
omy, has been obscured by the current economic crisis and the need for massive cyclical
stabilization efforts. The current US problems are the result of excessive consumption
financed by an enormous accumulation of debt. This era is over. Debt accumulation can be
rationalized—if it is used for investments in productivity-enhancing capacity and is limited
in duration. However, in this decade (2000–2008) total credit market debt increased 99%
while GDP grew by less than half that rate (45%). One of the major manifestations of this
debt-driven growth was a national savings rate that hovered around zero for most of this
decade. Approximately zero savings has meant that, in effect, virtually all investment has
been financed by foreign capital. The huge debt burden will require years of low con-
sumption, as American consumers refurbish their balance sheets. This means a drastically
new growth strategy is imperative.
The dramatic shift that has finally begun in the US economy from a consumption-led
growth strategy to one that will be productivity and export driven will require a renewed
focus on saving and investment that yields long-term accumulation of productive assets, as
this strategy is the only way to grow real incomes in the long run. Increasing productivity is
especially compelling as the world’s economy is currently confronted with a sharp
downshift in demand. The consequence of global excess capacity is a combination of
falling prices and reduction in less-productive capacity, which means that only the most
efficient existing or created economic assets will be viable. To survive, companies,
industries and entire economies will have to become more productive by rapidly assimi-
lating existing technologies and developing new ones.
Table 1 Relationship betweenR&D intensity and output growth
Sources: NSF for R&D intensityand BLS for real output
Industry (NAICS code) Average R&Dintensity,1999–2006
Percent change inreal output, 2001–2006
R&D intensive
Pharmaceuticals (3254) 10.3 38.3
Semiconductors (3344) 9.8 19.7
Medical equipment (3391) 8.1 39.2
Computers (3341) 6.3 83.9
Group Ave 8.6 46.6
Non-R&D intensive
Machinery (333) 3.8 12.3
Electrical equipment (335) 2.5 -6.3
Plastics & rubber (326) 2.3 4.6
Fabricated metals (332) 1.4 7.8
Group Ave 2.5 4.6
10 Government data are not sufficiently disaggregated (in particular, to the industry level) to allow alldesirable comparisons. For example, Machinery (NAICS code 333) is a large and diversified group ofindustries. Most of them are low- to moderate-R&D intensive. A few, however, such as semiconductorequipment (code 333295), are R&D intensive and produce high value-added products.
G. Tassey
123

The rapid assimilation of new technologies in response to an economic crisis is the
classic Schumpeterian creative destruction model in which these technologies often pen-
etrate markets slowly or even lie latent in various phases of development until a crisis
erupts that changes relative prices, thereby creating demand for productivity-enhancing
assets. In fact, previous severe economic crises (such as the 1930s and 1980s) were
characterized by an acceleration of technology assimilation, as companies tried to cope
with shrinking demand by increasing productivity (Bhide 2008).11
While this pattern is unfolding to some degree in the current recession, the drag of
consumer debt repayment and the zero growth in real household income since 1998 are
restraining savings and thereby inhibiting investment by both the private and public sec-
tors. Most important, even when the current global contraction passes, the increasingly
intense competition among nations will continue to intensify, as described in the following
section.
4 The shifting of global competitive positions
The incremental, uneven, and hence insidious decline in overall competitiveness of the US
manufacturing sector is indicated in Table 2 by recent trends in value added (contributions
to GDP) for a number of major industry groups. The trends are divided into two time
periods. The first period, 1985–2000, approximates the beginning of intense foreign
competition for technology-based product markets. The bottom-line impact was increased
offshoring and domestic investment in information and other productivity enhancing
technologies to combat the combination of growing global technology competence and
lower labor costs. The second time period is the current decade (data available through
2007) in which offshoring has accelerated and broadened its impact on the US economy.
Table 2 Trends in value added by major industry group
Industry (NAICS code) % Change in value added R&D intensity2003
1985–2000 2000–2007GDP 132.6 40.6 2.6
Manufacturing (31-33) (92.7) (13.4) 3.6
Motor vehicles and parts (3361-63) (84.0) (-16.6) (2.5)
Textiles, apparel and leather (313-16) (8.2) (-30.4) (1.6)
Computer & electronic products (334) 144.5 (-21.2) 9.0
Publishing, including software (511) 225.1 (18.9) 17.1
Information & data processing (518) 305.4 63.7 8.7
Professional, scientific & Tech. services (54) 249.6 49.3 10.0
Health care (621-23) 194.6 60.4 3.9
Source: Bureau of Economic Analysis for value added and National Science Foundation for R&D intensity
11 Bhide points out that the 1930s had the highest productivity growth of any decade in the twentiethcentury. Technologies developed in the 1920s but not widely adopted then were rapidly diffused in the1930s in response to corporate desperation to remain viable in the face of falling demand. Similarly, thesevere recession of the early 1980s and the onset of significant foreign competition led to rapid diffusion ofthe PC and other information technologies, as well as concerted efforts to revitalize high-tech industries, inparticular, semiconductors.
Rationales and mechanisms for R&D strategies
123

The growth rates in parentheses in Table 2 identify industry groups that underperformed
the economy as a whole in that time period (as indicated by GDP growth). From 1985 to
2000, manufacturing’s contribution to national value added grew somewhat slower than
overall GDP (93 vs. 133%). Within manufacturing, some traditional industries, such as
those making up the automotive supply chain (84%), grew more slowly than the sector as a
whole. Low-R&D intensity industries grew much slower, as they were the early victims of
globalization. For example, the value added by textiles, apparel, and leather goods barely
grew at all during this period (8%). In contrast, the four service industry groups shown
(three of which are highly R&D intensive) significantly outperformed the broader economy
with growth rates in the 200–300% range.12
The column in Table 2 for the current decade indicates that the situation has deterio-
rated significantly. The continual encroachment of foreign competition has led to a dra-
matic decline in the growth of value added in manufacturing. In the 2000–2007 period,
manufacturing’s growth rate has fallen substantially relative to overall economic growth
(to 33% of the economy’s growth rate vs. 91% of GDP growth in the prior period). The
value added by the automotive supply chain and textiles, apparel, and leather actually
declined 17 and 30%, respectively. That is, traditional (low to moderate R&D-intensive)
industries have not only underperformed relative to the economy but have actually shrunk
(negative growth for value added).
The supply chain is the key unit of analysis for understanding the interdependencies of
related industries and hence the potential for broad erosion of domestic valued added.
When domestic consumer-product manufacturers lose market shares, the domestic supplier
industries that support them tend to contract as well. The increasingly sophisticated
machine tool industry, which is essential to all discrete parts manufacturing industries, has
dramatically declined in the United States. Once one of the world’s leaders, US sales now
account for less than 5% of global output. Not surprisingly, with US parts manufacturing
declining, domestic consumption of machine tools dropped 30% over the most recent
decade for which data are available (1998–2007) and machine-tool producers moved
offshore or lost markets to competitors in other economies where parts manufacturing was
expanding.13
This phenomenon is due in part to co-location synergies, which are more pronounced
the more R&D intensive the supply chain. The important point is that the traditional OEM-
led supply chain where the OEM conducted the majority of R&D and controlled com-
ponent design is rapidly being replaced by a more efficient ‘‘value-stream’’ supply chain in
which R&D is significantly distributed (Petrick 2009). This evolutionary trend is the result
of the increasing pace and complexity of technological change. The value-stream supply
chain requires much more collaboration among the supply chain’s tiers. Such intense
product development iterations between customers and their suppliers benefit from co-
location. Boeing’s move to a value-stream supply chain strategy in which suppliers are
located in many different countries created coordination problems that seem to be largely
responsible for the 2-year delay in flight testing the 787 Dreamliner (Petrick 2009).
Further, within a single tier in a high-tech supply chain, ‘‘design for manufacturing’’ is
an important productivity factor. Separating the two activities (R&D and processing)
inhibits the exchanges of tacit knowledge (through person-to-person contacts) that greatly
shorten time to market and subsequent improvement of the critical performance-cost ratio.
12 R&D intensity is conventionally defined as R&D divided by GDP for the entire economy and R&Ddivided by sales for companies, industries, and sectors.13 See McCormack (2009) for this and other examples of declining US manufacturing industries.
G. Tassey
123

However, the loss of co-location synergies from globalization varies across industries,
which complicates growth policy analysis. For some industries, especially those with
relatively mature technologies, the advent of elaborate IT infrastructures enables much
more efficient communication over distances among tiers in the relevant supply chain.
Still, such synergies exist and are especially important for emerging technologies, which
are increasingly targeted by national innovation system strategies that promote R&D
efficiency (through support for technology clusters and supporting technology infrastruc-
tures) among tiers in the emerging supply chain.
The impact of this latter phenomenon is indicated in Table 2 by the dramatic drop in
growth for several R&D-intensive industry groups. These are the industries that the neo-
classical economists argue will automatically fill the gaps in employment and income
resulting from the offshoring of traditional industries. The manufacturing group, computer
and electronic products, has dropped from a position of above-average performance in
1985–2000 (144% growth in value added) to a 21% decline in the current decade. This
trend is clearly the result of the steady offshoring of products from the multiple industries
in this group. For example, the size of the domestic printed circuit board industry, which
supplies components used in ‘‘tens of thousands of different products,’’ shrunk from $11
billion to $4 billion during this decade (McCormack 2009). The Chinese have become the
world’s largest exporter of IT equipment and many of the components making up these
products come from other Asian economies.
A major tenet of this strategy is the promotion of co-location synergies. The printed
circuit board industry was once relatively labor intensive, which led to its offshoring.
Today, its production process is highly automated (low unit labor content), but other
countries have automated, as well, and the majority of the global industry remains in Asia
near the next tier in the electronics supply chain (assembly). Taiwan has a strategy based
on the national innovation system concept to become an integrated semiconductor device
manufacturer. Moreover, it is integrating further forward into higher valued-added elec-
tronic products, just as Japan did in the 1980s.
Again, one can attempt to deny the importance of such trends by pointing out, for
example, that the majority of Chinese ‘‘chip design’’ is currently not state of the art and
hence cannot compete with US companies. However, China has the same objective as
Taiwan and Korea, which is to steadily integrate backward from assembly and testing to
wafer fabrication to design and eventually to consumer products. While it makes a dif-
ference from a business model perspective whether these activities are separate tiers in a
global supply chain (different companies at each tier) or are all done by integrated device
manufacturers within single economies, the economic effect is the same: loss of value
added within the US domestic supply chain.
Thus, although the US-based companies still have the largest share of global semi-
conductor sales, their market share is being steadily eroded by foreign competition. Most
important for domestic economic growth, the US domestic shares of semiconductor-device
production capacity and sales have declined in this decade and the domestic industry is no
longer a player in a number of areas of semiconductor equipment, such as lithography.
Farther back in the supply chain, critical materials and wafer production are now largely
performed in other economies.14
14 Source: Semiconductor Industry Association (SIA). Ironically, a National Research Council Report(Securing the Future, 2001) pointed out that the US electronics industry in 2001—the beginning of thesecond time period in Table 2—was the largest US manufacturing industry in terms of sales and that the US
Rationales and mechanisms for R&D strategies
123

As traditional hardware and software are increasingly integrated, the potential for co-
location synergies exists between the two categories of assets, as well. Table 2 implies that
software has also undergone a huge decline in domestic value added between the two
periods. However, BEA data do not allow separation of value added from software and
traditional publishing (which has shrunk in recent years due to the advent of the Internet as
an increasingly important source of information). Even so, the high R&D intensity for the
entire industry group indicates that software accounts for a major share of this group’s
economic activity, so a significant portion of the decline is likely due to offshoring of
software development, production, and services.
In summary, the policy imperative is to understand the importance of co-location
synergies as part of a growth strategy that maximizes domestic value added, as this metric
is the bottom line for economic growth policy. And, because value added is mainly
payments to owners of capital (profits) and payments to owners of labor (wages and
salaries), the policy analyst must also understand the factors affecting the distribution of
valued added between the two classes of economic agents.
5 The causes of declining competitiveness
The key point for economic growth policy is the fact that it is not the US semiconductor
companies or other R&D-intensive firms that are in trouble. US-based companies are still
expanding R&D and manufacturing capacity. As a group, they remain the overall leaders
in technology development.
Rather, it is the US economy that has the problem because increasing proportions of
new corporate investment are in other economies. A Semiconductor Industry Association
(SIA) survey of R&D and capital spending by US semiconductor companies for the decade
1997–2007 found that spending on domestic R&D by these companies increased in
absolute terms (54%), indicating a continuing significant commitment to domestic tech-
nology development. Investment in wafer fabrication capacity grew more slowly (10.6%),
and investment in assembly and testing declined (-21.4%). Most important are compar-
isons of domestic and foreign investment trends: domestic shares of total company
spending declined in all three major categories: R&D, wafer fabrication, and assembly &
testing (Dewey and LeBoeuf LLP 2009).
The differential rates of offshoring across industries explain to a degree why policy-
makers have had trouble understanding the seriousness of the aggregate long-term decline
in US domestic competitiveness. While some categories of domestic spending decline,
others continue to grow albeit at slower rates. However, the fact that all categories of
investment outside the domestic economy are increasing even faster should be a loud and
clear warning that major policy shifts are needed. The SIA survey indicates that US
semiconductor companies plan to continue offshoring R&D at faster pace than the growth
in domestic spending over the next 5 years. The global scope of this offshoring and the
roles of foreign governments in this process should not be minimized. For example,
Singapore with a population of only 4 million has nevertheless attracted five state-of-the-
art 300 mm wafer fabs and US company R&D spending in Europe is projected to double in
the next 5 years (Dewey and LeBoeuf LLP 2009).
Footnote 14 continuedsemiconductor industry (a portion of the electronics industry group) had the highest value added in 1999 ofany US manufacturing industry.
G. Tassey
123

The major policy lesson is that the creation of a ‘‘national innovation system’’ (the
organized collection of public and private assets that create and utilize technologies) takes
a long time and considerable resources to develop. Over the past 10 years, most offshored
semiconductor R&D has been to Europe because R&D infrastructure support is more fully
developed there than in the emerging economies of Asia. That is changing, as Asian
nations are making large and continual investments in such infrastructure.
It is also the case that the erosion of a national innovation system takes a long time
because (1) public and private investments continue, just at a lower rate relative to the rest
of the global economy, and (2) competing economies have the same challenges in accu-
mulating innovation assets. Thus, while competitiveness rankings across countries still
show the US economy highly placed, the trends are negative. With respect to innovation-
based competitiveness, a recent benchmarking of US and European nations against the
world by the Information Technology and Innovation Foundation (ITIF) ranked the US
economy sixth. However, in terms of trend (improvements in innovative capacity), the
United States was ranked last out of 40 economies assessed.15
Leaving aside the critically important issue of a national innovation infrastructure for a
moment, the current trends in US R&D investment alone imply future difficulties in
maintaining competitive positions in either the manufacturing or service sectors. One
major indicator is the gradual but steady decline in US R&D intensity relative to the rest of
the world. As indicated in Fig. 3, the United States, once the most R&D-intensive econ-
omy, has steadily slid to a current eighth position. Many economies are increasing their
R&D relative to GDP, while the United States has the same R&D intensity as in 1960.
Without major changes, US competitiveness can be expected to deteriorate further.
4.49
3.89
3.483.33
2.98 2.90 2.782.62
2.48 2.462.25 2.13
1.981.74
1.33
Fig. 3 National R&D intensities, 2005 (gross R&D expenditures as a percentage of GDP). Source: OECD,Main Science and Technology Indicators, May 2007
15 See http://www.itif.org/index.php?id=226.
Rationales and mechanisms for R&D strategies
123

Even more important, only small fractions of both manufacturing and services are truly
R&D intensive (R&D-to-sales ratios greater than 5%). These high-tech industries collec-
tively account for only about 7% of GDP. The remaining 93% consists of moderate-to-low
R&D-intensive industries, which are losing market shares and domestic employment at
more rapid rates.16
One of the excuses for declining US competitiveness is the alleged higher compensation
paid to US workers. While compensation rates in industrialized nations are higher than in
emerging technology-based economies, total compensation per hour for US production
workers is lower than in a large number of other industrialized countries. Yet, trade
deficits, even in technology-based products, persist. BLS data show that in 2007 total
compensation for US production workers was $24.59 per hour. This rate was lower than
those for 16 other countries and lower than the average for Europe. In contrast, the US rate
is 25% above the average for Japan and is 2.5 times higher than the average for East
Asia ex-Japan.17 These data indicate that US manufacturing at least has a competitive
compensation structure among industrialized nations, so one would expect a better trade
performance for the high-tech portion of manufactured products.
Another frequently cited excuse is the fact that the US dollar has been overvalued
for some time and continues to be so, in spite of a significant decline in the current
decade. A major reason for the slow adjustment of the dollar in response to a secular
decline in competitiveness is its status as the world’s reserve currency. However, as the
history of the English pound in the last century demonstrates, all currencies eventually
adjust to economic realities and no economy has ever prospered from a depreciating
currency.
In addition, many analysts cite exchange rate manipulation by the Chinese as a sig-
nificant factor in the failure of the dollar to completely adjust to economic realities. While
justified, these complaints overlook the mechanism by which China ‘‘manipulates’’ the
bilateral exchange rate. They do it by purchasing hundreds of billions of dollars of US
Treasury debt. Doing so creates a substantial demand for dollars, thereby keeping
the price of the dollar relative to the yuan above its true ‘‘economic’’ level. This is not a
good long-term situation for either economy (the United States will continue to incur
larger trade deficits and China will remain excessively dependent on exports). However,
it persists and therefore remains a negative for US growth. Over time, this mutual
dependency will dissipate because the Chinese will pursue other markets for their exports
coupled with increased domestic consumption. As this process unfolds, the Chinese will
greatly reduce purchases of US debt. Thus, the adjustment will be more difficult for the
US economy, as it cannot increase domestic consumption without significant productivity
growth. The alternative of growing exports through currency depreciation is not a long-
term option.
16 Author’s estimate. No consensus definition of the ‘‘high-tech sector’’ exists. It is defined here as including4-digit NAICS industries that have an R&D intensity (R&D divided by net sales) greater than 5%.Unfortunately, the Bureau of Economic Analysis does not calculate value added at the 4-digit industry level(they do so only for 3-digit industry groups and above). Thus, only a rough estimate can be made. However,even if the value added were used for the 3-digit groups in which these R&D-intensive industries areclassified (a significant overestimate because these groups contain low and moderate R&D-intensiveindustries), the total contribution to GDP would still only be 12.5%.17 Bureau of Labor Statistics, ‘‘Production Workers: Hourly compensation costs in US dollars in manu-facturing, 34 countries or areas and selected economic groups, 1973–2007,’’ March 2009. (ftp://ftp.bls.gov/pub/special.requests/ForeignLabor/ichccpwsuppt02.txt.
G. Tassey
123

While acknowledging the above diversified set of factors, the long-term problem for the
US economy is structural and the solution therefore requires structural change. In addition
to barriers associated with inadequate R&D spending and innovation infrastructure, a more
subtle but reinforcing negative aspect of offshoring in individual industries is the previ-
ously described hollowing out of formerly integrated supply chains.
A confusing element of this phenomenon is the natural tendency of high-tech supply
chains to experience vertical disintegration over time. Technologies emerge and mature
through an evolutionary process in which integrated manufacturers dominate the supply
chain for a period of time until the interfaces between components are firmly established
and the markets become large. Standardized interfaces and economies of scale allow
innovative specialists in individual components to enter the industry. The tier in a supply
chain at which this vertical disintegration occurs has been labeled the ‘‘decoupling point’’
(Christensen et al. 2004b). The decoupling point tends to move backward in the supply
chain over time from the final product to subsystems and then to component tiers. This
phenomenon opens up competitive opportunities for many economies to compete at
specific tiers high-tech supply chains.
The process is facilitated by ever improving information and computer technology
(ICT) and the decreasing weight of many high-tech products, so that distributed global
networks of value added are increasingly common (Atkinson 2009). R&D networks spread
risk and combine complementary research assets through a process called ‘‘open innova-
tion’’ (Chesbrough 2004). Such networks, using advanced IT infrastructure, are fast
becoming an integral part of global supply chains and can often function quite well.
However, to the extent tiers in a supply chain are offshored, domestic research and other
supporting infrastructures are degraded, which can be a major problem for the domestic
industry in transitioning to the next life cycle. And, of course, the domestic economy loses
the value added from offshored economic activity in the current life cycle.
Longer term, it is this evolutionary process in which domestic supply chains are (1)
allowed to be hollowed out through the absence of aggressive policies to maintain value
added throughout the current technology life cycle and then (2) not upgraded/replaced with
new technologies as the current ones become obsolete that explains why aggressive
emerging economies tend to ‘‘converge’’ with (grow faster than) established ones. This
process of convergence has been well documented over the last several centuries
encompassing two industrial revolutions, as technology became an increasingly significant
factor in international competition. In the last four decades of the twentieth century,
convergence accelerated significantly with a number of emerging economies doubling
national income in 10–20 years compared with the 30–70 years required to double in the
nineteenth century (Lucas 2009).
Most notable from this research are the findings that (1) the inverse relationship between
per capita income growth and maturity only applies to open emerging economies, i.e.,
those economies that trade relatively freely with the rest of the world (closed emerging
economies grew significantly slower), and (2) the increased rate of convergence is largely
due to technology spillovers across national economies.
However, no theoretical construct exists that says leading economies cannot combat
convergence and thereby maintain their high rankings in per capita income. One of the best
targets for reversing the current trend in convergence by an increasing number of emerging
economies relative to the US economy is manufacturing, as products still dominate trade
and flows of technology. Doing so, however, will require considerably more aggressive
growth strategies based on more accurate models of technology-based growth.
Rationales and mechanisms for R&D strategies
123

6 The economic growth policy problem
The central failure of current economic growth models is the assumption that shifts in
relative prices will automatically elicit a Schumpeterian-type efficient reaction from
domestic private markets—namely an adjustment involving development/assimilation of
new technologies to replace offshored ones. Such an adjustment would enable a reallo-
cation of resources from the offshored industry or sector to new ones that can provide both
replacement and (historically) higher paying jobs.
This view of the adjustment process is based on past technological dominance by the
United States, which economists and policy analysts have simply extrapolated to the
present highly competitive global economy. This ‘‘installed wisdom’’ leads to the
assumption that current rates of investment in R&D are adequate based on past trends.
Further, the steady increase in industry’s share of national R&D has been viewed as a good
trend by many analysts because the innovation system is assumed to be synonymous with
the actual act of innovation and therefore largely a private-sector activity. The result has
been suboptimal aggregate R&D investment, but even more so, suboptimal R&D portfolios
(type of R&D and diversification across technologies). In fact, the entire science, tech-
nology, innovation, and diffusion (STID) system is deficient, not only with respect to R&D
strategies but also the quality of the S&T labor force and technology diffusion channels.
The neoclassical model that assumes new technologies will magically appear from
advances in basic science and then drive reallocations of labor and capital into higher-tech,
higher-productivity industries is now facing two increasingly severe obstacles. One is the
relatively small high-tech sector. The other obstacle is a global system increasingly
absorbing the output of US-based corporate R&D that in previous economic growth cycles
would have stayed primarily in the domestic economy. That is, whereas in the past
technology would flow from the new, domestic R&D-intensive industries into the
remainder of the economy, thereby boosting overall national productivity, today such
emerging technologies are flowing at least as rapidly to the innovators’ foreign affiliates or
foreign partners, in large part because the public sectors in other economies are facilitating
the adoption of new technologies.
Convergence in current technology life cycles with subsequent loss of domestic market
shares in the ‘‘first-mover’’ (innovating) economy begins when offshoring is initially
undertaken in the form of relocating the production of low and moderate technology-based
products to be near new markets and to achieve labor cost savings. The cost savings allow
re-importation of these components by the original innovator, which lowers domestic costs
and thereby helps raise the productivity of the remaining domestic production. Such
strategies yield larger profits and help explain why US-based high-tech corporations had on
average good balance sheets entering the recent severe recession (unlike government or the
consumer) and why ‘‘measured’’ labor productivity has increased above rates observed in
previous recessions.
While this situation bodes well for corporate investment in technology in the years
ahead, such investment will increasingly take place in economies other than the United
States. The loser in this process of global convergence is the American worker whose skill
levels are increasingly matched or exceeded by ever larger numbers of foreign workers.
Figure 4 shows the effect of these trends on the distribution of national income. Beginning
in the 1980s, the push by American companies to adopt global strategies and the growing
technological content of imports increased their productivity. Because much of the pro-
ductivity growth was the result of offshoring, domestic labor benefited relatively little. This
G. Tassey
123

trend became pronounced in this decade (2000–2008), as evidenced by the fact that
inflation-adjusted US median household income dropped 4.2%.
In summary, the shifting of technology resource endowments among the world’s
economies can increase global economic welfare due to the advantages from specializa-
tion. However, in the ensuing redistribution of wealth, some economies gain more than
others. That is, adjustments in accordance with the law of comparative advantage do not
guarantee that all nations benefit equally—or benefit at all.
As is often the case with the dominant economy, the United States has not fully
recognized the severity of the loss of competitive position. Helping mask the seriousness of
this decline are (1) re-importation of cheaper components that have been offshored, which
temporarily accelerates corporate productivity and thereby sustains output growth in the
remaining domestic high-tech industries, and (2) the fact that offshoring (loss of market
share) occurs at different rates among tiers in the relevant high-tech supply chain and
thereby temporarily obscures the cumulative negative impact on domestic competitiveness
and employment. The latter impact is finally becoming painfully evident, as US
employment has had zero growth in this decade.
Thus, when earlier tiers in the electronics supply chain, such as semiconductor devices
and printed circuit boards, are offshored and these components are imported at lower
prices, the remaining downstream domestic industries realize a measured increase in
productivity. However, the employment effect is negative. Only if the domestic industries
using these components turn the cost savings into much higher sales can the net
employment effect be positive.
2%
4%
6%
8%
10%
12%
14%
1948 1954 1960 1966 1972 1978 1984 1990 1996 2002 2008
Fig. 4 Corporate profits (before taxes) share of GDP, 1948–2008. Source: Bureau of Economic Analysis,NIPA Table 1.14 for corporate profits before taxes (Gross Value Added). Domestic profits exclude receiptsby all US corporations and persons of dividends from foreign corporations, US corporations’ share ofreinvested earnings of their incorporated foreign affiliates, and earnings of unincorporated foreign affiliatesnet of corresponding payments
Rationales and mechanisms for R&D strategies
123

Unfortunately, in an increasingly competitive high-tech global economy, downstream
domestic systems companies (assemblers of components) not only outsource components
all over the world, but they are also competing for market share with foreign systems firms
that increasingly have the advantage of co-location with the offshored component sup-
pliers. Only a few industries (such as US automobile OEMs) still reject open innovation
strategies (Petrick 2009; Mann 2009). However, even where domestic industries have
adapted, global open innovation means globally distributed value added. The result is
constant restructuring of comparative advantage across national economies and hence
shifts in relative rates of economic growth. Thus, open innovation, while a necessity for
survival in most high-tech industries, is not sufficient as a long-term national growth
strategy.
7 The economic losses add up
The aggregate loss of domestic market share for an entire supply chain is obviously much
greater than for a single tier (industry). The cessation of growth in manufacturing output
within the US economy in this decade reflects the effects of global convergence on many
tiers in multiple supply chains. The bottom line is that the competitiveness of US manu-
facturing has eroded and this decline has been underway for decades. Thus, the end of the
cyclical downturn in the global economy will not remove the structural problems
responsible for this secular decline.
The most serious long-term implication is that without major shifts in US growth
strategies, market shares from current technologies will not only continue to decline in the
years ahead, but the substantial shrinkage will erode the supporting innovation infra-
structure (universities and government laboratories, the supply of domestic skilled labor,
venture capital infrastructure, etc.) needed to be competitive in future technology life
cycles.
The main indicator of this long-term threat to the future of US manufacturing is the fact
that higher-tech products are increasingly being produced overseas, as evidenced by the
negative high-tech trade balance (Fig. 1). This deficit appears to be largely due to the trade
imbalance with China. However, while striving to integrate backward in high-tech supply
chains, China is still largely an assembler of high-tech components produced in other Asian
economies. It is therefore the port of exit for the entire region, so the trade deficit repre-
sents a more pervasive problem. More generally, the US world-market share of exports by
high-technology industries declined from about 20% in the early 1990s to 12% in 2005.
The drop is primarily because of losses in export share by US industries producing
communications equipment and office machinery and computers (National Science Board
2008). The loss of export markets is reflected in the drop in domestic value added for
Computers and Electronic Products shown in Table 2.
In the face of offshoring, the law of comparative advantage can result in continued job
and wage growth only if the lack of such growth in the shrinking economic sectors is
compensated by growth in demand for high-skilled and hence high-paid labor in new
industries. Conventional economic thinking, as evidenced by a recent CBO report, points
to the continued growth in aggregate employment, even as jobs in manufacturing leveled
off and then began to decline (Congressional Budget Office 2008). In the middle of the last
decade (2004–2007), the US economy created about 7.5 million net new jobs. However,
this job growth was driven largely by excessive consumption fueled by unsustainable
G. Tassey
123

expansion of consumer and government debt. When the debt bubble collapsed, employ-
ment growth disappeared and, in fact, turned negative.18
The growing difficulty of increasing jobs of any type in today’s increasingly com-
petitive global economy is shown dramatically in Fig. 5. For the first seven recessions
after World War II, the relatively closed status of the US economy meant that average
employment recovery was swift and substantial (about 4 months to positive employment
levels relative to the recession trough). In the late 1980s, however, the growing global
competition began to promote greater investment in automation in addition to accelerated
outsourcing. The result was that 19 months elapsed before a positive employment level
was attained. This significant slowing of the cyclical rebound in employment was
dwarfed by the extremely slow recovery in employment from the 2000–2001 recession,
which required 30 months to reach a positive employment level relative to the recession
trough.
8 The policy problem
Once the premise is accepted that the only way to achieve long-term growth in jobs for a
high-income economy such as the United States is through investment in technology,
innovation, and subsequent productivity increases, the key policy issue becomes how to
promote desired long-term investment in a domestic economy that must save more and
consume less, while reducing budget deficits through decreased spending and increased
-2%
0%
2%
4%
6%
8%
10%
1 2 3 4 5 6 7 8 9 10 11 12 13 14 15 16 17 18 19 20 21 22 23 24 25 26 27 28 29 30
Months
Average of Seven Prior Post-War Recoveries
1990-91 Recovery
2000-2001 Recovery
Fig. 5 Employment growth in post-world-war-II business recoveries: percent change from recessiontrough. Source: Tassey, 2007a (BLS for employment data; NBER for recession trough dates; employmentdata are for non-farm, private industry)
18 From the BLS establishment survey (http://www.bls.gov/schedule/archives/empsit_nr.htm#2000), nonfarm employment was unchanged in this decade (130.3 million in January 2000 compared to 130.8 millionin October 2009). Employment in the manufacturing sector declined in the same time interval from 18.4million to 11.7 million.
Rationales and mechanisms for R&D strategies
123

taxes. Economic text books state that in a closed economy national savings equals national
investment. For a good part of the last decade, the national savings rate was close to zero.
Thus, from a national accounting perspective, virtually all investment in this period of time
was in effect funded through borrowed foreign capital.
Even with a return to modest domestic savings rates, the decision will have to be made
to increase investment in R&D against competing demands for available funds. Further,
R&D investment is only the first plank in a multi-faceted technology-based economic
growth strategy. If economic growth policies focus only on developing new technologies,
temporary monopoly profits will accrue to the innovator. Such profits have been used by
many, including venture capitalists, to justify this focused investment strategy. However,
from a national economic growth perspective, such a strategy ignores the need to remain
competitive over the entire technology life cycle. In the middle and later phases of the
typical cycle, the markets for the technology become much larger as secondary and tertiary
groups of consumers adopt a widening variety of applications of the generic technology.
However, much of the resulting greater value added accrues to imitators of the original
innovation and these imitators (who also improve the original innovations) are increasingly
in other economies.
Thus, as technologies mature and foreign competitors enter these markets, the domestic
industry can lose value added, even relatively early in the life cycle. Such a scenario
becomes more likely as more economies become technology based. In the current final
phase of globalization of the technology-based economy, many nations are becoming
innovators themselves, thereby shortening windows of opportunity for achieving innova-
tion and ultimately target rates of return on investment (RoI) over the entire technology life
cycle. Collectively, these trends have made the act of innovation more costly and risky.19
Total technology life-cycle policies must include broad education upgrades, dynamic
technology portfolio management, and evolutionary technology infrastructure that adapts
to industry’s needs for competing in larger and more diversified markets. Strategies for
managing the entire technology life cycle require both more accurate conceptualizations of
industrial technologies and a better understanding of dynamics of technology-based
competition.
9 Revitalizing advanced manufacturing policy: the multi-element technology growthmodel
Four general characteristics of modern manufacturing technologies serve as a basis for
explaining why a new technology-based growth model is required for this sector:
(1) The typical industrial technology is a complex system of component technologies.
(2) These components arise from generic technology platforms and depend on commonly
used infratechnologies (often in the form of industry standards); both of these
elements are quasi-public goods and therefore require government support.
19 A 2003 Boston Consulting Group study, Innovation to Cash, estimated that the cost of taking newproducts to market doubled over the previous 10 years and the innovation failure rate appeared to be in the60–85% range. Christensen (1997) estimated the failure rate to be 80–90%. A more recent study by theBoston Consulting Group (Innovation 2009) found significant dissatisfaction with innovation RoI amongcorporate managers globally. Dissatisfaction was particularly high among North American companies(58%).
G. Tassey
123

(3) Private-sector technology-based competition is driven by ‘‘draws’’ against these two
technology elements (i.e., attempted innovations), so that an effective national
innovation system must not only promote efficient R&D processes but also the
efficient diffusion and assimilation of new technologies.
(4) System-level productivity must become the focus of economic growth policy, which
means the supply chain (materials, components, equipment, systems, services) must
become the focus of policy management, in contrast to the traditional emphasis on
single technologies/industries.
The absence of the correct economic model to manage government support of advanced
manufacturing continues to leverage the decline of this sector. A new government role will
require both larger R&D spending and new and more efficient mechanisms for R&D
funding and technology diffusion. The policy mechanisms to achieve this major revival of
US manufacturing are not in place. Yet, the complexities of modern product and process
technologies and their associated global markets create significant investment barriers for
individual firms, especially small ones that require new, if not larger, government
responses.20
Manufacturing is a particularly tough challenge because it is a complex systems tech-
nology that therefore requires innovation (1) at both the component and the systems levels,
and (2) for both product and process technologies. Advances further require increasing
integration of hardware and software technologies at both levels. An effective national
R&D program therefore will need a complex research network and a significant supporting
technical infrastructure.
The United States is the last major industrialized nation to accept the fact that industrial
technologies are not black boxes (in economic terms, they are not pure private goods).
In the traditional ‘‘black-box’’ model, science is a pure public good and is funded by
government, while technology is a pure private good and is therefore funded by industry.
Reality is that the typical industrial technology consists of three major elements that are
distinguished by distinctly different investment incentives.
These different incentives result from the fact that the three technology elements have
different degrees of public-good content (hence, the public–private nature of modern
technology-based economies). Public-good content implies common use, which can be
good and, in fact, essential for economy-wide growth. However, this sharing frequently
occurs without adequate compensation to the developers. The public-good content of
certain elements of technology-based economic activity is indicated in Fig. 6 by the shaded
areas. The arrows show the direction of impact of one element or activity on others and
hence indicate the potential targets of alternative policy instruments.
One of the three technology elements, proprietary technology, is the black box, i.e., the
set of innovations. It is a pure private good and therefore is the province of the private
sector. However, innovations (first commercial applications) cannot be efficiently derived
directly from the underlying science base, which is a pure public good and hence is
provided almost entirely by government funding.
Instead, scientific knowledge is used to develop ‘‘proofs of concept’’ that become the
technology platforms (generic technologies) for subsequent innovative efforts. Such
innovation-enabling platforms are technically ‘‘quasi-public’’ goods, in that their
20 See van Opstal (2009) for an excellent characterization of the increasing speed and complexity oftechnological change.
Rationales and mechanisms for R&D strategies
123
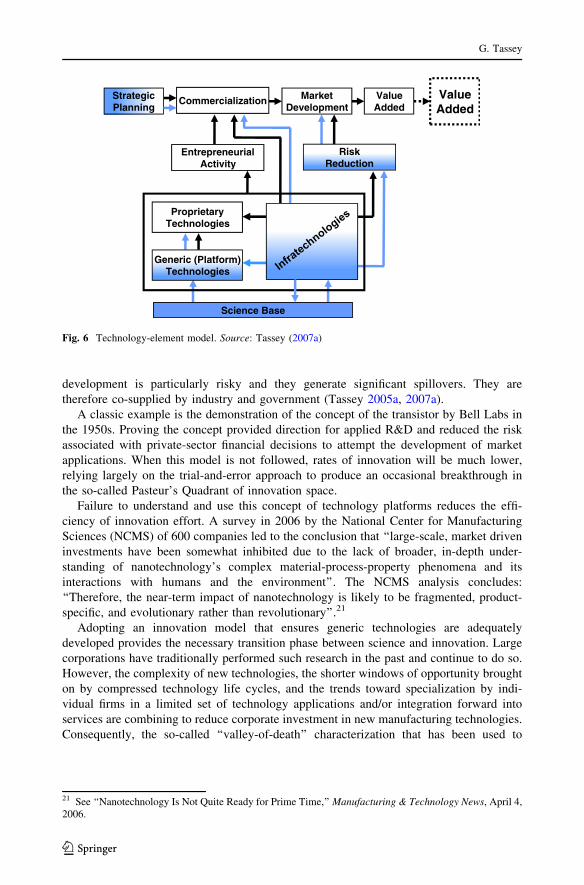
development is particularly risky and they generate significant spillovers. They are
therefore co-supplied by industry and government (Tassey 2005a, 2007a).
A classic example is the demonstration of the concept of the transistor by Bell Labs in
the 1950s. Proving the concept provided direction for applied R&D and reduced the risk
associated with private-sector financial decisions to attempt the development of market
applications. When this model is not followed, rates of innovation will be much lower,
relying largely on the trial-and-error approach to produce an occasional breakthrough in
the so-called Pasteur’s Quadrant of innovation space.
Failure to understand and use this concept of technology platforms reduces the effi-
ciency of innovation effort. A survey in 2006 by the National Center for Manufacturing
Sciences (NCMS) of 600 companies led to the conclusion that ‘‘large-scale, market driven
investments have been somewhat inhibited due to the lack of broader, in-depth under-
standing of nanotechnology’s complex material-process-property phenomena and its
interactions with humans and the environment’’. The NCMS analysis concludes:
‘‘Therefore, the near-term impact of nanotechnology is likely to be fragmented, product-
specific, and evolutionary rather than revolutionary’’.21
Adopting an innovation model that ensures generic technologies are adequately
developed provides the necessary transition phase between science and innovation. Large
corporations have traditionally performed such research in the past and continue to do so.
However, the complexity of new technologies, the shorter windows of opportunity brought
on by compressed technology life cycles, and the trends toward specialization by indi-
vidual firms in a limited set of technology applications and/or integration forward into
services are combining to reduce corporate investment in new manufacturing technologies.
Consequently, the so-called ‘‘valley-of-death’’ characterization that has been used to
StrategicPlanning
Commercialization MarketDevelopment
ValueAdded
EntrepreneurialActivity
RiskReduction
ProprietaryTechnologies
Generic (Platform)Technologies
Science Base
ValueAdded
Fig. 6 Technology-element model. Source: Tassey (2007a)
21 See ‘‘Nanotechnology Is Not Quite Ready for Prime Time,’’ Manufacturing & Technology News, April 4,2006.
G. Tassey
123

connote the investment barriers increasingly faced by manufacturing firms at this critical
phase of the R&D cycle is widening.22
An important example of the complexity of generic technology research is the required
elements of the ‘‘post-CMOS’’ or ‘‘new logic switch’’ technology platform based on
nanoelectronics:
• Concepts of new circuit design technologies based on the properties of individual
molecules
• Generic fabrication methods for radically new classes of materials with unique
electronic properties
• Generic methods for inducing novel compounds to self-assemble into the precise
structures needed by new electronic devices and architectures
• Generic methods for interconnecting new devices into circuits
The third major element of an industrial technology, infratechnologies, also has strong
public-good content. Infratechnologies, many of which provide the technical foundations
for industry standards, are pervasive in the typical technology-based industry. Inadequate
investment means that productivity suffers at all three stages of economic activity (R&D,
processing, and commercialization). The multiple arrows from the infratechnology box in
Fig. 6 demonstrate the ubiquitous and hence essential role played by this technology
element.
For example, semiconductor design and manufacturing requires a large and diversified
set of measurement infratechnologies that are applied directly to individual products and
also to the highly automated production systems used in the modern semiconductor plant.
A 2007 study by the National Institute of Standards and Technology (NIST) of mea-
surement investment and its economic impact on the US semiconductor supply chain
estimated that these industries invested $12 billion in measurement over the 10-year
period, 1996–2006. This investment generated $51 billion in economic benefits for a net
benefit of $39 billion.23
Measurement of the effects of nanostructure on product performance and processing
techniques is fundamental to the design and manufacture of all nanomaterials and devices.
Examples of infratechnologies supporting nanotechnology are
• Techniques for measuring the shapes, dimensions, and electrical characteristics of the
various molecules making up nanoscale devices
• Techniques for manipulating and measuring the spin of individual electrons
• Scientific and engineering data for characterizing the fundamental physical behavior
and long-term reliability of new nanoelectronic materials
The economic impact of this relatively unrecognized element of industrial technologies
is substantial. Assuming that the remainder of what is commonly labeled as the ‘‘high-tech
sector’’ invests in and benefits from measurement at approximately the same rate as has
been estimated for the semiconductor supply chain by the NIST study, a rough estimate of
the net economic benefits of measurement-related infratechnologies to this sector over the
10-year period is $455 billion (extrapolated based on shares of GDP). Yet, a number of
economic studies by NIST document the significant underinvestment in the development
22 More functionally referred to as the ‘‘risk spike’’. See Tassey (2005a, b, 2008b).23 See http://www.nist.gov/director/prog-ofc/report02-3.pdf.
Rationales and mechanisms for R&D strategies
123

and use of infratechnologies and hence the negative implications for productivity growth
without government investment.24
The most neglected and needy segment of manufacturing is the group of so-called
‘‘discrete parts’’ industries. This diversified set of industries will require radically new
generic technologies to regain competitive advantage over manufacturing firms in other
countries that have rapidly adopted existing automated manufacturing techniques. Major
needed advances in generic technologies include
• Reconfigurable and agile manufacturing systems that can respond to ever shorter
innovation cycles and rapidly adapt to customer demands for new products and new
product features
• Multidiscipline-based manufacturing that combines physics, materials, engineering,
and information technology to achieve state-of-the-art manufacturing precision,
process optimization, and product functionality
• Advanced sensors, control systems, and wireless communications that provide
immediate monitoring and reaction inside manufacturing systems to improve quality,
decrease production cycle times, and eliminate waste
• Advanced non-traditional manufacturing techniques, including solid freeform fabrica-
tion (called additive manufacturing) and laser processing, to make innovative complex,
custom products and replacement parts that are not realizable by more traditional
manufacturing technologies or are required to be produced quickly in low volumes
• Smart assembly systems that pair skilled workers with helpful automation and robotics
to reinvent how manufacturers put together products quickly and safely
A range of sophisticated infratechnologies will be also required, including
• Automated data synthesis and decision tools that process the high volume of product
and process data from next-generation measurement systems for intelligent decision-
making and manufacturing system optimization
• Modeling and simulation tools, interface standards, and reference data that can
dramatically reduce trial-and-error, forecast costs and consequences of design and
production decisions, and speed innovations to market
In summary, the policy importance of the multi-element model is that it (1) destroys the
argument that government funding of technology research is ‘‘corporate welfare’’ and
‘‘picking winners and losers’’ and (2) much more clearly shows the effective leverage
points for alternative policy instruments. For example, the public-good content of the
‘‘generic technology’’ and ‘‘infratechnology’’ elements of industrial technology make clear
the need for government R&D support for these two elements. Without their explicit
inclusion in the innovation model, inadequate support and inappropriate selection of policy
instruments will frequently result. At a general level, the ability to characterize the specific
barriers to investment associated with each element enables the selection of the most
efficient policy instrument—tax incentives or direct funding (Tassey 2007a).
The ‘‘proprietary technology’’ element from which innovations are developed is a pure
private good and hence the province of industry, but even private-sector R&D can suffer
from market failures, although of a different type from the two quasi-public technology
elements. Hence, different policy responses are required for each element and, as discussed
in the next several sections, these responses will vary in time over a technology’s life cycle.
In general, this model is based on significant differences in investment incentives across
24 See http://www.nist.gov/director/planning/strategicplanning.htm.
G. Tassey
123
the three major elements and therefore provides a framework for the development of
effective R&D policies.
10 The growth policy imperative: manage the entire technology life cycle
As indicated in the previous section, the multi-element model is necessary to accurately
identify different types of underinvestment and match them with efficient policy
responses, if a long-term and successful strategy for the manufacturing sector is to be
realized. However, maintenance of competitive positions in global markets requires that
this static framework be complemented with a dynamic construct so that adjustments to
growth policies can be made as technologies mature and the nature of underinvestment
changes.
That is, issues associated with being the innovator are only step one in a successful
economic growth strategy. The United States has been the ‘‘first mover’’ and then lost
virtually all market share in a wide range of materials and product technologies, including
• oxide ceramics
• semiconductor memory devices
• semiconductor production equipment such as steppers
• flat panel displays
• robotics
• video cassette recorders
• digital watches
• interactive electronic games
• lithium–ion batteries
Offshoring has become pervasive in that it has occurred in multiple tiers of high-tech
supply chains (materials, components, equipment, subsystems). However, these declines,
although large, have occurred slowly and unevenly enough to evade notice by many
policymakers—until major aggregate market share has been lost.
11 Loss of manufacturing and R&D in the current technology life cycle
R&D policy must be managed based on the fact that technologies evolve in cyclical
patterns with shorter product-technology cycles embedded in longer major cycles based on
generic technology platforms. A key economic characteristic of this ‘‘nested’’ set of cycles
is that the evolutionary pattern alters the nature of technologies and hence investment
incentives. Private-sector investment reacts to these changing incentives and policy also
must adjust. As pointed out in the previous section, the economic consequence of policy
not taking cyclical investment patterns has been the loss of considerable domestic eco-
nomic growth through offshoring of the markets for domestic innovations in the middle
and later phases of these cycles.
Today, $1 trillion in global R&D and a rapidly growing skilled global workforce mean
that no matter where a technology is first developed and produced, production has the
potential to be progressively offshored from multiple tiers in the innovator’s domestic
supply chain. When either a domestic company offshores production or when an indige-
nous manufacturing industry appears in another country, only a minimal amount of R&D is
required in the host economy to enable product adaptation for local markets and to provide
Rationales and mechanisms for R&D strategies
123

production support. Thus, the innovator economy initially loses value added primarily at
the manufacturing stage. A superior domestic innovation infrastructure and the difficulties
of competing economies in imitating it keep innovative activity within the first-mover
economy—for a while. An example is semiconductors where manufacturing has moved
offshore to a substantial degree, but indicators of inventive activity (as measured by
relative patent rates) still show a US-centric pattern, especially for process technologies
(Macher et al. 2008).25
Competitive pressures have led US-based companies to establish an increasing share of
advanced wafer fabrication facilities (‘‘fabs’’) outside the United States or to rely on
foreign ‘‘foundries,’’ (specialized manufacturing companies) rather than invest in the
domestic US economy. A number have become ‘‘fabless’’ or ‘‘fab lite’’ firms, focusing on
design while contracting most or all product manufacturing to foundries. While the fabless
strategy is extolled by corporate consultants, it has evolved out of necessity as many
semiconductor firms failed to achieve large enough market shares to capture scale econ-
omies at the production stage.26
A manifestation of this trend is evidenced by the fact that the US share of global
semiconductor production capacity has shrunk from 42% in 1980, to 30% in 1990, to
about 16% in 2007.27 For the latest generation of wafer production technology (300 mm),
the US share declined from 36% in 1999 to just over 20% in 2004. Two-thirds of new
300 mm fabs and approximately 80% of all 300 mm fabs under construction are outside
the United States, primarily in Asia. Yet, US-headquartered semiconductor producers
still dominate global sales with 48% of worldwide markets and remain the undisputed
technological leaders. Thus, one can understand how economists and other analysts, by
focusing on current market shares of US-headquartered companies, misinterpret current
trends.
Fabless semiconductor companies have been successful in the current mature phases of
the CMOS technology life cycle by adopting highly accurate simulation techniques that
drastically reduce the number of expensive and time-consuming iterations of the product
design necessary to enable its manufacture. Dedicated foundries, in turn, often do not even
operate development-scale fabs, instead relying on real-time adjustments. Both of these
single-stage strategies can work within the middle and latter phases of a particular tech-
nology’s life cycle.
However, when major technological change occurs (that is, when a major new tech-
nology life cycle begins), both strategies will hit a brick wall. The fabless firms will not be
able to execute design for new manufacturing requirements without close interaction with
manufacturing scale-up activity and foundries will not be able to adapt to radically new
product technologies without close interactions with the ongoing product R&D. In the long
run, the threat to the US domestic industry is the growing ability—and willingness—
around the world to backward integrate to the underlying science itself, especially for the
next major (post-CMOS) technology cycle.
In fact, as emerging economies get a taste of the higher value added attainable first
through assembly and later through component manufacturing, their growth strategies
begin to shift toward R&D aimed at new designs and eventually next-generation versions
25 The segmentation (horizontal disintegration) of domestic R&D and manufacturing and the subsequentloss of the entire tier is the first part of the process off shoring high-tech supply chains. See Pisano and Shih(2009) for a number of examples.26 For an example of support for the fabless strategy, see Doraiswamy (2006).27 From several sources. See Dewey and LeBoeuf LLP (2009, p. 14).
G. Tassey
123

of the generic technology. In the Chinese semiconductor industry, backward integration
has included a substantial share of design work that is being driven by (1) the rapid double-
digit growth rate of that country’s domestic market for semiconductor devices, which now
accounts for about one-third of the world’s consumption,28 (2) the emergence of skilled
design engineers, and (3) the desire to move up the value-added ladder as a supplier of
semiconductor technology. While the current level of design is not yet world class, the
Chinese are aggressively pushing toward the next and final step in the convergence pro-
cess, which is to become a developer and exporter of semiconductor components. Other
Asian economies, such as Taiwan and Korea, are further along in this process. In fact, both
Korean and Taiwanese firms have not only become integrated device manufacturers, but
they are progressively integrating forward into consumer electronics.
As a result of these trends, an increasing share of US semiconductor companies’
product-design R&D is being located outside this country. As new electronic product
markets have emerged, both designers and manufacturers of semiconductor-based systems
(e.g., wireless communications and consumer products) are increasingly concentrated in
Southeast Asia due to co-location synergies (Ernst 2005).
Further, in the tier of this supply chain beyond semiconductor devices are manufacturers
of subsystems of multiple devices. This industry provides a stark example of how fast
economic activity, even in technology-based industries, can shift to other economies. In
2000, nearly 80,000 workers were employed in the North American printed circuit board
industry; but by the beginning of 2004, employment had dropped to just over 41,000
(National Research Council 2005). Since then, employment has continued to drop
(McCormack 2009). In summary, the sequential loss of market shares from multiple tiers
collectively means a steady hollowing out of valued added from the domestic semicon-
ductor supply chain.
The bottom-line points for growth policy are (1) value added has moved backward in
supply chains, implying that more high value-added domestic economic activity is lost
when component manufacturing is offshored, and (2) co-location synergies not only pro-
tect the value added created by multiple tiers in a domestic high-tech supply chain, but in
many cases, especially early in a technology’s life cycle, they seem to increase total valued
added due to the efficiency effects of co-location.
The process of convergence among national economies can be explained by the fact that
the R&D capability established to manage the offshored manufacturing serves as the
genesis of a nascent innovation infrastructure. Along with investment in broader research
capabilities by the government, a capability evolves to be the ‘‘first mover’’ for emerging
technologies that drive future life cycles. Taiwan is achieving backward integration from
test and assembly to wafer fabrication to design (the integrated device manufacturing
model). Both Taiwanese industry and government now participate in global R&D net-
works. Taiwan’s Technology Research Institute (ITRI) has research collaborations with
companies, universities and governments all over the world. This is clearly a leading-edge
technology strategy. While further behind in the convergence process, the Chinese are
following the same backward integration path. Patent trends in nanoelectronics clearly
show the threat of convergence early in the next life cycle to be real.
28 Chinese semiconductor consumption in 2007 was $88 billion (34% of the world’s total consumptionof $256 billion). In keeping with the process of convergence, domestic production is being stimulated by thelarge domestic consumption of chips. China’s domestic production of semiconductors increased from2% of the world’s total in 2000 to 9% in 2007. Source: Semiconductor Industry Association andPricewaterhouseCoopers.
Rationales and mechanisms for R&D strategies
123

The threat to US technology leadership is actually greater in other areas where high-tech
industries remain more vertically integrated than in semiconductors. In the flat panel
display (FPD) industry, for example, design and manufacturing are still highly integrated.
A few US FPD firms (mostly small niche-market firms) have remained competitive by
maintaining relationships with Asian manufacturers, but the co-location synergies are
strong and most innovative activity has followed manufacturing to Asia. Meanwhile, US
R&D capability has eroded due to declining US Government support (Hart 2008).
By exiting the FPD industry, US-based companies are not competitive in polysilicon-
on-glass technology that is prominent in newer electronic devices, such as e-readers and
recent iPhones. This glass/silicon substrate innovation only succeeded after years of iter-
ating the technology among Asian manufacturers (Shih 2009). Thus, the vertically inte-
grated high-tech supply chain is likely to be the growth model going forward. The
importance of this strategy is largely ignored in the United States.
However, even analysts who have thought in depth about this supply-chain integration
issue continue to disagree. Pisano and Shih (2009) support the position that the offshoring
of the semiconductor supply chain is a negative for long-term US economic growth. Shih
(2009) separately reinforces this position by analyzing the global distribution of the
sources of the components of the Kindle e-reader, which Amazon designed. One of its key
components—the ‘‘electronic ink’’ (tiny microcapsule beads used in the Kindle’s elec-
trophoretic display) was developed and is currently manufactured in the United States by a
small company, E Ink. The sources of all other electronic components in the Kindle—both
R&D and manufacturing—are outside the United States. The estimated cost of the Kindle
is $185. Of this amount, $40–$45 is estimated to be captured within the US economy,
mostly by Amazon. Moreover, although the display is the single largest component in
terms of cost, E Ink has to have the glass/silicon substrate made in Asia, so it does not
capture the full market value of the display. The company’s inability to produce the entire
display significantly limits its potential value added to the domestic economy. In fact, the
limited growth potential had forced E Ink to attempt to sell itself to Prime View Inter-
national, the Taiwanese company that manufactures the display incorporating E Ink’s
special beads. Such a merger could result in E Ink’s R&D and manufacturing activities
being moved to Taiwan.
Another example of the global distribution of the sources of value added from a con-
sumer electronic device is Apple’s iPod. In depth analysis showed results similar to those
obtained for the Kindle. The study estimated both the cost of components and the gross
profit earned by each supplier. Again, the vast majority of the value of all manufactured
parts is now offshored (Linden et al. 2008).
The counterpoint to the negative view of offshoring high-tech manufacturing is that
companies like Apple and Amazon have become highly successful by focusing on design
and forward integration into related services. It is certainly the case that these two com-
panies are capturing significant shares of the value added. Moreover, Apple has prospered
since it gave up its highly vertically integrated strategy. By outsourcing all manufacturing,
the company has greatly increased its performance (Yoffie 2009). Further, the Apple
business model is considered to be sustainable over time because the company along with
others such as ‘‘Amazon, Google, Hewlett-Packard, IBM, AT&T, and Qualcomm have
successfully used their investments in software, services, infrastructure, and intellectual
property to do the same. All use their market power to force upstream vendors to invest for
them to make the inputs to downstream innovations … cheaper and more plentiful’’
(Rappaport 2009).
G. Tassey
123

It is true that Apple captures a large share of the iPod’s value added. An analysis by
Portelligent Inc. estimated that Apple’s gross profit margin was 34% of the estimated
wholesale price—resulting in greater value added than for any of its suppliers (Linden
et al. 2008). And, for units sold in the United States (about half the total), portions of the
retail price went to distribution and retail firms, further adding to domestic value added.
As is the case for many innovations, the iPod initially had little competition, in part
because of its innovative design and in part because Apple was able retain a monopoly on
the sale of songs to iPod owners. Controlling the supply of music allowed Apple to cut the
price of the iPod and sell even more units. However, as Rappaport (2009) admits, ‘‘this
model breaks down … where US companies and innovators do not naturally control
downstream demand.’’ As the United States has only 4.5% of the world’s population, the
post-WWII model of a global economy led by the US consumer was living on borrowed
time and, in fact, is now defunct.
Even if Apple maintains its market dominance through the entire technology life cycle,
the finite life of the iPod’s product technologies makes it hard to argue that such a strategy
can be characterized as a model for large-scale application and hence a long-term driver of
domestic value added.
Finally, Apple has other somewhat unique competitive attributes. The company
develops its own software and has superb management. This tacit knowledge implies a co-
location strategy, which means Apple’s operations will likely stay in the United States.
While this is a good thing for the domestic economy, the growth policy question is how
many Apples can be successful at the singular design stage of economic activity. Because
Apple has residual tacit knowledge associated with the electronic components in the IPod
from its history as a vertically integrated company, it had a competitive advantage in
designing the product. In contrast, although Kindle was an initial market leader, Amazon
lacked similar product technology expertise, which has shown up in the rapid imitation by
other companies, including foreign companies. Even for Apple, however, the next gen-
eration of electronics technology will be foreign to the company and quickly dilute its
current advantage.
Apple’s strategy might remain viable over more than one technology life cycle by
establishing development partnerships for next generation hardware and software; i.e.,
through immersion in a technology cluster. However, without the internal research expe-
rience and hence expertise, such a strategy will be difficult to execute. Apple’s forward
integration into services is fairly simplistic—sell songs to iPod owners—and, in fact, Apple
does not appear to have made much of a profit from the iTunes Music Store. Thus, their
business model would seem to depend largely on the continued dominance by iPod of the
MP3 player market.
In contrast, IBM arguably has the most complete vertical-integration strategy of any IT
company in the world. Its long-term research facility, the Watson Research Center in
Westchester, NY, is close to the company’s semiconductor R&D and 300 mm manufac-
turing facility in Fishkill, NY. Its large computer systems manufacturing and assembly
operation is just a little farther north in Poughkeepsie, NY. Albany is the center of IBM’s
post-CMOS research activity. These facilities are all within half a day’s drive, which enables
the needed intense co-location synergies for innovative product and service development.
However, the evolution of IBM’s corporate strategy over the past two decades leads
some to argue that the US economy is moving justifiably toward a total service economy.
The proponents of this view may want to reexamine this alleged natural progression of the
high-tech economy. High valued-added, high-tech services are complex systems. The
design of such systems requires bundling a wide range of hardware and software
Rationales and mechanisms for R&D strategies
123
technologies. Not being intimately involved in the ongoing development of these tech-
nologies through participation in the R&D stage or, at a minimum not attaining close
association with suppliers of such technologies, will not be a successful business strategy
in ‘‘the service economy’’ of the future. In fact, IBM has shown no indication of winding
down its highly productive product R&D facilities. IBM may be somewhat of an outlier in
that it is one of the most vertically integrated R&D-intensive companies in the world.
However, the technology cluster model works for decoupled high-tech supply chains, as
long as the supporting infrastucture is supplied.
An important aspect of life-cycle management is the fact that all large R&D-intensive
companies are global in scope. 71% of IBM’s employees are located outside the United States
because (1) IBM understands the need for co-location synergies at the national market level
and (2) the company increasingly can find quality research and manufacturing infrastructures
in other countries that support the increasingly essential technology cluster model.
The policy implication is that investment location decisions are increasingly being made
not solely on near-to-market considerations, as was the case several decades ago. Rather,
they are being made on the availability of an increasingly complex infrastructure. The New
York technology cluster includes many small and medium firms, state-of-the-art university
research facilities, and skilled labor. To date, however, such clusters have appeared in the
US economy almost exclusively where state governments have supported them.29
Responding to these trends is complicated by the need in such complex technologies for
an equally complex set of infratechnologies (supporting technical infrastructure) associated
standards. Research on such technical infrastructure is now often done at geographically
separate locations, but in the future it will have to be an integral part of research clusters.
In addition, vertical disintegration is unlikely to work for new technologies because
fabrication processes have only been partially characterized. For example, emerging MEMS
(‘‘micro-electromechanical systems’’) technology requires a more sophisticated fabrication
process than do integrated circuits, involving the interaction of phenomena from a much
larger set of physical domains: electrical, mechanical, thermal, optical, fluidic, and more.
Fabrication processes have not yet been adequately characterized with respect to these
multiple physical domains.30 Therefore, co-location of R&D and production is essential.
Without co-location, the design-for-manufacturing imperative will not be realized.
Thus, a major policy point is that viewing the hollowing out of a domestic supply chain
over a technology’s life cycle as simply a matter of specialization according to the law of
comparative advantage is turning out to be naıve in that not only is value added lost but co-
location synergies often convey growing and permanent competitive advantage to those
economies that adopt an integrated technology development and utilization model.31 As
demonstrated by evolving national technology-based growth strategies around the world,
the public–private asset character of modern technologies is leading both government and
industry to not only up the amount and type of R&D but to do so using more efficient
collaborative research methods.
29 The federal government’s first program to support regional innovation clusters is a $50 million FY2010budget request for the Department of Commerce’s Economic Development Administration.30 MEMS technology has already produced new higher-performance products such as accelerometers forautomobile airbags, tiny nozzles for ink jet printers, and projectors for high-end video displays. Continuedcommercialization of MEMS technology has been forecast by some analysts to produce a second semi-conductor revolution that will drive growth in the US economy for decades to come.31 The phenomenon of co-location is not just about the provision of complementary technology assets andthe efficient transfer of technical information but also includes benefits from institutional integration(Hermans et al. 2008).
G. Tassey
123

12 Loss of R&D and new manufacturing in the next technology life cycle
The transition between two technology life cycles is at least as difficult a policy challenge
as managing the entirety of a single life cycle. This problem of cycle transition is
accentuated the more the technologies underlying successive cycles are different. Tech-
nologies based on different science require different technology development and pro-
duction approaches. Both the R&D and production capital infrastructures within the
industry will need to change. In fact, the entire supply chain in which the industry is
embedded will likely be different.
The contrast between the traditional pharmaceutical industry and the emerging bio-
technology-based industry is a case in point. The existing industry has sunk an enormous
amount of resources into a small-molecule chemistry from which drugs are ‘‘discovered’’
through a largely trial-and-error approach. Even sophisticated research techniques such
high throughput screening only modestly increase the efficiency of a very inefficient R&D
approach. The declining relative efficiency of this industry is evident in the increasing
reliance on marketing (the industry spends more on advertising than on R&D).
In contrast, the biopharmaceutical industry is based mainly on the development of large-
molecule drugs derived from a fundamental underlying science (cell biology). The greater
efficacy of biopharmaceutical products sells them, not advertising. The dependency of
biopharmaceuticals on a complex science base demands the use of the multi-element
technology model to achieve R&D efficiency. However, NIH funding has been primarily
directed toward basic science on the assumption that scientific advances will attract venture
capital with the result being innovative new drugs. This approach is an application of the
black-box model of innovation. As a result, while new biopharmaceuticals have resulted
from private-sector R&D, the productivity of this investment has been low.32 Such results
are finally turning the biopharmaceutical industry toward the multi-element technology
model. In the last few years, research has increasingly emphasized proof of concept and
improved infratechnologies, such as biomarkers (Haberman 2009; Gallaher et al. 2007).
The major policy response in an increasing number of economies is the technology
cluster concept, which is emerging as an important institutional strategy for not just effi-
ciently conducting breakthrough research but also to increase the efficiency of subsequent
commercialization. For example, the Nanoscale Science and Engineering cluster at the
University of Albany not only conducts proof-of-concept research, but also provides
‘‘quick turn-around capability’’ to support the increasingly difficult first-stage fabrication
cycle and thereby allow ‘‘seamless transition to high volume industrial manufacturing after
the demonstration of feasibility stage.’’33 The bottom line is that achieving co-location
synergies means the value added from both R&D and manufacturing will accrue to the
innovating economy—at least when the technology is in its formative stages.
Similarly, integrated semiconductor firms operate ‘‘process-technology development’’
facilities to debug new manufacturing technologies. Typically, the development fabs are
located in the innovating semiconductor firm’s home country. The demanding technical
nature of state-of-the-art innovation requires close coordination between product design
32 Since the mid-1990s, the number of new drugs approved per year has declined, while the cost of taking adrug candidate from discovery through FDA approval has increased. This means that from a portfolioperspective, a successful drug must cover not only the growing total cost the portfolio R&D, but also thecosts of an increasing number of failures.33 See http://cnse.albany.edu/ContentManager/index.cfm?Step=Display&ContentID=172.
Rationales and mechanisms for R&D strategies
123
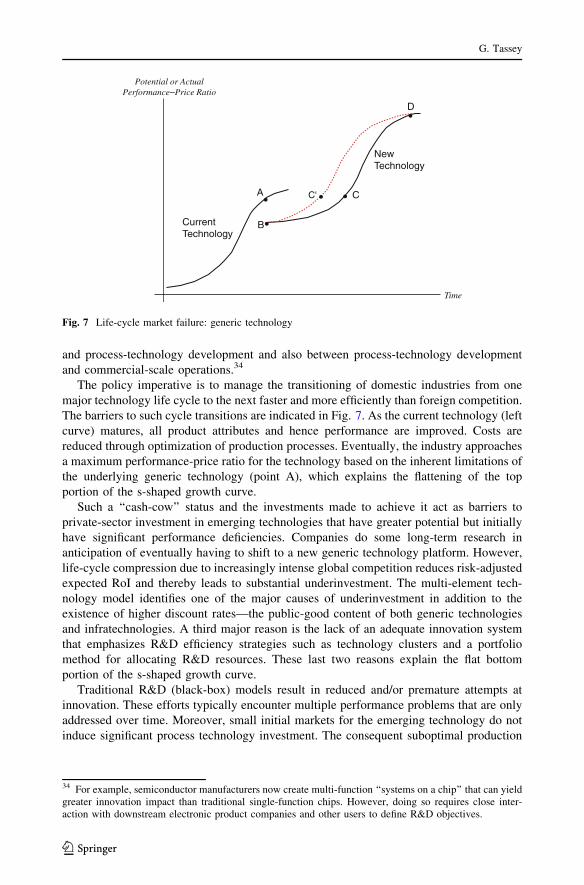
and process-technology development and also between process-technology development
and commercial-scale operations.34
The policy imperative is to manage the transitioning of domestic industries from one
major technology life cycle to the next faster and more efficiently than foreign competition.
The barriers to such cycle transitions are indicated in Fig. 7. As the current technology (left
curve) matures, all product attributes and hence performance are improved. Costs are
reduced through optimization of production processes. Eventually, the industry approaches
a maximum performance-price ratio for the technology based on the inherent limitations of
the underlying generic technology (point A), which explains the flattening of the top
portion of the s-shaped growth curve.
Such a ‘‘cash-cow’’ status and the investments made to achieve it act as barriers to
private-sector investment in emerging technologies that have greater potential but initially
have significant performance deficiencies. Companies do some long-term research in
anticipation of eventually having to shift to a new generic technology platform. However,
life-cycle compression due to increasingly intense global competition reduces risk-adjusted
expected RoI and thereby leads to substantial underinvestment. The multi-element tech-
nology model identifies one of the major causes of underinvestment in addition to the
existence of higher discount rates—the public-good content of both generic technologies
and infratechnologies. A third major reason is the lack of an adequate innovation system
that emphasizes R&D efficiency strategies such as technology clusters and a portfolio
method for allocating R&D resources. These last two reasons explain the flat bottom
portion of the s-shaped growth curve.
Traditional R&D (black-box) models result in reduced and/or premature attempts at
innovation. These efforts typically encounter multiple performance problems that are only
addressed over time. Moreover, small initial markets for the emerging technology do not
induce significant process technology investment. The consequent suboptimal production
Time
Potential or Actual Performance–Price Ratio
BCurrent Technology
New Technology
A
D
CC'
Fig. 7 Life-cycle market failure: generic technology
34 For example, semiconductor manufacturers now create multi-function ‘‘systems on a chip’’ that can yieldgreater innovation impact than traditional single-function chips. However, doing so requires close inter-action with downstream electronic product companies and other users to define R&D objectives.
G. Tassey
123

processes result in relatively high unit cost. The combined result is a lower initial per-
formance-price ratio (point B) than is the case for the current mature technology.
From an R&D investment perspective, the prospect of such an initial performance-price
gap leads the private sector to assign substantial technical and market risk to the possibility
of investing in the development of the new technology. This ‘‘risk spike’’ (commonly
referred to as the ‘‘valley of death’’) results in underinvestment by the private sector in
early-phase generic technology research. The collection of barriers facing private firms at
this early point in the R&D cycle creates the need for government support, not just for
basic science but for early-phase, proof-of-concept (generic) technology research and a
range of infratechnologies that leverage the efficiency of this research (Tassey 2007a,
2008a, b).
Most industrialized nations now have innovation-system programs to reduce the risk
spike. These efforts include not only R&D subsidies but, more recently, promotion of more
efficient R&D mechanisms, especially various forms of research collaboration. The most
advanced form of collaboration, R&D clusters, can not only enhance research efficiency in
general, but also significantly increase co-location synergies between adjacent tiers in high-
tech supply chains. The impact of policies aimed at increased R&D and R&D efficiency is
a shift in the domestic performance-price curve upward and to the left (the dotted line in
Fig. 7). Thus, a performance-price ratio equivalent to the cash-cow position of the existing
technology is reached faster (C0).
13 An example of life-cycle offshoring: battery technology
Energy storage has been cited as the driver of systems-level technologies in such disparate
areas as electrical power production/distribution and consumer electronics. In the latter
case, evolution of technology life cycles has resulted in new generations of wireless
devices and portable entertainment products. Such products are making greater power
demands on batteries. Reductions in operating voltage have done little to offset the
problem because new generations of products have extra features (examples: color dis-
plays, speech-recognition capability, electronic banking, and a range of information and
entertainment services) that increase the burden on energy storage technology.
Most portable consumer electronic products use disposable batteries, which are a
mature $18 billion global market. Not only is a market of this size attractive but the
proliferation of electronic devices means continuing growth in demand. However,
standardization imposed by device manufacturers on the previously dominant alkaline
technology has restricted even modest innovation. Specifically, options for new chemical
compounds have been constrained by the requirement to ‘fit’ the battery into the standard
shape. It is through such constraints in the later phases of a life cycle that the legacy of
past investment strategies has its greatest and often terminating effect on the existing
industry structure.
This portion of the creative destruction process is characterized by the market-share
leaders pouring enormous resources into minor improvements. Meanwhile, a radically new
technology is lurking in an unseen location elsewhere, so that incumbents eventually
become victims of what has been called ‘‘motivation asymmetries’’ (Christensen et al.
2004a).
A critical aspect of this process is the tendency of dominant companies to find ways to
ignore the inroads in their markets by new entrants who are both more desperate and
Rationales and mechanisms for R&D strategies
123

uninhibited by the current technology and market focus (i.e., the latter are unaffected by
the installed-base and installed-wisdom effects). The new entrants may initially focus on
the low-value-added market segments, which are beneath the dignity of the incumbents.
However, through innovative technology and marketing strategies, these upstarts move up
the value-added scale and encroach upon or, in some cases, grab large shares of the
existing major markets. In the latter case, the incumbents frequently are put out of
business.
In the early 1990s, lithium–ion batteries were developed as a challenger technology. A
distinguishing feature is that they are rechargeable. As a result, they have become the
standard for high-energy, rechargeable batteries. Moreover, they have four times the
energy and twice the power capacity of competing nickel cadmium (Ni–Cd) batteries.
They also do not experience a memory effect (the loss of energy storage capacity that
results from partial discharges before recharging).
As described in an excellent paper by Brodd (2005), American companies, having
succeeded in reaching the leadership position in disposable batteries through realization of
economies of scale in production, brand imaging and superior marketing, have not been
able to adapt to the new technology life cycles for rechargeable batteries. A disposable
battery is a standardized commodity and hence so is its interface with the electronic
products it powers. This situation allows battery manufacturers to operate in a non-inte-
grated way within the device supply chains they serve. Co-location synergies are not
important.
This is not the case for newer rechargeable battery technologies. Development of Li-ion
batteries has required close contact with portable electronic device designers to adapt the
battery to the performance attributes of the device. Large American battery manufacturers,
such as Duracell and Eveready (now Energizer Holdings), began R&D efforts to develop
the new technology in the early 1990s. Their intent was to ultimately commercialize and
domestically produce Li-ion batteries. However, as Li-ion battery technology emerged,
lack of scale and initial production inefficiencies discouraged these companies from
investing in production facilities in the United States. Labor costs were not a factor in this
decision. The highly automated unit cell production process for the new technology offset
any labor cost advantage of locating production in East Asia.
The lower profit margins typical of the early phases of a technology’s life cycle coupled
with the higher profit margins of mature disposable batteries acted as a disincentive to US
manufacturers to invest in the capacity to produce the new rechargeable batteries. Typi-
cally, the defenders of the old technology attempt to remain competitive by continually
cutting costs. However, cutting costs for production based on an increasingly obsolete
generic technology is a doomed strategy. The installed-base effect was in full force in the
American battery industry.
Success in the rechargeable market requires knowledge of the electrical requirements
for emerging products that require these batteries, as well as the ability to achieve rapid
product improvements to meet changing device requirements and then to assemble the
unit cells into battery packs for use in specific devices. Most producers of portable
electronic devices are located in Japan and are vertically integrated companies; that is,
they are both producers and users of Li-ion batteries. In contrast, most US manufac-
turers lack the ability to integrate with upstream design firms and materials suppliers
and with downstream customers; that is, supply chain integration is not present in the
US market.
Moreover, effective supply-chain integration, in addition to communication, requires
an understanding by large manufacturers that smaller suppliers need both adequate
G. Tassey
123

profits and some minimum level of orders during down portions of the business cycle to
sustain R&D and update productive capacity. However, the strong profit-maximization
focus by US companies, in contrast to a greater emphasis on market share and
sustainability by, for example, Japanese companies, has led to further hollowing out of
the US supply chain. Finally, even though several US companies have the capability to
produce all the components and materials associated with Li-ion technology, no viable
market exists in the US economy because all the manufacturing takes place in Asia
(Brodd 2005).
Current US research in battery technology is investigating the potential of a range of
new energy sources, including ceramic, kinetic, photovoltaic, electrochemical, thermal and
biological technologies. For example, attaining the ability to deposit microbatteries directly
onto printed circuit boards would provide a significant competitive advantage over stand-
alone batteries—an advantage that manufacturers are keen to exploit. Unfortunately,
printed circuit boards are now produced largely outside the United States, which again
inhibits supply chain collaboration.
In the past few years, a number of venture-backed startups—Boston Power, Interna-
tional Battery, Valence Technology, Altair Nano, A123 Systems, PowerGenix, ZPower—
have appeared (Kanellos 2008). However, US battery R&D is still largely dispersed and
uncoordinated—another example of the traditional non-portfolio and non-supply-chain
approach to R&D funding. And, it is not as if attempted innovation in battery technology is
only occurring in the United States. Samsung, for example, is developing a direct methanol
fuel cell as part of a docking station that allows a notebook computer to run for 8 hours a
day, 5 days a week, for up to 4 weeks (Garrett 2006).
Recently, however, a US advanced battery consortium (officially, the National Alliance
for Advanced Transportation Battery Cell Manufacture) has been formed. It was created in
2008 as a collaboration among 14 companies and Argonne National Laboratory and has
asked for $1 billion in government funding. Moreover, the US government recently
implemented an initiative to promote a domestic automotive supply chain for the forth-
coming era of electric and plug-in hybrid vehicles by announcing subsidies for battery
plants.35
While implementation of the research consortium model and efforts to promote supply-
chain synergies are steps in the right direction, Asia, by virtue of an already established
concerted public–private effort, has a better research infrastructure and a more efficiently
integrated supply chain. Thus, it remains ahead of the United States in battery science,
technology, and manufacturing through a better national innovation system. The policy
imperative is to use modern research portfolio methods and pursue supply-chain integra-
tion and also to implement such strategies in the right time frame relative to the technology
life cycle.
14 A technology-based manufacturing strategy
Because manufacturing accounts for the majority of industrial R&D, its future strongly
depends on more efficient government R&D policies that leverage industry investment in
accordance with the public–private nature of the multi-element technology growth model.
35 Compact Power Inc. is a subsidiary of South Korea’s LG Chem. Korea is where much of the currentworld’s supply of advanced automobile batteries is located.
Rationales and mechanisms for R&D strategies
123

Based on discussions in the preceding sections, an R&D policy for manufacturing must be
built on and judged by assessments of the required
• amount of R&D
• composition of R&D
• distribution of R&D among tiers in the high-tech supply chain
• efficiency of R&D programs
14.1 Amount of R&D
Perhaps more than any other indicator, the long-term trend in US R&D intensity represents
the lack of adaptation to the changing global economy. Figure 8 shows that the R&D
intensity of the US economy is virtually the same today as in 1960. During the intervening
five decades, the global economy has become far more R&D intensive. The United States
still accounts for about 30% of global R&D, but its share is shrinking. With 4.5% of the
world’s population, a small high-tech sector (approximately 7% of GDP) and a trend
toward private-sector offshoring of R&D, this negative trend will continue and possibly
even accelerate.
The Obama Administration has set a goal of a 3% R&D intensity. Achieving this ratio
would be a record high for the US economy (slightly exceeding the average of high of
2.8% in the mid-1960s), but this ratio would only tie Korea for fifth place among tech-
nology-based economies (Fig. 4).
14.2 Composition of R&D
From a national innovation system perspective, the main culprit with respect to both
aggregate underinvestment in R&D and suboptimal composition of this R&D is the federal
government. Figure 8 shows that the federal share has declined significantly over five
0.0%
0.5%
1.0%
1.5%
2.0%
2.5%
3.0%
3.5%
1953 1957 1961 1965 1969 1973 1977 1981 1985 1989 1993 1997 2001 2005
Total R&D/GDP
Federal R&D/GDP
Industry R&D/GDP
Fig. 8 R&D intensity: funding as a share of GDP, 1953–2007. Source: National Science Foundation
G. Tassey
123

decades. In contrast, US industry’s share has increased steadily—at least until this decade,
during which it has actually declined, in part due to increased offshoring.
The manufacturing sector’s R&D intensity (industry-funded R&D/sales) began growing
slowly in the mid-1980s from approximately 2.5% to the current rate of 3.7%. The increase
has been a response to globalization, but this ‘‘response’’ is more the result of offshoring
low R&D-intensive industries than to absolute increases in R&D spending. More impor-
tant, this average intensity pales compared to truly R&D-intensive industries, whose ratios
of R&D to sales range from 8 to 22%. Most of the global economy’s R&D is targeting
manufacturing technologies and is growing rapidly, clearly posing an increasing com-
petitive challenge for individual nations.
Nanotechnology is a prime example. Unlike past major disruptive technologies, the
United States does not dominate the world’s R&D effort. North America, Europe and Asia
each account for about one-third of the estimated global R&D spending on nanoscience
and nanotechnology research of $14 billion.36
The federal government was once the dominant sponsor of the nation’s R&D, funding
65% of all US R&D in 1965. But the federal share moved downward in the subsequent 3
and one-half decades to a low of 25% in 2000 and was only slightly higher at 27% in 2007.
This declining share for federal R&D funding is particularly evident in the business sector.
In the late 1950s and early 1960s, more than half of the nation’s business R&D was funded
by the federal government, but by 2000, less than 10% of business R&D was federally
funded. Government-funded manufacturing R&D increases the sector’s R&D intensity
from 3.7 to 4.1%—hardly enough to qualify the sector as ‘‘R&D intensive.’’
Adherents to the black-box model of technology-based growth might argue that this
trend is actually positive because all technology development is the province of the private
sector with government only funding basic science. In this context, a higher ratio of
industry to government R&D funding would likely be judged as providing more leverage
for the government investment in the science base.
Such a view inaccurately represents the modern technology-based economy because it
does not take into account the quasi-public-good content of technology research with its
implications for the correct balance between public and private funding for R&D. In fact,
not only has aggregate federal R&D funding not kept pace with the needs of the US
economy, but data show that the ‘‘S&T’’ and ‘‘nondefense’’ portions of the federal R&D
budget have not grown at all in real terms in recent years, further accentuating the decline
in federal support for emerging manufacturing technologies and supporting technology
infrastructure. Support for these two categories of technology research are absolutely
essential to leverage the efficiency of industry’s investments in innovation.
Figure 9 shows the trends in the ‘‘R’’ part of R&D spending. Overall federal S&T
funding grew rapidly between 1998 and 2004, but this growth was largely due to a
doubling of the NIH budget (even in inflation-adjusted terms). S&T research support for
other areas of technology has been weak, growing at an average annual rate of just 1.1%
over the past 20 years and, in fact, declining in real terms over the past 5 years. It is this
portion of the federal S&T budget that supports new manufacturing technologies.37 The
bottom line is that the slow (and, in fact, recent negative) growth of R&D funding for
breakthrough manufacturing technology research is a serious policy concern.
36 President’s Council of Advisors on Science and Technology (PCAST), The National NanotechnologyInitiative: Second Assessment and Recommendations of the National Nanotechnology Advisory Panel.Washington, DC: April 2008. The global nanotechnology R&D estimate is from Lux Research.37 Even including NIH funding, federal S&T research has declined in real dollar terms since 2004.
Rationales and mechanisms for R&D strategies
123

The economic growth paradigm that served the US economy so well for decades was
based on a stream of ‘technology platforms’ (generic technologies) funded in part by
government and originating in the industrial laboratories of large companies (AT&T’s Bell
Labs, Xerox’s PARC, RCA’s David Sarnoff Research Center, and other). Those days are
gone. Internal long-term corporate research has been cut back and redirected toward
shorter-term objectives, in particular, support of current technology-life-cycle strategies
and evaluation of external sources of technology. In its place, major innovations are
increasingly being spawned from collaborations of various types, including spinoffs from
universities and federal laboratories. An increasingly large percentage of these innovations
are federally funded (Block and Keller 2008). Yet, federal funding of R&D has declined
relative to GDP for decades and the federal R&D establishment is dominated by agencies
whose missions are public goods other than economic welfare.
The overriding policy question is how to expand and improve the efficiency of this
increasingly complex and diversified innovation ecosystem, so as to effectively nurture a
portfolio of breakthrough technologies that will create new markets, industries and jobs
within the US economy. US-headquartered corporations will still get access to break-
through technologies through global research collaborations, but they are increasingly
doing so by partnering with foreign companies and governments. The resulting intellectual
property will be partially owned by companies outside the US economy and therefore so
will much of the valued added activity that results from the new IP. While participating US
companies will have rights to this IP, they are increasingly allocating subsequent applied
R&D (innovation investment) and production investment to other economies.
Thus, government policy makers have to worry not only about inadequate amounts and
types of government R&D funding but also the growing globalization of corporate R&D,
which means that the historic steady growth of domestic corporate R&D investment is no
longer assured. CEOs of US-based companies have stated on numerous occasions that their
companies are truly global in that not only are manufacturing and marketing operations
Fig. 9 Federal research (‘‘R’’) funding: 1990–2009 constant 2008 dollars. Source: AAAS. Note: FY2009does not include stimulus funding
G. Tassey
123

being offshored, but R&D is now also globally dispersed, as well. IBM has approximately
400,000 employees of which 71% are now located in other countries, including many
engaged in R&D. GE gets more than 50% of its sales from markets outside the United
States, and so on.
The other major element of an industrial technology, infratechnology, is poorly
understood and hence investment in this essential infrastructure is often both too little and
poorly timed. This underinvestment persists in spite of numerous studies that show large
economic impact through efficiency enhancements of R&D, production, and commer-
cialization. As discussed in the next section, a diverse set of infratechnologies will have to
be an essential part of a technology-based manufacturing policy.
Adequate investment in these two elements of an advanced manufacturing technology
system offers the potential for the US economy to attain global leadership through the
ability to produce high-quality, low-cost products—even in very small lots. That is, the
most advanced manufacturing sectors of the future will be able to basically eliminate
economies of scale, which characterized the industrial revolution. Instead, the emphasis
will be on maximizing economies of scope. In other words, the ability to mass-customize
products for a wide range of increasingly sophisticated and demanding customers and
produce them cheaply in small lots will provide the competitive edge in the future.
14.3 Supply-chain R&D strategies
As the previous section argues, the first and most global policy change needs to be the
adoption of the view that policies to restructure manufacturing for long-term competi-
tiveness are a ‘‘supply-chain’’ problem, not an ‘‘industry’’ problem. For example, debating
alternative strategies for resurrecting the ‘‘Detroit Three’’ as opposed to revitalizing the
entire automotive supply chain will yield disappointing results.
When technologies are new, they are often provided in their entirety by a small number
of innovative firms. As technologies mature, vertical disintegration occurs as a natural
consequence of expanding markets and the diversifying nature of competition in which
variety, price, and quality emerge as important attributes along with the original driver of
demand—performance. Specialization is a natural consequence of growth and standardi-
zation of at least some elements of product technology. The backward decoupling effect
results in distribution of R&D to the earlier tiers in the supply chain and thereby distributes
high-valued-added opportunities, as well.
When this does not happen, the domestic economic benefits potentially realized over the
technology life cycle can be constrained and even eliminated to the detriment of the
incumbent firms and the economies where they are located. The minicomputer was largely
comprised of hardware components and software from the minicomputer companies
themselves. The persistence of vertical integration restricted mid-cycle innovation and
helped open the door to the emergence of the PC, which through standardized component
interfaces could be built from parts supplied by multiple vendors in a vertically separated
supply chain. This led to the entry of a wide variety of innovative companies such as IBM,
Seagate, Dell, and Microsoft who collectively created a huge global PC market.
However, markets structured along the lines of the PC accelerate ‘‘backward decou-
pling.’’ Rather than isolation of the tiers in a high-tech supply chain, vertical disinte-
gration leads to a need for more, not less, coordination. Vertical distribution of R&D is
part of the expanding phenomenon of open innovation, which involves greater levels of
collaboration. Unfortunately, once offshoring has begun, the need for such collaboration
Rationales and mechanisms for R&D strategies
123
often leads to offshoring of multiple tiers due to greater co-location synergies in the
second economy.38
No matter what the final outcome with respect to distribution of value added in one
technology life cycle, global markets are up for grabs in the next life cycle for all econ-
omies with the requisite innovation infrastructure, as evidenced by the fierce battle cur-
rently underway for first-mover advantage in nanotechnologies. For today’s science-based
technologies, innovating and then acquiring market share in the early phases of major life
cycles require large numbers of scientists and engineers both in industry and supporting
university and government institutions to advance and broaden the applications of the
original innovation. For example, cell-based drug development has evolved as a research
and manufacturing technique over the past 25 years only through the efforts of thousands
of biologists, geneticists, and chemical engineers who perfected the fermentation systems
that increased the capacity to produce recombinant proteins at least tenfold just in the past
decade and 30-fold since the inception of biotechnology (DePalma 2005). The efficiency
with which this process unfolds is not just a matter of private-sector R&D investment but
depends greatly on the efficacy of the entire innovation infrastructure.
14.4 R&D efficiency
A steadily increasing number of economies now develop high value-added products.
Korea, for example, has risen to the world’s 12th largest economy by steadily increasing
manufacturing R&D. That economy’s progress has been leveraged by major national
projects, such as a 10-year, $200 million collaborative R&D effort involving six research
institutes, 27 universities and 70 companies to advance computer-integrated, flexible
manufacturing systems. The Koreans claim that the project has increased productivity
growth for the involved companies by 300%. In addition to such process technology gains,
Korea has emerged as an innovation leader in high-definition television and CDMA mobile
phone technology. Korea’s Hyundai has joined Toyota and Honda as the three leading
global automobile companies with respect to quality, according to JD Power & Associates.
The potential R&D efficiency gains from collaboration depend not only on the
management of hardware and software R&D among the tiers of the supply chain but also
require coordination with the sources of a diverse technical infrastructure that supports
all modern technologies. The difficulty in managing the timing and quality of such
technical infrastructure increases with growing dependence on global R&D networks, as
the number and complexity of market interfaces increases dramatically. As a result, the
quality and availability across a research network of qualified science and engineering
data, standardized measurement and test methods, an IT infrastructure, etc. are critical
attributes of efficiency. That is, investment in supporting infratechnologies and standards
must proceed in concert with investment in proof-of-concept research and subsequent
applied R&D.
While potentially more efficient, an important attribute of global networks for domestic
economic growth policy is the fact that the value added from the R&D and subsequent
38 One can ask why do not existing domestic supply chains remain in place, especially with the increasedneed for collaboration due to backward distribution of R&D. As explained in the sections on technology lifecycles, a particular tier can move offshore in a sequence of steps (first manufacturing and then R&D),especially as a technology matures. Once established in a another economy, more attractive investmentincentives and superior overall innovation infrastructure in that economy can lead to indigenous tiersevolving above and/or below the original transplanted tier (for example, the emergence of semiconductordesign firms in Taiwan after the establishment of chip manufacturing capability).
G. Tassey
123

manufacturing and derived services is also going to be distributed across countries. Thus,
economic growth strategies of the future must be sufficiently robust and efficient to draw
global capital into the domestic economic economy. That is, a large enough share of the
global value added from investment in the technology over its entire life cycle sufficient to
attain domestic economic growth objectives is the critical policy impact metric.
Looking forward, nanotechnologies will drive future manufacturing innovation and
process productivity. Developing these technologies will require major long-term R&D
commitments by governments and their domestic industries. The innovation leaders will be
the countries that develop entirely new methods allowing the manipulation and assembly
of nanoscale components into nanodevices with complex functionality. Generic technol-
ogies will likely be available for licensing at attractive rates in the early phases of nano-
technology life cycles, but the value added in subsequent phases, where experience with
process technologies feeds back into new R&D, will accrue to those economies that invest
in both stages of economic activity (R&D and manufacturing). Staying competitive over
the entire technology life cycle is essential to maintain domestic value-added growth,
including growth in employment.
Whatever the particular manufacturing technology, private investment does not take
place in a vacuum. In particular, an elaborate economic infrastructure is required. In
competitive economies, economic infrastructures facilitate (1) the financing of investments
in advanced manufacturing technologies, (2) the conduct of advanced manufacturing R&D,
(3) the integration of the results of R&D into production systems, and (4) the provision of
skilled labor to effectively use both the equipment and associated software. Such infra-
structures are difficult to construct and maintain. Economies with efficient R&D networks,
venture capital markets, integrated supply chains (virtual or actual), and education and
training facilities have competitive advantages that are not easily established—or imitated.
Such ecosystems, often called technology clusters, are proliferating globally as the means
for driving regional economic growth.39
The difficulty in managing the evolution of such ecosystems increases with growing
dependence on multiple actors in R&D networks and associated manufacturing clusters, as
the number and complexity of market interfaces increases dramatically. As a result, the
quality and availability across a research network of qualified science and engineering
data, standardized measurement and test methods, an IT infrastructure, etc. are critical
attributes of efficiency. That is, investment in supporting infratechnologies and standards
must proceed in concert with investment in proof-of-concept research and subsequent
applied R&D. Darby and Zucker (2003) provide the example of polymerase chain reaction
(PCR)—an infratechnology used to amplify the number of copies of a specific region of
DNA. PCR facilitates the production of enough DNA to conduct experiments, run tests and
so on. It has thereby enabled applications ranging from detection of infectious agents to
forensic applications.
R&D policy for manufacturing must also recognize that traditional R&D funding
strategies in which components are developed first and then ‘‘fitted’’ into the final man-
ufacturing system are inefficient. In effect, productivity at the systems level is addressed
after the hardware components are developed, which reduces the efficiency of systems
integration. However, because system-level productivity ultimately contributes as much or
39 See Zhang et al. (2009). Clusters promote more interactions among research institutions (universities andgovernment laboratories), innovators, their suppliers, venture capitalists, and other public-sector infra-structure. Such clusters increase both cooperation and competition, resulting in a much more effectiveinnovation ecosystem. They also increase the efficiency of R&D through localized knowledge spillovers.
Rationales and mechanisms for R&D strategies
123

more to manufacturing productivity as do the system components, it cannot be ignored.
The cluster model, embodying joint strategic planning between industry and government,
can efficiently manage the needed R&D as a portfolio, where the member technologies will
comprise the eventual manufacturing system.
Finally, overall R&D efficiency also requires both public and private institutions that
carry out their respective roles in an integrated and complementary manner. It is not a
coincidence that the two winners of the 2009 Nobel prize in economics (Elinor Ostrom and
Oliver Williamson) are institutional economists. However, unlike most Asian economies
and some European economies, the United States (at least at the federal government level)
has in the past failed to understand the importance or the complexity of the modern
innovation economy.
A major barrier in this regard is the dominance of federal R&D funding by mission
agencies (DoD, NIH, NASA, etc.). Mission agencies account for 91% of total federal
R&D funding). The R&D portfolios of these agencies are optimized for their public
missions. While their R&D funding stimulates technology development that has eco-
nomic impact, the R&D portfolios are not directed at the economic-growth objective. For
example, as pointed out in an NRC report, industry contributes only about 1% of DoE’s
funding. Other countries in both Europe and Asia stand out in stark contrast. Taiwan’s
major R&D agency, the Industrial Technology Research Institute (ITRI), has the single-
purpose mission of technology development and commercialization. Taiwanese industry
contributes about one-third of ITRI’s budget. DoE generates 0.1 patent per million
dollars of R&D compared to 2 patents per million dollars for ITRI. The NRC report also
points out that the economic growth orientation of ITRI means that technology transfer is
‘‘a dedicated mission, whereas for DoE it was a supplementary mission, not one central
to the [agency] management’s intent’’ (National Research Council 2007, p. 33). This
comparison is not a criticism of DoE. It is simply a fact that mission R&D agencies are
not organized to emphasize technology development primarily for commercialization
purposes.
14.5 The bottom line
For high-income economies, the more labor-intensive a technology, the more likely it is to
be offshored. However, because more capital-intensive technologies employ less labor per
unit of output, automation has been resisted by some politicians due to the initial negative
impact on employment. Of course, without automation, all jobs in the particular industry
will eventually be lost, so underinvestment in capital-intensive technologies is not an
option, if one wishes domestic manufacturing to survive.
The correct policy perspective is that because automation reduces unit cost and
potentially increases quality and flexibility, such a strategy will result in increased global
sales, which, if significant, will increase employment as domestic shares of global markets
expand. However traditional automation, whose primary focus has been labor-content
reduction, is no longer a sufficient investment strategy. Going forward, new technology-
based strategies are needed that focus on flexibility and quality. For many manufacturing
industries, the ability to produce one unit with a specific set of performance attributes as
cheaply as 10,000 units implies a major quantum increase in technology in order to meet
demand for customized products from a wide range of users.
A significant degree of ‘‘mass customization’’ at low cost essentially means that min-
imum efficient output levels have to be greatly reduced. Achieving such a goal, however,
will require significant advances in multiple manufacturing process technologies.
G. Tassey
123

Currently, truly customized products are available only for luxury goods, which are very
expensive due to the high fixed costs relative to unit sales and the additional cost of some
degree of customization.
In summary, three major requirements for competitiveness in manufacturing are (1)
increased technological content of products, (2) more efficient and flexible production
processes, and (3) greater use of information technology to a) manage computer-integrated
manufacturing and b) more effectively integrate all business operations in manufacturing
supply chains.
The policy conundrum was stated succinctly by Lawrence Summers, director of Pres-
ident Obama’s National Economic Council:
…if you want people to make 40-year investment decisions in a way that reflects
your policy preferences, you better know what your policy preferences will be
10 years from now. How do you square that with the need for flexibility? I don’t
have all of the answers here, but I’m pretty sure that saying we should just let the
market rip is not a viable strategy and I’m pretty sure that commandeering the whole
thing by government is not a very viable strategy either.40
The answers to this challenge are
(1) Initiate R&D programs based on systematic strategic planning that identifies new
technology trajectories early and then implement institutions to manage them in the
same way a mutual fund is managed—as a portfolio where the objective is to
maximize the long-term rate of return on the portfolio at the technology system
level. This approach means that (a) the long-term needs can be more effectively
achieved through a focus on the manufacturing system technology, which changes
relatively slowly, and (b) the substantial risk associated with investment in new
technologies can minimized through sound management of a diversified portfolio.
Such management includes the expectation that individual R&D projects will fail
and be terminated, while still achieving the target rate of return for the portfolio as
a whole. This is not ‘‘picking winners and losers.’’ Rather, the portfolio is targeted
toward proofs of concept, which then allow industry to apply conventional RoI
criteria to decide what directions will be pursued for applied R&D aimed at
innovations.
(2) Understand the investment incentives for the elements of an industrial technology and
the requirements for adjusting investment polices as the public-good content of these
elements changes over a technology’s life cycle; that is, do the economic analysis to
effectively match policy response with the type of market failure in a dynamic
context.
15 R&D policy implications
To achieve long-term superiority in the rapidly expanding technology-based global
economy, the previous analysis suggests three major policy objectives:
40 Lawrence Summers, talk to the National Academy of Sciences’ Science, Technology, and EconomicPolicy (STEP) Board, October 2008.
Rationales and mechanisms for R&D strategies
123

(1) Increase the average R&D intensity of the domestic manufacturing sector to 6%
through an improved R&D tax incentive structure. This approximate 50% increase
would still be below the R&D intensities of semiconductors, computers, communi-
cations equipment, scientific and measurement instruments, pharmaceuticals, and a
number of high-tech service industries, but it would enable the breadth and depth of
innovation to increase significantly across the entire sector.
(2) Adjust the composition of national R&D to emphasis more long-term, breakthrough
research. This will require a reversal of the long-term decline in government R&D
funding relative to GDP and the establishment of an innovation policy infrastructure
within the federal government to conduct underinvestment analyses, manage the
portfolio of funded research, and support demonstration projects and technology
transfer channels.
(3) Improve the efficiency of R&D performance and subsequent technology diffusion by
increasing promotion of science parks and regional technology clusters and use of
research portfolio and stakeholder management techniques.
However, even if the shortfall in R&D funding and the inadequacies of funding strat-
egies and mechanisms were to be accepted, it is not clear that government science,
technology, innovation and diffusion policies (STID) policies can be effectively selected
and structured, given the lack of an accurate consensus growth model and an analytically-
based policy infrastructure to apply such a model.
Policy instruments are of three types (1) tax-based incentives, (2) direct financial
incentives, and (3) provision of technical infrastructure that increases the productivity of
R&D and production. Current policy development and management infrastructures have
inadequate understanding of the economic conditions that determine the selection of one
instrument over others.
The choice of specific policy options depends on the nature of the underinvestment,
which varies over a technology’s life cycle. For example, a tax credit can be effective at
increasing the amount of R&D spending by industry. That is, a tax credit will provide an
incentive to industry to invest in more of the same type of R&D it is already doing and is
therefore particularly useful in the latter phases of a technology’s life cycle when market
size and diversity of product R&D are expanding. However, it is less effective at adjusting
the composition of this R&D. In contrast, government funding is appropriate for funding
the risk spike (the valley of death) and for infratechnologies, so its focus is therefore on the
transition between life cycles and efficiency of all types of R&D (Tassey 2007a).
The following are examples of what an informed policy decision process might yield:
(1) Promote increased private-sector R&D through a larger and restructured R&D taxcredit. The United States was the first to implement an R&D tax credit in 1981. Since
then, virtually every country has done the same. However, many nations have made
their credits considerably stronger (OECD calculates that the United States now ranks
17th in terms of effective impact). Meanwhile, the US tax credit has been
‘‘temporary’’ for 28 years and its structure has hardly been analyzed. In fact, the
incremental form of the current ‘‘R&E’’ credit is inefficient and penalizes persistently
innovative companies. It should be replaced by a level credit and its magnitude
increased in order to make a significant contribution to a national goal of increasing
R&D intensity (Tassey 2007b).
For example, the tax expenditure under the credit for all industries was $6.4B in 2005.
Approximately 70% of this amount ($4.5 billion) was claimed by manufacturing
firms. Given that the US manufacturing sector funded $142.6 billion of R&D in that
G. Tassey
123

year, it is clear that the existing credit is not going to make a significant contribution
toward achieving a meaningful increase in this sector’s R&D spending. A 20% level
credit would have meant a tax expenditure of approximately $29 billion in this year.
Because the few econometric studies of the impact of the credit indicate roughly a
dollar-for-dollar response in terms of industry spending, such an incentive should
contribute one-half of the desired increase.
(2) Increase federal R&D spending. Economic studies have indicated that the comple-
mentary nature of government R&D has the effect of increasing the productivity of
private R&D and thereby increasing the rate of industrial innovation. Thus, increasing
government R&D is not a substitute for private-sector R&D investment, as claimed
by proponents of the ‘‘crowding-out’’ point of view. As the public–private asset
principle makes clear, government funding should be directed at the initial phase of
technology development—proof-of-concept research—and at research to develop
infratechnologies and associated technical infrastructure. The large technical and
market risk facing companies with only basic science in hand creates the risk spike,
which inhibits investment in radical innovations that jump start new technology life
cycles. For the most part, risk spikes can no longer be overcome by private-sector
funding alone.
(3) Improve the efficiency of R&D, innovation, and technology utilization. The
contracting of global technology life cycles demands that new technology platforms
be developed more rapidly so that innovation occurs first in the domestic economy.
Spending enough on R&D and the right types of R&D are two traditional
imperatives. Conducting R&D efficiently is a more recent third requirement for
effective R&D policy. Countries around the world are experimenting with new
technology cluster mechanisms to promote R&D portfolio management, collabora-
tive research, technology transfer, entrepreneur training, and the availability of
venture capital. The economies of scale and scope enabled by such institutional
structures are essential to compete in a global economy of shrinking technology life
cycles and hence windows of opportunity for domestic industries.
(4) Establish an innovation policy infrastructure. The United States is the only major
industrialized nation without an institutionalized science, technology, innovation,
and diffusion (STID) policy development and management infrastructure. It is
impossible for government to support new commercial technologies in the
necessary time frames associated with life-cycle evolution without systematic
analyses of technological opportunities and the underinvestment phenomena that
characterize their development and commercialization. This is especially true for
broad and complex systems technologies like manufacturing. Concepts, such as a
National Innovation Foundation, proposed jointly in 2008 by the Brookings
Institution and the Information Technology and Innovation Foundation (ITIF), have
received little attention from the policy arena, but an institutional structure of this
type is essential.
In summary, 77% of US manufacturing executives surveyed by Deloitte Research and
the Manufacturing Institute said the US needs a strategic approach to developing a man-
ufacturing base (Engardio 2009). For such a ‘‘strategic approach’’ to be successful, the
economic rationales described in previous sections must be implemented through policies
that are built on a new innovation economics, reflecting the complexity of multi-element
technology-based economic growth.
Rationales and mechanisms for R&D strategies
123

16 The complete manufacturing policy model
The major focus of this paper has been on rationales and mechanisms for improving the
amount, type and efficiency of R&D directed toward new manufacturing technology
systems. Focusing on R&D strategies is essential because (1) R&D is the investment that
creates new, productivity-enhancing technologies, (2) R&D capability is essential for
monitoring, selecting and assimilating technologies from external sources, and (3) without
adequate investment strategies, modifications to other areas of technology-based growth
policy will have little effect.
However, as pointed out in the discussion of technology life cycles, restoring the US
economy to a position of product-innovation leadership can only be the first step in a
successful technology-based growth strategy. Initial innovations are imitated, broadened,
and improved upon as the markets for the new products grow. Larger markets provide
incentives to invest in new process technologies and to differentially target additional
groups of consumers. Scale and scope economies increase productivity and diversify
markets based on the original set of innovations. Such economic activity is complex and
subject to significant underinvestment across a wide range of economic asset categories.
In this regard, Fig. 10 shows how the multi-element model can be used to more
accurately identify specific types of underinvestment across the entire technology-based
spectrum of economic activity, as discussed in this paper, and match these phenomena with
the most efficient policy responses.
This model is relevant for managing both maximization of domestic valued added
within technology life cycles and the always difficult transitions between life cycles. The
new science-driven technologies—biotechnology and nanotechnology—will be globally
competed and the winners will be the economies that adopt new innovation ecosystems
driven by complete and accurate policy models.
StrategicPlanning
Commercialization MarketDevelopment
ValueAdded
RiskReduction
ProprietaryTechnologies
Generic (Platform)Technologies
Science Base
ValueAdded
Joint industry-government planning
Market planning assistance
Acceptance test standards, national test facilities
Interface standards
Technology transfer
Direct funding of national labs, universities
Intellectual property rights,
National labs, direct funding of firms, consortia,
universities
tax incentives,Incubators
Direct funding of national labs, industry, consortia
EntrepreneurialActivity
Fig. 10 Targets for science, technology, innovation and diffusion (STID) policy. Source: Tassey (2007a)
G. Tassey
123

As Seneca, the Roman philosopher, put it, ‘‘If one does not know to which port one is
sailing, no wind is favorable.’’ That is, if one uses the wrong economic growth models and
does not recognize the complex and integrated character of modern technology systems,
then no amount of effort will succeed.
The United States does not have the correct growth model, which is why manufacturing
sector policy continues to languish. Arguments that the domestic economy can prosper in
the long run by specializing in services ignores both the co-location synergies with
manufacturing and the fact that other economies are now aggressively integrating forward
into high-tech services. That is, diversification will be an important attribute of successful
economies going forward. Further, co-location synergies are real and are particularly
important during the early phases of a technology’s life cycle. Thus, US corporate strat-
egies centered on design only or design plus services, while having worked for some
companies, did so largely because the US market (i.e., the American consumer) has been
dominant in the global economy and, until recently, because such strategies benefited from
co-location with superior domestic high-tech manufacturing.
The era of the one-country technology-based growth model and denial of modern
technology’s complexity is over. Recognition of this fact and proper policy adjustments are
essential for future competitiveness. The process of convergence is underway in services
just as it has evolved in manufacturing. So, the policy questions are where is high-margin,
high-value-added economic growth going to come from in the future and how is it going to
be attained?
Acknowledgments The author is indebted to Albert Jones of NIST’s Manufacturing Engineering Labo-ratory for very helpful comments on draft text. Also, thanks go to Daryl Hatano of the SemiconductorIndustry Association for providing data and SIA analysis relating to semiconductor technology and to TaffyKingscott of IBM for helpful insights into global manufacturing and service strategies.
References
Atkinson, R. (2009). Globalization, new technology and economic transformation. In O. Cramme & P.Diamond (Eds.), Social justice in the global age. London: Policy Network.
Atkinson, R., & Audretsch, D. (2008), Economic doctrines and policy differences: Has the Washingtonpolicy debate been asking the wrong questions? Washington, DC: Information Technology andInnovation Foundation (http://www.itif.org/files/EconomicDoctrine.pdf).
Bhide, A. (2008). The venturesome economy: How innovation sustains prosperity in a more connectedworld. Princeton, NJ: Princeton University Press.
Block, F., & Keller, M. (2008). Where do innovations come from? Transformations in the U.S. nationalinnovation system, 1970–2006. Report from the Information Technology and Innovation Foundation(July). Washington, DC: ITIF.
Brodd, R. (2005). Factors affecting U.S. production decisions: Why are there no lithium-ion batterymanufacturers in the United States? Report prepared for NIST, Advanced Technology Program,Gaithersburg, MD: National Institute of Standards and Technology.
Chesbrough, H. (2004). Managing open innovation. Research–Technology Management, 47, 23–26.Christensen, C. (1997). The innovator’s dilemma. Cambridge, MA: Harvard Business School Press.Christensen, C., Anthony, S., & Roth, E. (2004a). Seeing what’s next: Using the theories of innovation to
predict industry change. Cambridge, MA: Harvard Business School Publishing Corp.Christensen, C., Musso, C., & Anthony, S. (2004b). Maximizing the returns from research. Research–
Technology Management, 47, 12–18.Congressional Budget Office. (2008). Factors underlying the decline in manufacturing employment since
2000. Washington, DC: CBO.Darby, M., & Zucker, L. (2003). Gilichesian breakthroughs: Inventions of methods of inventing and firm
entry in nanotechnology (NBER working paper 9825). Cambridge, MA: National Bureau of EconomicResearch.
Rationales and mechanisms for R&D strategies
123
DePalma, A. (2005). Twenty-five years of biotech trends. Genetic Engineering News.Dewey and LeBoeuf LLP. (2009). Maintaining America’s competitive edge: Government policies affecting
semiconductor industry R&D and manufacturing activity. Report prepared for the SemiconductorIndustry Association.
Doraiswamy, D. (2006). Fabless semiconductor model—Shaping the semiconductor industry’s future! Frost& Sullivan (http://www.frost.com/prod/servlet/market-insight-top.pag?docid=63842246).
Engardio, P. (2009). Can the future be built in America? Business Week.Ernst, D. (2005). Complexity and internationalization of innovation: Why is chip design moving to Asia?
International Journal of Technology Management (9), 47–73.Gallaher, M. P., Link, A. N., & Petrusa, J. E. (2006). Innovation in the U.S. service sector. New York:
Routledge.Gallaher, M. P., Petrusa, J., O’Conner, A., & Houghton, S. (2007). Economic assessment of the technical
infrastructure needs of the biopharmaceutical industry. Gaithersburg, MD: National Institute ofStandards and Technology (http://www.nist.gov/director/prog-ofc/report07-1.pdf).
Garrett, D. (2006). Samsung develops marathon fuel cell. News Factor Network.Haberman, A. (2009). Overcoming phase II attrition problem: Success here should help pharma industry
boost its R&D productivity. Generic Engineering & Biotechnology News, 29, 1.Hart, J. (2008). Flat panel displays. In J. Macher & D. Mowery (Eds.), Innovation in global industries.
Washington, DC: National Research Council.Hecker, D. (2005). High-technology employment: A broader view. Monthly Labor Review (1999) and High-
technology employment: A NAICS-based update. Monthly Labor Review 57–72.Hermans, R., Loffler, A., & Stern, S. (2008). Biotechnology. In J. Macher & D. Mowery (Eds.), Innovation
in global industries. Washington, DC: National Research Council.Hira, R. (2009). The globalization of research, development and innovation. In Manufacturing a better
future for America. Washington, DC: Alliance for American Manufacturing.Kanellos, M. (2008). U.S. battery consortium seeks $1 billion, is it a waste? Seeking Alpha.Kennedy, R., & Sharma, A. (2009). The services shift. Upper Saddle River, NJ: FT Press.Linden, G., Kraemer, K., & Dedrick, J. (2008). Who captures value in a global innovation network? The
case of apple’s iPod, working paper, University of California, Irvine (shorter version published inCommunications of the ACM).
Lucas, R., Jr. (2009). Trade and the diffusion of the industrial revolution. American Economic Journal:Macroeconomics, 1(1), 1–25.
Macher, J., Mowery, D., & Di Minin, A. (2008). Semiconductors. In J. Macher & D. Mowery (Eds.),Innovation in global industries. Washington, DC: The National Academies Press.
Mann, C. (2009). Beyond Detroit. Wired, 17, 100–107.McCormack, R. (2009). The plight of American manufacturing. In: Manufacturing a better future for
America. Washington, DC: Alliance for American Manufacturing.National Research Council. (2005). Manufacturing trends in electronics interconnection technology.
Washington, DC: National Academy Press.National Research Council. (2007). Innovation policies for the 21st century. Washington, DC: The National
Academies Press.National Science Board. (2008). Science and Engineering Indicators 2008 (NSB 08–1). Washington, DC:
National Science Foundation.Petrick, I. (2009). Supply chain globalization: How surviving SMEs can position themselves for the future.
In Manufacturing a better future for America. Washington, DC: Alliance for American Manufacturing.Pisano, G., & Shih, W. (2009). Restoring American competitiveness. Harvard Business Review, 87, 3–14.Rappaport, A. (2009). Outsourcing isn’t a problem for silicon valley but is for Detroit. Harvard Business
Review Online.Samuelson, P. (2004). Where Ricardo and Mill Rebut and confirm arguments of mainstream economists
supporting globalization. Journal of Economic Perspectives, 18, 135–146.Schumpeter, J. (1950). Capitalism, socialism, and democracy (3rd ed.). New York: Harper and Row.Shih, W. (2009). The U.S. can’t manufacture the kindle and that’s a problem. Harvard Business Review
Online.Tassey, G. (2005a). Underinvestment in public good technologies. In F. M. Scherer & A. N. Link (Eds.),
Essays in honor of Edwin Mansfield, special issue of Journal of Technology Transfer 30, 89–113.Tassey, G. (2005b). The disaggregated knowledge production function: A new model of university and
corporate research. Research Policy, 34, 287–303.Tassey, G. (2007a). The technology imperative. Northampton, MA: Edward Elgar.Tassey, G. (2007b). Tax incentives for innovation: Time to restructure the R&E tax credit. Journal of
Technology Transfer, 32, 605–615.
G. Tassey
123

Tassey, G. (2008a). Globalization of technology-based growth: The policy imperative. Journal of Tech-nology Transfer, 33, 560–578.
Tassey, G. (2008b). Modeling and measuring the roles of technology infrastructure. Economics of Inno-vation and New Technology, 17, 617–631.
Van Opstal, D. (2009). Science and business: Moving beyond lab and board room. Washington, DC:Council on Competitiveness (http://www.compete.org/images/uploads/File/PDF%20Files/Science_and_Business.pdf).
Wolfe, R. (2009). U.S. business R&D expenditures increase in 2007; Small Companies Perform 19% ofNation’s Business R&D. InfoBrief (NSF 09-316). Washington, DC: National Science Foundation.
Yoffie, D. (2009). Why the U.S. tech sector doesn’t need domestic manufacturing. Harvard Business Reviewblogs (http://blogs.hbr.org/hbr/restoring-american-competitiveness/2009/10/services-can-produce-a-bright.html).
Zhang, Y., Li, H., & Schoonhoven, C. (2009). Intercommunity relationships and community growth inChina’s high technology industries, 1988–2000. Strategic Management Journal, 30, 163–183.
Rationales and mechanisms for R&D strategies
123