rational voter, complex world
DESCRIPTION
Explainling "Irrational" Voting Behavior in the 2004 Presidential ElectionTRANSCRIPT

RATIONAL VOTER, COMPLEX WORLD: EXPLAINING “IRRATIONAL” VOTING BEHAVIOR IN THE 2004
PRESIDENTIAL ELECTION
Eric “Harry” Brisson
POSC 212: Analyzing Politics
May 1st, 2010
INTRODUCTION
For any government to be successful in reflecting the needs and desires of its
constituents, it is crucial that (1.) its constituents are provided means of influencing
policy and that (2.) its constituents use these means effectively. In the United States,
the means provided to constituents are elections; however, there is debate within
political science as to whether or not voters are able to use elections effectively to
create the government that will best serve them.
In the 2004 presidential election, for example, 56.6% of voters voted against
their perceived interest with regard to environmental policy (as shown in Figure 1).
Did these voters act irrationally, threatening the very foundation of American
democracy? Or is there something more complex about the nature of voting
behavior that could perhaps explain why a majority of voters would choose a
candidate whose policy preferences they perceive as more distant than their
alternative?
This paper explores the factors that contributed to “irrational” voting
behavior in the 2004 presidential election, dividing them into three categories:
biographical, behavioral, and ideological. These three categories serve to allow us to
Brisson 2
better understand where the roots of “irrational” voting behavior truly lie – in a
voter’s background, behavior, or beliefs. In isolating the cause of irrational voting,
we are able to better understand what can be done to address it.
Through the use of regression, my results suggest that a voter’s ideological
stance is most influential in their decisions to vote in an “irrational” way, casting
doubt on the very idea that these votes are irrational at all. This paper posits that
many voters vote against their interests strategically, and do so only in pursuit of
other, more highly prioritized interests.
DATA STATEMENT
The 2004 National Election Study entailed both a pre-election interview and
a post-election re-interview with a total of 1,212 cases. The 70-minute pre-election
survey went into the field September 7th, approximately eight weeks before
Election Day. No interviewing was conducted on Election Day, November 2nd. The
65-minute post-election study went into the field the day after the election,
November 3rd, and remained in the field until December 20th. The sample for the
NES is based on a multi-stage area probability sample. Identification of the 2004
NES sample respondents was conducted using a four stage sampling process: a
primary stage sampling of U.S. Metropolitan Statistical Areas (MSAs) or New
England County Metropolitan Areas (NECMAs) and non-MSA counties, followed by a
second stage sampling of area segments, a third stage sampling of housing units
within sampled area segments, and concluding with the random selection of a single
respondent from selected housing units. The Pre-Election Study response rate was

Brisson 3
.66. Of the 1,212 respondents interviewed in the Pre-Election Study, 1,066
completed Post-Election interviews for an overall response rate of 0.88.
ANALYSIS
Using the data collected in the 2004 National Election Study, voter rationality
was operationalized by looking at specific issues (nine in total) and determining
whether or not a voter chose the candidate whose preferences she or he perceived
as closer to his or her own. From this, we are able to determine how frequently
voters exhibit the “irrational” behavior we intend to study. Figures 1 and 2
demonstrate the percentages of voters who voted consistently with their own
opinions. Figure 1 demonstrates how as issue importance decreases, so does the
probability of “rational” voting behavior, while Figure 2 demonstrates the
differences in “rational” voting behavior between the 2000 and 2004 presidential
elections, suggesting other factors are at play as voters change which issues inspire
rational voting from year to year.
Figure 3 continues to demonstrate the relationship between “irrational”
voting behavior and issue importance by plotting the percent of voters voting
“irrationally” against the mean importance ratings for each individual issue. Both
these lines demonstrate that as issues become more important, “irrational” voting
behavior becomes less frequent.
To explain overall voter rationality, an index (“Voter IQ”) was created
incorporating the voter’s rationality and allocated importance with nine separate

Brisson 4
issues. As long as there were at least five issues for which voters provided
meaningful responses, the index was calculated using the following equation:
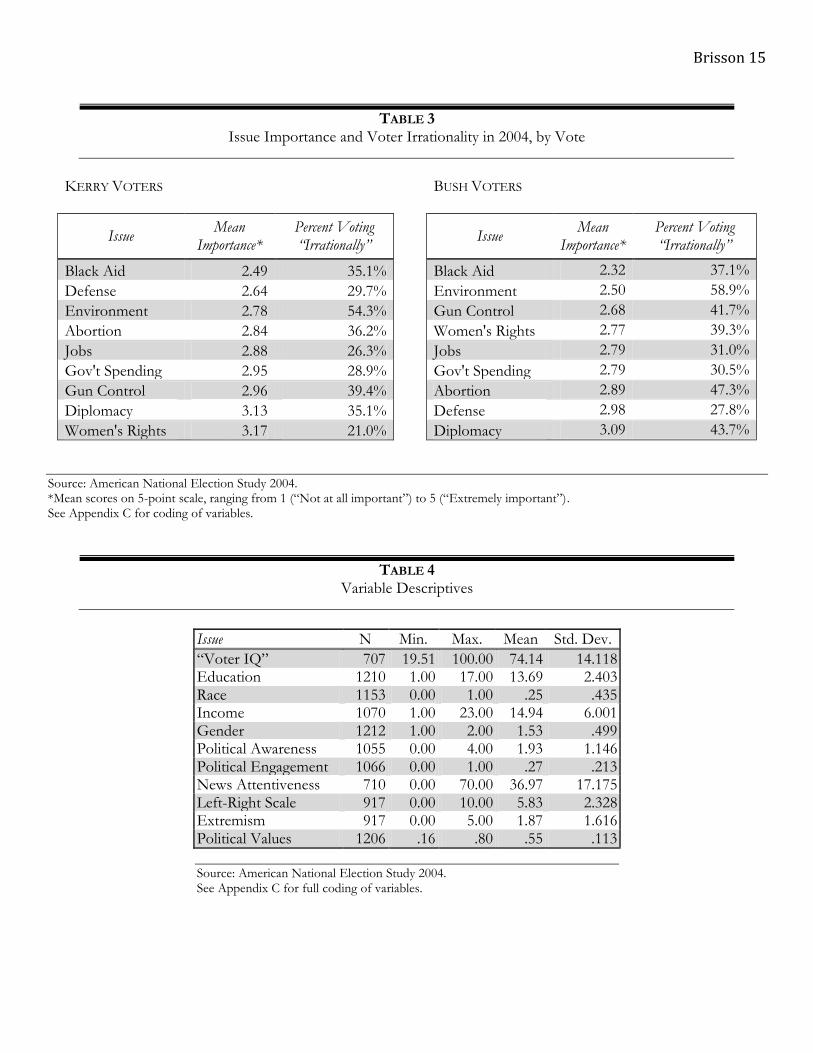
Figure 4 shows the distribution of scores for this index, with most scores
falling in between 60 points and 90 points.
An OLS regression was run to investigate key influences to this index (Table
7). In the regression, the various independent variables were divided up into three
separate categories: biographical, behavioral, and ideological.
Biographical Factors
These factors included education level, income level, race, gender, and age.
The first two of these factors, education and income, were included because they are
influenced by society and could theoretically be modified by policy to improve voter
rationality should they be significant. Education level was calculated in years, and
income was calculated in brackets. The final three, however, are personal and not
influenced by policy, but were included to hold them constant in analysis. Should
these variables be significant, it would be difficult to address them directly. Gender
was calculated with a positive correlation signifying higher female voter rationality,
and a negative correlation signifying higher male voter rationality. Race was
Brisson 5
calculated as a positive correlation signifying non-whites voting more rationally,
and a negative correlation signifying whites voting more rationally.
Behavioral Factors
These factors were seen as factors in control of the individual. Should these
factors prove most significant, this would indicate that voters themselves have the
capacity to improve their own voter rationality through a change in behavior. These
factors were political awareness, political engagement, and news attentiveness.
Political awareness was calculated using responses to questions asking
respondents to identify four political officials by position held. For each official the
respondents were able to correctly identify, they were given a point, resulting in a
four-point scale for political awareness. Respondents needed to respond to all
questions for their index to be valid.
Political engagement used nine questions regarding participation in political
activities, such as protests or political discussions, and granted a point for each. As
long as valid answers were provided for at least five of the questions, their
information was considered valid. The total affirmative responses was divided by
the total valid responses to ensure that those that simply answered more questions
did not have their results inflated.
News attentiveness used 14 questions regarding the use of news sources.
Some questions were frequency based, and those that were not had affirmative
responses multiplied by five to increase their weight in the index. Respondents
needed to respond to all questions for their index to be valid.
Brisson 6
Ideological Factors
Three ideological factors were chosen to explore the effect of personal beliefs
and opinions on one’s ability to vote rationally. The three variables chosen were
position on a left-right ideological scale, extremism on a left-right ideological scale,
and the value placed in political issues.
Position on a left-right ideological scale could indicate whether those in the
opposing party of that in power are willing to make more compromises in their
voting behavior than others. It also could indicate which party has a clearer
platform that allows its partisans to make fewer sacrifices in voting. In this analysis,
respondents identified themselves on an 11-point scale from left to right in the
National Election Study data.
Extremism on a left-right ideological scale would demonstrate whether
extremists found it easier to choose a candidate nearer to all their values than non-
extremists. For example, a candidate more conservative on all issues than both the
Democratic and Republican candidates should easily be able to settle on the
Republican candidate. This information was calculated finding the distance from
the moderate 5 in the aforementioned 11-point scale.
The “Political Values” index was calculated by adding up the answers to nine
questions on nine different issues about their importance. Each question was on a
five point scale, and the total was added up so those with a higher index found the
most issues most important and those with a lower index found the least issues

Brisson 7
most important. This could show that those who find political issues most
important perhaps put the most time into making a rational decision.
In the results, it was demonstrated that ideological factors were most
significant, particularly the “Extremism” index, with a significance of below .05%.
Also significant were the “Political Values” index and, to a lesser degree, the left-
right scale.
The behavioral factors were close to significant, particularly the “News
Attentiveness” and “Political Awareness” indexes. The biographical factors,
however, were not at all significant.
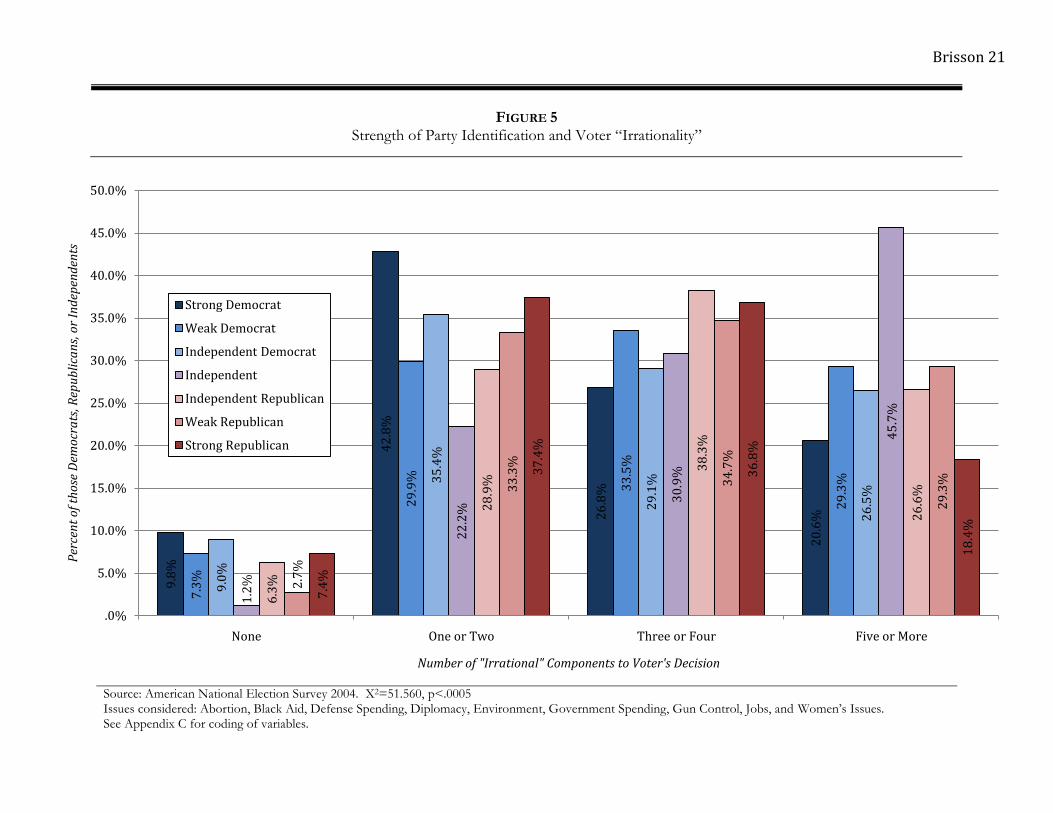
To explore the role of ideology further, the relationship between the number
of rational choices sacrificed was examined separating respondents by party
identification, which is seen in Figure 3. The results are significant with a X2 of
51.56 and a significance level of below .05%. Note the “U-shape” in the data for
those making no irrational choices as well as for those making one or two irrational
choices. Compare this with the mountain-shape found for those making five or
more irrational choices.
Issue-based rational and irrational voting was also explored further in Table
3, as the factors applied to the overall index were then applied to find how they
affected voter rationality in specific cases. Changes were made with the “ideological

Brisson 8
factors” category, using three new variables: Party Identification, Strength of Party
Identification, and Issue Priority.
Party Identification was calculated using a seven-point scale that
respondents used to identify themselves, lower numbers being more liberal and
higher numbers being more conservative. This is significant in determining
whether some parties were better at ensuring cohesion on certain issues or not.
Strength of Party Identification demonstrates whether extremists have an easier
time voting, as we saw in the earlier regression.
Issue Priority used responses placing individual issues on a five-point scale,
and then calculating the difference from the mean importance of all responses from
a given respondent. This was to ensure that those simply found everything
important were put in balance. The prediction would be that we would see this
highly correlated, as voters sacrifice on issues they find relatively less important
while voting in accordance with the policy preferences they find most important.
DISCUSSION
In Table 5, we see a key role being played by ideology, more so by the
extremeness of a subject’s political opinions than by the side of the political
spectrum with which they associate themselves. This relationship is clearly
demonstrated in Figure 5, as most independents make sacrifices on more than half
of the issues in question. The transformation in shape from the “valley” to the “hill”
is a clear visual representation of the role of partisan extremeness in the crafting of
rational voting behavior. This is likely not because those who are extremely
Brisson 9
partisan are more intelligent and rational, but rather simply because moderate
voters have to make more compromises than their heavily partisan counterparts.
Figure 5 also hints at the slight improvement in rationality that one finds as
they move from the right to the left, which we see demonstrated in Table 5. This
could be a result of the Democratic party having a more unified party and a more
consistent platform than the Republican party, or it could also be a result of Kerry
being a new candidate compared to Bush, so left-leaning voters spent more time
actually processing their voting decision than did those who voted for Bush.
It is also worth noting that there were weak correlations within the OLS
model with political knowledge and news attentiveness, which are rather optimistic.
As opposed to the influence of ideology, which unfairly discriminates against those
whose policy views do not fit in line with the arbitrary agendas of current parties in
the American political system, the influence of behaviors is inherently democratic
and empowering. It suggests that individuals can simply brush up on current events
and become more effective voters.
Issue-Specific Voting Behavior Influences
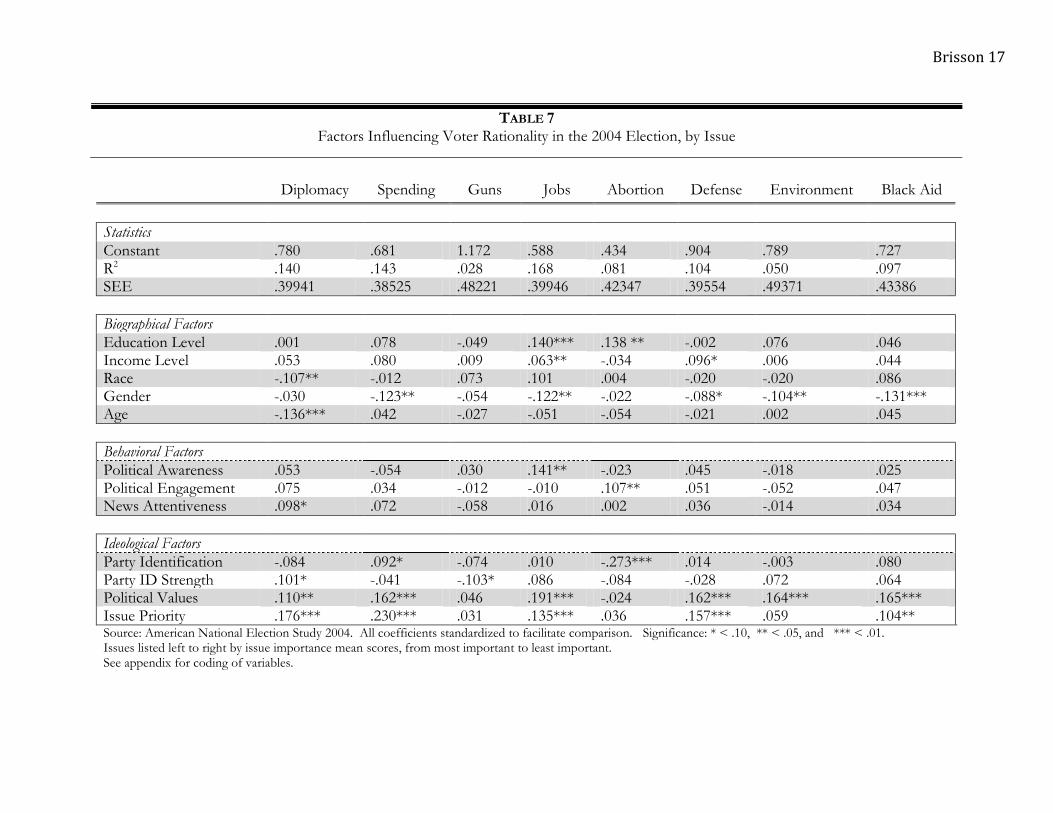
Table 7 reveals some interesting observations regarding the presence
“irrational” voting behavior, primarily the consistent influence of issue priority,
political values, and gender. Issue priority and political values seem to be the
strongest influences, which seems to suggest that “irrational” voting is in fact quite
deliberate. Gender, however, is peculiar; women significantly underperform men in
terms of voter rationality with regard to every issue except particularly female-

Brisson 10
salient issues such as abortion, women’s issues, and gun control. This is perhaps as
a result of cognitive differences in how decisions are made by men and women.
Education is also found to significantly correlate with whether or not voters
vote “rationally” with regard to the government provision of jobs and abortion.
Those with more years of education make decisions that are more consistent with
these beliefs, which can be problematic since there is such a wide disparity of
education in the United States and there are many areas with weak education
programs. This means that our society puts some members in a better position to
represent their own interests through the provision of more education, which seems
to be inherently undemocratic.
Income level holds some influence, and this problematic for many of the
same reasons. Family income level is found to correlate with a voters’ voting
consistently with their jobs and defense preferences, with those with higher family
incomes voting more consistently with their policy preferences. This may be
because they have access to more resources and can therefore feel more confident
with regard to their decisions.
Race and age also pop up as an influence to voter effectiveness with regard to
diplomacy, with non-whites voting less “rationally” than whites and older people
voting less “rationally” than young people. These variables, along with education
level and income level, are concerning because they are not factors that can be easily
changed, and some of them cannot be really changed at all. It is fundamentally
unfair for certain populations to be less able to represent their interests rationally in

Brisson 11
elections than others, and to correct for these problems it would be necessary to
provide more public resources, particularly education and income redistribution.
The behavioral factors hypothesis had only weak results; political awareness
and political engagement demonstrated relationships in the jobs and abortion issue
areas, respectively. It is always desirable for these factors to have a strong
influence, as they are easy characteristics to develop, but no such strong and
consistent relationship seems to exist.
Party identification is particularly strong in influencing subjects’ votes with
regard to abortion. Liberals, according to my regression, were more likely to vote
consistently with their policy preferences, even with issue priority held constant.
This could be due to Democrats, at this time, being out of power therefore willing to
compromise.
Guns, Abortion, and the Environment
The model for voter rationality prediction explains some variables better
than others, with R2’s ranging from .168 for jobs to .028 for gun control. The
models, though far from perfect, do provide insight into the role played by policy
preference and ideology as key determinants of a voter’s ability to vote rationally.
Three variables were found to not have significant correlation with “Political
Values” and “Issue Priority”: guns, abortion, and the environment. If more
information were available with regard to the amount of coverage these issues had

Brisson 12
in the elections, I correlate that with these results, imagining the result to be that
these issues were not heavily covered by the candidates or the media, and in turn
voters had difficulty making rational decisions when faced with them.
Do Rational Decisions Produce Ideal Outcomes?
It is also worth noting that all this data focuses on the idea of rational
decision, but not necessarily on rational outcomes. A second study examining what
factors affect what factors impact perceived positions of candidates would perhaps
reveal correlations that seemed less significant in this model.
Issue importance, though, seems to be the key factor in impacting which
issues voters decide act rationally, although for them to be able to do so they must
be provided with accurate and reliable information about the candidates that are
campaigning.
CONCLUSION
In contrast to the idea that voters behave irrationally, my model -- finding
“Political Values” and “Issue Priority” as most significant indicators of issue-based
rationality –suggests the opposite: (1.) voters who are value politics generally make
more rational decisions, and (2.) voters vote strategically, sacrificing on issues that
are not as important to gain on those that are of higher relative value.
Understanding that voters who find political issues more important make
more rational decisions suggests that we should do what we can to allow citizens
appreciate the importance of political policy in shaping their lives. I would like to

Brisson 13
conduct further research examining what social factors shape “Political Values,” and
then making policy proposals that reflect the findings of that research.
The second point, that voters sacrifice strategically, exposes a flaw in our
voting system. Since many voters have to compromise to choose a candidate, those
whose personal policy preferences arbitrarily do not reflect that of a given party are
forced to sacrifice more often than those who do not as is shown in Figure 3.
Exploring ways to better include all perspectives and reduce sacrifices would be a
prudent discussion in light of these results.
Finally, reflecting on the irrationality found in guns, abortions, and the
environment, campaigns should provide more clear information on all issues that
matter to voters. This would hopefully reduce the amount of “irrational” voting
behavior, and provide a more effective and more inclusive democracy.

APPENDIX A: TABLES
TABLE 1 Irrational Voting Behavior in the 2000 and 2004 Presidential Elections
Issue
Percent Voting “Irrationally” Democratic Candidate Republican Candidate
2000 2004 2000 2004
Abortion 40.2% 36.2% 40.6% 47.3% Black Aid 43.1% 35.1% 31.3% 37.1% Defense Spending 41.5% 29.7% 38.1% 27.8% Diplomacy - 35.1% - 43.7% Environment 41.0% 54.3% 37.4% 58.9% Government Spending - 28.9% - 30.5% Gun Control 28.5% 39.4% 30.2% 41.7% Job Creation 40.3% 26.3% 24.5% 31.0% Women’s Rights - 21.0% - 39.3% Sources: ANES 2000, ANES 2004
TABLE 2 Issue Importance and Voter Irrationality
Issue Importance Statistical Significance Issue High Medium Low Chi2 Significance
Abortion
……in 2000 38.1% 43.9% 41.0% 3.097 .213
……in 2004*** 30.1% 39.4% 40.4% 9.430 .009
Black Aid
……in 2004*** 28.2% 35.9% 50.9% 33.495 .000
Defense Spending
……in 2004*** 17.8% 40.8% 60.2% 108.156 .000
Diplomacy
……in 2004*** 32.6% 50.8% 75.0% 59.286 .000
Environment
……in 2004*** 50.1% 61.3% 69.4% 20.818 .000
Government Spending
……in 2004*** 21.4% 40.6% 53.2% 62.382 .000
Gun Control
……in 2000* 27.2% 31.2% 27.2% 4.717 .095
……in 2004 39.8% 39.7% 46.6% 1.570 .461
Job Creation
……in 2004*** 22.8% 33.4% 54.7% 40.293 .000
Women’s Rights
……in 2004** 28.1% 31.8% 40.8% 7.198 .027 Sources: ANES 2000, ANES 2004 Significance: * < .10 ** < .05, and *** < .01. Issue Importance collapsed from five-option scale; “Extremely Important” and “Very Important” become “High”, “Somewhat Important” becomes “Medium”, and “Not Too Important” and “Not at All Important” become “Low”. 2000 statistics omitted due to absence of data.
Brisson 15
TABLE 3 Issue Importance and Voter Irrationality in 2004, by Vote
KERRY VOTERS
BUSH VOTERS
Issue
Mean Importance*
Percent Voting “Irrationally”
Issue Mean
Importance* Percent Voting “Irrationally”
Black Aid 2.49 35.1%
Black Aid 2.32 37.1%
Defense 2.64 29.7%
Environment 2.50 58.9%
Environment 2.78 54.3%
Gun Control 2.68 41.7%
Abortion 2.84 36.2%
Women's Rights 2.77 39.3%
Jobs 2.88 26.3%
Jobs 2.79 31.0%
Gov't Spending 2.95 28.9%
Gov't Spending 2.79 30.5%
Gun Control 2.96 39.4%
Abortion 2.89 47.3%
Diplomacy 3.13 35.1%
Defense 2.98 27.8%
Women's Rights 3.17 21.0%
Diplomacy 3.09 43.7%
Source: American National Election Study 2004. *Mean scores on 5-point scale, ranging from 1 (“Not at all important”) to 5 (“Extremely important”). See Appendix C for coding of variables.
TABLE 4 Variable Descriptives
Issue N Min. Max. Mean Std. Dev.
“Voter IQ” 707 19.51 100.00 74.14 14.118 Education 1210 1.00 17.00 13.69 2.403 Race 1153 0.00 1.00 .25 .435 Income 1070 1.00 23.00 14.94 6.001 Gender 1212 1.00 2.00 1.53 .499 Political Awareness 1055 0.00 4.00 1.93 1.146 Political Engagement 1066 0.00 1.00 .27 .213 News Attentiveness 710 0.00 70.00 36.97 17.175 Left-Right Scale 917 0.00 10.00 5.83 2.328 Extremism 917 0.00 5.00 1.87 1.616 Political Values 1206 .16 .80 .55 .113
Source: American National Election Study 2004. See Appendix C for full coding of variables.

Brisson 16
TABLE 5 Factors Influencing Overall Voter Rationality (“Voter IQ”) in the 2004 Elections
B Std. Dev Sig
Constant 75.484 7.269 .000
Biographical Factors
Education Level .197 .361 .585 Income Level .042 .147 .774 Race -1.802 1.841 .329 Gender .262 1.523 .864
Behavioral Factors
Political Awareness* -1.376 .816 .093 Political Engagement -4.320 3.488 .216 News Attentiveness* .139 .072 .056
Ideological Factors
Left-Right Scale** -.758 .320 .019 Extremism*** 1.900 .512 .000 Political Values 11.199 7.001 .111 Source: ANES 2004 (R2=.082, SEE=12.819) Significance: * < .10, ** < .05, and *** < .01.
TABLE 6 Correlations Among Rational and “Irrational” Voting Behaviors in 2004
Abortion Black Aid
Defense Diplomacy Environment Gun
Control Gov't
Spending Jobs
Women's Issues
Abortion 1 .103** .133** .331** .040 -.005 .115** .086** .196**
Black Aid .103** 1 .232** .148** .171** .187** .277** .326** .278**
Defense .133** .232** 1 .292** .132** .051 .276** .218** .196**
Diplomacy .331** .148** .292** 1 .088** .027 .168** .109** .153**
Environment .040 .171** .132** .088** 1 .097** .144** .167** .175**
Gun Control -.005 .187** .051 .027 .097** 1 .083** .118** .189**
Gov't Spending .115** .277** .276** .168** .144** .083** 1 .304** .264**
Jobs .086** .326** .218** .109** .167** .118** .304** 1 .246**
Women’s Issues .196** .278** .196** .153** .175** .189** .264** .246** 1
Source: American National Election Study 2004. Significance: * < .05, and ** < .01. See Appendix C for full coding of variables.
Brisson 17
TABLE 7 Factors Influencing Voter Rationality in the 2004 Election, by Issue
Diplomacy Spending Guns Jobs Abortion Defense Environment Black Aid
Statistics
Constant .780 .681 1.172 .588 .434 .904 .789 .727 R2 .140 .143 .028 .168 .081 .104 .050 .097 SEE .39941 .38525 .48221 .39946 .42347 .39554 .49371 .43386
Biographical Factors
Education Level .001 .078 -.049 .140*** .138 ** -.002 .076 .046 Income Level .053 .080 .009 .063** -.034 .096* .006 .044 Race -.107** -.012 .073 .101 .004 -.020 -.020 .086 Gender -.030 -.123** -.054 -.122** -.022 -.088* -.104** -.131*** Age -.136*** .042 -.027 -.051 -.054 -.021 .002 .045
Behavioral Factors
Political Awareness .053 -.054 .030 .141** -.023 .045 -.018 .025 Political Engagement .075 .034 -.012 -.010 .107** .051 -.052 .047 News Attentiveness .098* .072 -.058 .016 .002 .036 -.014 .034
Ideological Factors
Party Identification -.084 .092* -.074 .010 -.273*** .014 -.003 .080 Party ID Strength .101* -.041 -.103* .086 -.084 -.028 .072 .064 Political Values .110** .162*** .046 .191*** -.024 .162*** .164*** .165*** Issue Priority .176*** .230*** .031 .135*** .036 .157*** .059 .104** Source: American National Election Study 2004. All coefficients standardized to facilitate comparison. Significance: * < .10, ** < .05, and *** < .01. Issues listed left to right by issue importance mean scores, from most important to least important. See appendix for coding of variables.

Brisson 18
FIGURE 1 Voter Rationality in the 2004 Presidential Election, by Issue
Source: American National Election Study 2004. Issues listed left to right by issue importance mean scores, from most important to least important. See Appendix C for coding of variables.
64
.9% 7
9.0
%
71
.1%
60
.6% 7
3.7
%
63
.8%
70
.3%
45
.7%
64
.9%
56
.3%
60
.7% 69
.5%
58
.3% 6
9.0
%
52
.7%
72
.2%
41
.1%
62
.9%
0.0%
10.0%
20.0%
30.0%
40.0%
50.0%
60.0%
70.0%
80.0%
90.0%
Per
cen
tag
e V
oti
ng
Co
nsi
sten
t w
ith
Ow
n P
osi
tio
n
Kerry Bush Linear (Kerry) Linear (Bush)

Brisson 19
FIGURE 2 Voters Voting “Rationally” in the 2000 and 2004 Elections, by Issue
Source: American National Election Study 2004. Issues listed left to right in alphabetical order. See Appendix C for coding of variables.
59
.8%
56
.9%
58
.5%
59
.0%
71
.5%
59
.7%
59
.4% 6
8.7
%
61
.9%
62
.6% 69
.8%
75
.5%
63
.8%
64
.9%
70
.3%
45
.7%
60
.6%
73
.7%
52
.7% 6
2.9
% 72
.2%
41
.1%
58
.3%
69
.0%
0.0%
10.0%
20.0%
30.0%
40.0%
50.0%
60.0%
70.0%
80.0%
Abortion Black Aid Defense Environment Gun Control Jobs
Gore (2000) Bush (2000) Kerry (2004) Bush (2004)

Brisson 20
FIGURE 3 “Irrational” Voting Behavior and Mean Issue Importance in 2004
Source: American National Election Study 2004. Values available in Table 3: Issue Importance and Voter Rationality, by Vote. See Appendix C for coding of variables.
FIGURE 4 “Voter IQ” Index Score Distribution
Source: American National Election Study 2004. More on “Vote IQ” in Table 4: Variable Descriptives. See Appendix C for coding of variables.
20.0%
25.0%
30.0%
35.0%
40.0%
45.0%
50.0%
55.0%
60.0%
2.20 2.40 2.60 2.80 3.00 3.20 3.40
Per
cen
t V
oti
ng
"Irr
atio
nal
ly"
Mean Importance Rating
Series1
Series2
Linear (Series1)
Linear (Series2)
Bush Voters Kerry Voters Linear (Bush) Linear (Kerry)
More Important Less Important
“Voter IQ” Index Score
Sco
re F
req
uen
cy
Brisson 21
FIGURE 5
Strength of Party Identification and Voter “Irrationality”
Source: American National Election Survey 2004. X2=51.560, p<.0005 Issues considered: Abortion, Black Aid, Defense Spending, Diplomacy, Environment, Government Spending, Gun Control, Jobs, and Women’s Issues. See Appendix C for coding of variables.
9.8
%
42
.8%
26
.8%
20
.6%
7.3
%
29
.9%
33
.5%
29
.3%
9.0
%
35
.4%
29
.1%
26
.5%
1.2
%
22
.2%
30
.9%
45
.7%
6.3
%
28
.9%
38
.3%
26
.6%
2.7
%
33
.3%
34
.7%
29
.3%
7.4
%
37
.4%
36
.8%
18
.4%
.0%
5.0%
10.0%
15.0%
20.0%
25.0%
30.0%
35.0%
40.0%
45.0%
50.0%
None One or Two Three or Four Five or More
Per
cen
t o
f th
ose
Dem
ocr
ats
, Rep
ub
lica
ns,
or
Ind
epen
den
ts
Number of "Irrational" Components to Voter's Decision
Strong Democrat
Weak Democrat
Independent Democrat
Independent Democrat
Independent Republican
Weak Republican
Strong Republican

Brisson 22
APPENDIX C: VARIABLE CODING AND SYNTAX
Issue Rationality Heuristic
This is determined by comparing a voter’s self-placement on an issue with their
placement of the two candidates. If they vote for the candidate whose position is closer to
their own, then they receive a “1” for voting “rationally”; if not, they receive a “0” for voting
“irrationally”. In case of a tie, the vote is considered rational and they receive a “1”.
This is calculated for the following issues: Abortion, Black Aid, Defense Spending,
Diplomacy, Environment, Government Spending, Gun Control, Jobs, and Women’s Issues.
Issue Importance Ranking
Each ANES respondent was asked to state their perceived importance of the
following issues: Abortion, Black Aid, Defense Spending, Diplomacy, Environment,
Government Spending, Gun Control, Jobs, and Women’s Issues.
Importance was coded as follows:
1. Not at all important
2. Not too important
3. Somewhat important
4. Very important
5. Extremely important
Voter IQ
The variable used to describe overall voter rationality combines the two was a
variable I call “Voter IQ,” which uses the following equation to calculate an index for each
respondent:
Brisson 23
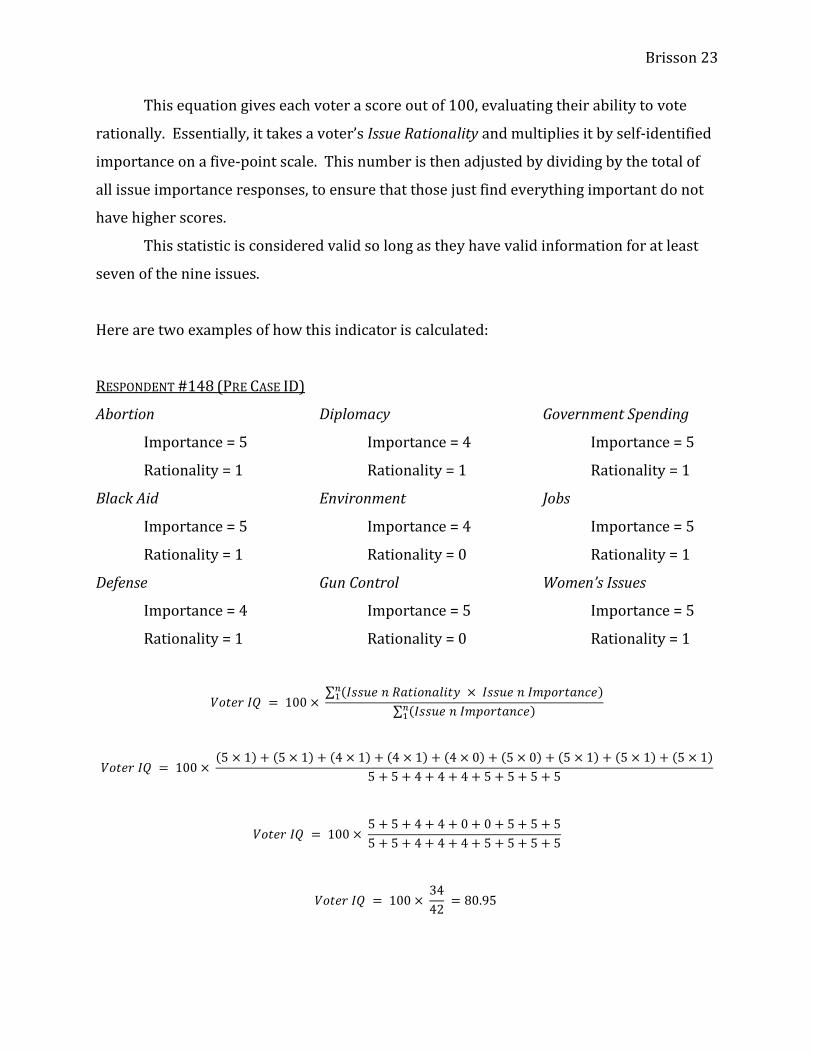
This equation gives each voter a score out of 100, evaluating their ability to vote
rationally. Essentially, it takes a voter’s Issue Rationality and multiplies it by self-identified
importance on a five-point scale. This number is then adjusted by dividing by the total of
all issue importance responses, to ensure that those just find everything important do not
have higher scores.
This statistic is considered valid so long as they have valid information for at least
seven of the nine issues.
Here are two examples of how this indicator is calculated:
RESPONDENT #148 (PRE CASE ID)
Abortion
Importance = 5
Rationality = 1
Black Aid
Importance = 5
Rationality = 1
Defense
Importance = 4
Rationality = 1
Diplomacy
Importance = 4
Rationality = 1
Environment
Importance = 4
Rationality = 0
Gun Control
Importance = 5
Rationality = 0
Government Spending
Importance = 5
Rationality = 1
Jobs
Importance = 5
Rationality = 1
Women’s Issues
Importance = 5
Rationality = 1

Brisson 24
RESPONDENT #172 (PRE CASE ID)
Abortion
Importance = 4
Rationality = 1
Black Aid
Importance = 4
Rationality = 1
Defense
Importance = 4
Rationality = 1
Diplomacy
Importance = 4
Rationality = 1
Environment
Importance = 4
Rationality = 1
Gun Control
Importance = 4
Rationality = 1
Government Spending
Importance = 4
Rationality = 1
Jobs
Importance = 3
Rationality = 1
Women’s Issues
Importance = 4
Rationality = 0
As can be seen, with just a score of rationality-importance products, Respondent
#148 receives a higher index (34 points compared to #172’s 31 points) simply because he
identified all issues as more important, granting mostly 5’s while Respondent #172 granted
mostly 4’s. By dividing the sum of the rationality-importance products by the sum of
importance ratings, this index is adjusted so that it will not fluctuate if the respondent
simply has a tendency to allocate more importance to all issues. As shown, Respondent
#172 then receives a score of 88.57 while Respondent #148 receives a score of 80.95.
It is also important to divide by the sum of importance ratings so that when not all
nine issues are incorporated into the index, the index will not be artificially lowered.
Brisson 25
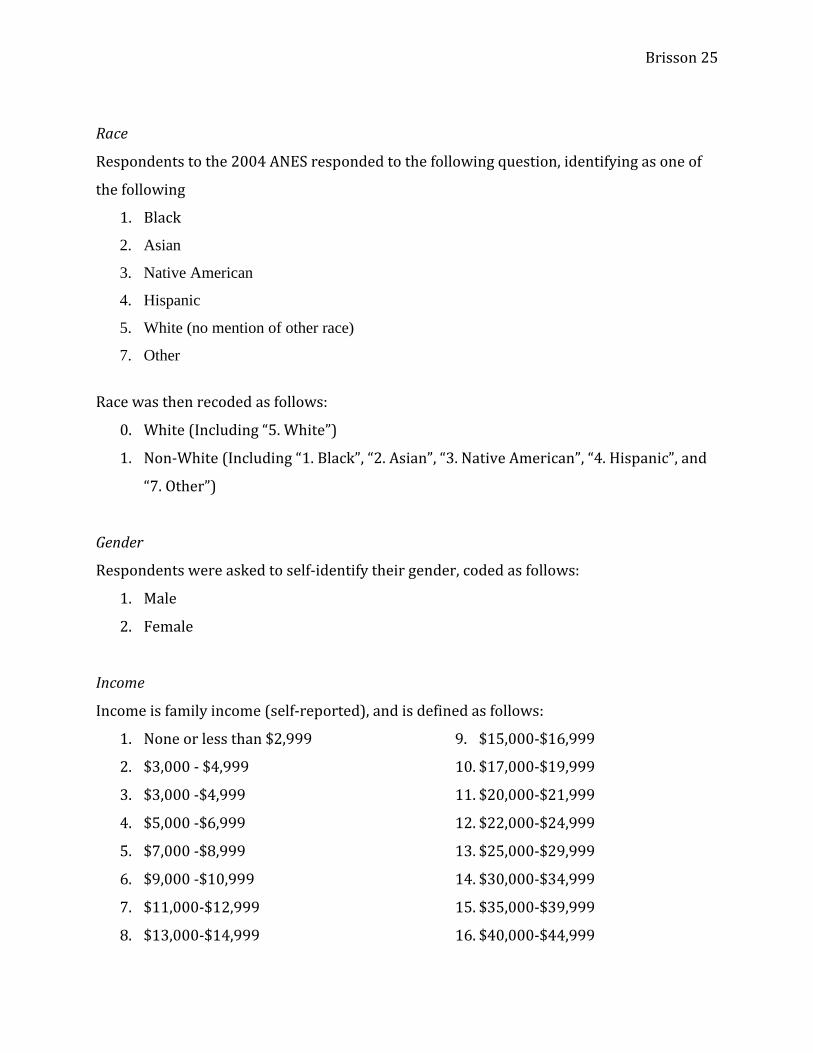
Race
Respondents to the 2004 ANES responded to the following question, identifying as one of
the following
1. Black
2. Asian
3. Native American
4. Hispanic
5. White (no mention of other race)
7. Other
Race was then recoded as follows:
0. White (Including “5. White”)
1. Non-White (Including “1. Black”, “2. Asian”, “3. Native American”, “4. Hispanic”, and
“7. Other”)
Gender
Respondents were asked to self-identify their gender, coded as follows:
1. Male
2. Female
Income
Income is family income (self-reported), and is defined as follows:
1. None or less than $2,999
2. $3,000 - $4,999
3. $3,000 -$4,999
4. $5,000 -$6,999
5. $7,000 -$8,999
6. $9,000 -$10,999
7. $11,000-$12,999
8. $13,000-$14,999
9. $15,000-$16,999
10. $17,000-$19,999
11. $20,000-$21,999
12. $22,000-$24,999
13. $25,000-$29,999
14. $30,000-$34,999
15. $35,000-$39,999
16. $40,000-$44,999

Brisson 26
17. $45,000-$49,999
18. $50,000-$59,999
19. $60,000-$69,999
20. $70,000-$79,999
21. $80,000-$89,999
22. $90,000-$104,999
23. $105,000-$119,000
24. $120,000 and over
Age
Age is provided in years (self-reported).
Education
Education is provided in years of education (self-reported).
Political Awareness
Respondents were asked to identify the following by position:
1. Chief Justice of Supreme Court
2. Prime Minister of England
3. Vice President of United States
4. Speaker of the House
Each correct response was given one point. Incorrect responses or “Don’t Know” were
given no points. Results were only considered if valid answers were provided for all four
questions.
Political Engagement
Respondents were given one point for each of the following behaviors:
1. Attending Committee Meeting About an Issue
2. Worked in a Committee to Solve a Problem
3. Contacted a Public Official to Express Views
4. Attended a Protest
5. Attended a Campaign Rally
6. Displayed a Candidates Sign or Button
7. Discussed Politics

Brisson 27
Each correct response was given one point. Incorrect responses or “Don’t Know” were
given no points. Results only considered if valid answers provided for at least five
questions.
Left-Right Scale
Respondent identified themselves on an 11-point scale ranging from left (0) to right (11).
Extremism
Distance from 5 (moderate position) on aforementioned 11-point scale.
Political Values
Sum of importance rankings on all available issues divided by the number of importance
rankings given (given that at least 7 responses are provided). Higher responses find more
importance. In short, the mean of all issue importance rankings given from a respondent.
Issue Priority
Importance Score adjusted against Mean Importance Score to determine deviation

Brisson 28
APPENDIX D: WORKS CITED
The National Election Studies (www.umich.edu/~nes). 2001. THE 2000 NATIONAL ELECTION
STUDY [dataset]. Ann Arbor, MI: University of Michigan, Center for Political Studies.
The National Election Studies (www.umich.edu/~nes). 2005. THE 2004 NATIONAL ELECTION
STUDY [dataset]. Ann Arbor, MI: University of Michigan, Center for Political Studies.