rating agency presentation - county of san diego - state of california
TRANSCRIPT

COUNTY OF SAN DIEGO
RATING AGENCY PRESENTATIONSEPTEMBER 2009

1
County of San Diego PresentersDonald F. Steuer, Chief Financial OfficerDan McAllister, Treasurer-Tax CollectorDave Butler, Assessor/Recorder/County ClerkJoan Pan, Debt Finance Manager
Additional County ResourcesTracy Sandoval, Auditor and Controller/Assistant Chief Financial OfficerLisa Marie Harris, Chief Deputy TreasurerJeff Olson, Division Chief, Assessment ServicesManuel Serrano, Chief Deputy, Property ValuationJanel Pehau, Director, Office of Financial PlanningEbony Shelton, Group Finance Director, Finance and General GovernmentRob Castetter, Chief Investment OfficerMichelle Durgy, Investment Officer
Financing TeamMark Young, Gardner, Underwood & Bacon LLCCeleste Davis, RBC Capital Markets
Introductions ‐
Participants

2
Section
Overview 1
Economic Overview 2
Real Estate Market Update 3
Credit Highlights 4
County Finances 5
County Retirement System 6
County Investment Pool 7
2009 COPs (Justice Facilities Refunding) & County Debt Profile 8
Closing Remarks 9
Table of Contents

OVERVIEW

4
Executive Summary
Economic highlights:Regional economic indicators up four months in a rowBottom of regional economy expected in first half of 2010$1.77 billion of federal stimulus monies coming to the region
Real estate market:Median home prices are up 6% since 2008Aggressive processing of reassessments2009 construction activity has decreased for both residential and commercial properties
Financial strength and flexibility:Maintenance of high fund balances and strong reserve balancesBoard continues policy of not backfilling state revenuesLow debt ratios - $100 million prepayment of POBsOngoing revenue dedicated to capital projects
Overview of Refunding:Current refunding of 1997 Central Jail COPs and 1998 Downtown Courthouse COPs$6.4 million net p.v. savings and $830,000 in annual cashflow savings

ECONOMIC OVERVIEW

6
Economic Highlights
The estimated total population of San Diego County as of January 1, 2009 was 3,173,407. The County experienced a year-over-year gain of 1.3%, making it the second most populous county in the State. 1
Median household income is $63,300, $2,000 higher than the State median. 2
An estimated 14.7 million tourists visited San Diego County in 2008, resulting in a total economic impact of $7.5 billion. 3
Gross Metropolitan Product (GMP) of San Diego County was estimated to be $171.2 billion in 2008 and forecasted to grow to $176.2 billion in 2009. 4
Under the American Recovery and Reinvestment Act of 2009 (ARRA), the County will be receiving $196.3 million and could potentially receive an additional $27 million. 5
1 State of California, Department of Finance, May 20092 UCLA Anderson Forecast, May 2009 3 San Diego County Visitors and Convention Bureau, May 20094 National University System Institute for Policy Research, February 20095 County of San Diego, Office of Strategy and Intergovernmental Affairs. Data current as of September 9, 2009

7
Diverse Economy and Employment Base
4
6
8
10
12
14
16
Jan F eb M ar A p r M ay Jun Jul
C a lifo rnia Lo s A nge le s C o unty O ra nge C o unty R iv e rs ide C o unty S a n B e rna rdino C o unty S a n D ie go C o unty
At 10.3%, the County’s unemployment rate for July 2009 is the second lowest among Southern California counties and significantly lower than the State’s rate of 12.1%.
2009YTD
AverageJuly 2009
California 11.3% 12.1%
Riverside County 13.3% 14.7%
San Bernardino County 12.8% 13.9%
Los Angeles County 11.3% 12.5%
San Diego County 9.5% 10.3%
Orange County 8.6% 9.5%
Source: California Employment Development Department
Unemployment Rates in Southern California Counties(January 2009 – July 2009)

8
County’s Economy Continues to Improve
The University of San Diego Index of Leading Economic Indicators shows a slightly positive outlook for the region based on gains in the stock prices of local companies, local consumer confidence and the national economic outlook.Looking into 2010, local economist Alan Gin anticipates “a bottom in the regional economy in the first half of the year, led by consumer spending and more growth in real estate.”
Index of Leading Economic IndicatorsSan Diego County
January 2006 - July 2009
100
110
120
130
140
150
January-06 July-06 January-07 July-07 January-08 July-08 January-09 July-09
Source: Alan Gin, Burnham-Moores Center for Real Estate, University of San Diego

9
Categories of Stimulus Spending in San Diego County
Impact of Federal Stimulus Funds
Source: U.S. Dept. of Defense; U.S. Dept. of Health and Human Services; California Dept. of Education; SANDAG
Military $850.4 million
Education $281.1 million
Roads $243.3 million
Scientific Research $214.7 million
Transit $85.7 million
Employment $24.7 million
Health $21.7 million
Energy $19.7 million
Environment $13.4 million
Law Enforcement $7.0 million
Aviation $6.3 million
Community Development $5.2 million
Total $1.77 billion

10
County Receipt of Federal Stimulus Funds
Source: County of San Diego Office of Strategy and Intergovernmental Affairs
Funds# ARRA
programs# Projects (initial
estimate)
Confirmed Awards $148,557,848 13 21Pending Formula Distributions 4 30
Total Known Awards 17 51
Competitive Funds Seeking 10 20TOTAL 27 71
(As of September 9, 2009)
County ARRA Funding HighlightsHealth and Human Services $168.1 million
Infrastructure and Technology $11.5 million
Energy and Environment $6.9 million
Public Safety $6.4 million
Housing and Communities $3.4 million
Total $196.3 million
$47,783,648
$196,341,496
$27,336,217$223,677,713
11
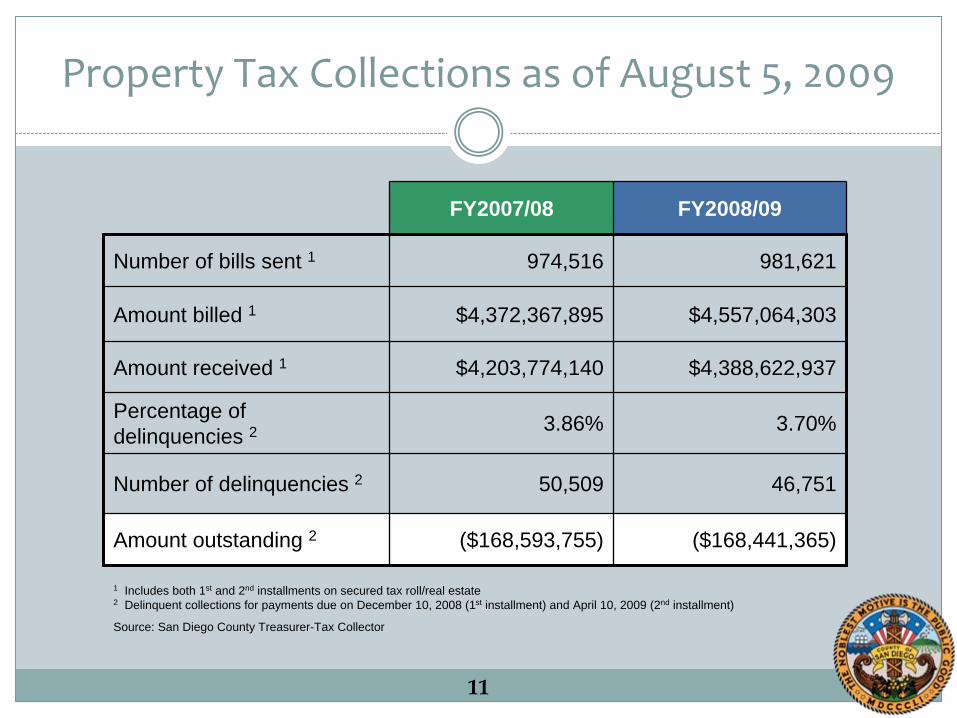
Property Tax Collections as of August 5, 2009
1 Includes both 1st and 2nd installments on secured tax roll/real estate2 Delinquent collections for payments due on December 10, 2008 (1st installment) and April 10, 2009 (2nd installment)
FY2007/08 FY2008/09
Number of bills sent 1 974,516 981,621
Amount billed 1 $4,372,367,895 $4,557,064,303
Amount received 1 $4,203,774,140 $4,388,622,937
Percentage of delinquencies 2 3.86% 3.70%
Number of delinquencies 2 50,509 46,751
Amount outstanding 2 ($168,593,755) ($168,441,365)
Source: San Diego County Treasurer-Tax Collector

REAL ESTATE MARKET UPDATE

13
Real Estate Market Review
and Update
In Spring 2009 the County processed 216,456 Prop. 8 reductions totaling $23.85 billion, representing 6% of the 2009-10 assessment roll.
County is currently processing the unworked 2008 assessment appeals (began year with 40,000 outstanding appeals).
2009 YTD residential change of ownership reassessments are averaging +$31,000 in increased AV per event. 2008 averaged +$16,000 per event. Residential sales activity is tracking close to 2008 levels.
2009 YTD new construction activity has decreased for both residential and commercial.
2009 YTD Trustees Deeds have decreased while Notices of Default have increased.
San Diego County residential real estate market is improving.
Source: County of San Diego Assessor / Recorder / County Clerk

14
Assessment Review Statistics
Source: County of San Diego Assessor / Recorder / County Clerk
2009 Prop. 8 Reductions
2009 new applications received (less duplicates): 32,000
2008 Prop. 8 rollovers for 2009: 79,100
2008 Assessment Appeals Board (AAB) Cases reviewed for 2009: 33,000
Proactive Reviews for 2009 (parcels w/o applications that sold between 2003 and 2008): 72,356
Total 2009 Reductions: 216,456
Total Taxable Parcels in the County: 978,011% of Total Parcels Reduced:
28.9%% of Residential Parcels Reduced:22.2%

15
Progress on 2008 Assessment Appeals
Began the 2009-10 year with 40,000 2008 Assessment Appeal cases still outstanding, including residential, commercial and business cases.County just mailed the first 10,000 residential stipulations. The reduction in 2008 AV from these stipulations (assuming 100% acceptance) is estimated at $1.38 billion.In the following weeks, County will be processing an additional 8,500 stipulations. The reduction in 2008 AV from these stipulations (assuming 50% acceptance) is estimated at $300 million.It is expected that by the end of calendar 2009 50% of the outstanding 2008 cases will have been resolved and 20,000 cases will still remain. Estimating an average reduction of $100,000 per residential parcel and a stipulation rate of 75%, the total reduction in 2008 AV is estimated to be $3.0 billion (residential only).There are approximately 2,600 commercial AAB cases for 2008.
Source: County of San Diego Assessor / Recorder / County Clerk

16
Residential and Commercial Activity
Total value added by all changes in ownership or new construction reassessments for 2009-10 was $5.3 billion, down from $20.2 billion in 2008-09.
While residential sales are tracking close to 2008 levels, commercial sales and all permit activities have decreased. Therefore, the total value added by change in ownership and new construction will likely be less than last year’s number.
Real Estate Parcel Activity
CalendarYear
Change in Ownership
New Construction
Change in Ownership
New Construction
2004 103,128 39,541 2,940 1,547
2005 93,529 38,302 3,015 1,602
2006 71,705 30,468 2,828 1,912
2007 60,312 24,384 2,994 2,335
2008 60,876 15,419 1,760 1,501
2009 YTD 34,937 11,306 1,052 773
09 Est. Total 59,000 12,500 1,300 1,200
Residential Commercial
Source: County of San Diego Assessor / Recorder / County Clerk

17
Notices of Default and Foreclosures
2008 by Month
January 3,299 1,461February 3,212 1,398March 3,284 1,161April 3,601 1,512May 3,422 1,762June 3,430 1,981July 3,206 2,285August 3,176 2,1972008 YTD 26,630 13,757
September 1,360 * 1,981October 1,269 * 1,293November 1,495 * 1,144December 3,191 1,351Annual Total 33,945 19,526
* Senate Bill 1137 passed in September requiring lenders to physically contact borrowers prior to filing a NOD. The backlog reduced NODs through November 2008.
Notices of Default Foreclosures
Source: County of San Diego Assessor / Recorder / County Clerk
January 3,055 1,325February 3,705 1,365March 4,260 844April 3,673 988May 3,292 1,007June 3,715 1,799July 3,543 1,607August 2,906 1,3582009 YTD 28,149 10,294
2009 by Month
Notices of Default Foreclosures

18
$161$179 $195
$214$233
$255$282
$319$358
$391$409 $400
0
50
100
150
200
250
300
350
400
450
FY1999 FY2000 FY2001 FY2002 FY2003 FY2004 FY2005 FY2006 FY2007 FY2008 FY2009 FY2010
Assessed Valuations
Property tax base has increased on average 8.7% annually since 1998-99.2009-10 AV declined by only -2.3%, despite double digit decreases in the housing market.Prop. 13 provides a stabilizing factor for AV growth:
Real property assessments are subject to a 2% maximum annual inflation adjustment unless there is a change in ownership, new construction, or a reduction. 65% of all properties received the inflation adjustment for 2009-2010. However, for 2010-2011 the CPI is currently tracking -0.7% through 8 months of the study period. If the CPI remains negative these properties may be subject to a CPI reduction.
AV 1999 – 2009 and % Change 2009 Distribution of Roll Values
Single Family 68.00%
Single Family 66%
Commercial/ Industrial
22%
Apartments (2 units and above)
9%
Agricultural, Institutional & Recreational
3%
10.6% 9.5%9.5% 8.7%
9.8%10.3%
13.3%12.1%
9.4% 4.6% (2.3%)
Source: County of San Diego Assessor / Recorder / County Clerk

19
Housing Prices
-8.90%
-12.10%
-19.80%
-28.80%
-39.10%
-45%
-40%
-35%
-30%
-25%
-20%
-15%
-10%
-5%
0%
Orange San Diego Los Angeles Riverside SanBernardino
Source: DataQuick
With the second lowest decline in year-over-year median home prices, San Diego’s residential market has held up better than neighboring counties. Median Home Prices are up 6% since 2008.
YOY Change in Median Home Prices (July 2008 - July 2009)
San Diego County Median Home Prices (1982 - 2009)
$0
$100,000
$200,000
$300,000
$400,000
$500,000
$600,000
$700,000
1982
1984
1986
1988
1990
1992
1994
1996
1998
2000
2002
2004
2006
2008

20
2003-2008318,083
35%
1998-2002190,096
21%
Pre-1998356,034
40%
200932,397
4%
AV Rolls have Cushion to Absorb Decreases
Approximately 35% of County properties last sold in the local real estate market’s peak years (2003-2008). Approximately 94% of these properties are single family residences or condos and were likely candidates for reduction. Of those, 72% have had their AV reduced for 2009-10.
The remaining 65% of properties are not likely candidates for a downward reassessment as their base assessment was established in 2009 or prior to 2003. If a property with a pre-2003 base was reassessed today, it would still reflect some appreciation since the time that the base value was established.
Historic AV Reassessments Base Year Value Established upon Last Change of Ownership
(Number of Parcels – As of August 31, 2009)
$80.3
$11.3
$82.5
$205.8
$80.3
$11.8
$175.3
$81.5
$0
$50
$100
$150
$200
$250
Pre-1998 1998-2002 2003-2008 2009
Indexed Base Value 2009 A.V. 2009 Sales Value
Indexed Base Year Value / 2009 AV($ in billions)
Source: County of San Diego Assessor / Recorder / County Clerk

21
Property Assessments ‐
To Date and Future
Change of ownership reassessments processed in 2009 YTD have netted an AV increase of $500 million. This represents only 17% of residential sales and 23% of commercial sales requiring reassessment for 2010-11.New construction reassessments processed in 2009 YTD have resulted in an AV increase of $187.8 million. This represents only 7% of residential and commercial permits requiring reassessment.Based on reassessments worked to date, total value added by all changes in ownership or new construction reassessments for 2010-11 is estimated at $5.1 billion. If the California CPI adjustment remains negative (currently -0.7%), the resulting decrease in 2010-11 is estimated at $2.1 billion. Reductions due to a decline in market value for 2010-11 will result in a projected AV decrease of $6 billion.Based on these factors, total AV growth for 2010-11 is estimated at -1.0%.The County believes the reductions made for 2009-10 captured most eligible residential properties and that the County is at or very near the bottom of the residential market. The commercial market has shown significant weakness in vacancies, sales activity and prices, and office and retail properties are expected to suffer declines in the next year.
Source: County of San Diego Assessor / Recorder / County Clerk

CREDIT HIGHLIGHTS

23
Credit Highlights
Disciplined financial management to weather current economic conditions and the State’s fiscal crisis.
County proactively manages its cost structure.
County is allocating ongoing General Purpose Revenue to support one-time capital needs.
County has low and manageable debt levels, and has a practice of prepaying debt.
County adheres to a fund balance and reserves policy that will ensure County’s fiscal health and stability.

24
Strong Financial Management Practices
County Budget is structurally balanced:Conservative budgeting consistently produces net operating surplusLong-term capital planning policy and five-year capital needs assessment program coincide with Five-year Financial ForecastOne-time revenues only used for one-time expenditures. Ongoing revenues are also used for one-time projectsGFOA Distinguished Budget Presentation Award
County has institutionalized financial management policies:Fund Balance and Reserves PolicyStrong investment pool management policyOversight of the County’s long-term obligations provided by the Debt Advisory Committee and institutionalized via the County’s Long-term Obligation, Refunding and Swap Policies
Comprehensive financial reporting and forecasting:Risk Overview Committee / Disclosure Controls and ProceduresTwo-year Operational Plan and five-year financial forecastQuarterly Variance Reports posted on County websiteState Controller’s Award for Achieving Excellence in Financial ReportingGFOA Certificate of Achievement for Excellence in Financial Reporting for both County and Investment Pool CAFR

COUNTY FINANCES

26
Total Reserved Fund Balance $272.9 30.4% $410.2 35.5% $273.2 22.4% $291.11 24.5%
Total Unreserved / Designated Fund Balance 190.5 21.2% 183.4 15.9% 375.9 30.8% 347.61 29.2%
Total Unreserved / Undesignated Fund Balance 435.5 48.4% 561.4 48.6% 571.4 46.8% 550.3 46.3%
Total General Fund Balance $898.9 $1,155.0 $1,220.5 $1,189.0
County Maintains Strong Fund Balances
The County spends one-time resources on one-time items, not ongoing operational needs, which bolsters fund balances.
1) Total Reserved Fund Balance includes the general reserve and reserves for loans, inventory, landfill maintenance and other purposes. Total Unreserved / Designated Fund Balance includes various designations for subsequent years’ expenditures, landfill post-closure expenditures, and for encumbrances.
FY 2005-06 FY 2006-07 FY 2007-08FY 2008-09Unaudited
Historic General Fund Balances
$ Millions % of FB $ Millions % of FB $ Millions % of FB $ Millions % of FB

27
Reserves and Resources
Projected Additional Reserves and Resources as of June 30, 2009 (in millions) Authority to Release Funds
Debt Service Reserves $31.5 Rating Agency, Insurer and Bondholder Consent; Four Votes
Workers' Compensation Reserve 92.1 Four Votes
Public Liability Reserve 27.0 Four Votes
Environmental Trust Fund Reserve 57.1 Existing Ordinance would need to be amended; Four Votes
Tobacco Securitization Special Revenue Endowment Fund 427.0 Existing Board Policy would need
to be amended; Four Votes
Total $634.7

28
FY 2009‐10 Operational Plan Highlights
Assumes General Purpose Revenue (GPR) decline of 6.3% and program revenue growth of 0.5%.No wage increase and a 5% flex benefit increase effective January 1, 2010:
Reflects labor agreements County has with all unions effective through June 16, 2011Cuts have been made across the organization in order to maintain structural balance, including reduction of 774 full time equivalent positions (FTEs), a 4.5% decrease.Reserve target levels are exceeded.Uses $336.6 million of fund balance for one-time projects, including $100 million that converts the unappropriated fund balance target amount in the reserve policy to a designation (net use is $236.6 million). Appropriates $75 million of ongoing GPR for the Women’s Detention Facility.Appropriates $100 million for early payment of outstanding 2008B Pension Obligation Bonds (POBs).Increases GPR (net cost) allocation to Public Safety by $1.5 million to help mitigate drop in Proposition 172 sales tax revenues and provide probation support; all other groups are seeing a real decrease in GPR allocation of 4 to 9%. Includes $26.3 million of stimulus funding which benefits the Community Services Group ($8.3 million) and the Health and Human Services Agency ($18.0 million).

29
County has Budgeted to Exceed Reserve Targets
(in millions) Target FY 09-10
General Reserve 5% $47.5 $55.5
Contingency Reserve 2% $19.0 $20.0Economic Uncertainty Designation 10% $95.1 $100.0
Reserve Targets and BalancesFY 2009-10 budgeted General Purpose Revenues (GPR): $950.7 million
Effective FY 2009-10, the 10% unappropriated Fund Balance has been replaced by a 10% GPR Economic Uncertainty Designation, specifically reserving money for challenging economic times.

30
FY 2009‐10 Adopted Budget – All Funds
Adopted budget for all funds of $5.01 Billion(decrease of 3.5% from prior FY)
Appropriations by Fund (in millions)
75.7%
8.4%
2.0%
0.5%
7.5%
3.7%
2.3%
General Fund $3,790.0
Special Revenue $422.0
Capital $99.7
Enterprise Funds $24.4
Internal Service Funds $374.7
Debt Service $183.5
Special District & Redevelopment $114.0

31
FY 2009‐10 Adopted General Fund Budget
Adopted budget of $3.79 Billion(increase of 3.0% from prior FY)
Revenues by Category (in millions)
24%
2%
9%
8%23%
24%
10%Property and Other Taxes $900.8Other Intergovernmental $81.7Fund Balance/Reserve Designation $343.7Use of Money & Property and Other $290.2Federal $876.1State Aid $936.0Charges for Services, Fees & Fines $361.5
Appropriations by Group/Agency (in millions)
29%
48%
5%
2%
7% 9%Public Safety $1,105.6
Health & Human Services $1,825.2
Land Use & Environment $184.8
Community Services $58.2
Finance & General Government $279.3
Finance Other $337.0

32
General Purpose Revenue $950.7 million
6.3% decrease from prior FY
52%
3%
12%
33%
Property Taxes $496.3Property Tax in Lieu of VLF $309.3Sales Tax & Real Property Transfer Tax $29.3Other $115.9
FY 2009‐10 General Fund Revenue Composition
General Fund Revenue $3,790 million
66%
25%
9%
Program Revenues $2,495.6Fund Balance/Designations $343.7General Purpose Revenues $950.7

33
Historical General Purpose Revenue Composition
* ‘Other Revenues’ is comprised of Teeter Property Tax, Interest Earnings, Redevelopment Agency Tax Increment, Fines, Forfeitures & Penalties, Prior YearTaxes and other miscellaneous revenues.
$0
$200
$400
$600
$800
$1,000
$1,200
2004-05 2005-06 2006-07 2007-08 2008-09 2009-10 (prop.)
Property Taxes VLF/Property Tax in Lieu of VLF Sales Tax & RPTT Other Revenues
$845.7$942.8 $989.9 $1,020.5
($ in
milli
ons) $731.7
$950.7
Totals may not add up due to rounding.
ActualsActuals Actuals Actuals Actuals Adopted (Unaudited) Adopted2004-05 2005-06 2006-07 2007-08 2008-09 2008-09 2009-10
Property Taxes 384.20 421.71 484.92 510.82 543.06 519.84 496.28VLF/Property Tax in Lieu of VLF 200.52 264.96 277.93 303.35 320.95 316.93 309.26Sales Tax & RPTT 55.25 54.21 47.94 41.28 42.50 34.76 29.29Other Revenues* 91.73 104.76 132.02 134.46 108.19 148.93 115.87
731.70 845.65 942.81 989.91 1,014.70 1,020.46 950.71

34
Impact of the State Budget
Areas of Impact or Potential Impact Mitigation Strategies
Suspension of Prop 1A (GF): $68 million Securitize payment or use reserves
Health and Human Services Programs (Child Welfare, Public Health, Aging Services): $8.3 million
Reduce County staffing levels and contracted services
Substance Abuse Treatment and Crime Prevention: $2.0 million Reduce County staffing levels
Multi-Family Housing Recycling Grant: $0.2 million Discontinue staff and contracted outreach/education services
Court Security Services: $1.5 million Reduce services to court and freeze positions
CalWORKS: $TBD Reduce County staffing levels and contracted services
Redevelopment Shift (GF): $0 to $5 million Conservative revenue estimates/trust fund balances
The Board is committed to not backfilling State Revenues.

35
Next Steps
Ongoing and Future Challenges:Property tax base Sales tax/vehicle license fees revenue shortfallsState structural budget issuesRetirement
Responses to these challenges.Sequence of strategies to develop balanced 5-year budget included in annual Five-Year Forecast:
Program cutsFuture compensation packagesReview of commitment to capital

COUNTY RETIREMENT SYSTEM

37
Pension Cost Management
SDCERA’s AAA rating and stable outlook reaffirmed in January 2009.County has prepaid $264 million of its taxable POBs over the past two years.County has contributed $91.8 million over and above its pension Annual Required Contribution (ARC) since FY 2004-05.Estimated total market value of assets:
June 30, 2009: $6.2 billion, a 26.4% loss from July 1, 2008July 31, 2009: $6.5 billion, a 5.1% gain from July 1, 2009
Fiscal Year
EmployerContributions UAAL Funded
Ratio2006 $ 243 $ 1,232 83.6%2007 258 832 89.72008 236 485 94.42009 (a) 234 902 90.32010 (a) 216 1,681 83.22011 (a) 258 2,516 76.52012 (a) 329 3,391 70.32013 (a) 407 4,154 66.02014 (a) 492 4,188 67.92015 (a) 572 4,150 70.2
(a) Projections based on a 27% loss for FY 2008-09 and the Assumed Rate of Return of 8.25% for the subsequent years
Historical and Projected Funding Status (millions)

38
SDCERA Investment Strategy
As of July 31, 2009, SDCERA replaced its Alpha Engine investment strategy with a large capital diversified equity strategy.The nine remaining hedge funds comprise 6.8% of the total market value of the portfolio.As of September 3, 2009, a contract has been finalized with Integrity Capital to provide portfolio strategy services for up to 39 months with two options for two-year extensions.
(1) As of July 31, 2009, this target portfolio allocation was split between small capitalization stocks which represented 1.7% of the target portfolio allocation, and large capitalization stocks, which represented 15.3% of the target portfolio allocation
Current Asset AllocationJuly 31, 2009
17%
18%
4%3%10%4%
5%5%
12%
4%
13%5%
U.S. Equity (1)Non-U.S. EquityEmerging Market DebtHigh Yield Fixed IncomeReal EstateCommoditiesInfrastructurePrivate EquityOpportunisticBridgewater All-WeatherU.S. BondsU.S. TIPS
39
Policy Objectives for Pension System
Ensure that the County Retirement System is appropriately funded.
Pay the full annual retirement contribution as calculated by the SDCERA Actuary.
Maintain strong, pro-active relationship with SDCERA.
Pay in full the Other Post Employment Benefits (OPEB) ARC as determined by the SDCERA Actuary.

COUNTY INVESTMENT POOL

41
Our Investment Team has over 60 years of combined investment experience, which has resulted in a sound investment philosophy to consistently meet the liquidity needs of Pool participants while effectively managing risk.
Pool Characteristics and Composition:Sustained track record of exceptional Pool management Pool’s holdings are of the highest credit quality and lowest volatility, with a healthy liquidity cushion
Pool confidence results in record high balance of $6.38 billion in April 2009.
Diversification of security types, issuers and Pool participants reduces the Pool’s potential for loss.
Superior pool management during volatile markets and credit crisis.
Investment Pool – Strength & Stability

42
The Pool has received the highest credit rating over the past ten consecutiveyears. Accordingly, the Pool is heavily invested in securities of the highest credit quality.
The Pool has a substantial liquidity cushion with 70% of the investments maturing within one year.
San Diego County Pooled Money Fund As of July 31, 2009
Source: San Diego County Treasurer-Tax Collector
57%29%
12%
1%1%
AAA AA+ AA A-1+ A-1
Maturity Distribution Credit Quality
31%
20%
14%
5% 6%8%
2%
14%
0%
10%
20%
30%
40%
30 days orless
90 days 6 months 1 year 2 year 3 year 4 year 5 year
Pool Characteristics and Composition

43
The Pool reached a record high balance of $6.385 billion in April due to increased revenues from taxes and new voluntary participants.
*2009 balance reflects highest balance reached between January 1, 2009 through April 30, 2009.
3,3383,663
4,3914,741 4,755 4,916
5,290
5,9976,385
-
$1,000
$2,000
$3,000
$4,000
$5,000
$6,000
$7,000
2001 2002 2003 2004 2005 2006 2007 2008 2009*
Millions Highest balances from 2001-2009*
Pool Confidence Results in 2009 Record High
Source: San Diego County Treasurer-Tax Collector

44
Breakdown of Participants
The Pool is diversified by security type, issuers and participants.
The Pool’s diversification reduces exposure to credit risk and impact of unexpected withdrawals.
San Diego County Pooled Money Fund As of July 31, 2009
Breakdown by Security Type
Diversification Lowers Pool’s Risk
Source: San Diego County Treasurer-Tax Collector
Schools 51.84%
County30.08%
Non County5.03%
Voluntary Depositors 3.11%
Community Colleges 9.94 %Commercial Paper
15%
Medium TermNotes – 1%
Repurchase Agreements – 5%
Bond Fund – 1%
Money Markets – 2%
Treasuries8%
Federal Agencies52%
Certificates of Deposit16%

45
Successful Management During Volatile Markets
Source: San Diego County Treasurer-Tax Collector
Halted purchasesof all types of asset-backed
commercial paper
Purchases of corporate securities
limited to maturities < 60 days
Commercial paper purchases limited to non-financial
firms when possible
Purchases of corporate securities
limited to 30-60 day maturities
Added money market fund with non-commercial paper holdings
Broadened numberof Govt.-focusedmoney market
funds
Upgraded monitoring of
local banks and CDmaturities limited
to 6 months
Explored and utilized Government
Liquidity and Guarantee Programs
Halted purchasesof sub-segment
asset-backed commercial paper
July 2007
March 2008
September 2008
Present January 2009
January 2008
June 2008
September 2007
November 2007
Continued use ofMoney Market
Guarantee Program
Shortened duration(weighted average maturity-WAM) of
Pooled Money Fund
Commercial Paper
Money Markets
Corporates and CDs
Other Strategy

2009 COPs (JUSTICE FACILITIES REFUNDING) & COUNTY DEBT PROFILE

47
Updates on County’s Debt Program
Prepayment of $100 million 2008B POBs on July 1, 2009:Reduced County’s annual debt service by $4.5 millionShortened final maturity of County’s POBs to FY 2026-27County has no outstanding variable-rate debt and no derivatives
Refunding 1997 Central Jail COPs and 1998 Downtown Courthouse COPs for annual cashflow savings:
Over $830,000* annual cashflow savings (reduced amount in final four years)Over $380,000 of annual savings related to 1997 COPsOver $450,000 of annual savings related to 1998 COPs
$6.4* million net p.v. savings (6.56% of refunded bonds)$4.3 million of net p.v. savings related to 1997 COPs (7.75% of refunded bonds)$2.1 million of net p.v. savings related to 1998 COPs (5.03% of refunded bonds)
* Preliminary, subject to change
48
2009 Refunding COPs*
$82.5 million – estimated par amount.
100% fixed rate bonds.
Two distinct leases.
100% of annual lease payment made by July 5th of each fiscal year.
Final maturity:1998 (Courthouse) COPs refunding portion – 10/1/20221997 (Central Jail) COPs refunding portion – 10/1/2025
Debt service reserve fund:Initially equal to ½ of MADS, amount held constant until 2022 when reduced to approximately $2.9 million, a pro-rata share of the original requirementDSRF is sufficient to fund final debt service payments in 2022 and 2025
* Preliminary, subject to change

49
Sources & Uses*
* Preliminary, subject to change
Total Issue Sources And Uses Dated 10/14/2009 | Delivered 10/14/2009
1997 Central Jail Ref
1998 Courthouse Ref Issue Summary
Sources Of Funds Par Amount of Bonds $49,350,000.00 $33,105,000.00 $82,455,000.00Transfers from Prior Issue DSRF 5,499,930.01 5,429,797.51 10,929,727.52Reoffering Premium 4,123,482.80 2,740,572.00 6,864,054.80Transfer from Prior Lease Fund 336,000.00 4,844,000.00 5,180,000.00 Total Sources $59,309,412.81 $46,119,369.51 $105,428,782.32 Uses Of Funds Deposit to Current Refunding Fund 55,798,604.17 43,762,192.00 99,560,796.17Deposit to Debt Service Reserve Fund (DSRF) 2,951,992.45 1,980,257.55 4,932,250.00Total Underwriter's Discount (0.641%) 316,566.16 212,359.16 528,925.32Costs of Issuance 241,214.21 161,811.49 403,025.70Rounding Amount 1,035.82 2,749.31 3,785.13 Total Uses $59,309,412.81 $46,119,369.51 $105,428,782.32

50
Debt Service Comparison*
Note: Negative savings in 2023 and 2026 are a result of the reduction in the Reserve Requirement. For both refunding components (1998 Courthouse and 1997 Central Jail COPs) the new Reserve Requirement is sufficient to fund the final payment, resulting in no net debt service during that final period. * Preliminary, subject to change
Debt Service Comparison
Date Total P+I DSR Net New D/S Old Net D/S Savings06/30/2010 1,704,223.40 (59,488.42) 1,640,949.85 1,645,498.67 4,548.8206/30/2011 9,864,500.00 (128,238.50) 9,736,261.50 10,711,587.08 975,325.5806/30/2012 9,848,325.00 (128,238.50) 9,720,086.50 10,697,349.58 977,263.0806/30/2013 9,820,137.50 (128,238.50) 9,691,899.00 10,667,149.58 975,250.5806/30/2014 7,606,050.00 (128,238.50) 7,477,811.50 8,453,312.08 975,500.5806/30/2015 7,577,250.00 (187,425.50) 7,389,824.50 8,215,834.76 826,010.2606/30/2016 7,570,875.00 (187,425.50) 7,383,449.50 8,210,424.76 826,975.2606/30/2017 7,563,875.00 (187,425.50) 7,376,449.50 8,201,787.26 825,337.7606/30/2018 7,559,000.00 (187,425.50) 7,371,574.50 8,198,587.26 827,012.7606/30/2019 6,697,500.00 (187,425.50) 6,510,074.50 7,341,812.26 831,737.7606/30/2020 6,704,500.00 (187,425.50) 6,517,074.50 7,343,762.26 826,687.7606/30/2021 6,703,375.00 (187,425.50) 6,515,949.50 7,342,137.26 826,187.7606/30/2022 6,698,750.00 (187,425.50) 6,511,324.50 7,336,462.26 825,137.7606/30/2023 6,339,125.00 (2,130,058.16) 4,209,066.84 1,901,214.75 (2,307,852.09)06/30/2024 4,316,000.00 (112,175.72) 4,203,824.28 4,584,628.14 380,803.8606/30/2025 4,302,875.00 (112,175.72) 4,190,699.28 4,572,253.14 381,553.8606/30/2026 3,003,250.00 (3,008,080.31) (4,830.31) (324,428.44) (319,598.13)
Total $113,879,610.90 (7,434,336.33) $106,441,489.44 $115,099,372.66 $8,657,883.22

51
Leased Assets
Central Jail:17-story, 940-bedsPart of Central Detention Center, which provides housing and support services for more than 2,800 inmatesCapable of processing over 265,000 arrests on an annual basisLocated in downtown of City of San DiegoConstruction began in 1995 and completed in 1997
Downtown Courthouse (Hall of Justice):Approximately 362,000-sqare feet 13-story office building16 courtrooms for the Superior CourtOffice space for County District Attorney and Superior Court administrative personnelProvides 507 parking spaces for use by County staff and the publicLocated in downtown of City of San DiegoConstruction was completed in March 1996

52
General Fund Long‐Term Obligations*
$0
$25
$50
$75
$100
$125
$150
$175
$200
$225
$250
(in m
illio
ns)
2010
2012
2014
2016
2018
2020
2022
2024
2026
2028
2030
2032
2034
2036
2009 Refunding COPs*
COPs & LRBs
POBs
Note: Debt service in FY 2010 includes the $100 million prepayment of the County’s 2008B variable rate POBs, on July 1, 2009.* Preliminary, subject to change
Debt Service RatiosDebt Service Burden (1) 3.70%Debt Service Burden Reflecting Offsets 3.28%Debt Service Burden Reflecting POB Offset 1.88%Notes:(1) Total Lease and Debt Service Payments as a percent of General Fund
Revenues

53
Financing Schedule*
Date ActivitySeptember 22 County Board of Supervisors approves financing
SANCAL Board of Directors approves financing
September 23 Receive RatingsPost Preliminary Official Statement
Week of September 28
Price Transaction
October 14 CloseCall Notice sent to DTC
November 13 Redeem 1997 COPs and 1998 COPs
* Preliminary, subject to change

CLOSING REMARKS

55
Conclusion
County has maintained a structurally balanced budget through good times and bad, and will continue to do so.County is well-positioned to manage the challenges at hand, including the economic slowdown, impact of State budgetary actions, and changing needs of our residents:
County Board maintains its position of making necessary budget cuts given the economic situationCounty Board is proactively managing its cost structure in the near-term and for the long-term, maintaining a balanced Operational Plan and approving a new Tier B for its retirement plan
County has institutionalized and maintained conservative and prudent fiscal management practices:
Consistently strong fund balances and stable reservesOn-going assessment of current and future capital needs
County has maintained fiscal stability in challenging market conditions.County operates within a diversified, resilient economy.Refunding will result in significant annual savings to the County.