rating agency analysis and perspective on mpl … leadership camp james auden, managing director,...
TRANSCRIPT

PIAA Leadership Camp
James Auden Managing Director Fitch Ratings
May 17 2017
Rating Agency Analysis and Perspective on MPL Insurance Reserve Adequacy
1
PropertyCasualty Insurer Ratings Approach
minus Fitch Rating Scale and Methodology Versus Other Agencies
minus Application of Rating Factors to MPLI Specialists
MPLI Loss Reserve Analysis
minus Key Loss Reserve Characteristics
minus Loss Reserve Analysis in Ratings Process
Agenda
2
PropertyCasualty Rating Approach1
3
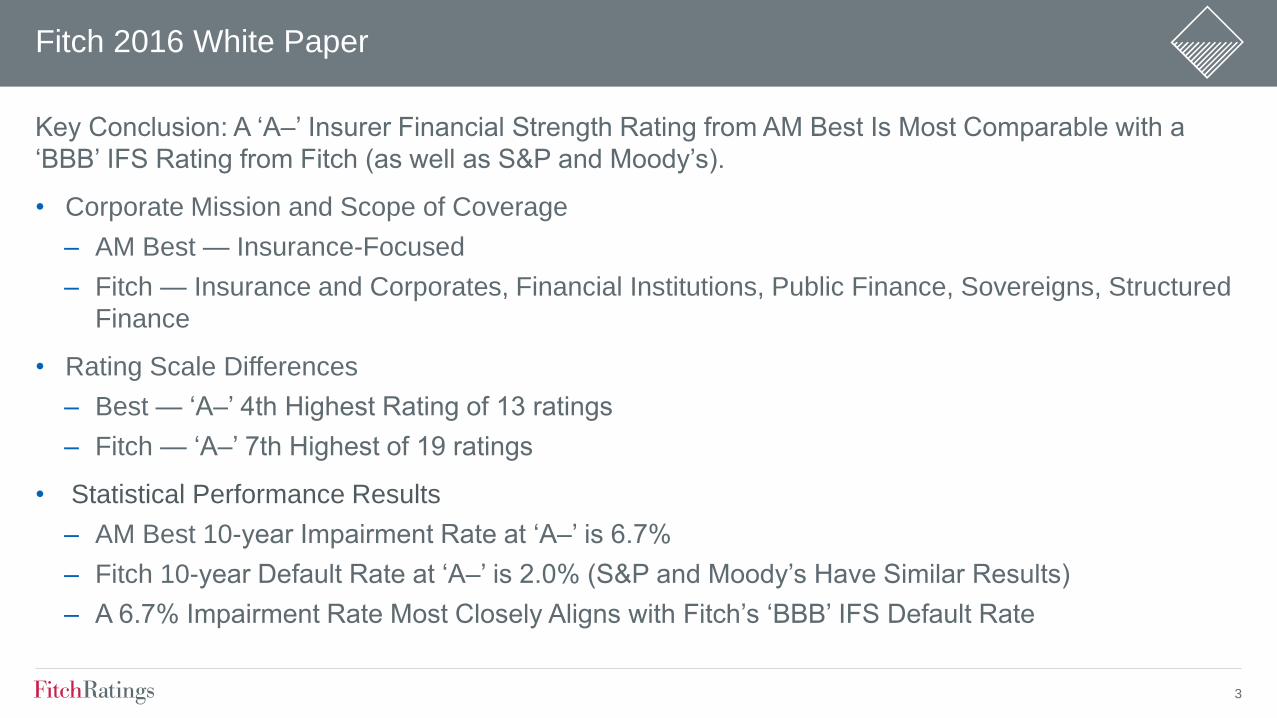
Fitch 2016 White Paper
Key Conclusion A lsquoAndashrsquo Insurer Financial Strength Rating from AM Best Is Most Comparable with a
lsquoBBBrsquo IFS Rating from Fitch (as well as SampP and Moodyrsquos)
bull Corporate Mission and Scope of Coverage
‒ AM Best mdash Insurance-Focused
‒ Fitch mdash Insurance and Corporates Financial Institutions Public Finance Sovereigns Structured
Finance
bull Rating Scale Differences
‒ Best mdash lsquoAndashrsquo 4th Highest Rating of 13 ratings
‒ Fitch mdash lsquoAndashrsquo 7th Highest of 19 ratings
bull Statistical Performance Results
‒ AM Best 10-year Impairment Rate at lsquoAndashrsquo is 67
‒ Fitch 10-year Default Rate at lsquoAndashrsquo is 20 (SampP and Moodyrsquos Have Similar Results)
‒ A 67 Impairment Rate Most Closely Aligns with Fitchrsquos lsquoBBBrsquo IFS Default Rate
4
Criteria Differences mdash Areas Where AM Best Often Assigns lsquoAndashrsquo IFS Rating When Fitch Would Initially
Rate in lsquoBBBrsquo Range
bull Newly Formed (Re)insurers
bull High Country RiskLow Sovereign Ratings
bull Captives
bull Smaller-Sized Insurers
Differences in lsquoAndashrsquo Ratings
5
Qualitative Factors
bull Industry Profile and Operating Environment
bull Business Profile
bull Ownership
bull Corporate Governance
bull Management
Rating MPLI Specialists mdash Important Credit Factors
Quantitative Factors
bull Capitalization and Leverage
bull Debt Service Capabilities and Financial
Flexibility
bull Financial Performance and Earnings
bull Investment and Asset Risk
bull Reserve Adequacy
bull Reinsurance Risk Mitigation and Catastrophe
Risk
6
Business Profile
Primary Considerations MPLI Specialistsrsquo Perspective
Competitive Positioning Within Broad Market and
Primary Product Segments
Highly Focused Product Expertise Strong Market
Share in Targeted State or Region
SizeScale of Capital and Revenues Moderate SizeScale (Surplus lt $1 Bil Premiums lt
$750 Mil)
Key Business Risks and Diversification Longer Tail Historically Volatile Business mdash Limited
Diversification
Competitive Threats to Long-Term Viability and
Profitability
Business Pressures From Changes in Broader
Healthcare Market
Source Fitch Ratings
7
00
02
04
06
08
0
5
10
15
20
2007 2008 2009 2010 2011 2012 2013 2014 2015 2016
($ Bil)
MPLI Specialists Operating Leverage
PHS NWP Operating Leverage (RHS)
PHS ndash Policyholders surplus NWP ndash Net premium written Note Aggregate for a group of 35 MPLI specialists
Source SNL Financial
(x)
Capitalization and Leverage
MPLI Specialists
bull Surplus Growth and Exposure Reduction over Last Decade
bull Very Strong Capital Measures (Operating Leverage RBC Fitch Stochastic Capital Model)
bull Low Financial Leverage mdash Limited Capital Access
8
Financial Performance and Earnings
MPLI Specialists
bull Recent Deterioration in Combined Ratios Evident Following Extended Period of Strong Results
bull Calendar-Year Versus Accident-Year Combined Ratio
bull Return on Surplus Declining from Underwriting and Investment Challenges
909
785 812 800 848
912 900 902 979 990
150
100
162 165
121
103 90 85
54 46
0
3
6
9
12
15
18
0
20
40
60
80
100
120
2007 2008 2009 2010 2011 2012 2013 2014 2015 2016
()
MPLI Specialistsrsquo Financial Performance and Earnings
Combined Ratio (LHS) Return on Surplus (RHS)
Note Aggregate for a group of 35 MPLI specialists
Source SNL Financial
()
9
Rating Navigator Tool
A Visual Overview of Key Factors Considered in IFS Ratings
10
MPLI Reserve Analysis2
11
Workers Comp24
Other Liability22
Commercial Multiperil
6
Reinsurance6
MPLI4
Homeowners4
Special Property
2Other
Reserves3
Source SNL Financial
PropertyCasualty Industry Loss Reserves YE 2016(Total Industry Reserves = $621 Bil)
Private
Passenger Auto
20
Commercial Auto
5
Financial
Guaranty
Mortgage
Insurance
2Product Liability
2
MPLI mdash Reserve Characteristics
bull Represent 44 of Industry 2016 Loss
Reserves
bull More Volatile Segment Versus Other PC Lines
bull Longer-Tail Claims Liabilities
bull Large Defense Costs Component to Claims
12
MPLI mdash Underwriting and Reserve Cyclicality
(60)
(40)
(20)
0
20
40
60
80
100
120
140
()
PropertyCasualty Industry Historical Accident-Year Results
Loss Ratio Change (Original Versus Latest Reported) Latest Loss Ratio Estimate
Note MPLI claims made
Source SNL Financial
13
Reserve Characteristics Volatility
MPLI Claims Made Has Higher Underwriting and Reserve Volatility than Nearly All Major PC Segments
Private Passenger Auto WCAll Lines
Commercial AutoCMP
HO
OL OCC
Specialty LiabilityMPLI CM
OL CM
Prod Liab Occ
0
5
10
15
20
25
30
0 5 10 15 20 25 30
(Average Loss Ratio Volatility )
Average Loss Ratio Volatility Versus Reserve Volatility by Segment
WC ndash Workers compensation CMP ndash Commercial multiperil HO ndash Homeowners OL OCC ndash Other liability ndash occurrence MPLI CM ndash Medical practice liability insurance claims made OL CM ndash Other
liability ndash claims made Liab OCC ndash Liability occurrence
Source SNL Financial Fitch
()
14
bull Slower Payout Versus Most PC Segments
bull Tail Risk Higher in Workersrsquo Compensation
Reserves Characteristics mdash Claims Duration
0
20
40
60
80
100
120
1 2 3 4 5 6 7 8 9 10
()
Loss Payment Pattern by Segment
Homeowners Workers Comp CMP MPLI CM
CMP ndash Commercial multiperil Note Propertycasualty industry aggregate
Source SNL Financial
(Years of Development)
15
bull Approximately 73 of Industry MPLI Reserves Are in Latest Four Accident Years 2013ndash2016
MPLI Reserve Composition
201624
201521
201416
201312
20128
20116
20104
20092
20082
20071 2006 and Prior
4
Source SNL Financial
Industry MPLI Reserves by Accident Year(73 of Reserves Relate to Accident-Years 2013ndash2016)
16
Large Litigation Component of MPLI Claims mdash Higher of Losses in Defense
and Cost Containment Costs
Reserve Characteristics mdash Defense Costs
0
5
10
15
20
25
30
35
MPLI CM MPLI OCC Other LiabilityCM
Other LiabilityOCC
CMP Workers Comp CommercialAuto
All Lines Personal Auto Homeowners
()
Defense and Cost Containment Costs of Total Net Incurred(Average Accident Years 2006ndash2015)
CM ndash Claims made OCC ndash Occurrence CMP ndash Commercial multiperil Note Propertycasualty industry aggregate data
Source SNL Financial
17
MPLI Reserve Analysis
bull Reserve Profile
bull Reserve Growth
bull Reserve Experience
bull Reserve Adequacy
18
Reserve Profile
Reserve Composition and Inherent Risk
bull Reserve Segment Mix and Diversification
bull Reserve Leverage
bull Reserve Risk Relative to Underwriting Risk
Implied Weighting of Reserves in Rating
Loss Reserves
Incurred Losses
Reserve Leverage
lt10 10ndash15 gt15
gt20 Medium High High
10ndash20 Medium Medium High
lt10 Low Medium Medium
19
MPLI Specialists Reserve Leverage Declining over Time with Surplus Growth
ReservesIncurred Ratio Very High mdash Implies Greater Capital Sensitivity to Reserve Changes than
Current Underwriting Period
MPLI Reserve Profile
00
05
10
15
20
25
0
3
6
9
12
15
18
2007 2008 2009 2010 2011 2012 2013 2014 2015 2016
($ Bil)
MPLI Specialists Reserve Leverage
PHS Reserves Reserve Leverage
PHS ndash Policyholders surplus Note Aggregate for a group of 35 MPLI specialists
Source SNL Financial
(x)
00
10
20
30
40
50
60
70
2007 2008 2009 2010 2011 2012 2013 2014 2015 2016
(x)ReservesCY Incurred Reserve Leverage
CY ndash Calendar year Note Aggregate for a group of 35 MPLI specialists
Source SNL Financial
MPLI Specialists Reserve Leverage Versus Reserves
CY Incurred
20
Over Long Term an Insurerrsquos Reserves Should Grow Commensurate with Exposures
Key Ratios
bull Calendar-Year PaidCalendar-Year Incurred Losses
bull ReservesEarned Premiums (Changes over Time)
MPLI Reserve Growth
00
02
04
06
08
10
12
14
2007 2008 2009 2010 2011 2012 2013 2014 2015 2016
(x)
Note Aggregate for a group of 35 MPLI specialists Calendar-year paid and incurred losses
Source SNL Financial
Paid gt Incurred Loss Indicative of
Reserve Weakness but Incurred
Influence by Reserve Takedowns
MPLI Specialists Reserve Growth Indications(PaidIncurred Losses)
30
31
32
33
34
2007 2008 2009 2010 2011 2012 2013 2014 2015 2016
(x)
Note Aggregate for a group of 35 MPLI specialists
Source SNL Financial
Stable Ratio = Reserve
Changes Keeping Pace
with Premium Changes
MPLI Specialists Reserve Growth Indications(ReservesEarned Premium)
21
Key Ratios
bull Calendar Year
‒ One Year Development Prior-Year Reserves
‒ One Year Development Prior-Year Surplus
‒ One Year Development Earned Premiums
bull Accident Year
‒ Current Loss Ratio Estimate Versus Original Estimate
‒ Accident-Year Development History and Trends
MPLI Reserve Experience
22
Reserve Experience mdash Favorable MPLI Development
bull Reserve Development Still Highly Favorable but Slowing Considerably
196
237228
266
221206
245
198
166
116
0
5
10
15
20
25
30
2007 2008 2009 2010 2011 2012 2013 2014 2015 2016
( of Earned Premiums)
MPLI Calendar-Year Reserve Development
Note Excludes MCIC Vermont Propertycasualty industry aggregate
Source SNL Financial
Favorable
Development
23
Reserve Experience mdash Calendar-Year Development
bull MPLI Development Greatly Exceeds Other Commercial Lines Segments over Last Decade
bull Magnitude of Favorable Development in MPLI Declining
(30)
(25)
(20)
(15)
(10)
(5)
0
5
10
15
Commercial Auto Other Liability mdash Claims Made Other Liability mdash Occurrence MPLI mdash Claims Made Workers Compensation
() 2012 2013 2014 2015 2016
Source SNL Financial
Segment Calendar-Year Development as a of Earned Premium mdash (Favorable)Unfavorable
24
Favorable Reserve Development Slowing
(5)
0
5
10
15
20
2015 2014 2013 2012 2011 2010 2009 2008 2007 2006 2005 2004 2003
12ndash24 Months 24ndash36 Months 36ndash48 Months
Note Propertycasualty industry aggregate MPLI claims made
Source SNL Financial
( Favorable[Unfavorable])
Favorable MPLI Accident-Year Development Slowing mdash Change in Loss Ratio
25
Favorable Reserve Development Slowing
0
10
20
30
40
50
60
70
80
90
2015 2014 2013 2012 2011 2010 2009 2008 2007
()
Accident-Year Loss Ratio Changes by Time of Development
12 Months 24 Months 36 Months 48 Months 60 Months 72 Months 84 Months 96 Months 108 Months 120 Months
Note Industry aggregate MPLI claims made
Source SNL Financial
26
Accident-Year Loss Ratio
bull Claims Made Accident-Year Loss Ratio Rising
bull Will Recent Accident-Years Develop Downward Like 2003ndash2010
510 574
619 672
736 788
829 859 886 867
0
10
20
30
40
50
60
70
80
90
100
2007 2008 2009 2010 2011 2012 2013 2014 2015 2016
()
Accident-Year Loss and LAE Ratio(Current Loss Ratio Estimate)
Note Propertycasualty industry aggregate MPLI claims made
Source SNL Financial Fitch
27
Accident-Year Loss Ratio Development
bull Recent Accident-Years Favorable Development Pattern Lagging Past Highly Redundant AYs
(27) (21)(19) (16) (9)
(5) 00 1
0
10
20
30
40
50
60
70
80
90
100
2007 2008 2009 2010 2011 2012 2013 2014 2015
()
Accident-Year Loss and LAE Ratio Development
Current LR Est Original LR Est
LR ndash Loss ratio Note Propertycasualty industry aggregate MPLI claims made
Source SNL Financial Fitch
Change Current
LR Versus Original
28
MPLI Reserve Adequacy
Key Considerations
bull Likelihood of Balance Sheet Reported Reserves to Develop HigherLower over Time
bull Stress Test Capital Impact of Potential Deficiencies
Analytical Tools
bull Project Reserve Adequacy Using Loss Development Methods (PaidCase Incurred)
bull Accident-Year Ratio Analysis
29
Reserve Adequacy mdash MPLI
bull Initial Analysis of Industry 2016 Reserves
bull MPLI Claims Made and Occurrence Reserves Still 5ndash7 Redundant ($14 Billionndash$20 Billion)
(09)
(09)(20)
(20) (34) (37) (20)
0
10
20
30
40
50
60
70
80
90
2007 2008 2009 2010 2011 2012 2013 2014 2015 2016
()
Estimated Reserve Adequacy mdash Paid Development Method
Reported Loss Ratio Projected Loss Ratio
Note Propertycasualty industry aggregate MPLI claims made
Source SNL Financial
Accident-Year Loss
Ratio Redundant
30
MPLI Reserve Ratio Analysis mdash Accident-Year PaidIncurred
bull At Same Period of Development Paid to Incurred Losses Should Be Similar Across Accident Years
bull HigherLower Paid to Incurred for One Accident Year Versus Others Indicative of Reserve
WeaknessStrength
PropertyCasualty Industry mdash Medical Malpractice Claims Made( PaidIncurred)
Months of Development
Accident Year 12 24 36 48 60 72 84 96 108 120
2007 33 182 378 540 692 788 865 902 932 962
2008 37 189 391 568 712 817 862 899 945 mdash
2009 38 203 405 580 719 806 857 928 mdash mdash
2010 41 206 408 576 713 816 871 mdash mdash mdash
2011 39 202 420 577 731 831 mdash mdash mdash mdash
2012 38 219 420 607 743 mdash mdash mdash mdash mdash
2013 45 218 442 615 mdash mdash mdash mdash mdash mdash
2014 44 218 430 mdash mdash mdash mdash mdash mdash mdash
2015 40 207 mdash mdash mdash mdash mdash mdash mdash mdash
2016 43 mdash mdash mdash mdash mdash mdash mdash mdash mdash
Average 40 205 412 580 718 811 864 909 939 mdash
Difference 03 02 18 34 25 19 07 18 06 mdash
Source SNL Financial
31
(50)
(40)
(30)
(20)
(10)
0
10
20
30
10 15 20 25 30 35
(PaidIncurred Losses at 24 Months )
Source SNL Financial
( Incurred Losses Deficient[Redundant])
Historical Accident-Year Reserve Development Related to Paid Levels(Accident Years 1987ndash2011)
Correlation = 92
R-Squared = 84
Reserve Ratio Analysis mdash Accident-Year PaidIncurred
Analysis of Industry MPLI Claims Made for Accident Years 1987ndash2011
bull LowerHigher Cumulative Paid Loss Levels Relative to Incurred Losses at Early Periods of
Development Related to Ultimate Loss Experience
Deficient
Redundant
32
MPLI Reserve Ratio Analysis mdash Accident-Year IBNRIncurred
bull At Same Period of Development Incurred but Not Reported (IBNR) to Incurred Should Be Similar
Across Accident Years
bull LowerHigher IBNR Levels for One AY Versus Others Indicative of Reserve WeaknessStrength
PropertyCasualty Industry mdash Medical Malpractice Claims Made( IBNRIncurred)
Months of Development
Accident Year 12 24 36 48 60 72 84 96 108 120
2007 616 382 264 177 110 69 35 21 16 11
2008 599 335 203 141 87 46 33 27 14 mdash
2009 599 330 207 142 93 54 39 20 mdash mdash
2010 588 321 181 121 79 47 33 mdash mdash mdash
2011 600 300 169 114 72 36 mdash mdash mdash mdash
2012 611 299 162 104 63 mdash mdash mdash mdash mdash
2013 605 296 168 106 mdash mdash mdash mdash mdash mdash
2014 615 334 194 mdash mdash mdash mdash mdash mdash mdash
2015 635 329 mdash mdash mdash mdash mdash mdash mdash mdash
2016 617 mdash mdash mdash mdash mdash mdash mdash mdash mdash
Average 608 325 194 129 84 50 35 22 15 mdash
Difference 08 04 01 (24) (21) (14) (03) (03) (01) mdash
Source SNL Financial
33
Reserve Adequacy mdash Ratio Analysis
(40)
(30)
(20)
(10)
0
10
20
30
0 5 10 15 20 25 30 35 40 45
(IBNRIncurred Losses at 24 Months )IBNR ndash Incurred but not reported
Source SNL Financial
( Incurred Losses Deficient[Redundant])
Historical Accident-Year Reserve Development Related to IBNR Levels(Accident Years 1987ndash2011)
Correlation = (78)
R-Squared = 74
Deficient
Redundant
Analysis of Industry MPLI Claims Made for Accident Years 1987ndash2011
bull HigherLower IBNR Levels Relative to Incurred Losses at Early Periods of Development Related
to Ultimate Loss Experience
34
ALL FITCH CREDIT RATINGS ARE SUBJECT TO CERTAIN LIMITATIONS AND DISCLAIMERS
PLEASE READ THESE LIMITATIONS AND DISCLAIMERS BY FOLLOWING THIS LINK
HTTPSFITCHRATINGSCOMUNDERSTANDINGCREDITRATINGS IN ADDITION RATING
DEFINITIONS AND THE TERMS OF USE OF SUCH RATINGS ARE AVAILABLE ON THE
AGENCYS PUBLIC WEB SITE
AT WWWFITCHRATINGSCOM PUBLISHED RATINGS CRITERIA AND METHODOLOGIES ARE
AVAILABLE FROM THIS SITE AT ALL TIMES FITCHS CODE OF CONDUCT CONFIDENTIALITY
CONFLICTS OF INTEREST AFFILIATE FIREWALL COMPLIANCE AND OTHER RELEVANT
POLICIES AND PROCEDURES ARE ALSO AVAILABLE FROM THE CODE OF CONDUCT
SECTION OF THIS SITE FITCH MAY HAVE PROVIDED ANOTHER PERMISSIBLE SERVICE TO
THE RATED ENTITY OR ITS RELATED THIRD PARTIES DETAILS OF THIS SERVICE FOR
RATINGS FOR WHICH THE LEAD ANALYST IS BASED IN AN EU-REGISTERED ENTITY CAN BE
FOUND ON THE ENTITY SUMMARY PAGE FOR THIS ISSUER ON THE FITCH WEBSITE
Copyright copy 2017 by Fitch Ratings Inc Fitch Ratings Ltd and its subsidiaries 33 Whitehall Street
NY NY 10004 Telephone 1-800-753-4824 (212) 908-0500 Fax (212) 480-4435 Reproduction or
retransmission in whole or in part is prohibited except by permission All rights reserved In issuing
and maintaining its ratings and in making other reports (including forecast information) Fitch relies on
factual information it receives from issuers and underwriters and from other sources Fitch believes to
be credible Fitch conducts a reasonable investigation of the factual information relied upon by it in
accordance with its ratings methodology and obtains reasonable verification of that information from
independent sources to the extent such sources are available for a given security or in a given
jurisdiction The manner of Fitchrsquos factual investigation and the scope of the third-party verification it
obtains will vary depending on the nature of the rated security and its issuer the requirements and
practices in the jurisdiction in which the rated security is offered and sold andor the issuer is located
the availability and nature of relevant public information access to the management of the issuer and
its advisers the availability of pre-existing third-party verifications such as audit reports agreed-upon
procedures letters appraisals actuarial reports engineering reports legal opinions and other reports
provided by third parties the availability of independent and competent third-party verification sources
with respect to the particular security or in the particular jurisdiction of the issuer and a variety of
other factors Users of Fitchrsquos ratings and reports should understand that neither an enhanced factual
investigation nor any third-party verification can ensure that all of the information Fitch relies on in
connection with a rating or a report will be accurate and complete Ultimately the issuer and its
advisers are responsible for the accuracy of the information they provide to Fitch and to the market in
offering documents and other reports In issuing its ratings and its reports Fitch must rely on the work
of experts including independent auditors with respect to financial statements and attorneys with
respect to legal and tax matters Further ratings and forecasts of financial and other information are
inherently forward-looking and embody assumptions and predictions about future events that by their
nature cannot be verified as facts As a result despite any verification of current facts ratings and
forecasts can be affected by future events or conditions that were not anticipated at the time a rating
or forecast was issued or affirmed
The information in this report is provided ldquoas isrdquo without any representation or warranty of any kind
and Fitch does not represent or warrant that the report or any of its contents will meet any of the
requirements of a recipient of the report A Fitch rating is an opinion as to the creditworthiness of a
security This opinion and reports made by Fitch are based on established criteria and methodologies
that Fitch is continuously evaluating and updating Therefore ratings and reports are the collective
work product of Fitch and no individual or group of individuals is solely responsible for a rating or a
report The rating does not address the risk of loss due to risks other than credit risk unless such risk
is specifically mentioned Fitch is not engaged in the offer or sale of any security All Fitch reports
have shared authorship Individuals identified in a Fitch report were involved in but are not solely
responsible for the opinions stated therein The individuals are named for contact purposes only A
report providing a Fitch rating is neither a prospectus nor a substitute for the information assembled
verified and presented to investors by the issuer and its agents in connection with the sale of the
securities Ratings may be changed or withdrawn at any time for any reason in the sole discretion of
Fitch Fitch does not provide investment advice of any sort Ratings are not a recommendation to buy
sell or hold any security Ratings do not comment on the adequacy of market price the suitability of
any security for a particular investor or the tax-exempt nature or taxability of payments made in
respect to any security Fitch receives fees from issuers insurers guarantors other obligors and
underwriters for rating securities Such fees generally vary from US$1000 to US$750000 (or the
applicable currency equivalent) per issue In certain cases Fitch will rate all or a number of issues
issued by a particular issuer or insured or guaranteed by a particular insurer or guarantor for a single
annual fee Such fees are expected to vary from US$10000 to US$1500000 (or the applicable
currency equivalent) The assignment publication or dissemination of a rating by Fitch shall not
constitute a consent by Fitch to use its name as an expert in connection with any registration
statement filed under the United States securities laws the Financial Services and Markets Act of
2000 of the United Kingdom or the securities laws of any particular jurisdiction Due to the relative
efficiency of electronic publishing and distribution Fitch research may be available to electronic
subscribers up to three days earlier than to print subscribers
For Australia New Zealand Taiwan and South Korea only Fitch Australia Pty Ltd holds an Australian
financial services license (AFS license no 337123) which authorizes it to provide credit ratings to
wholesale clients only Credit ratings information published by Fitch is not intended to be used by
persons who are retail clients within the meaning of the Corporations Act 2001
fitchratings
fitchratingscom
New York London33 Whitehall Street
New York NY 10004
30 North Colonnade
Canary Wharf
London E14 5GN
1
PropertyCasualty Insurer Ratings Approach
minus Fitch Rating Scale and Methodology Versus Other Agencies
minus Application of Rating Factors to MPLI Specialists
MPLI Loss Reserve Analysis
minus Key Loss Reserve Characteristics
minus Loss Reserve Analysis in Ratings Process
Agenda
2
PropertyCasualty Rating Approach1
3
Fitch 2016 White Paper
Key Conclusion A lsquoAndashrsquo Insurer Financial Strength Rating from AM Best Is Most Comparable with a
lsquoBBBrsquo IFS Rating from Fitch (as well as SampP and Moodyrsquos)
bull Corporate Mission and Scope of Coverage
‒ AM Best mdash Insurance-Focused
‒ Fitch mdash Insurance and Corporates Financial Institutions Public Finance Sovereigns Structured
Finance
bull Rating Scale Differences
‒ Best mdash lsquoAndashrsquo 4th Highest Rating of 13 ratings
‒ Fitch mdash lsquoAndashrsquo 7th Highest of 19 ratings
bull Statistical Performance Results
‒ AM Best 10-year Impairment Rate at lsquoAndashrsquo is 67
‒ Fitch 10-year Default Rate at lsquoAndashrsquo is 20 (SampP and Moodyrsquos Have Similar Results)
‒ A 67 Impairment Rate Most Closely Aligns with Fitchrsquos lsquoBBBrsquo IFS Default Rate
4
Criteria Differences mdash Areas Where AM Best Often Assigns lsquoAndashrsquo IFS Rating When Fitch Would Initially
Rate in lsquoBBBrsquo Range
bull Newly Formed (Re)insurers
bull High Country RiskLow Sovereign Ratings
bull Captives
bull Smaller-Sized Insurers
Differences in lsquoAndashrsquo Ratings
5
Qualitative Factors
bull Industry Profile and Operating Environment
bull Business Profile
bull Ownership
bull Corporate Governance
bull Management
Rating MPLI Specialists mdash Important Credit Factors
Quantitative Factors
bull Capitalization and Leverage
bull Debt Service Capabilities and Financial
Flexibility
bull Financial Performance and Earnings
bull Investment and Asset Risk
bull Reserve Adequacy
bull Reinsurance Risk Mitigation and Catastrophe
Risk
6
Business Profile
Primary Considerations MPLI Specialistsrsquo Perspective
Competitive Positioning Within Broad Market and
Primary Product Segments
Highly Focused Product Expertise Strong Market
Share in Targeted State or Region
SizeScale of Capital and Revenues Moderate SizeScale (Surplus lt $1 Bil Premiums lt
$750 Mil)
Key Business Risks and Diversification Longer Tail Historically Volatile Business mdash Limited
Diversification
Competitive Threats to Long-Term Viability and
Profitability
Business Pressures From Changes in Broader
Healthcare Market
Source Fitch Ratings
7
00
02
04
06
08
0
5
10
15
20
2007 2008 2009 2010 2011 2012 2013 2014 2015 2016
($ Bil)
MPLI Specialists Operating Leverage
PHS NWP Operating Leverage (RHS)
PHS ndash Policyholders surplus NWP ndash Net premium written Note Aggregate for a group of 35 MPLI specialists
Source SNL Financial
(x)
Capitalization and Leverage
MPLI Specialists
bull Surplus Growth and Exposure Reduction over Last Decade
bull Very Strong Capital Measures (Operating Leverage RBC Fitch Stochastic Capital Model)
bull Low Financial Leverage mdash Limited Capital Access
8
Financial Performance and Earnings
MPLI Specialists
bull Recent Deterioration in Combined Ratios Evident Following Extended Period of Strong Results
bull Calendar-Year Versus Accident-Year Combined Ratio
bull Return on Surplus Declining from Underwriting and Investment Challenges
909
785 812 800 848
912 900 902 979 990
150
100
162 165
121
103 90 85
54 46
0
3
6
9
12
15
18
0
20
40
60
80
100
120
2007 2008 2009 2010 2011 2012 2013 2014 2015 2016
()
MPLI Specialistsrsquo Financial Performance and Earnings
Combined Ratio (LHS) Return on Surplus (RHS)
Note Aggregate for a group of 35 MPLI specialists
Source SNL Financial
()
9
Rating Navigator Tool
A Visual Overview of Key Factors Considered in IFS Ratings
10
MPLI Reserve Analysis2
11
Workers Comp24
Other Liability22
Commercial Multiperil
6
Reinsurance6
MPLI4
Homeowners4
Special Property
2Other
Reserves3
Source SNL Financial
PropertyCasualty Industry Loss Reserves YE 2016(Total Industry Reserves = $621 Bil)
Private
Passenger Auto
20
Commercial Auto
5
Financial
Guaranty
Mortgage
Insurance
2Product Liability
2
MPLI mdash Reserve Characteristics
bull Represent 44 of Industry 2016 Loss
Reserves
bull More Volatile Segment Versus Other PC Lines
bull Longer-Tail Claims Liabilities
bull Large Defense Costs Component to Claims
12
MPLI mdash Underwriting and Reserve Cyclicality
(60)
(40)
(20)
0
20
40
60
80
100
120
140
()
PropertyCasualty Industry Historical Accident-Year Results
Loss Ratio Change (Original Versus Latest Reported) Latest Loss Ratio Estimate
Note MPLI claims made
Source SNL Financial
13
Reserve Characteristics Volatility
MPLI Claims Made Has Higher Underwriting and Reserve Volatility than Nearly All Major PC Segments
Private Passenger Auto WCAll Lines
Commercial AutoCMP
HO
OL OCC
Specialty LiabilityMPLI CM
OL CM
Prod Liab Occ
0
5
10
15
20
25
30
0 5 10 15 20 25 30
(Average Loss Ratio Volatility )
Average Loss Ratio Volatility Versus Reserve Volatility by Segment
WC ndash Workers compensation CMP ndash Commercial multiperil HO ndash Homeowners OL OCC ndash Other liability ndash occurrence MPLI CM ndash Medical practice liability insurance claims made OL CM ndash Other
liability ndash claims made Liab OCC ndash Liability occurrence
Source SNL Financial Fitch
()
14
bull Slower Payout Versus Most PC Segments
bull Tail Risk Higher in Workersrsquo Compensation
Reserves Characteristics mdash Claims Duration
0
20
40
60
80
100
120
1 2 3 4 5 6 7 8 9 10
()
Loss Payment Pattern by Segment
Homeowners Workers Comp CMP MPLI CM
CMP ndash Commercial multiperil Note Propertycasualty industry aggregate
Source SNL Financial
(Years of Development)
15
bull Approximately 73 of Industry MPLI Reserves Are in Latest Four Accident Years 2013ndash2016
MPLI Reserve Composition
201624
201521
201416
201312
20128
20116
20104
20092
20082
20071 2006 and Prior
4
Source SNL Financial
Industry MPLI Reserves by Accident Year(73 of Reserves Relate to Accident-Years 2013ndash2016)
16
Large Litigation Component of MPLI Claims mdash Higher of Losses in Defense
and Cost Containment Costs
Reserve Characteristics mdash Defense Costs
0
5
10
15
20
25
30
35
MPLI CM MPLI OCC Other LiabilityCM
Other LiabilityOCC
CMP Workers Comp CommercialAuto
All Lines Personal Auto Homeowners
()
Defense and Cost Containment Costs of Total Net Incurred(Average Accident Years 2006ndash2015)
CM ndash Claims made OCC ndash Occurrence CMP ndash Commercial multiperil Note Propertycasualty industry aggregate data
Source SNL Financial
17
MPLI Reserve Analysis
bull Reserve Profile
bull Reserve Growth
bull Reserve Experience
bull Reserve Adequacy
18
Reserve Profile
Reserve Composition and Inherent Risk
bull Reserve Segment Mix and Diversification
bull Reserve Leverage
bull Reserve Risk Relative to Underwriting Risk
Implied Weighting of Reserves in Rating
Loss Reserves
Incurred Losses
Reserve Leverage
lt10 10ndash15 gt15
gt20 Medium High High
10ndash20 Medium Medium High
lt10 Low Medium Medium
19
MPLI Specialists Reserve Leverage Declining over Time with Surplus Growth
ReservesIncurred Ratio Very High mdash Implies Greater Capital Sensitivity to Reserve Changes than
Current Underwriting Period
MPLI Reserve Profile
00
05
10
15
20
25
0
3
6
9
12
15
18
2007 2008 2009 2010 2011 2012 2013 2014 2015 2016
($ Bil)
MPLI Specialists Reserve Leverage
PHS Reserves Reserve Leverage
PHS ndash Policyholders surplus Note Aggregate for a group of 35 MPLI specialists
Source SNL Financial
(x)
00
10
20
30
40
50
60
70
2007 2008 2009 2010 2011 2012 2013 2014 2015 2016
(x)ReservesCY Incurred Reserve Leverage
CY ndash Calendar year Note Aggregate for a group of 35 MPLI specialists
Source SNL Financial
MPLI Specialists Reserve Leverage Versus Reserves
CY Incurred
20
Over Long Term an Insurerrsquos Reserves Should Grow Commensurate with Exposures
Key Ratios
bull Calendar-Year PaidCalendar-Year Incurred Losses
bull ReservesEarned Premiums (Changes over Time)
MPLI Reserve Growth
00
02
04
06
08
10
12
14
2007 2008 2009 2010 2011 2012 2013 2014 2015 2016
(x)
Note Aggregate for a group of 35 MPLI specialists Calendar-year paid and incurred losses
Source SNL Financial
Paid gt Incurred Loss Indicative of
Reserve Weakness but Incurred
Influence by Reserve Takedowns
MPLI Specialists Reserve Growth Indications(PaidIncurred Losses)
30
31
32
33
34
2007 2008 2009 2010 2011 2012 2013 2014 2015 2016
(x)
Note Aggregate for a group of 35 MPLI specialists
Source SNL Financial
Stable Ratio = Reserve
Changes Keeping Pace
with Premium Changes
MPLI Specialists Reserve Growth Indications(ReservesEarned Premium)
21
Key Ratios
bull Calendar Year
‒ One Year Development Prior-Year Reserves
‒ One Year Development Prior-Year Surplus
‒ One Year Development Earned Premiums
bull Accident Year
‒ Current Loss Ratio Estimate Versus Original Estimate
‒ Accident-Year Development History and Trends
MPLI Reserve Experience
22
Reserve Experience mdash Favorable MPLI Development
bull Reserve Development Still Highly Favorable but Slowing Considerably
196
237228
266
221206
245
198
166
116
0
5
10
15
20
25
30
2007 2008 2009 2010 2011 2012 2013 2014 2015 2016
( of Earned Premiums)
MPLI Calendar-Year Reserve Development
Note Excludes MCIC Vermont Propertycasualty industry aggregate
Source SNL Financial
Favorable
Development
23
Reserve Experience mdash Calendar-Year Development
bull MPLI Development Greatly Exceeds Other Commercial Lines Segments over Last Decade
bull Magnitude of Favorable Development in MPLI Declining
(30)
(25)
(20)
(15)
(10)
(5)
0
5
10
15
Commercial Auto Other Liability mdash Claims Made Other Liability mdash Occurrence MPLI mdash Claims Made Workers Compensation
() 2012 2013 2014 2015 2016
Source SNL Financial
Segment Calendar-Year Development as a of Earned Premium mdash (Favorable)Unfavorable
24
Favorable Reserve Development Slowing
(5)
0
5
10
15
20
2015 2014 2013 2012 2011 2010 2009 2008 2007 2006 2005 2004 2003
12ndash24 Months 24ndash36 Months 36ndash48 Months
Note Propertycasualty industry aggregate MPLI claims made
Source SNL Financial
( Favorable[Unfavorable])
Favorable MPLI Accident-Year Development Slowing mdash Change in Loss Ratio
25
Favorable Reserve Development Slowing
0
10
20
30
40
50
60
70
80
90
2015 2014 2013 2012 2011 2010 2009 2008 2007
()
Accident-Year Loss Ratio Changes by Time of Development
12 Months 24 Months 36 Months 48 Months 60 Months 72 Months 84 Months 96 Months 108 Months 120 Months
Note Industry aggregate MPLI claims made
Source SNL Financial
26
Accident-Year Loss Ratio
bull Claims Made Accident-Year Loss Ratio Rising
bull Will Recent Accident-Years Develop Downward Like 2003ndash2010
510 574
619 672
736 788
829 859 886 867
0
10
20
30
40
50
60
70
80
90
100
2007 2008 2009 2010 2011 2012 2013 2014 2015 2016
()
Accident-Year Loss and LAE Ratio(Current Loss Ratio Estimate)
Note Propertycasualty industry aggregate MPLI claims made
Source SNL Financial Fitch
27
Accident-Year Loss Ratio Development
bull Recent Accident-Years Favorable Development Pattern Lagging Past Highly Redundant AYs
(27) (21)(19) (16) (9)
(5) 00 1
0
10
20
30
40
50
60
70
80
90
100
2007 2008 2009 2010 2011 2012 2013 2014 2015
()
Accident-Year Loss and LAE Ratio Development
Current LR Est Original LR Est
LR ndash Loss ratio Note Propertycasualty industry aggregate MPLI claims made
Source SNL Financial Fitch
Change Current
LR Versus Original
28
MPLI Reserve Adequacy
Key Considerations
bull Likelihood of Balance Sheet Reported Reserves to Develop HigherLower over Time
bull Stress Test Capital Impact of Potential Deficiencies
Analytical Tools
bull Project Reserve Adequacy Using Loss Development Methods (PaidCase Incurred)
bull Accident-Year Ratio Analysis
29
Reserve Adequacy mdash MPLI
bull Initial Analysis of Industry 2016 Reserves
bull MPLI Claims Made and Occurrence Reserves Still 5ndash7 Redundant ($14 Billionndash$20 Billion)
(09)
(09)(20)
(20) (34) (37) (20)
0
10
20
30
40
50
60
70
80
90
2007 2008 2009 2010 2011 2012 2013 2014 2015 2016
()
Estimated Reserve Adequacy mdash Paid Development Method
Reported Loss Ratio Projected Loss Ratio
Note Propertycasualty industry aggregate MPLI claims made
Source SNL Financial
Accident-Year Loss
Ratio Redundant
30
MPLI Reserve Ratio Analysis mdash Accident-Year PaidIncurred
bull At Same Period of Development Paid to Incurred Losses Should Be Similar Across Accident Years
bull HigherLower Paid to Incurred for One Accident Year Versus Others Indicative of Reserve
WeaknessStrength
PropertyCasualty Industry mdash Medical Malpractice Claims Made( PaidIncurred)
Months of Development
Accident Year 12 24 36 48 60 72 84 96 108 120
2007 33 182 378 540 692 788 865 902 932 962
2008 37 189 391 568 712 817 862 899 945 mdash
2009 38 203 405 580 719 806 857 928 mdash mdash
2010 41 206 408 576 713 816 871 mdash mdash mdash
2011 39 202 420 577 731 831 mdash mdash mdash mdash
2012 38 219 420 607 743 mdash mdash mdash mdash mdash
2013 45 218 442 615 mdash mdash mdash mdash mdash mdash
2014 44 218 430 mdash mdash mdash mdash mdash mdash mdash
2015 40 207 mdash mdash mdash mdash mdash mdash mdash mdash
2016 43 mdash mdash mdash mdash mdash mdash mdash mdash mdash
Average 40 205 412 580 718 811 864 909 939 mdash
Difference 03 02 18 34 25 19 07 18 06 mdash
Source SNL Financial
31
(50)
(40)
(30)
(20)
(10)
0
10
20
30
10 15 20 25 30 35
(PaidIncurred Losses at 24 Months )
Source SNL Financial
( Incurred Losses Deficient[Redundant])
Historical Accident-Year Reserve Development Related to Paid Levels(Accident Years 1987ndash2011)
Correlation = 92
R-Squared = 84
Reserve Ratio Analysis mdash Accident-Year PaidIncurred
Analysis of Industry MPLI Claims Made for Accident Years 1987ndash2011
bull LowerHigher Cumulative Paid Loss Levels Relative to Incurred Losses at Early Periods of
Development Related to Ultimate Loss Experience
Deficient
Redundant
32
MPLI Reserve Ratio Analysis mdash Accident-Year IBNRIncurred
bull At Same Period of Development Incurred but Not Reported (IBNR) to Incurred Should Be Similar
Across Accident Years
bull LowerHigher IBNR Levels for One AY Versus Others Indicative of Reserve WeaknessStrength
PropertyCasualty Industry mdash Medical Malpractice Claims Made( IBNRIncurred)
Months of Development
Accident Year 12 24 36 48 60 72 84 96 108 120
2007 616 382 264 177 110 69 35 21 16 11
2008 599 335 203 141 87 46 33 27 14 mdash
2009 599 330 207 142 93 54 39 20 mdash mdash
2010 588 321 181 121 79 47 33 mdash mdash mdash
2011 600 300 169 114 72 36 mdash mdash mdash mdash
2012 611 299 162 104 63 mdash mdash mdash mdash mdash
2013 605 296 168 106 mdash mdash mdash mdash mdash mdash
2014 615 334 194 mdash mdash mdash mdash mdash mdash mdash
2015 635 329 mdash mdash mdash mdash mdash mdash mdash mdash
2016 617 mdash mdash mdash mdash mdash mdash mdash mdash mdash
Average 608 325 194 129 84 50 35 22 15 mdash
Difference 08 04 01 (24) (21) (14) (03) (03) (01) mdash
Source SNL Financial
33
Reserve Adequacy mdash Ratio Analysis
(40)
(30)
(20)
(10)
0
10
20
30
0 5 10 15 20 25 30 35 40 45
(IBNRIncurred Losses at 24 Months )IBNR ndash Incurred but not reported
Source SNL Financial
( Incurred Losses Deficient[Redundant])
Historical Accident-Year Reserve Development Related to IBNR Levels(Accident Years 1987ndash2011)
Correlation = (78)
R-Squared = 74
Deficient
Redundant
Analysis of Industry MPLI Claims Made for Accident Years 1987ndash2011
bull HigherLower IBNR Levels Relative to Incurred Losses at Early Periods of Development Related
to Ultimate Loss Experience
34
ALL FITCH CREDIT RATINGS ARE SUBJECT TO CERTAIN LIMITATIONS AND DISCLAIMERS
PLEASE READ THESE LIMITATIONS AND DISCLAIMERS BY FOLLOWING THIS LINK
HTTPSFITCHRATINGSCOMUNDERSTANDINGCREDITRATINGS IN ADDITION RATING
DEFINITIONS AND THE TERMS OF USE OF SUCH RATINGS ARE AVAILABLE ON THE
AGENCYS PUBLIC WEB SITE
AT WWWFITCHRATINGSCOM PUBLISHED RATINGS CRITERIA AND METHODOLOGIES ARE
AVAILABLE FROM THIS SITE AT ALL TIMES FITCHS CODE OF CONDUCT CONFIDENTIALITY
CONFLICTS OF INTEREST AFFILIATE FIREWALL COMPLIANCE AND OTHER RELEVANT
POLICIES AND PROCEDURES ARE ALSO AVAILABLE FROM THE CODE OF CONDUCT
SECTION OF THIS SITE FITCH MAY HAVE PROVIDED ANOTHER PERMISSIBLE SERVICE TO
THE RATED ENTITY OR ITS RELATED THIRD PARTIES DETAILS OF THIS SERVICE FOR
RATINGS FOR WHICH THE LEAD ANALYST IS BASED IN AN EU-REGISTERED ENTITY CAN BE
FOUND ON THE ENTITY SUMMARY PAGE FOR THIS ISSUER ON THE FITCH WEBSITE
Copyright copy 2017 by Fitch Ratings Inc Fitch Ratings Ltd and its subsidiaries 33 Whitehall Street
NY NY 10004 Telephone 1-800-753-4824 (212) 908-0500 Fax (212) 480-4435 Reproduction or
retransmission in whole or in part is prohibited except by permission All rights reserved In issuing
and maintaining its ratings and in making other reports (including forecast information) Fitch relies on
factual information it receives from issuers and underwriters and from other sources Fitch believes to
be credible Fitch conducts a reasonable investigation of the factual information relied upon by it in
accordance with its ratings methodology and obtains reasonable verification of that information from
independent sources to the extent such sources are available for a given security or in a given
jurisdiction The manner of Fitchrsquos factual investigation and the scope of the third-party verification it
obtains will vary depending on the nature of the rated security and its issuer the requirements and
practices in the jurisdiction in which the rated security is offered and sold andor the issuer is located
the availability and nature of relevant public information access to the management of the issuer and
its advisers the availability of pre-existing third-party verifications such as audit reports agreed-upon
procedures letters appraisals actuarial reports engineering reports legal opinions and other reports
provided by third parties the availability of independent and competent third-party verification sources
with respect to the particular security or in the particular jurisdiction of the issuer and a variety of
other factors Users of Fitchrsquos ratings and reports should understand that neither an enhanced factual
investigation nor any third-party verification can ensure that all of the information Fitch relies on in
connection with a rating or a report will be accurate and complete Ultimately the issuer and its
advisers are responsible for the accuracy of the information they provide to Fitch and to the market in
offering documents and other reports In issuing its ratings and its reports Fitch must rely on the work
of experts including independent auditors with respect to financial statements and attorneys with
respect to legal and tax matters Further ratings and forecasts of financial and other information are
inherently forward-looking and embody assumptions and predictions about future events that by their
nature cannot be verified as facts As a result despite any verification of current facts ratings and
forecasts can be affected by future events or conditions that were not anticipated at the time a rating
or forecast was issued or affirmed
The information in this report is provided ldquoas isrdquo without any representation or warranty of any kind
and Fitch does not represent or warrant that the report or any of its contents will meet any of the
requirements of a recipient of the report A Fitch rating is an opinion as to the creditworthiness of a
security This opinion and reports made by Fitch are based on established criteria and methodologies
that Fitch is continuously evaluating and updating Therefore ratings and reports are the collective
work product of Fitch and no individual or group of individuals is solely responsible for a rating or a
report The rating does not address the risk of loss due to risks other than credit risk unless such risk
is specifically mentioned Fitch is not engaged in the offer or sale of any security All Fitch reports
have shared authorship Individuals identified in a Fitch report were involved in but are not solely
responsible for the opinions stated therein The individuals are named for contact purposes only A
report providing a Fitch rating is neither a prospectus nor a substitute for the information assembled
verified and presented to investors by the issuer and its agents in connection with the sale of the
securities Ratings may be changed or withdrawn at any time for any reason in the sole discretion of
Fitch Fitch does not provide investment advice of any sort Ratings are not a recommendation to buy
sell or hold any security Ratings do not comment on the adequacy of market price the suitability of
any security for a particular investor or the tax-exempt nature or taxability of payments made in
respect to any security Fitch receives fees from issuers insurers guarantors other obligors and
underwriters for rating securities Such fees generally vary from US$1000 to US$750000 (or the
applicable currency equivalent) per issue In certain cases Fitch will rate all or a number of issues
issued by a particular issuer or insured or guaranteed by a particular insurer or guarantor for a single
annual fee Such fees are expected to vary from US$10000 to US$1500000 (or the applicable
currency equivalent) The assignment publication or dissemination of a rating by Fitch shall not
constitute a consent by Fitch to use its name as an expert in connection with any registration
statement filed under the United States securities laws the Financial Services and Markets Act of
2000 of the United Kingdom or the securities laws of any particular jurisdiction Due to the relative
efficiency of electronic publishing and distribution Fitch research may be available to electronic
subscribers up to three days earlier than to print subscribers
For Australia New Zealand Taiwan and South Korea only Fitch Australia Pty Ltd holds an Australian
financial services license (AFS license no 337123) which authorizes it to provide credit ratings to
wholesale clients only Credit ratings information published by Fitch is not intended to be used by
persons who are retail clients within the meaning of the Corporations Act 2001
fitchratings
fitchratingscom
New York London33 Whitehall Street
New York NY 10004
30 North Colonnade
Canary Wharf
London E14 5GN

2
PropertyCasualty Rating Approach1
3
Fitch 2016 White Paper
Key Conclusion A lsquoAndashrsquo Insurer Financial Strength Rating from AM Best Is Most Comparable with a
lsquoBBBrsquo IFS Rating from Fitch (as well as SampP and Moodyrsquos)
bull Corporate Mission and Scope of Coverage
‒ AM Best mdash Insurance-Focused
‒ Fitch mdash Insurance and Corporates Financial Institutions Public Finance Sovereigns Structured
Finance
bull Rating Scale Differences
‒ Best mdash lsquoAndashrsquo 4th Highest Rating of 13 ratings
‒ Fitch mdash lsquoAndashrsquo 7th Highest of 19 ratings
bull Statistical Performance Results
‒ AM Best 10-year Impairment Rate at lsquoAndashrsquo is 67
‒ Fitch 10-year Default Rate at lsquoAndashrsquo is 20 (SampP and Moodyrsquos Have Similar Results)
‒ A 67 Impairment Rate Most Closely Aligns with Fitchrsquos lsquoBBBrsquo IFS Default Rate
4
Criteria Differences mdash Areas Where AM Best Often Assigns lsquoAndashrsquo IFS Rating When Fitch Would Initially
Rate in lsquoBBBrsquo Range
bull Newly Formed (Re)insurers
bull High Country RiskLow Sovereign Ratings
bull Captives
bull Smaller-Sized Insurers
Differences in lsquoAndashrsquo Ratings
5
Qualitative Factors
bull Industry Profile and Operating Environment
bull Business Profile
bull Ownership
bull Corporate Governance
bull Management
Rating MPLI Specialists mdash Important Credit Factors
Quantitative Factors
bull Capitalization and Leverage
bull Debt Service Capabilities and Financial
Flexibility
bull Financial Performance and Earnings
bull Investment and Asset Risk
bull Reserve Adequacy
bull Reinsurance Risk Mitigation and Catastrophe
Risk
6
Business Profile
Primary Considerations MPLI Specialistsrsquo Perspective
Competitive Positioning Within Broad Market and
Primary Product Segments
Highly Focused Product Expertise Strong Market
Share in Targeted State or Region
SizeScale of Capital and Revenues Moderate SizeScale (Surplus lt $1 Bil Premiums lt
$750 Mil)
Key Business Risks and Diversification Longer Tail Historically Volatile Business mdash Limited
Diversification
Competitive Threats to Long-Term Viability and
Profitability
Business Pressures From Changes in Broader
Healthcare Market
Source Fitch Ratings
7
00
02
04
06
08
0
5
10
15
20
2007 2008 2009 2010 2011 2012 2013 2014 2015 2016
($ Bil)
MPLI Specialists Operating Leverage
PHS NWP Operating Leverage (RHS)
PHS ndash Policyholders surplus NWP ndash Net premium written Note Aggregate for a group of 35 MPLI specialists
Source SNL Financial
(x)
Capitalization and Leverage
MPLI Specialists
bull Surplus Growth and Exposure Reduction over Last Decade
bull Very Strong Capital Measures (Operating Leverage RBC Fitch Stochastic Capital Model)
bull Low Financial Leverage mdash Limited Capital Access
8
Financial Performance and Earnings
MPLI Specialists
bull Recent Deterioration in Combined Ratios Evident Following Extended Period of Strong Results
bull Calendar-Year Versus Accident-Year Combined Ratio
bull Return on Surplus Declining from Underwriting and Investment Challenges
909
785 812 800 848
912 900 902 979 990
150
100
162 165
121
103 90 85
54 46
0
3
6
9
12
15
18
0
20
40
60
80
100
120
2007 2008 2009 2010 2011 2012 2013 2014 2015 2016
()
MPLI Specialistsrsquo Financial Performance and Earnings
Combined Ratio (LHS) Return on Surplus (RHS)
Note Aggregate for a group of 35 MPLI specialists
Source SNL Financial
()
9
Rating Navigator Tool
A Visual Overview of Key Factors Considered in IFS Ratings
10
MPLI Reserve Analysis2
11
Workers Comp24
Other Liability22
Commercial Multiperil
6
Reinsurance6
MPLI4
Homeowners4
Special Property
2Other
Reserves3
Source SNL Financial
PropertyCasualty Industry Loss Reserves YE 2016(Total Industry Reserves = $621 Bil)
Private
Passenger Auto
20
Commercial Auto
5
Financial
Guaranty
Mortgage
Insurance
2Product Liability
2
MPLI mdash Reserve Characteristics
bull Represent 44 of Industry 2016 Loss
Reserves
bull More Volatile Segment Versus Other PC Lines
bull Longer-Tail Claims Liabilities
bull Large Defense Costs Component to Claims
12
MPLI mdash Underwriting and Reserve Cyclicality
(60)
(40)
(20)
0
20
40
60
80
100
120
140
()
PropertyCasualty Industry Historical Accident-Year Results
Loss Ratio Change (Original Versus Latest Reported) Latest Loss Ratio Estimate
Note MPLI claims made
Source SNL Financial
13
Reserve Characteristics Volatility
MPLI Claims Made Has Higher Underwriting and Reserve Volatility than Nearly All Major PC Segments
Private Passenger Auto WCAll Lines
Commercial AutoCMP
HO
OL OCC
Specialty LiabilityMPLI CM
OL CM
Prod Liab Occ
0
5
10
15
20
25
30
0 5 10 15 20 25 30
(Average Loss Ratio Volatility )
Average Loss Ratio Volatility Versus Reserve Volatility by Segment
WC ndash Workers compensation CMP ndash Commercial multiperil HO ndash Homeowners OL OCC ndash Other liability ndash occurrence MPLI CM ndash Medical practice liability insurance claims made OL CM ndash Other
liability ndash claims made Liab OCC ndash Liability occurrence
Source SNL Financial Fitch
()
14
bull Slower Payout Versus Most PC Segments
bull Tail Risk Higher in Workersrsquo Compensation
Reserves Characteristics mdash Claims Duration
0
20
40
60
80
100
120
1 2 3 4 5 6 7 8 9 10
()
Loss Payment Pattern by Segment
Homeowners Workers Comp CMP MPLI CM
CMP ndash Commercial multiperil Note Propertycasualty industry aggregate
Source SNL Financial
(Years of Development)
15
bull Approximately 73 of Industry MPLI Reserves Are in Latest Four Accident Years 2013ndash2016
MPLI Reserve Composition
201624
201521
201416
201312
20128
20116
20104
20092
20082
20071 2006 and Prior
4
Source SNL Financial
Industry MPLI Reserves by Accident Year(73 of Reserves Relate to Accident-Years 2013ndash2016)
16
Large Litigation Component of MPLI Claims mdash Higher of Losses in Defense
and Cost Containment Costs
Reserve Characteristics mdash Defense Costs
0
5
10
15
20
25
30
35
MPLI CM MPLI OCC Other LiabilityCM
Other LiabilityOCC
CMP Workers Comp CommercialAuto
All Lines Personal Auto Homeowners
()
Defense and Cost Containment Costs of Total Net Incurred(Average Accident Years 2006ndash2015)
CM ndash Claims made OCC ndash Occurrence CMP ndash Commercial multiperil Note Propertycasualty industry aggregate data
Source SNL Financial
17
MPLI Reserve Analysis
bull Reserve Profile
bull Reserve Growth
bull Reserve Experience
bull Reserve Adequacy
18
Reserve Profile
Reserve Composition and Inherent Risk
bull Reserve Segment Mix and Diversification
bull Reserve Leverage
bull Reserve Risk Relative to Underwriting Risk
Implied Weighting of Reserves in Rating
Loss Reserves
Incurred Losses
Reserve Leverage
lt10 10ndash15 gt15
gt20 Medium High High
10ndash20 Medium Medium High
lt10 Low Medium Medium
19
MPLI Specialists Reserve Leverage Declining over Time with Surplus Growth
ReservesIncurred Ratio Very High mdash Implies Greater Capital Sensitivity to Reserve Changes than
Current Underwriting Period
MPLI Reserve Profile
00
05
10
15
20
25
0
3
6
9
12
15
18
2007 2008 2009 2010 2011 2012 2013 2014 2015 2016
($ Bil)
MPLI Specialists Reserve Leverage
PHS Reserves Reserve Leverage
PHS ndash Policyholders surplus Note Aggregate for a group of 35 MPLI specialists
Source SNL Financial
(x)
00
10
20
30
40
50
60
70
2007 2008 2009 2010 2011 2012 2013 2014 2015 2016
(x)ReservesCY Incurred Reserve Leverage
CY ndash Calendar year Note Aggregate for a group of 35 MPLI specialists
Source SNL Financial
MPLI Specialists Reserve Leverage Versus Reserves
CY Incurred
20
Over Long Term an Insurerrsquos Reserves Should Grow Commensurate with Exposures
Key Ratios
bull Calendar-Year PaidCalendar-Year Incurred Losses
bull ReservesEarned Premiums (Changes over Time)
MPLI Reserve Growth
00
02
04
06
08
10
12
14
2007 2008 2009 2010 2011 2012 2013 2014 2015 2016
(x)
Note Aggregate for a group of 35 MPLI specialists Calendar-year paid and incurred losses
Source SNL Financial
Paid gt Incurred Loss Indicative of
Reserve Weakness but Incurred
Influence by Reserve Takedowns
MPLI Specialists Reserve Growth Indications(PaidIncurred Losses)
30
31
32
33
34
2007 2008 2009 2010 2011 2012 2013 2014 2015 2016
(x)
Note Aggregate for a group of 35 MPLI specialists
Source SNL Financial
Stable Ratio = Reserve
Changes Keeping Pace
with Premium Changes
MPLI Specialists Reserve Growth Indications(ReservesEarned Premium)
21
Key Ratios
bull Calendar Year
‒ One Year Development Prior-Year Reserves
‒ One Year Development Prior-Year Surplus
‒ One Year Development Earned Premiums
bull Accident Year
‒ Current Loss Ratio Estimate Versus Original Estimate
‒ Accident-Year Development History and Trends
MPLI Reserve Experience
22
Reserve Experience mdash Favorable MPLI Development
bull Reserve Development Still Highly Favorable but Slowing Considerably
196
237228
266
221206
245
198
166
116
0
5
10
15
20
25
30
2007 2008 2009 2010 2011 2012 2013 2014 2015 2016
( of Earned Premiums)
MPLI Calendar-Year Reserve Development
Note Excludes MCIC Vermont Propertycasualty industry aggregate
Source SNL Financial
Favorable
Development
23
Reserve Experience mdash Calendar-Year Development
bull MPLI Development Greatly Exceeds Other Commercial Lines Segments over Last Decade
bull Magnitude of Favorable Development in MPLI Declining
(30)
(25)
(20)
(15)
(10)
(5)
0
5
10
15
Commercial Auto Other Liability mdash Claims Made Other Liability mdash Occurrence MPLI mdash Claims Made Workers Compensation
() 2012 2013 2014 2015 2016
Source SNL Financial
Segment Calendar-Year Development as a of Earned Premium mdash (Favorable)Unfavorable
24
Favorable Reserve Development Slowing
(5)
0
5
10
15
20
2015 2014 2013 2012 2011 2010 2009 2008 2007 2006 2005 2004 2003
12ndash24 Months 24ndash36 Months 36ndash48 Months
Note Propertycasualty industry aggregate MPLI claims made
Source SNL Financial
( Favorable[Unfavorable])
Favorable MPLI Accident-Year Development Slowing mdash Change in Loss Ratio
25
Favorable Reserve Development Slowing
0
10
20
30
40
50
60
70
80
90
2015 2014 2013 2012 2011 2010 2009 2008 2007
()
Accident-Year Loss Ratio Changes by Time of Development
12 Months 24 Months 36 Months 48 Months 60 Months 72 Months 84 Months 96 Months 108 Months 120 Months
Note Industry aggregate MPLI claims made
Source SNL Financial
26
Accident-Year Loss Ratio
bull Claims Made Accident-Year Loss Ratio Rising
bull Will Recent Accident-Years Develop Downward Like 2003ndash2010
510 574
619 672
736 788
829 859 886 867
0
10
20
30
40
50
60
70
80
90
100
2007 2008 2009 2010 2011 2012 2013 2014 2015 2016
()
Accident-Year Loss and LAE Ratio(Current Loss Ratio Estimate)
Note Propertycasualty industry aggregate MPLI claims made
Source SNL Financial Fitch
27
Accident-Year Loss Ratio Development
bull Recent Accident-Years Favorable Development Pattern Lagging Past Highly Redundant AYs
(27) (21)(19) (16) (9)
(5) 00 1
0
10
20
30
40
50
60
70
80
90
100
2007 2008 2009 2010 2011 2012 2013 2014 2015
()
Accident-Year Loss and LAE Ratio Development
Current LR Est Original LR Est
LR ndash Loss ratio Note Propertycasualty industry aggregate MPLI claims made
Source SNL Financial Fitch
Change Current
LR Versus Original
28
MPLI Reserve Adequacy
Key Considerations
bull Likelihood of Balance Sheet Reported Reserves to Develop HigherLower over Time
bull Stress Test Capital Impact of Potential Deficiencies
Analytical Tools
bull Project Reserve Adequacy Using Loss Development Methods (PaidCase Incurred)
bull Accident-Year Ratio Analysis
29
Reserve Adequacy mdash MPLI
bull Initial Analysis of Industry 2016 Reserves
bull MPLI Claims Made and Occurrence Reserves Still 5ndash7 Redundant ($14 Billionndash$20 Billion)
(09)
(09)(20)
(20) (34) (37) (20)
0
10
20
30
40
50
60
70
80
90
2007 2008 2009 2010 2011 2012 2013 2014 2015 2016
()
Estimated Reserve Adequacy mdash Paid Development Method
Reported Loss Ratio Projected Loss Ratio
Note Propertycasualty industry aggregate MPLI claims made
Source SNL Financial
Accident-Year Loss
Ratio Redundant
30
MPLI Reserve Ratio Analysis mdash Accident-Year PaidIncurred
bull At Same Period of Development Paid to Incurred Losses Should Be Similar Across Accident Years
bull HigherLower Paid to Incurred for One Accident Year Versus Others Indicative of Reserve
WeaknessStrength
PropertyCasualty Industry mdash Medical Malpractice Claims Made( PaidIncurred)
Months of Development
Accident Year 12 24 36 48 60 72 84 96 108 120
2007 33 182 378 540 692 788 865 902 932 962
2008 37 189 391 568 712 817 862 899 945 mdash
2009 38 203 405 580 719 806 857 928 mdash mdash
2010 41 206 408 576 713 816 871 mdash mdash mdash
2011 39 202 420 577 731 831 mdash mdash mdash mdash
2012 38 219 420 607 743 mdash mdash mdash mdash mdash
2013 45 218 442 615 mdash mdash mdash mdash mdash mdash
2014 44 218 430 mdash mdash mdash mdash mdash mdash mdash
2015 40 207 mdash mdash mdash mdash mdash mdash mdash mdash
2016 43 mdash mdash mdash mdash mdash mdash mdash mdash mdash
Average 40 205 412 580 718 811 864 909 939 mdash
Difference 03 02 18 34 25 19 07 18 06 mdash
Source SNL Financial
31
(50)
(40)
(30)
(20)
(10)
0
10
20
30
10 15 20 25 30 35
(PaidIncurred Losses at 24 Months )
Source SNL Financial
( Incurred Losses Deficient[Redundant])
Historical Accident-Year Reserve Development Related to Paid Levels(Accident Years 1987ndash2011)
Correlation = 92
R-Squared = 84
Reserve Ratio Analysis mdash Accident-Year PaidIncurred
Analysis of Industry MPLI Claims Made for Accident Years 1987ndash2011
bull LowerHigher Cumulative Paid Loss Levels Relative to Incurred Losses at Early Periods of
Development Related to Ultimate Loss Experience
Deficient
Redundant
32
MPLI Reserve Ratio Analysis mdash Accident-Year IBNRIncurred
bull At Same Period of Development Incurred but Not Reported (IBNR) to Incurred Should Be Similar
Across Accident Years
bull LowerHigher IBNR Levels for One AY Versus Others Indicative of Reserve WeaknessStrength
PropertyCasualty Industry mdash Medical Malpractice Claims Made( IBNRIncurred)
Months of Development
Accident Year 12 24 36 48 60 72 84 96 108 120
2007 616 382 264 177 110 69 35 21 16 11
2008 599 335 203 141 87 46 33 27 14 mdash
2009 599 330 207 142 93 54 39 20 mdash mdash
2010 588 321 181 121 79 47 33 mdash mdash mdash
2011 600 300 169 114 72 36 mdash mdash mdash mdash
2012 611 299 162 104 63 mdash mdash mdash mdash mdash
2013 605 296 168 106 mdash mdash mdash mdash mdash mdash
2014 615 334 194 mdash mdash mdash mdash mdash mdash mdash
2015 635 329 mdash mdash mdash mdash mdash mdash mdash mdash
2016 617 mdash mdash mdash mdash mdash mdash mdash mdash mdash
Average 608 325 194 129 84 50 35 22 15 mdash
Difference 08 04 01 (24) (21) (14) (03) (03) (01) mdash
Source SNL Financial
33
Reserve Adequacy mdash Ratio Analysis
(40)
(30)
(20)
(10)
0
10
20
30
0 5 10 15 20 25 30 35 40 45
(IBNRIncurred Losses at 24 Months )IBNR ndash Incurred but not reported
Source SNL Financial
( Incurred Losses Deficient[Redundant])
Historical Accident-Year Reserve Development Related to IBNR Levels(Accident Years 1987ndash2011)
Correlation = (78)
R-Squared = 74
Deficient
Redundant
Analysis of Industry MPLI Claims Made for Accident Years 1987ndash2011
bull HigherLower IBNR Levels Relative to Incurred Losses at Early Periods of Development Related
to Ultimate Loss Experience
34
ALL FITCH CREDIT RATINGS ARE SUBJECT TO CERTAIN LIMITATIONS AND DISCLAIMERS
PLEASE READ THESE LIMITATIONS AND DISCLAIMERS BY FOLLOWING THIS LINK
HTTPSFITCHRATINGSCOMUNDERSTANDINGCREDITRATINGS IN ADDITION RATING
DEFINITIONS AND THE TERMS OF USE OF SUCH RATINGS ARE AVAILABLE ON THE
AGENCYS PUBLIC WEB SITE
AT WWWFITCHRATINGSCOM PUBLISHED RATINGS CRITERIA AND METHODOLOGIES ARE
AVAILABLE FROM THIS SITE AT ALL TIMES FITCHS CODE OF CONDUCT CONFIDENTIALITY
CONFLICTS OF INTEREST AFFILIATE FIREWALL COMPLIANCE AND OTHER RELEVANT
POLICIES AND PROCEDURES ARE ALSO AVAILABLE FROM THE CODE OF CONDUCT
SECTION OF THIS SITE FITCH MAY HAVE PROVIDED ANOTHER PERMISSIBLE SERVICE TO
THE RATED ENTITY OR ITS RELATED THIRD PARTIES DETAILS OF THIS SERVICE FOR
RATINGS FOR WHICH THE LEAD ANALYST IS BASED IN AN EU-REGISTERED ENTITY CAN BE
FOUND ON THE ENTITY SUMMARY PAGE FOR THIS ISSUER ON THE FITCH WEBSITE
Copyright copy 2017 by Fitch Ratings Inc Fitch Ratings Ltd and its subsidiaries 33 Whitehall Street
NY NY 10004 Telephone 1-800-753-4824 (212) 908-0500 Fax (212) 480-4435 Reproduction or
retransmission in whole or in part is prohibited except by permission All rights reserved In issuing
and maintaining its ratings and in making other reports (including forecast information) Fitch relies on
factual information it receives from issuers and underwriters and from other sources Fitch believes to
be credible Fitch conducts a reasonable investigation of the factual information relied upon by it in
accordance with its ratings methodology and obtains reasonable verification of that information from
independent sources to the extent such sources are available for a given security or in a given
jurisdiction The manner of Fitchrsquos factual investigation and the scope of the third-party verification it
obtains will vary depending on the nature of the rated security and its issuer the requirements and
practices in the jurisdiction in which the rated security is offered and sold andor the issuer is located
the availability and nature of relevant public information access to the management of the issuer and
its advisers the availability of pre-existing third-party verifications such as audit reports agreed-upon
procedures letters appraisals actuarial reports engineering reports legal opinions and other reports
provided by third parties the availability of independent and competent third-party verification sources
with respect to the particular security or in the particular jurisdiction of the issuer and a variety of
other factors Users of Fitchrsquos ratings and reports should understand that neither an enhanced factual
investigation nor any third-party verification can ensure that all of the information Fitch relies on in
connection with a rating or a report will be accurate and complete Ultimately the issuer and its
advisers are responsible for the accuracy of the information they provide to Fitch and to the market in
offering documents and other reports In issuing its ratings and its reports Fitch must rely on the work
of experts including independent auditors with respect to financial statements and attorneys with
respect to legal and tax matters Further ratings and forecasts of financial and other information are
inherently forward-looking and embody assumptions and predictions about future events that by their
nature cannot be verified as facts As a result despite any verification of current facts ratings and
forecasts can be affected by future events or conditions that were not anticipated at the time a rating
or forecast was issued or affirmed
The information in this report is provided ldquoas isrdquo without any representation or warranty of any kind
and Fitch does not represent or warrant that the report or any of its contents will meet any of the
requirements of a recipient of the report A Fitch rating is an opinion as to the creditworthiness of a
security This opinion and reports made by Fitch are based on established criteria and methodologies
that Fitch is continuously evaluating and updating Therefore ratings and reports are the collective
work product of Fitch and no individual or group of individuals is solely responsible for a rating or a
report The rating does not address the risk of loss due to risks other than credit risk unless such risk
is specifically mentioned Fitch is not engaged in the offer or sale of any security All Fitch reports
have shared authorship Individuals identified in a Fitch report were involved in but are not solely
responsible for the opinions stated therein The individuals are named for contact purposes only A
report providing a Fitch rating is neither a prospectus nor a substitute for the information assembled
verified and presented to investors by the issuer and its agents in connection with the sale of the
securities Ratings may be changed or withdrawn at any time for any reason in the sole discretion of
Fitch Fitch does not provide investment advice of any sort Ratings are not a recommendation to buy
sell or hold any security Ratings do not comment on the adequacy of market price the suitability of
any security for a particular investor or the tax-exempt nature or taxability of payments made in
respect to any security Fitch receives fees from issuers insurers guarantors other obligors and
underwriters for rating securities Such fees generally vary from US$1000 to US$750000 (or the
applicable currency equivalent) per issue In certain cases Fitch will rate all or a number of issues
issued by a particular issuer or insured or guaranteed by a particular insurer or guarantor for a single
annual fee Such fees are expected to vary from US$10000 to US$1500000 (or the applicable
currency equivalent) The assignment publication or dissemination of a rating by Fitch shall not
constitute a consent by Fitch to use its name as an expert in connection with any registration
statement filed under the United States securities laws the Financial Services and Markets Act of
2000 of the United Kingdom or the securities laws of any particular jurisdiction Due to the relative
efficiency of electronic publishing and distribution Fitch research may be available to electronic
subscribers up to three days earlier than to print subscribers
For Australia New Zealand Taiwan and South Korea only Fitch Australia Pty Ltd holds an Australian
financial services license (AFS license no 337123) which authorizes it to provide credit ratings to
wholesale clients only Credit ratings information published by Fitch is not intended to be used by
persons who are retail clients within the meaning of the Corporations Act 2001
fitchratings
fitchratingscom
New York London33 Whitehall Street
New York NY 10004
30 North Colonnade
Canary Wharf
London E14 5GN
3
Fitch 2016 White Paper
Key Conclusion A lsquoAndashrsquo Insurer Financial Strength Rating from AM Best Is Most Comparable with a
lsquoBBBrsquo IFS Rating from Fitch (as well as SampP and Moodyrsquos)
bull Corporate Mission and Scope of Coverage
‒ AM Best mdash Insurance-Focused
‒ Fitch mdash Insurance and Corporates Financial Institutions Public Finance Sovereigns Structured
Finance
bull Rating Scale Differences
‒ Best mdash lsquoAndashrsquo 4th Highest Rating of 13 ratings
‒ Fitch mdash lsquoAndashrsquo 7th Highest of 19 ratings
bull Statistical Performance Results
‒ AM Best 10-year Impairment Rate at lsquoAndashrsquo is 67
‒ Fitch 10-year Default Rate at lsquoAndashrsquo is 20 (SampP and Moodyrsquos Have Similar Results)
‒ A 67 Impairment Rate Most Closely Aligns with Fitchrsquos lsquoBBBrsquo IFS Default Rate
4
Criteria Differences mdash Areas Where AM Best Often Assigns lsquoAndashrsquo IFS Rating When Fitch Would Initially
Rate in lsquoBBBrsquo Range
bull Newly Formed (Re)insurers
bull High Country RiskLow Sovereign Ratings
bull Captives
bull Smaller-Sized Insurers
Differences in lsquoAndashrsquo Ratings
5
Qualitative Factors
bull Industry Profile and Operating Environment
bull Business Profile
bull Ownership
bull Corporate Governance
bull Management
Rating MPLI Specialists mdash Important Credit Factors
Quantitative Factors
bull Capitalization and Leverage
bull Debt Service Capabilities and Financial
Flexibility
bull Financial Performance and Earnings
bull Investment and Asset Risk
bull Reserve Adequacy
bull Reinsurance Risk Mitigation and Catastrophe
Risk
6
Business Profile
Primary Considerations MPLI Specialistsrsquo Perspective
Competitive Positioning Within Broad Market and
Primary Product Segments
Highly Focused Product Expertise Strong Market
Share in Targeted State or Region
SizeScale of Capital and Revenues Moderate SizeScale (Surplus lt $1 Bil Premiums lt
$750 Mil)
Key Business Risks and Diversification Longer Tail Historically Volatile Business mdash Limited
Diversification
Competitive Threats to Long-Term Viability and
Profitability
Business Pressures From Changes in Broader
Healthcare Market
Source Fitch Ratings
7
00
02
04
06
08
0
5
10
15
20
2007 2008 2009 2010 2011 2012 2013 2014 2015 2016
($ Bil)
MPLI Specialists Operating Leverage
PHS NWP Operating Leverage (RHS)
PHS ndash Policyholders surplus NWP ndash Net premium written Note Aggregate for a group of 35 MPLI specialists
Source SNL Financial
(x)
Capitalization and Leverage
MPLI Specialists
bull Surplus Growth and Exposure Reduction over Last Decade
bull Very Strong Capital Measures (Operating Leverage RBC Fitch Stochastic Capital Model)
bull Low Financial Leverage mdash Limited Capital Access
8
Financial Performance and Earnings
MPLI Specialists
bull Recent Deterioration in Combined Ratios Evident Following Extended Period of Strong Results
bull Calendar-Year Versus Accident-Year Combined Ratio
bull Return on Surplus Declining from Underwriting and Investment Challenges
909
785 812 800 848
912 900 902 979 990
150
100
162 165
121
103 90 85
54 46
0
3
6
9
12
15
18
0
20
40
60
80
100
120
2007 2008 2009 2010 2011 2012 2013 2014 2015 2016
()
MPLI Specialistsrsquo Financial Performance and Earnings
Combined Ratio (LHS) Return on Surplus (RHS)
Note Aggregate for a group of 35 MPLI specialists
Source SNL Financial
()
9
Rating Navigator Tool
A Visual Overview of Key Factors Considered in IFS Ratings
10
MPLI Reserve Analysis2
11
Workers Comp24
Other Liability22
Commercial Multiperil
6
Reinsurance6
MPLI4
Homeowners4
Special Property
2Other
Reserves3
Source SNL Financial
PropertyCasualty Industry Loss Reserves YE 2016(Total Industry Reserves = $621 Bil)
Private
Passenger Auto
20
Commercial Auto
5
Financial
Guaranty
Mortgage
Insurance
2Product Liability
2
MPLI mdash Reserve Characteristics
bull Represent 44 of Industry 2016 Loss
Reserves
bull More Volatile Segment Versus Other PC Lines
bull Longer-Tail Claims Liabilities
bull Large Defense Costs Component to Claims
12
MPLI mdash Underwriting and Reserve Cyclicality
(60)
(40)
(20)
0
20
40
60
80
100
120
140
()
PropertyCasualty Industry Historical Accident-Year Results
Loss Ratio Change (Original Versus Latest Reported) Latest Loss Ratio Estimate
Note MPLI claims made
Source SNL Financial
13
Reserve Characteristics Volatility
MPLI Claims Made Has Higher Underwriting and Reserve Volatility than Nearly All Major PC Segments
Private Passenger Auto WCAll Lines
Commercial AutoCMP
HO
OL OCC
Specialty LiabilityMPLI CM
OL CM
Prod Liab Occ
0
5
10
15
20
25
30
0 5 10 15 20 25 30
(Average Loss Ratio Volatility )
Average Loss Ratio Volatility Versus Reserve Volatility by Segment
WC ndash Workers compensation CMP ndash Commercial multiperil HO ndash Homeowners OL OCC ndash Other liability ndash occurrence MPLI CM ndash Medical practice liability insurance claims made OL CM ndash Other
liability ndash claims made Liab OCC ndash Liability occurrence
Source SNL Financial Fitch
()
14
bull Slower Payout Versus Most PC Segments
bull Tail Risk Higher in Workersrsquo Compensation
Reserves Characteristics mdash Claims Duration
0
20
40
60
80
100
120
1 2 3 4 5 6 7 8 9 10
()
Loss Payment Pattern by Segment
Homeowners Workers Comp CMP MPLI CM
CMP ndash Commercial multiperil Note Propertycasualty industry aggregate
Source SNL Financial
(Years of Development)
15
bull Approximately 73 of Industry MPLI Reserves Are in Latest Four Accident Years 2013ndash2016
MPLI Reserve Composition
201624
201521
201416
201312
20128
20116
20104
20092
20082
20071 2006 and Prior
4
Source SNL Financial
Industry MPLI Reserves by Accident Year(73 of Reserves Relate to Accident-Years 2013ndash2016)
16
Large Litigation Component of MPLI Claims mdash Higher of Losses in Defense
and Cost Containment Costs
Reserve Characteristics mdash Defense Costs
0
5
10
15
20
25
30
35
MPLI CM MPLI OCC Other LiabilityCM
Other LiabilityOCC
CMP Workers Comp CommercialAuto
All Lines Personal Auto Homeowners
()
Defense and Cost Containment Costs of Total Net Incurred(Average Accident Years 2006ndash2015)
CM ndash Claims made OCC ndash Occurrence CMP ndash Commercial multiperil Note Propertycasualty industry aggregate data
Source SNL Financial
17
MPLI Reserve Analysis
bull Reserve Profile
bull Reserve Growth
bull Reserve Experience
bull Reserve Adequacy
18
Reserve Profile
Reserve Composition and Inherent Risk
bull Reserve Segment Mix and Diversification
bull Reserve Leverage
bull Reserve Risk Relative to Underwriting Risk
Implied Weighting of Reserves in Rating
Loss Reserves
Incurred Losses
Reserve Leverage
lt10 10ndash15 gt15
gt20 Medium High High
10ndash20 Medium Medium High
lt10 Low Medium Medium
19
MPLI Specialists Reserve Leverage Declining over Time with Surplus Growth
ReservesIncurred Ratio Very High mdash Implies Greater Capital Sensitivity to Reserve Changes than
Current Underwriting Period
MPLI Reserve Profile
00
05
10
15
20
25
0
3
6
9
12
15
18
2007 2008 2009 2010 2011 2012 2013 2014 2015 2016
($ Bil)
MPLI Specialists Reserve Leverage
PHS Reserves Reserve Leverage
PHS ndash Policyholders surplus Note Aggregate for a group of 35 MPLI specialists
Source SNL Financial
(x)
00
10
20
30
40
50
60
70
2007 2008 2009 2010 2011 2012 2013 2014 2015 2016
(x)ReservesCY Incurred Reserve Leverage
CY ndash Calendar year Note Aggregate for a group of 35 MPLI specialists
Source SNL Financial
MPLI Specialists Reserve Leverage Versus Reserves
CY Incurred
20
Over Long Term an Insurerrsquos Reserves Should Grow Commensurate with Exposures
Key Ratios
bull Calendar-Year PaidCalendar-Year Incurred Losses
bull ReservesEarned Premiums (Changes over Time)
MPLI Reserve Growth
00
02
04
06
08
10
12
14
2007 2008 2009 2010 2011 2012 2013 2014 2015 2016
(x)
Note Aggregate for a group of 35 MPLI specialists Calendar-year paid and incurred losses
Source SNL Financial
Paid gt Incurred Loss Indicative of
Reserve Weakness but Incurred
Influence by Reserve Takedowns
MPLI Specialists Reserve Growth Indications(PaidIncurred Losses)
30
31
32
33
34
2007 2008 2009 2010 2011 2012 2013 2014 2015 2016
(x)
Note Aggregate for a group of 35 MPLI specialists
Source SNL Financial
Stable Ratio = Reserve
Changes Keeping Pace
with Premium Changes
MPLI Specialists Reserve Growth Indications(ReservesEarned Premium)
21
Key Ratios
bull Calendar Year
‒ One Year Development Prior-Year Reserves
‒ One Year Development Prior-Year Surplus
‒ One Year Development Earned Premiums
bull Accident Year
‒ Current Loss Ratio Estimate Versus Original Estimate
‒ Accident-Year Development History and Trends
MPLI Reserve Experience
22
Reserve Experience mdash Favorable MPLI Development
bull Reserve Development Still Highly Favorable but Slowing Considerably
196
237228
266
221206
245
198
166
116
0
5
10
15
20
25
30
2007 2008 2009 2010 2011 2012 2013 2014 2015 2016
( of Earned Premiums)
MPLI Calendar-Year Reserve Development
Note Excludes MCIC Vermont Propertycasualty industry aggregate
Source SNL Financial
Favorable
Development
23
Reserve Experience mdash Calendar-Year Development
bull MPLI Development Greatly Exceeds Other Commercial Lines Segments over Last Decade
bull Magnitude of Favorable Development in MPLI Declining
(30)
(25)
(20)
(15)
(10)
(5)
0
5
10
15
Commercial Auto Other Liability mdash Claims Made Other Liability mdash Occurrence MPLI mdash Claims Made Workers Compensation
() 2012 2013 2014 2015 2016
Source SNL Financial
Segment Calendar-Year Development as a of Earned Premium mdash (Favorable)Unfavorable
24
Favorable Reserve Development Slowing
(5)
0
5
10
15
20
2015 2014 2013 2012 2011 2010 2009 2008 2007 2006 2005 2004 2003
12ndash24 Months 24ndash36 Months 36ndash48 Months
Note Propertycasualty industry aggregate MPLI claims made
Source SNL Financial
( Favorable[Unfavorable])
Favorable MPLI Accident-Year Development Slowing mdash Change in Loss Ratio
25
Favorable Reserve Development Slowing
0
10
20
30
40
50
60
70
80
90
2015 2014 2013 2012 2011 2010 2009 2008 2007
()
Accident-Year Loss Ratio Changes by Time of Development
12 Months 24 Months 36 Months 48 Months 60 Months 72 Months 84 Months 96 Months 108 Months 120 Months
Note Industry aggregate MPLI claims made
Source SNL Financial
26
Accident-Year Loss Ratio
bull Claims Made Accident-Year Loss Ratio Rising
bull Will Recent Accident-Years Develop Downward Like 2003ndash2010
510 574
619 672
736 788
829 859 886 867
0
10
20
30
40
50
60
70
80
90
100
2007 2008 2009 2010 2011 2012 2013 2014 2015 2016
()
Accident-Year Loss and LAE Ratio(Current Loss Ratio Estimate)
Note Propertycasualty industry aggregate MPLI claims made
Source SNL Financial Fitch
27
Accident-Year Loss Ratio Development
bull Recent Accident-Years Favorable Development Pattern Lagging Past Highly Redundant AYs
(27) (21)(19) (16) (9)
(5) 00 1
0
10
20
30
40
50
60
70
80
90
100
2007 2008 2009 2010 2011 2012 2013 2014 2015
()
Accident-Year Loss and LAE Ratio Development
Current LR Est Original LR Est
LR ndash Loss ratio Note Propertycasualty industry aggregate MPLI claims made
Source SNL Financial Fitch
Change Current
LR Versus Original
28
MPLI Reserve Adequacy
Key Considerations
bull Likelihood of Balance Sheet Reported Reserves to Develop HigherLower over Time
bull Stress Test Capital Impact of Potential Deficiencies
Analytical Tools
bull Project Reserve Adequacy Using Loss Development Methods (PaidCase Incurred)
bull Accident-Year Ratio Analysis
29
Reserve Adequacy mdash MPLI
bull Initial Analysis of Industry 2016 Reserves
bull MPLI Claims Made and Occurrence Reserves Still 5ndash7 Redundant ($14 Billionndash$20 Billion)
(09)
(09)(20)
(20) (34) (37) (20)
0
10
20
30
40
50
60
70
80
90
2007 2008 2009 2010 2011 2012 2013 2014 2015 2016
()
Estimated Reserve Adequacy mdash Paid Development Method
Reported Loss Ratio Projected Loss Ratio
Note Propertycasualty industry aggregate MPLI claims made
Source SNL Financial
Accident-Year Loss
Ratio Redundant
30
MPLI Reserve Ratio Analysis mdash Accident-Year PaidIncurred
bull At Same Period of Development Paid to Incurred Losses Should Be Similar Across Accident Years
bull HigherLower Paid to Incurred for One Accident Year Versus Others Indicative of Reserve
WeaknessStrength
PropertyCasualty Industry mdash Medical Malpractice Claims Made( PaidIncurred)
Months of Development
Accident Year 12 24 36 48 60 72 84 96 108 120
2007 33 182 378 540 692 788 865 902 932 962
2008 37 189 391 568 712 817 862 899 945 mdash
2009 38 203 405 580 719 806 857 928 mdash mdash
2010 41 206 408 576 713 816 871 mdash mdash mdash
2011 39 202 420 577 731 831 mdash mdash mdash mdash
2012 38 219 420 607 743 mdash mdash mdash mdash mdash
2013 45 218 442 615 mdash mdash mdash mdash mdash mdash
2014 44 218 430 mdash mdash mdash mdash mdash mdash mdash
2015 40 207 mdash mdash mdash mdash mdash mdash mdash mdash
2016 43 mdash mdash mdash mdash mdash mdash mdash mdash mdash
Average 40 205 412 580 718 811 864 909 939 mdash
Difference 03 02 18 34 25 19 07 18 06 mdash
Source SNL Financial
31
(50)
(40)
(30)
(20)
(10)
0
10
20
30
10 15 20 25 30 35
(PaidIncurred Losses at 24 Months )
Source SNL Financial
( Incurred Losses Deficient[Redundant])
Historical Accident-Year Reserve Development Related to Paid Levels(Accident Years 1987ndash2011)
Correlation = 92
R-Squared = 84
Reserve Ratio Analysis mdash Accident-Year PaidIncurred
Analysis of Industry MPLI Claims Made for Accident Years 1987ndash2011
bull LowerHigher Cumulative Paid Loss Levels Relative to Incurred Losses at Early Periods of
Development Related to Ultimate Loss Experience
Deficient
Redundant
32
MPLI Reserve Ratio Analysis mdash Accident-Year IBNRIncurred
bull At Same Period of Development Incurred but Not Reported (IBNR) to Incurred Should Be Similar
Across Accident Years
bull LowerHigher IBNR Levels for One AY Versus Others Indicative of Reserve WeaknessStrength
PropertyCasualty Industry mdash Medical Malpractice Claims Made( IBNRIncurred)
Months of Development
Accident Year 12 24 36 48 60 72 84 96 108 120
2007 616 382 264 177 110 69 35 21 16 11
2008 599 335 203 141 87 46 33 27 14 mdash
2009 599 330 207 142 93 54 39 20 mdash mdash
2010 588 321 181 121 79 47 33 mdash mdash mdash
2011 600 300 169 114 72 36 mdash mdash mdash mdash
2012 611 299 162 104 63 mdash mdash mdash mdash mdash
2013 605 296 168 106 mdash mdash mdash mdash mdash mdash
2014 615 334 194 mdash mdash mdash mdash mdash mdash mdash
2015 635 329 mdash mdash mdash mdash mdash mdash mdash mdash
2016 617 mdash mdash mdash mdash mdash mdash mdash mdash mdash
Average 608 325 194 129 84 50 35 22 15 mdash
Difference 08 04 01 (24) (21) (14) (03) (03) (01) mdash
Source SNL Financial
33
Reserve Adequacy mdash Ratio Analysis
(40)
(30)
(20)
(10)
0
10
20
30
0 5 10 15 20 25 30 35 40 45
(IBNRIncurred Losses at 24 Months )IBNR ndash Incurred but not reported
Source SNL Financial
( Incurred Losses Deficient[Redundant])
Historical Accident-Year Reserve Development Related to IBNR Levels(Accident Years 1987ndash2011)
Correlation = (78)
R-Squared = 74
Deficient
Redundant
Analysis of Industry MPLI Claims Made for Accident Years 1987ndash2011
bull HigherLower IBNR Levels Relative to Incurred Losses at Early Periods of Development Related
to Ultimate Loss Experience
34
ALL FITCH CREDIT RATINGS ARE SUBJECT TO CERTAIN LIMITATIONS AND DISCLAIMERS
PLEASE READ THESE LIMITATIONS AND DISCLAIMERS BY FOLLOWING THIS LINK
HTTPSFITCHRATINGSCOMUNDERSTANDINGCREDITRATINGS IN ADDITION RATING
DEFINITIONS AND THE TERMS OF USE OF SUCH RATINGS ARE AVAILABLE ON THE
AGENCYS PUBLIC WEB SITE
AT WWWFITCHRATINGSCOM PUBLISHED RATINGS CRITERIA AND METHODOLOGIES ARE
AVAILABLE FROM THIS SITE AT ALL TIMES FITCHS CODE OF CONDUCT CONFIDENTIALITY
CONFLICTS OF INTEREST AFFILIATE FIREWALL COMPLIANCE AND OTHER RELEVANT
POLICIES AND PROCEDURES ARE ALSO AVAILABLE FROM THE CODE OF CONDUCT
SECTION OF THIS SITE FITCH MAY HAVE PROVIDED ANOTHER PERMISSIBLE SERVICE TO
THE RATED ENTITY OR ITS RELATED THIRD PARTIES DETAILS OF THIS SERVICE FOR
RATINGS FOR WHICH THE LEAD ANALYST IS BASED IN AN EU-REGISTERED ENTITY CAN BE
FOUND ON THE ENTITY SUMMARY PAGE FOR THIS ISSUER ON THE FITCH WEBSITE
Copyright copy 2017 by Fitch Ratings Inc Fitch Ratings Ltd and its subsidiaries 33 Whitehall Street
NY NY 10004 Telephone 1-800-753-4824 (212) 908-0500 Fax (212) 480-4435 Reproduction or
retransmission in whole or in part is prohibited except by permission All rights reserved In issuing
and maintaining its ratings and in making other reports (including forecast information) Fitch relies on
factual information it receives from issuers and underwriters and from other sources Fitch believes to
be credible Fitch conducts a reasonable investigation of the factual information relied upon by it in
accordance with its ratings methodology and obtains reasonable verification of that information from
independent sources to the extent such sources are available for a given security or in a given
jurisdiction The manner of Fitchrsquos factual investigation and the scope of the third-party verification it
obtains will vary depending on the nature of the rated security and its issuer the requirements and
practices in the jurisdiction in which the rated security is offered and sold andor the issuer is located
the availability and nature of relevant public information access to the management of the issuer and
its advisers the availability of pre-existing third-party verifications such as audit reports agreed-upon
procedures letters appraisals actuarial reports engineering reports legal opinions and other reports
provided by third parties the availability of independent and competent third-party verification sources
with respect to the particular security or in the particular jurisdiction of the issuer and a variety of
other factors Users of Fitchrsquos ratings and reports should understand that neither an enhanced factual
investigation nor any third-party verification can ensure that all of the information Fitch relies on in
connection with a rating or a report will be accurate and complete Ultimately the issuer and its
advisers are responsible for the accuracy of the information they provide to Fitch and to the market in
offering documents and other reports In issuing its ratings and its reports Fitch must rely on the work
of experts including independent auditors with respect to financial statements and attorneys with
respect to legal and tax matters Further ratings and forecasts of financial and other information are
inherently forward-looking and embody assumptions and predictions about future events that by their
nature cannot be verified as facts As a result despite any verification of current facts ratings and
forecasts can be affected by future events or conditions that were not anticipated at the time a rating
or forecast was issued or affirmed
The information in this report is provided ldquoas isrdquo without any representation or warranty of any kind
and Fitch does not represent or warrant that the report or any of its contents will meet any of the
requirements of a recipient of the report A Fitch rating is an opinion as to the creditworthiness of a
security This opinion and reports made by Fitch are based on established criteria and methodologies
that Fitch is continuously evaluating and updating Therefore ratings and reports are the collective
work product of Fitch and no individual or group of individuals is solely responsible for a rating or a
report The rating does not address the risk of loss due to risks other than credit risk unless such risk
is specifically mentioned Fitch is not engaged in the offer or sale of any security All Fitch reports
have shared authorship Individuals identified in a Fitch report were involved in but are not solely
responsible for the opinions stated therein The individuals are named for contact purposes only A
report providing a Fitch rating is neither a prospectus nor a substitute for the information assembled
verified and presented to investors by the issuer and its agents in connection with the sale of the
securities Ratings may be changed or withdrawn at any time for any reason in the sole discretion of
Fitch Fitch does not provide investment advice of any sort Ratings are not a recommendation to buy
sell or hold any security Ratings do not comment on the adequacy of market price the suitability of
any security for a particular investor or the tax-exempt nature or taxability of payments made in
respect to any security Fitch receives fees from issuers insurers guarantors other obligors and
underwriters for rating securities Such fees generally vary from US$1000 to US$750000 (or the
applicable currency equivalent) per issue In certain cases Fitch will rate all or a number of issues
issued by a particular issuer or insured or guaranteed by a particular insurer or guarantor for a single
annual fee Such fees are expected to vary from US$10000 to US$1500000 (or the applicable
currency equivalent) The assignment publication or dissemination of a rating by Fitch shall not
constitute a consent by Fitch to use its name as an expert in connection with any registration
statement filed under the United States securities laws the Financial Services and Markets Act of
2000 of the United Kingdom or the securities laws of any particular jurisdiction Due to the relative
efficiency of electronic publishing and distribution Fitch research may be available to electronic
subscribers up to three days earlier than to print subscribers
For Australia New Zealand Taiwan and South Korea only Fitch Australia Pty Ltd holds an Australian
financial services license (AFS license no 337123) which authorizes it to provide credit ratings to
wholesale clients only Credit ratings information published by Fitch is not intended to be used by
persons who are retail clients within the meaning of the Corporations Act 2001
fitchratings
fitchratingscom
New York London33 Whitehall Street
New York NY 10004
30 North Colonnade
Canary Wharf
London E14 5GN
4
Criteria Differences mdash Areas Where AM Best Often Assigns lsquoAndashrsquo IFS Rating When Fitch Would Initially
Rate in lsquoBBBrsquo Range
bull Newly Formed (Re)insurers
bull High Country RiskLow Sovereign Ratings
bull Captives
bull Smaller-Sized Insurers
Differences in lsquoAndashrsquo Ratings
5
Qualitative Factors
bull Industry Profile and Operating Environment
bull Business Profile
bull Ownership
bull Corporate Governance
bull Management
Rating MPLI Specialists mdash Important Credit Factors
Quantitative Factors
bull Capitalization and Leverage
bull Debt Service Capabilities and Financial
Flexibility
bull Financial Performance and Earnings
bull Investment and Asset Risk
bull Reserve Adequacy
bull Reinsurance Risk Mitigation and Catastrophe
Risk
6
Business Profile
Primary Considerations MPLI Specialistsrsquo Perspective
Competitive Positioning Within Broad Market and
Primary Product Segments
Highly Focused Product Expertise Strong Market
Share in Targeted State or Region
SizeScale of Capital and Revenues Moderate SizeScale (Surplus lt $1 Bil Premiums lt
$750 Mil)
Key Business Risks and Diversification Longer Tail Historically Volatile Business mdash Limited
Diversification
Competitive Threats to Long-Term Viability and
Profitability
Business Pressures From Changes in Broader
Healthcare Market
Source Fitch Ratings
7
00
02
04
06
08
0
5
10
15
20
2007 2008 2009 2010 2011 2012 2013 2014 2015 2016
($ Bil)
MPLI Specialists Operating Leverage
PHS NWP Operating Leverage (RHS)
PHS ndash Policyholders surplus NWP ndash Net premium written Note Aggregate for a group of 35 MPLI specialists
Source SNL Financial
(x)
Capitalization and Leverage
MPLI Specialists
bull Surplus Growth and Exposure Reduction over Last Decade
bull Very Strong Capital Measures (Operating Leverage RBC Fitch Stochastic Capital Model)
bull Low Financial Leverage mdash Limited Capital Access
8
Financial Performance and Earnings
MPLI Specialists
bull Recent Deterioration in Combined Ratios Evident Following Extended Period of Strong Results
bull Calendar-Year Versus Accident-Year Combined Ratio
bull Return on Surplus Declining from Underwriting and Investment Challenges
909
785 812 800 848
912 900 902 979 990
150
100
162 165
121
103 90 85
54 46
0
3
6
9
12
15
18
0
20
40
60
80
100
120
2007 2008 2009 2010 2011 2012 2013 2014 2015 2016
()
MPLI Specialistsrsquo Financial Performance and Earnings
Combined Ratio (LHS) Return on Surplus (RHS)
Note Aggregate for a group of 35 MPLI specialists
Source SNL Financial
()
9
Rating Navigator Tool
A Visual Overview of Key Factors Considered in IFS Ratings
10
MPLI Reserve Analysis2
11
Workers Comp24
Other Liability22
Commercial Multiperil
6
Reinsurance6
MPLI4
Homeowners4
Special Property
2Other
Reserves3
Source SNL Financial
PropertyCasualty Industry Loss Reserves YE 2016(Total Industry Reserves = $621 Bil)
Private
Passenger Auto
20
Commercial Auto
5
Financial
Guaranty
Mortgage
Insurance
2Product Liability
2
MPLI mdash Reserve Characteristics
bull Represent 44 of Industry 2016 Loss
Reserves
bull More Volatile Segment Versus Other PC Lines
bull Longer-Tail Claims Liabilities
bull Large Defense Costs Component to Claims
12
MPLI mdash Underwriting and Reserve Cyclicality
(60)
(40)
(20)
0
20
40
60
80
100
120
140
()
PropertyCasualty Industry Historical Accident-Year Results
Loss Ratio Change (Original Versus Latest Reported) Latest Loss Ratio Estimate
Note MPLI claims made
Source SNL Financial
13
Reserve Characteristics Volatility
MPLI Claims Made Has Higher Underwriting and Reserve Volatility than Nearly All Major PC Segments
Private Passenger Auto WCAll Lines
Commercial AutoCMP
HO
OL OCC
Specialty LiabilityMPLI CM
OL CM
Prod Liab Occ
0
5
10
15
20
25
30
0 5 10 15 20 25 30
(Average Loss Ratio Volatility )
Average Loss Ratio Volatility Versus Reserve Volatility by Segment
WC ndash Workers compensation CMP ndash Commercial multiperil HO ndash Homeowners OL OCC ndash Other liability ndash occurrence MPLI CM ndash Medical practice liability insurance claims made OL CM ndash Other
liability ndash claims made Liab OCC ndash Liability occurrence
Source SNL Financial Fitch
()
14
bull Slower Payout Versus Most PC Segments
bull Tail Risk Higher in Workersrsquo Compensation
Reserves Characteristics mdash Claims Duration
0
20
40
60
80
100
120
1 2 3 4 5 6 7 8 9 10
()
Loss Payment Pattern by Segment
Homeowners Workers Comp CMP MPLI CM
CMP ndash Commercial multiperil Note Propertycasualty industry aggregate
Source SNL Financial
(Years of Development)
15
bull Approximately 73 of Industry MPLI Reserves Are in Latest Four Accident Years 2013ndash2016
MPLI Reserve Composition
201624
201521
201416
201312
20128
20116
20104
20092
20082
20071 2006 and Prior
4
Source SNL Financial
Industry MPLI Reserves by Accident Year(73 of Reserves Relate to Accident-Years 2013ndash2016)
16
Large Litigation Component of MPLI Claims mdash Higher of Losses in Defense
and Cost Containment Costs
Reserve Characteristics mdash Defense Costs
0
5
10
15
20
25
30
35
MPLI CM MPLI OCC Other LiabilityCM
Other LiabilityOCC
CMP Workers Comp CommercialAuto
All Lines Personal Auto Homeowners
()
Defense and Cost Containment Costs of Total Net Incurred(Average Accident Years 2006ndash2015)
CM ndash Claims made OCC ndash Occurrence CMP ndash Commercial multiperil Note Propertycasualty industry aggregate data
Source SNL Financial
17
MPLI Reserve Analysis
bull Reserve Profile
bull Reserve Growth
bull Reserve Experience
bull Reserve Adequacy
18
Reserve Profile
Reserve Composition and Inherent Risk
bull Reserve Segment Mix and Diversification
bull Reserve Leverage
bull Reserve Risk Relative to Underwriting Risk
Implied Weighting of Reserves in Rating
Loss Reserves
Incurred Losses
Reserve Leverage
lt10 10ndash15 gt15
gt20 Medium High High
10ndash20 Medium Medium High
lt10 Low Medium Medium
19
MPLI Specialists Reserve Leverage Declining over Time with Surplus Growth
ReservesIncurred Ratio Very High mdash Implies Greater Capital Sensitivity to Reserve Changes than
Current Underwriting Period
MPLI Reserve Profile
00
05
10
15
20
25
0
3
6
9
12
15
18
2007 2008 2009 2010 2011 2012 2013 2014 2015 2016
($ Bil)
MPLI Specialists Reserve Leverage
PHS Reserves Reserve Leverage
PHS ndash Policyholders surplus Note Aggregate for a group of 35 MPLI specialists
Source SNL Financial
(x)
00
10
20
30
40
50
60
70
2007 2008 2009 2010 2011 2012 2013 2014 2015 2016
(x)ReservesCY Incurred Reserve Leverage
CY ndash Calendar year Note Aggregate for a group of 35 MPLI specialists
Source SNL Financial
MPLI Specialists Reserve Leverage Versus Reserves
CY Incurred
20
Over Long Term an Insurerrsquos Reserves Should Grow Commensurate with Exposures
Key Ratios
bull Calendar-Year PaidCalendar-Year Incurred Losses
bull ReservesEarned Premiums (Changes over Time)
MPLI Reserve Growth
00
02
04
06
08
10
12
14
2007 2008 2009 2010 2011 2012 2013 2014 2015 2016
(x)
Note Aggregate for a group of 35 MPLI specialists Calendar-year paid and incurred losses
Source SNL Financial
Paid gt Incurred Loss Indicative of
Reserve Weakness but Incurred
Influence by Reserve Takedowns
MPLI Specialists Reserve Growth Indications(PaidIncurred Losses)
30
31
32
33
34
2007 2008 2009 2010 2011 2012 2013 2014 2015 2016
(x)
Note Aggregate for a group of 35 MPLI specialists
Source SNL Financial
Stable Ratio = Reserve
Changes Keeping Pace
with Premium Changes
MPLI Specialists Reserve Growth Indications(ReservesEarned Premium)
21
Key Ratios
bull Calendar Year
‒ One Year Development Prior-Year Reserves
‒ One Year Development Prior-Year Surplus
‒ One Year Development Earned Premiums
bull Accident Year
‒ Current Loss Ratio Estimate Versus Original Estimate
‒ Accident-Year Development History and Trends
MPLI Reserve Experience
22
Reserve Experience mdash Favorable MPLI Development
bull Reserve Development Still Highly Favorable but Slowing Considerably
196
237228
266
221206
245
198
166
116
0
5
10
15
20
25
30
2007 2008 2009 2010 2011 2012 2013 2014 2015 2016
( of Earned Premiums)
MPLI Calendar-Year Reserve Development
Note Excludes MCIC Vermont Propertycasualty industry aggregate
Source SNL Financial
Favorable
Development
23
Reserve Experience mdash Calendar-Year Development
bull MPLI Development Greatly Exceeds Other Commercial Lines Segments over Last Decade
bull Magnitude of Favorable Development in MPLI Declining
(30)
(25)
(20)
(15)
(10)
(5)
0
5
10
15
Commercial Auto Other Liability mdash Claims Made Other Liability mdash Occurrence MPLI mdash Claims Made Workers Compensation
() 2012 2013 2014 2015 2016
Source SNL Financial
Segment Calendar-Year Development as a of Earned Premium mdash (Favorable)Unfavorable
24
Favorable Reserve Development Slowing
(5)
0
5
10
15
20
2015 2014 2013 2012 2011 2010 2009 2008 2007 2006 2005 2004 2003
12ndash24 Months 24ndash36 Months 36ndash48 Months
Note Propertycasualty industry aggregate MPLI claims made
Source SNL Financial
( Favorable[Unfavorable])
Favorable MPLI Accident-Year Development Slowing mdash Change in Loss Ratio
25
Favorable Reserve Development Slowing
0
10
20
30
40
50
60
70
80
90
2015 2014 2013 2012 2011 2010 2009 2008 2007
()
Accident-Year Loss Ratio Changes by Time of Development
12 Months 24 Months 36 Months 48 Months 60 Months 72 Months 84 Months 96 Months 108 Months 120 Months
Note Industry aggregate MPLI claims made
Source SNL Financial
26
Accident-Year Loss Ratio
bull Claims Made Accident-Year Loss Ratio Rising
bull Will Recent Accident-Years Develop Downward Like 2003ndash2010
510 574
619 672
736 788
829 859 886 867
0
10
20
30
40
50
60
70
80
90
100
2007 2008 2009 2010 2011 2012 2013 2014 2015 2016
()
Accident-Year Loss and LAE Ratio(Current Loss Ratio Estimate)
Note Propertycasualty industry aggregate MPLI claims made
Source SNL Financial Fitch
27
Accident-Year Loss Ratio Development
bull Recent Accident-Years Favorable Development Pattern Lagging Past Highly Redundant AYs
(27) (21)(19) (16) (9)
(5) 00 1
0
10
20
30
40
50
60
70
80
90
100
2007 2008 2009 2010 2011 2012 2013 2014 2015
()
Accident-Year Loss and LAE Ratio Development
Current LR Est Original LR Est
LR ndash Loss ratio Note Propertycasualty industry aggregate MPLI claims made
Source SNL Financial Fitch
Change Current
LR Versus Original
28
MPLI Reserve Adequacy
Key Considerations
bull Likelihood of Balance Sheet Reported Reserves to Develop HigherLower over Time
bull Stress Test Capital Impact of Potential Deficiencies
Analytical Tools
bull Project Reserve Adequacy Using Loss Development Methods (PaidCase Incurred)
bull Accident-Year Ratio Analysis
29
Reserve Adequacy mdash MPLI
bull Initial Analysis of Industry 2016 Reserves
bull MPLI Claims Made and Occurrence Reserves Still 5ndash7 Redundant ($14 Billionndash$20 Billion)
(09)
(09)(20)
(20) (34) (37) (20)
0
10
20
30
40
50
60
70
80
90
2007 2008 2009 2010 2011 2012 2013 2014 2015 2016
()
Estimated Reserve Adequacy mdash Paid Development Method
Reported Loss Ratio Projected Loss Ratio
Note Propertycasualty industry aggregate MPLI claims made
Source SNL Financial
Accident-Year Loss
Ratio Redundant
30
MPLI Reserve Ratio Analysis mdash Accident-Year PaidIncurred
bull At Same Period of Development Paid to Incurred Losses Should Be Similar Across Accident Years
bull HigherLower Paid to Incurred for One Accident Year Versus Others Indicative of Reserve
WeaknessStrength
PropertyCasualty Industry mdash Medical Malpractice Claims Made( PaidIncurred)
Months of Development
Accident Year 12 24 36 48 60 72 84 96 108 120
2007 33 182 378 540 692 788 865 902 932 962
2008 37 189 391 568 712 817 862 899 945 mdash
2009 38 203 405 580 719 806 857 928 mdash mdash
2010 41 206 408 576 713 816 871 mdash mdash mdash
2011 39 202 420 577 731 831 mdash mdash mdash mdash
2012 38 219 420 607 743 mdash mdash mdash mdash mdash
2013 45 218 442 615 mdash mdash mdash mdash mdash mdash
2014 44 218 430 mdash mdash mdash mdash mdash mdash mdash
2015 40 207 mdash mdash mdash mdash mdash mdash mdash mdash
2016 43 mdash mdash mdash mdash mdash mdash mdash mdash mdash
Average 40 205 412 580 718 811 864 909 939 mdash
Difference 03 02 18 34 25 19 07 18 06 mdash
Source SNL Financial
31
(50)
(40)
(30)
(20)
(10)
0
10
20
30
10 15 20 25 30 35
(PaidIncurred Losses at 24 Months )
Source SNL Financial
( Incurred Losses Deficient[Redundant])
Historical Accident-Year Reserve Development Related to Paid Levels(Accident Years 1987ndash2011)
Correlation = 92
R-Squared = 84
Reserve Ratio Analysis mdash Accident-Year PaidIncurred
Analysis of Industry MPLI Claims Made for Accident Years 1987ndash2011
bull LowerHigher Cumulative Paid Loss Levels Relative to Incurred Losses at Early Periods of
Development Related to Ultimate Loss Experience
Deficient
Redundant
32
MPLI Reserve Ratio Analysis mdash Accident-Year IBNRIncurred
bull At Same Period of Development Incurred but Not Reported (IBNR) to Incurred Should Be Similar
Across Accident Years
bull LowerHigher IBNR Levels for One AY Versus Others Indicative of Reserve WeaknessStrength
PropertyCasualty Industry mdash Medical Malpractice Claims Made( IBNRIncurred)
Months of Development
Accident Year 12 24 36 48 60 72 84 96 108 120
2007 616 382 264 177 110 69 35 21 16 11
2008 599 335 203 141 87 46 33 27 14 mdash
2009 599 330 207 142 93 54 39 20 mdash mdash
2010 588 321 181 121 79 47 33 mdash mdash mdash
2011 600 300 169 114 72 36 mdash mdash mdash mdash
2012 611 299 162 104 63 mdash mdash mdash mdash mdash
2013 605 296 168 106 mdash mdash mdash mdash mdash mdash
2014 615 334 194 mdash mdash mdash mdash mdash mdash mdash
2015 635 329 mdash mdash mdash mdash mdash mdash mdash mdash
2016 617 mdash mdash mdash mdash mdash mdash mdash mdash mdash
Average 608 325 194 129 84 50 35 22 15 mdash
Difference 08 04 01 (24) (21) (14) (03) (03) (01) mdash
Source SNL Financial
33
Reserve Adequacy mdash Ratio Analysis
(40)
(30)
(20)
(10)
0
10
20
30
0 5 10 15 20 25 30 35 40 45
(IBNRIncurred Losses at 24 Months )IBNR ndash Incurred but not reported
Source SNL Financial
( Incurred Losses Deficient[Redundant])
Historical Accident-Year Reserve Development Related to IBNR Levels(Accident Years 1987ndash2011)
Correlation = (78)
R-Squared = 74
Deficient
Redundant
Analysis of Industry MPLI Claims Made for Accident Years 1987ndash2011
bull HigherLower IBNR Levels Relative to Incurred Losses at Early Periods of Development Related
to Ultimate Loss Experience
34
ALL FITCH CREDIT RATINGS ARE SUBJECT TO CERTAIN LIMITATIONS AND DISCLAIMERS
PLEASE READ THESE LIMITATIONS AND DISCLAIMERS BY FOLLOWING THIS LINK
HTTPSFITCHRATINGSCOMUNDERSTANDINGCREDITRATINGS IN ADDITION RATING
DEFINITIONS AND THE TERMS OF USE OF SUCH RATINGS ARE AVAILABLE ON THE
AGENCYS PUBLIC WEB SITE
AT WWWFITCHRATINGSCOM PUBLISHED RATINGS CRITERIA AND METHODOLOGIES ARE
AVAILABLE FROM THIS SITE AT ALL TIMES FITCHS CODE OF CONDUCT CONFIDENTIALITY
CONFLICTS OF INTEREST AFFILIATE FIREWALL COMPLIANCE AND OTHER RELEVANT
POLICIES AND PROCEDURES ARE ALSO AVAILABLE FROM THE CODE OF CONDUCT
SECTION OF THIS SITE FITCH MAY HAVE PROVIDED ANOTHER PERMISSIBLE SERVICE TO
THE RATED ENTITY OR ITS RELATED THIRD PARTIES DETAILS OF THIS SERVICE FOR
RATINGS FOR WHICH THE LEAD ANALYST IS BASED IN AN EU-REGISTERED ENTITY CAN BE
FOUND ON THE ENTITY SUMMARY PAGE FOR THIS ISSUER ON THE FITCH WEBSITE
Copyright copy 2017 by Fitch Ratings Inc Fitch Ratings Ltd and its subsidiaries 33 Whitehall Street
NY NY 10004 Telephone 1-800-753-4824 (212) 908-0500 Fax (212) 480-4435 Reproduction or
retransmission in whole or in part is prohibited except by permission All rights reserved In issuing
and maintaining its ratings and in making other reports (including forecast information) Fitch relies on
factual information it receives from issuers and underwriters and from other sources Fitch believes to
be credible Fitch conducts a reasonable investigation of the factual information relied upon by it in
accordance with its ratings methodology and obtains reasonable verification of that information from
independent sources to the extent such sources are available for a given security or in a given
jurisdiction The manner of Fitchrsquos factual investigation and the scope of the third-party verification it
obtains will vary depending on the nature of the rated security and its issuer the requirements and
practices in the jurisdiction in which the rated security is offered and sold andor the issuer is located
the availability and nature of relevant public information access to the management of the issuer and
its advisers the availability of pre-existing third-party verifications such as audit reports agreed-upon
procedures letters appraisals actuarial reports engineering reports legal opinions and other reports
provided by third parties the availability of independent and competent third-party verification sources
with respect to the particular security or in the particular jurisdiction of the issuer and a variety of
other factors Users of Fitchrsquos ratings and reports should understand that neither an enhanced factual
investigation nor any third-party verification can ensure that all of the information Fitch relies on in
connection with a rating or a report will be accurate and complete Ultimately the issuer and its
advisers are responsible for the accuracy of the information they provide to Fitch and to the market in
offering documents and other reports In issuing its ratings and its reports Fitch must rely on the work
of experts including independent auditors with respect to financial statements and attorneys with
respect to legal and tax matters Further ratings and forecasts of financial and other information are
inherently forward-looking and embody assumptions and predictions about future events that by their
nature cannot be verified as facts As a result despite any verification of current facts ratings and
forecasts can be affected by future events or conditions that were not anticipated at the time a rating
or forecast was issued or affirmed
The information in this report is provided ldquoas isrdquo without any representation or warranty of any kind
and Fitch does not represent or warrant that the report or any of its contents will meet any of the
requirements of a recipient of the report A Fitch rating is an opinion as to the creditworthiness of a
security This opinion and reports made by Fitch are based on established criteria and methodologies
that Fitch is continuously evaluating and updating Therefore ratings and reports are the collective
work product of Fitch and no individual or group of individuals is solely responsible for a rating or a
report The rating does not address the risk of loss due to risks other than credit risk unless such risk
is specifically mentioned Fitch is not engaged in the offer or sale of any security All Fitch reports
have shared authorship Individuals identified in a Fitch report were involved in but are not solely
responsible for the opinions stated therein The individuals are named for contact purposes only A
report providing a Fitch rating is neither a prospectus nor a substitute for the information assembled
verified and presented to investors by the issuer and its agents in connection with the sale of the
securities Ratings may be changed or withdrawn at any time for any reason in the sole discretion of
Fitch Fitch does not provide investment advice of any sort Ratings are not a recommendation to buy
sell or hold any security Ratings do not comment on the adequacy of market price the suitability of
any security for a particular investor or the tax-exempt nature or taxability of payments made in
respect to any security Fitch receives fees from issuers insurers guarantors other obligors and
underwriters for rating securities Such fees generally vary from US$1000 to US$750000 (or the
applicable currency equivalent) per issue In certain cases Fitch will rate all or a number of issues
issued by a particular issuer or insured or guaranteed by a particular insurer or guarantor for a single
annual fee Such fees are expected to vary from US$10000 to US$1500000 (or the applicable
currency equivalent) The assignment publication or dissemination of a rating by Fitch shall not
constitute a consent by Fitch to use its name as an expert in connection with any registration
statement filed under the United States securities laws the Financial Services and Markets Act of
2000 of the United Kingdom or the securities laws of any particular jurisdiction Due to the relative
efficiency of electronic publishing and distribution Fitch research may be available to electronic
subscribers up to three days earlier than to print subscribers
For Australia New Zealand Taiwan and South Korea only Fitch Australia Pty Ltd holds an Australian
financial services license (AFS license no 337123) which authorizes it to provide credit ratings to
wholesale clients only Credit ratings information published by Fitch is not intended to be used by
persons who are retail clients within the meaning of the Corporations Act 2001
fitchratings
fitchratingscom
New York London33 Whitehall Street
New York NY 10004
30 North Colonnade
Canary Wharf
London E14 5GN
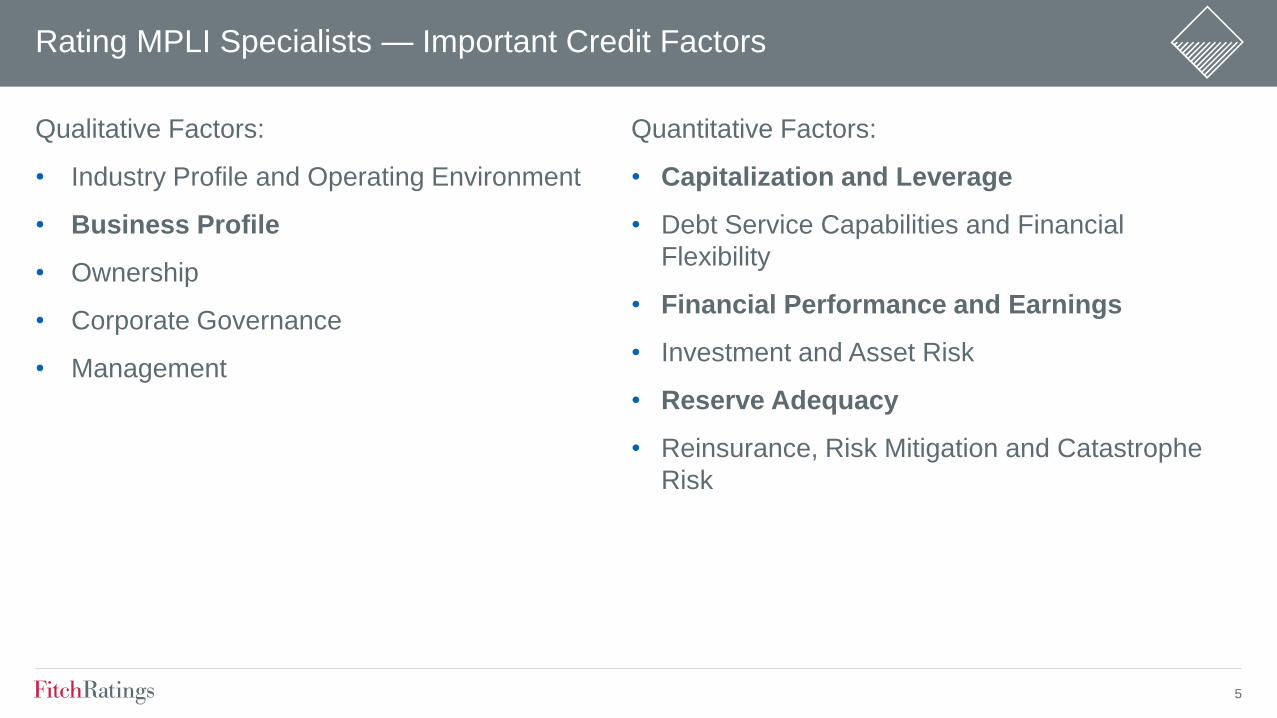
5
Qualitative Factors
bull Industry Profile and Operating Environment
bull Business Profile
bull Ownership
bull Corporate Governance
bull Management
Rating MPLI Specialists mdash Important Credit Factors
Quantitative Factors
bull Capitalization and Leverage
bull Debt Service Capabilities and Financial
Flexibility
bull Financial Performance and Earnings
bull Investment and Asset Risk
bull Reserve Adequacy
bull Reinsurance Risk Mitigation and Catastrophe
Risk
6
Business Profile
Primary Considerations MPLI Specialistsrsquo Perspective
Competitive Positioning Within Broad Market and
Primary Product Segments
Highly Focused Product Expertise Strong Market
Share in Targeted State or Region
SizeScale of Capital and Revenues Moderate SizeScale (Surplus lt $1 Bil Premiums lt
$750 Mil)
Key Business Risks and Diversification Longer Tail Historically Volatile Business mdash Limited
Diversification
Competitive Threats to Long-Term Viability and
Profitability
Business Pressures From Changes in Broader
Healthcare Market
Source Fitch Ratings
7
00
02
04
06
08
0
5
10
15
20
2007 2008 2009 2010 2011 2012 2013 2014 2015 2016
($ Bil)
MPLI Specialists Operating Leverage
PHS NWP Operating Leverage (RHS)
PHS ndash Policyholders surplus NWP ndash Net premium written Note Aggregate for a group of 35 MPLI specialists
Source SNL Financial
(x)
Capitalization and Leverage
MPLI Specialists
bull Surplus Growth and Exposure Reduction over Last Decade
bull Very Strong Capital Measures (Operating Leverage RBC Fitch Stochastic Capital Model)
bull Low Financial Leverage mdash Limited Capital Access
8
Financial Performance and Earnings
MPLI Specialists
bull Recent Deterioration in Combined Ratios Evident Following Extended Period of Strong Results
bull Calendar-Year Versus Accident-Year Combined Ratio
bull Return on Surplus Declining from Underwriting and Investment Challenges
909
785 812 800 848
912 900 902 979 990
150
100
162 165
121
103 90 85
54 46
0
3
6
9
12
15
18
0
20
40
60
80
100
120
2007 2008 2009 2010 2011 2012 2013 2014 2015 2016
()
MPLI Specialistsrsquo Financial Performance and Earnings
Combined Ratio (LHS) Return on Surplus (RHS)
Note Aggregate for a group of 35 MPLI specialists
Source SNL Financial
()
9
Rating Navigator Tool
A Visual Overview of Key Factors Considered in IFS Ratings
10
MPLI Reserve Analysis2
11
Workers Comp24
Other Liability22
Commercial Multiperil
6
Reinsurance6
MPLI4
Homeowners4
Special Property
2Other
Reserves3
Source SNL Financial
PropertyCasualty Industry Loss Reserves YE 2016(Total Industry Reserves = $621 Bil)
Private
Passenger Auto
20
Commercial Auto
5
Financial
Guaranty
Mortgage
Insurance
2Product Liability
2
MPLI mdash Reserve Characteristics
bull Represent 44 of Industry 2016 Loss
Reserves
bull More Volatile Segment Versus Other PC Lines
bull Longer-Tail Claims Liabilities
bull Large Defense Costs Component to Claims
12
MPLI mdash Underwriting and Reserve Cyclicality
(60)
(40)
(20)
0
20
40
60
80
100
120
140
()
PropertyCasualty Industry Historical Accident-Year Results
Loss Ratio Change (Original Versus Latest Reported) Latest Loss Ratio Estimate
Note MPLI claims made
Source SNL Financial
13
Reserve Characteristics Volatility
MPLI Claims Made Has Higher Underwriting and Reserve Volatility than Nearly All Major PC Segments
Private Passenger Auto WCAll Lines
Commercial AutoCMP
HO
OL OCC
Specialty LiabilityMPLI CM
OL CM
Prod Liab Occ
0
5
10
15
20
25
30
0 5 10 15 20 25 30
(Average Loss Ratio Volatility )
Average Loss Ratio Volatility Versus Reserve Volatility by Segment
WC ndash Workers compensation CMP ndash Commercial multiperil HO ndash Homeowners OL OCC ndash Other liability ndash occurrence MPLI CM ndash Medical practice liability insurance claims made OL CM ndash Other
liability ndash claims made Liab OCC ndash Liability occurrence
Source SNL Financial Fitch
()
14
bull Slower Payout Versus Most PC Segments
bull Tail Risk Higher in Workersrsquo Compensation
Reserves Characteristics mdash Claims Duration
0
20
40
60
80
100
120
1 2 3 4 5 6 7 8 9 10
()
Loss Payment Pattern by Segment
Homeowners Workers Comp CMP MPLI CM
CMP ndash Commercial multiperil Note Propertycasualty industry aggregate
Source SNL Financial
(Years of Development)
15
bull Approximately 73 of Industry MPLI Reserves Are in Latest Four Accident Years 2013ndash2016
MPLI Reserve Composition
201624
201521
201416
201312
20128
20116
20104
20092
20082
20071 2006 and Prior
4
Source SNL Financial
Industry MPLI Reserves by Accident Year(73 of Reserves Relate to Accident-Years 2013ndash2016)
16
Large Litigation Component of MPLI Claims mdash Higher of Losses in Defense
and Cost Containment Costs
Reserve Characteristics mdash Defense Costs
0
5
10
15
20
25
30
35
MPLI CM MPLI OCC Other LiabilityCM
Other LiabilityOCC
CMP Workers Comp CommercialAuto
All Lines Personal Auto Homeowners
()
Defense and Cost Containment Costs of Total Net Incurred(Average Accident Years 2006ndash2015)
CM ndash Claims made OCC ndash Occurrence CMP ndash Commercial multiperil Note Propertycasualty industry aggregate data
Source SNL Financial
17
MPLI Reserve Analysis
bull Reserve Profile
bull Reserve Growth
bull Reserve Experience
bull Reserve Adequacy
18
Reserve Profile
Reserve Composition and Inherent Risk
bull Reserve Segment Mix and Diversification
bull Reserve Leverage
bull Reserve Risk Relative to Underwriting Risk
Implied Weighting of Reserves in Rating
Loss Reserves
Incurred Losses
Reserve Leverage
lt10 10ndash15 gt15
gt20 Medium High High
10ndash20 Medium Medium High
lt10 Low Medium Medium
19
MPLI Specialists Reserve Leverage Declining over Time with Surplus Growth
ReservesIncurred Ratio Very High mdash Implies Greater Capital Sensitivity to Reserve Changes than
Current Underwriting Period
MPLI Reserve Profile
00
05
10
15
20
25
0
3
6
9
12
15
18
2007 2008 2009 2010 2011 2012 2013 2014 2015 2016
($ Bil)
MPLI Specialists Reserve Leverage
PHS Reserves Reserve Leverage
PHS ndash Policyholders surplus Note Aggregate for a group of 35 MPLI specialists
Source SNL Financial
(x)
00
10
20
30
40
50
60
70
2007 2008 2009 2010 2011 2012 2013 2014 2015 2016
(x)ReservesCY Incurred Reserve Leverage
CY ndash Calendar year Note Aggregate for a group of 35 MPLI specialists
Source SNL Financial
MPLI Specialists Reserve Leverage Versus Reserves
CY Incurred
20
Over Long Term an Insurerrsquos Reserves Should Grow Commensurate with Exposures
Key Ratios
bull Calendar-Year PaidCalendar-Year Incurred Losses
bull ReservesEarned Premiums (Changes over Time)
MPLI Reserve Growth
00
02
04
06
08
10
12
14
2007 2008 2009 2010 2011 2012 2013 2014 2015 2016
(x)
Note Aggregate for a group of 35 MPLI specialists Calendar-year paid and incurred losses
Source SNL Financial
Paid gt Incurred Loss Indicative of
Reserve Weakness but Incurred
Influence by Reserve Takedowns
MPLI Specialists Reserve Growth Indications(PaidIncurred Losses)
30
31
32
33
34
2007 2008 2009 2010 2011 2012 2013 2014 2015 2016
(x)
Note Aggregate for a group of 35 MPLI specialists
Source SNL Financial
Stable Ratio = Reserve
Changes Keeping Pace
with Premium Changes
MPLI Specialists Reserve Growth Indications(ReservesEarned Premium)
21
Key Ratios
bull Calendar Year
‒ One Year Development Prior-Year Reserves
‒ One Year Development Prior-Year Surplus
‒ One Year Development Earned Premiums
bull Accident Year
‒ Current Loss Ratio Estimate Versus Original Estimate
‒ Accident-Year Development History and Trends
MPLI Reserve Experience
22
Reserve Experience mdash Favorable MPLI Development
bull Reserve Development Still Highly Favorable but Slowing Considerably
196
237228
266
221206
245
198
166
116
0
5
10
15
20
25
30
2007 2008 2009 2010 2011 2012 2013 2014 2015 2016
( of Earned Premiums)
MPLI Calendar-Year Reserve Development
Note Excludes MCIC Vermont Propertycasualty industry aggregate
Source SNL Financial
Favorable
Development
23
Reserve Experience mdash Calendar-Year Development
bull MPLI Development Greatly Exceeds Other Commercial Lines Segments over Last Decade
bull Magnitude of Favorable Development in MPLI Declining
(30)
(25)
(20)
(15)
(10)
(5)
0
5
10
15
Commercial Auto Other Liability mdash Claims Made Other Liability mdash Occurrence MPLI mdash Claims Made Workers Compensation
() 2012 2013 2014 2015 2016
Source SNL Financial
Segment Calendar-Year Development as a of Earned Premium mdash (Favorable)Unfavorable
24
Favorable Reserve Development Slowing
(5)
0
5
10
15
20
2015 2014 2013 2012 2011 2010 2009 2008 2007 2006 2005 2004 2003
12ndash24 Months 24ndash36 Months 36ndash48 Months
Note Propertycasualty industry aggregate MPLI claims made
Source SNL Financial
( Favorable[Unfavorable])
Favorable MPLI Accident-Year Development Slowing mdash Change in Loss Ratio
25
Favorable Reserve Development Slowing
0
10
20
30
40
50
60
70
80
90
2015 2014 2013 2012 2011 2010 2009 2008 2007
()
Accident-Year Loss Ratio Changes by Time of Development
12 Months 24 Months 36 Months 48 Months 60 Months 72 Months 84 Months 96 Months 108 Months 120 Months
Note Industry aggregate MPLI claims made
Source SNL Financial
26
Accident-Year Loss Ratio
bull Claims Made Accident-Year Loss Ratio Rising
bull Will Recent Accident-Years Develop Downward Like 2003ndash2010
510 574
619 672
736 788
829 859 886 867
0
10
20
30
40
50
60
70
80
90
100
2007 2008 2009 2010 2011 2012 2013 2014 2015 2016
()
Accident-Year Loss and LAE Ratio(Current Loss Ratio Estimate)
Note Propertycasualty industry aggregate MPLI claims made
Source SNL Financial Fitch
27
Accident-Year Loss Ratio Development
bull Recent Accident-Years Favorable Development Pattern Lagging Past Highly Redundant AYs
(27) (21)(19) (16) (9)
(5) 00 1
0
10
20
30
40
50
60
70
80
90
100
2007 2008 2009 2010 2011 2012 2013 2014 2015
()
Accident-Year Loss and LAE Ratio Development
Current LR Est Original LR Est
LR ndash Loss ratio Note Propertycasualty industry aggregate MPLI claims made
Source SNL Financial Fitch
Change Current
LR Versus Original
28
MPLI Reserve Adequacy
Key Considerations
bull Likelihood of Balance Sheet Reported Reserves to Develop HigherLower over Time
bull Stress Test Capital Impact of Potential Deficiencies
Analytical Tools
bull Project Reserve Adequacy Using Loss Development Methods (PaidCase Incurred)
bull Accident-Year Ratio Analysis
29
Reserve Adequacy mdash MPLI
bull Initial Analysis of Industry 2016 Reserves
bull MPLI Claims Made and Occurrence Reserves Still 5ndash7 Redundant ($14 Billionndash$20 Billion)
(09)
(09)(20)
(20) (34) (37) (20)
0
10
20
30
40
50
60
70
80
90
2007 2008 2009 2010 2011 2012 2013 2014 2015 2016
()
Estimated Reserve Adequacy mdash Paid Development Method
Reported Loss Ratio Projected Loss Ratio
Note Propertycasualty industry aggregate MPLI claims made
Source SNL Financial
Accident-Year Loss
Ratio Redundant
30
MPLI Reserve Ratio Analysis mdash Accident-Year PaidIncurred
bull At Same Period of Development Paid to Incurred Losses Should Be Similar Across Accident Years
bull HigherLower Paid to Incurred for One Accident Year Versus Others Indicative of Reserve
WeaknessStrength
PropertyCasualty Industry mdash Medical Malpractice Claims Made( PaidIncurred)
Months of Development
Accident Year 12 24 36 48 60 72 84 96 108 120
2007 33 182 378 540 692 788 865 902 932 962
2008 37 189 391 568 712 817 862 899 945 mdash
2009 38 203 405 580 719 806 857 928 mdash mdash
2010 41 206 408 576 713 816 871 mdash mdash mdash
2011 39 202 420 577 731 831 mdash mdash mdash mdash
2012 38 219 420 607 743 mdash mdash mdash mdash mdash
2013 45 218 442 615 mdash mdash mdash mdash mdash mdash
2014 44 218 430 mdash mdash mdash mdash mdash mdash mdash
2015 40 207 mdash mdash mdash mdash mdash mdash mdash mdash
2016 43 mdash mdash mdash mdash mdash mdash mdash mdash mdash
Average 40 205 412 580 718 811 864 909 939 mdash
Difference 03 02 18 34 25 19 07 18 06 mdash
Source SNL Financial
31
(50)
(40)
(30)
(20)
(10)
0
10
20
30
10 15 20 25 30 35
(PaidIncurred Losses at 24 Months )
Source SNL Financial
( Incurred Losses Deficient[Redundant])
Historical Accident-Year Reserve Development Related to Paid Levels(Accident Years 1987ndash2011)
Correlation = 92
R-Squared = 84
Reserve Ratio Analysis mdash Accident-Year PaidIncurred
Analysis of Industry MPLI Claims Made for Accident Years 1987ndash2011
bull LowerHigher Cumulative Paid Loss Levels Relative to Incurred Losses at Early Periods of
Development Related to Ultimate Loss Experience
Deficient
Redundant
32
MPLI Reserve Ratio Analysis mdash Accident-Year IBNRIncurred
bull At Same Period of Development Incurred but Not Reported (IBNR) to Incurred Should Be Similar
Across Accident Years
bull LowerHigher IBNR Levels for One AY Versus Others Indicative of Reserve WeaknessStrength
PropertyCasualty Industry mdash Medical Malpractice Claims Made( IBNRIncurred)
Months of Development
Accident Year 12 24 36 48 60 72 84 96 108 120
2007 616 382 264 177 110 69 35 21 16 11
2008 599 335 203 141 87 46 33 27 14 mdash
2009 599 330 207 142 93 54 39 20 mdash mdash
2010 588 321 181 121 79 47 33 mdash mdash mdash
2011 600 300 169 114 72 36 mdash mdash mdash mdash
2012 611 299 162 104 63 mdash mdash mdash mdash mdash
2013 605 296 168 106 mdash mdash mdash mdash mdash mdash
2014 615 334 194 mdash mdash mdash mdash mdash mdash mdash
2015 635 329 mdash mdash mdash mdash mdash mdash mdash mdash
2016 617 mdash mdash mdash mdash mdash mdash mdash mdash mdash
Average 608 325 194 129 84 50 35 22 15 mdash
Difference 08 04 01 (24) (21) (14) (03) (03) (01) mdash
Source SNL Financial
33
Reserve Adequacy mdash Ratio Analysis
(40)
(30)
(20)
(10)
0
10
20
30
0 5 10 15 20 25 30 35 40 45
(IBNRIncurred Losses at 24 Months )IBNR ndash Incurred but not reported
Source SNL Financial
( Incurred Losses Deficient[Redundant])
Historical Accident-Year Reserve Development Related to IBNR Levels(Accident Years 1987ndash2011)
Correlation = (78)
R-Squared = 74
Deficient
Redundant
Analysis of Industry MPLI Claims Made for Accident Years 1987ndash2011
bull HigherLower IBNR Levels Relative to Incurred Losses at Early Periods of Development Related
to Ultimate Loss Experience
34
ALL FITCH CREDIT RATINGS ARE SUBJECT TO CERTAIN LIMITATIONS AND DISCLAIMERS
PLEASE READ THESE LIMITATIONS AND DISCLAIMERS BY FOLLOWING THIS LINK
HTTPSFITCHRATINGSCOMUNDERSTANDINGCREDITRATINGS IN ADDITION RATING
DEFINITIONS AND THE TERMS OF USE OF SUCH RATINGS ARE AVAILABLE ON THE
AGENCYS PUBLIC WEB SITE
AT WWWFITCHRATINGSCOM PUBLISHED RATINGS CRITERIA AND METHODOLOGIES ARE
AVAILABLE FROM THIS SITE AT ALL TIMES FITCHS CODE OF CONDUCT CONFIDENTIALITY
CONFLICTS OF INTEREST AFFILIATE FIREWALL COMPLIANCE AND OTHER RELEVANT
POLICIES AND PROCEDURES ARE ALSO AVAILABLE FROM THE CODE OF CONDUCT
SECTION OF THIS SITE FITCH MAY HAVE PROVIDED ANOTHER PERMISSIBLE SERVICE TO
THE RATED ENTITY OR ITS RELATED THIRD PARTIES DETAILS OF THIS SERVICE FOR
RATINGS FOR WHICH THE LEAD ANALYST IS BASED IN AN EU-REGISTERED ENTITY CAN BE
FOUND ON THE ENTITY SUMMARY PAGE FOR THIS ISSUER ON THE FITCH WEBSITE
Copyright copy 2017 by Fitch Ratings Inc Fitch Ratings Ltd and its subsidiaries 33 Whitehall Street
NY NY 10004 Telephone 1-800-753-4824 (212) 908-0500 Fax (212) 480-4435 Reproduction or
retransmission in whole or in part is prohibited except by permission All rights reserved In issuing
and maintaining its ratings and in making other reports (including forecast information) Fitch relies on
factual information it receives from issuers and underwriters and from other sources Fitch believes to
be credible Fitch conducts a reasonable investigation of the factual information relied upon by it in
accordance with its ratings methodology and obtains reasonable verification of that information from
independent sources to the extent such sources are available for a given security or in a given
jurisdiction The manner of Fitchrsquos factual investigation and the scope of the third-party verification it
obtains will vary depending on the nature of the rated security and its issuer the requirements and
practices in the jurisdiction in which the rated security is offered and sold andor the issuer is located
the availability and nature of relevant public information access to the management of the issuer and
its advisers the availability of pre-existing third-party verifications such as audit reports agreed-upon
procedures letters appraisals actuarial reports engineering reports legal opinions and other reports
provided by third parties the availability of independent and competent third-party verification sources
with respect to the particular security or in the particular jurisdiction of the issuer and a variety of
other factors Users of Fitchrsquos ratings and reports should understand that neither an enhanced factual
investigation nor any third-party verification can ensure that all of the information Fitch relies on in
connection with a rating or a report will be accurate and complete Ultimately the issuer and its
advisers are responsible for the accuracy of the information they provide to Fitch and to the market in
offering documents and other reports In issuing its ratings and its reports Fitch must rely on the work
of experts including independent auditors with respect to financial statements and attorneys with
respect to legal and tax matters Further ratings and forecasts of financial and other information are
inherently forward-looking and embody assumptions and predictions about future events that by their
nature cannot be verified as facts As a result despite any verification of current facts ratings and
forecasts can be affected by future events or conditions that were not anticipated at the time a rating
or forecast was issued or affirmed
The information in this report is provided ldquoas isrdquo without any representation or warranty of any kind
and Fitch does not represent or warrant that the report or any of its contents will meet any of the
requirements of a recipient of the report A Fitch rating is an opinion as to the creditworthiness of a
security This opinion and reports made by Fitch are based on established criteria and methodologies
that Fitch is continuously evaluating and updating Therefore ratings and reports are the collective
work product of Fitch and no individual or group of individuals is solely responsible for a rating or a
report The rating does not address the risk of loss due to risks other than credit risk unless such risk
is specifically mentioned Fitch is not engaged in the offer or sale of any security All Fitch reports
have shared authorship Individuals identified in a Fitch report were involved in but are not solely
responsible for the opinions stated therein The individuals are named for contact purposes only A
report providing a Fitch rating is neither a prospectus nor a substitute for the information assembled
verified and presented to investors by the issuer and its agents in connection with the sale of the
securities Ratings may be changed or withdrawn at any time for any reason in the sole discretion of
Fitch Fitch does not provide investment advice of any sort Ratings are not a recommendation to buy
sell or hold any security Ratings do not comment on the adequacy of market price the suitability of
any security for a particular investor or the tax-exempt nature or taxability of payments made in
respect to any security Fitch receives fees from issuers insurers guarantors other obligors and
underwriters for rating securities Such fees generally vary from US$1000 to US$750000 (or the
applicable currency equivalent) per issue In certain cases Fitch will rate all or a number of issues
issued by a particular issuer or insured or guaranteed by a particular insurer or guarantor for a single
annual fee Such fees are expected to vary from US$10000 to US$1500000 (or the applicable
currency equivalent) The assignment publication or dissemination of a rating by Fitch shall not
constitute a consent by Fitch to use its name as an expert in connection with any registration
statement filed under the United States securities laws the Financial Services and Markets Act of
2000 of the United Kingdom or the securities laws of any particular jurisdiction Due to the relative
efficiency of electronic publishing and distribution Fitch research may be available to electronic
subscribers up to three days earlier than to print subscribers
For Australia New Zealand Taiwan and South Korea only Fitch Australia Pty Ltd holds an Australian
financial services license (AFS license no 337123) which authorizes it to provide credit ratings to
wholesale clients only Credit ratings information published by Fitch is not intended to be used by
persons who are retail clients within the meaning of the Corporations Act 2001
fitchratings
fitchratingscom
New York London33 Whitehall Street
New York NY 10004
30 North Colonnade
Canary Wharf
London E14 5GN
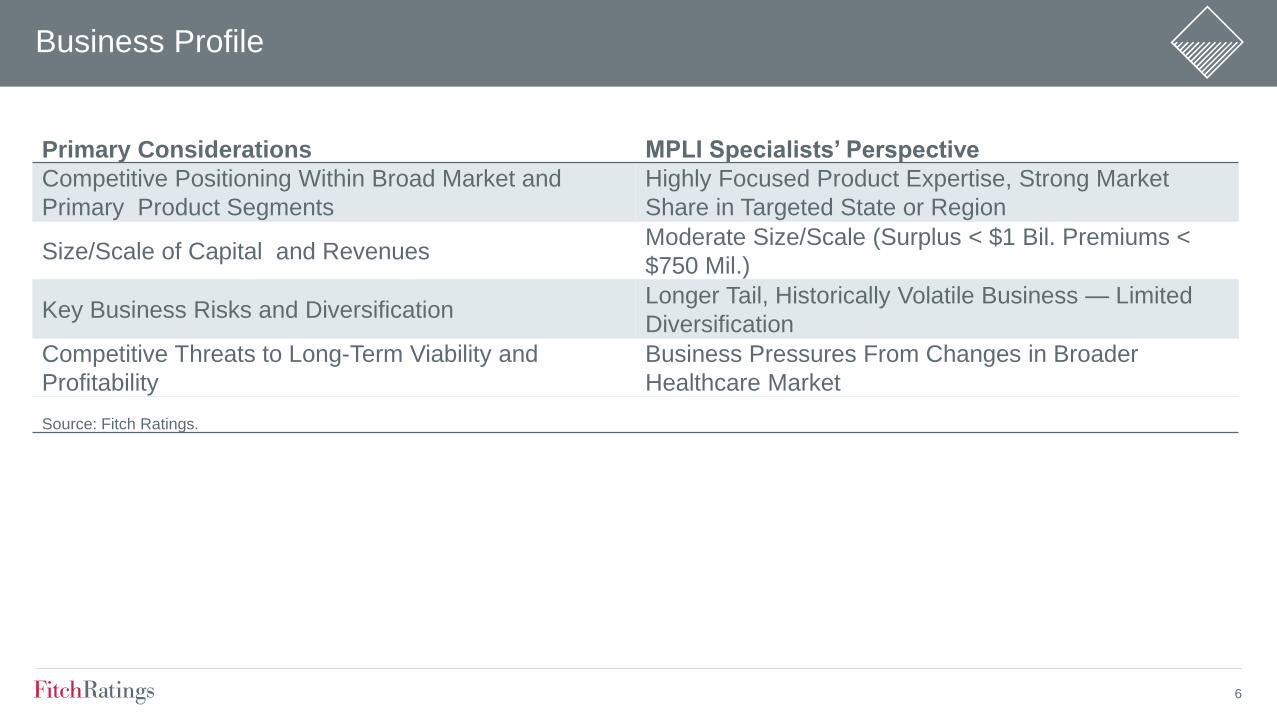
6
Business Profile
Primary Considerations MPLI Specialistsrsquo Perspective
Competitive Positioning Within Broad Market and
Primary Product Segments
Highly Focused Product Expertise Strong Market
Share in Targeted State or Region
SizeScale of Capital and Revenues Moderate SizeScale (Surplus lt $1 Bil Premiums lt
$750 Mil)
Key Business Risks and Diversification Longer Tail Historically Volatile Business mdash Limited
Diversification
Competitive Threats to Long-Term Viability and
Profitability
Business Pressures From Changes in Broader
Healthcare Market
Source Fitch Ratings
7
00
02
04
06
08
0
5
10
15
20
2007 2008 2009 2010 2011 2012 2013 2014 2015 2016
($ Bil)
MPLI Specialists Operating Leverage
PHS NWP Operating Leverage (RHS)
PHS ndash Policyholders surplus NWP ndash Net premium written Note Aggregate for a group of 35 MPLI specialists
Source SNL Financial
(x)
Capitalization and Leverage
MPLI Specialists
bull Surplus Growth and Exposure Reduction over Last Decade
bull Very Strong Capital Measures (Operating Leverage RBC Fitch Stochastic Capital Model)
bull Low Financial Leverage mdash Limited Capital Access
8
Financial Performance and Earnings
MPLI Specialists
bull Recent Deterioration in Combined Ratios Evident Following Extended Period of Strong Results
bull Calendar-Year Versus Accident-Year Combined Ratio
bull Return on Surplus Declining from Underwriting and Investment Challenges
909
785 812 800 848
912 900 902 979 990
150
100
162 165
121
103 90 85
54 46
0
3
6
9
12
15
18
0
20
40
60
80
100
120
2007 2008 2009 2010 2011 2012 2013 2014 2015 2016
()
MPLI Specialistsrsquo Financial Performance and Earnings
Combined Ratio (LHS) Return on Surplus (RHS)
Note Aggregate for a group of 35 MPLI specialists
Source SNL Financial
()
9
Rating Navigator Tool
A Visual Overview of Key Factors Considered in IFS Ratings
10
MPLI Reserve Analysis2
11
Workers Comp24
Other Liability22
Commercial Multiperil
6
Reinsurance6
MPLI4
Homeowners4
Special Property
2Other
Reserves3
Source SNL Financial
PropertyCasualty Industry Loss Reserves YE 2016(Total Industry Reserves = $621 Bil)
Private
Passenger Auto
20
Commercial Auto
5
Financial
Guaranty
Mortgage
Insurance
2Product Liability
2
MPLI mdash Reserve Characteristics
bull Represent 44 of Industry 2016 Loss
Reserves
bull More Volatile Segment Versus Other PC Lines
bull Longer-Tail Claims Liabilities
bull Large Defense Costs Component to Claims
12
MPLI mdash Underwriting and Reserve Cyclicality
(60)
(40)
(20)
0
20
40
60
80
100
120
140
()
PropertyCasualty Industry Historical Accident-Year Results
Loss Ratio Change (Original Versus Latest Reported) Latest Loss Ratio Estimate
Note MPLI claims made
Source SNL Financial
13
Reserve Characteristics Volatility
MPLI Claims Made Has Higher Underwriting and Reserve Volatility than Nearly All Major PC Segments
Private Passenger Auto WCAll Lines
Commercial AutoCMP
HO
OL OCC
Specialty LiabilityMPLI CM
OL CM
Prod Liab Occ
0
5
10
15
20
25
30
0 5 10 15 20 25 30
(Average Loss Ratio Volatility )
Average Loss Ratio Volatility Versus Reserve Volatility by Segment
WC ndash Workers compensation CMP ndash Commercial multiperil HO ndash Homeowners OL OCC ndash Other liability ndash occurrence MPLI CM ndash Medical practice liability insurance claims made OL CM ndash Other
liability ndash claims made Liab OCC ndash Liability occurrence
Source SNL Financial Fitch
()
14
bull Slower Payout Versus Most PC Segments
bull Tail Risk Higher in Workersrsquo Compensation
Reserves Characteristics mdash Claims Duration
0
20
40
60
80
100
120
1 2 3 4 5 6 7 8 9 10
()
Loss Payment Pattern by Segment
Homeowners Workers Comp CMP MPLI CM
CMP ndash Commercial multiperil Note Propertycasualty industry aggregate
Source SNL Financial
(Years of Development)
15
bull Approximately 73 of Industry MPLI Reserves Are in Latest Four Accident Years 2013ndash2016
MPLI Reserve Composition
201624
201521
201416
201312
20128
20116
20104
20092
20082
20071 2006 and Prior
4
Source SNL Financial
Industry MPLI Reserves by Accident Year(73 of Reserves Relate to Accident-Years 2013ndash2016)
16
Large Litigation Component of MPLI Claims mdash Higher of Losses in Defense
and Cost Containment Costs
Reserve Characteristics mdash Defense Costs
0
5
10
15
20
25
30
35
MPLI CM MPLI OCC Other LiabilityCM
Other LiabilityOCC
CMP Workers Comp CommercialAuto
All Lines Personal Auto Homeowners
()
Defense and Cost Containment Costs of Total Net Incurred(Average Accident Years 2006ndash2015)
CM ndash Claims made OCC ndash Occurrence CMP ndash Commercial multiperil Note Propertycasualty industry aggregate data
Source SNL Financial
17
MPLI Reserve Analysis
bull Reserve Profile
bull Reserve Growth
bull Reserve Experience
bull Reserve Adequacy
18
Reserve Profile
Reserve Composition and Inherent Risk
bull Reserve Segment Mix and Diversification
bull Reserve Leverage
bull Reserve Risk Relative to Underwriting Risk
Implied Weighting of Reserves in Rating
Loss Reserves
Incurred Losses
Reserve Leverage
lt10 10ndash15 gt15
gt20 Medium High High
10ndash20 Medium Medium High
lt10 Low Medium Medium
19
MPLI Specialists Reserve Leverage Declining over Time with Surplus Growth
ReservesIncurred Ratio Very High mdash Implies Greater Capital Sensitivity to Reserve Changes than
Current Underwriting Period
MPLI Reserve Profile
00
05
10
15
20
25
0
3
6
9
12
15
18
2007 2008 2009 2010 2011 2012 2013 2014 2015 2016
($ Bil)
MPLI Specialists Reserve Leverage
PHS Reserves Reserve Leverage
PHS ndash Policyholders surplus Note Aggregate for a group of 35 MPLI specialists
Source SNL Financial
(x)
00
10
20
30
40
50
60
70
2007 2008 2009 2010 2011 2012 2013 2014 2015 2016
(x)ReservesCY Incurred Reserve Leverage
CY ndash Calendar year Note Aggregate for a group of 35 MPLI specialists
Source SNL Financial
MPLI Specialists Reserve Leverage Versus Reserves
CY Incurred
20
Over Long Term an Insurerrsquos Reserves Should Grow Commensurate with Exposures
Key Ratios
bull Calendar-Year PaidCalendar-Year Incurred Losses
bull ReservesEarned Premiums (Changes over Time)
MPLI Reserve Growth
00
02
04
06
08
10
12
14
2007 2008 2009 2010 2011 2012 2013 2014 2015 2016
(x)
Note Aggregate for a group of 35 MPLI specialists Calendar-year paid and incurred losses
Source SNL Financial
Paid gt Incurred Loss Indicative of
Reserve Weakness but Incurred
Influence by Reserve Takedowns
MPLI Specialists Reserve Growth Indications(PaidIncurred Losses)
30
31
32
33
34
2007 2008 2009 2010 2011 2012 2013 2014 2015 2016
(x)
Note Aggregate for a group of 35 MPLI specialists
Source SNL Financial
Stable Ratio = Reserve
Changes Keeping Pace
with Premium Changes
MPLI Specialists Reserve Growth Indications(ReservesEarned Premium)
21
Key Ratios
bull Calendar Year
‒ One Year Development Prior-Year Reserves
‒ One Year Development Prior-Year Surplus
‒ One Year Development Earned Premiums
bull Accident Year
‒ Current Loss Ratio Estimate Versus Original Estimate
‒ Accident-Year Development History and Trends
MPLI Reserve Experience
22
Reserve Experience mdash Favorable MPLI Development
bull Reserve Development Still Highly Favorable but Slowing Considerably
196
237228
266
221206
245
198
166
116
0
5
10
15
20
25
30
2007 2008 2009 2010 2011 2012 2013 2014 2015 2016
( of Earned Premiums)
MPLI Calendar-Year Reserve Development
Note Excludes MCIC Vermont Propertycasualty industry aggregate
Source SNL Financial
Favorable
Development
23
Reserve Experience mdash Calendar-Year Development
bull MPLI Development Greatly Exceeds Other Commercial Lines Segments over Last Decade
bull Magnitude of Favorable Development in MPLI Declining
(30)
(25)
(20)
(15)
(10)
(5)
0
5
10
15
Commercial Auto Other Liability mdash Claims Made Other Liability mdash Occurrence MPLI mdash Claims Made Workers Compensation
() 2012 2013 2014 2015 2016
Source SNL Financial
Segment Calendar-Year Development as a of Earned Premium mdash (Favorable)Unfavorable
24
Favorable Reserve Development Slowing
(5)
0
5
10
15
20
2015 2014 2013 2012 2011 2010 2009 2008 2007 2006 2005 2004 2003
12ndash24 Months 24ndash36 Months 36ndash48 Months
Note Propertycasualty industry aggregate MPLI claims made
Source SNL Financial
( Favorable[Unfavorable])
Favorable MPLI Accident-Year Development Slowing mdash Change in Loss Ratio
25
Favorable Reserve Development Slowing
0
10
20
30
40
50
60
70
80
90
2015 2014 2013 2012 2011 2010 2009 2008 2007
()
Accident-Year Loss Ratio Changes by Time of Development
12 Months 24 Months 36 Months 48 Months 60 Months 72 Months 84 Months 96 Months 108 Months 120 Months
Note Industry aggregate MPLI claims made
Source SNL Financial
26
Accident-Year Loss Ratio
bull Claims Made Accident-Year Loss Ratio Rising
bull Will Recent Accident-Years Develop Downward Like 2003ndash2010
510 574
619 672
736 788
829 859 886 867
0
10
20
30
40
50
60
70
80
90
100
2007 2008 2009 2010 2011 2012 2013 2014 2015 2016
()
Accident-Year Loss and LAE Ratio(Current Loss Ratio Estimate)
Note Propertycasualty industry aggregate MPLI claims made
Source SNL Financial Fitch
27
Accident-Year Loss Ratio Development
bull Recent Accident-Years Favorable Development Pattern Lagging Past Highly Redundant AYs
(27) (21)(19) (16) (9)
(5) 00 1
0
10
20
30
40
50
60
70
80
90
100
2007 2008 2009 2010 2011 2012 2013 2014 2015
()
Accident-Year Loss and LAE Ratio Development
Current LR Est Original LR Est
LR ndash Loss ratio Note Propertycasualty industry aggregate MPLI claims made
Source SNL Financial Fitch
Change Current
LR Versus Original
28
MPLI Reserve Adequacy
Key Considerations
bull Likelihood of Balance Sheet Reported Reserves to Develop HigherLower over Time
bull Stress Test Capital Impact of Potential Deficiencies
Analytical Tools
bull Project Reserve Adequacy Using Loss Development Methods (PaidCase Incurred)
bull Accident-Year Ratio Analysis
29
Reserve Adequacy mdash MPLI
bull Initial Analysis of Industry 2016 Reserves
bull MPLI Claims Made and Occurrence Reserves Still 5ndash7 Redundant ($14 Billionndash$20 Billion)
(09)
(09)(20)
(20) (34) (37) (20)
0
10
20
30
40
50
60
70
80
90
2007 2008 2009 2010 2011 2012 2013 2014 2015 2016
()
Estimated Reserve Adequacy mdash Paid Development Method
Reported Loss Ratio Projected Loss Ratio
Note Propertycasualty industry aggregate MPLI claims made
Source SNL Financial
Accident-Year Loss
Ratio Redundant
30
MPLI Reserve Ratio Analysis mdash Accident-Year PaidIncurred
bull At Same Period of Development Paid to Incurred Losses Should Be Similar Across Accident Years
bull HigherLower Paid to Incurred for One Accident Year Versus Others Indicative of Reserve
WeaknessStrength
PropertyCasualty Industry mdash Medical Malpractice Claims Made( PaidIncurred)
Months of Development
Accident Year 12 24 36 48 60 72 84 96 108 120
2007 33 182 378 540 692 788 865 902 932 962
2008 37 189 391 568 712 817 862 899 945 mdash
2009 38 203 405 580 719 806 857 928 mdash mdash
2010 41 206 408 576 713 816 871 mdash mdash mdash
2011 39 202 420 577 731 831 mdash mdash mdash mdash
2012 38 219 420 607 743 mdash mdash mdash mdash mdash
2013 45 218 442 615 mdash mdash mdash mdash mdash mdash
2014 44 218 430 mdash mdash mdash mdash mdash mdash mdash
2015 40 207 mdash mdash mdash mdash mdash mdash mdash mdash
2016 43 mdash mdash mdash mdash mdash mdash mdash mdash mdash
Average 40 205 412 580 718 811 864 909 939 mdash
Difference 03 02 18 34 25 19 07 18 06 mdash
Source SNL Financial
31
(50)
(40)
(30)
(20)
(10)
0
10
20
30
10 15 20 25 30 35
(PaidIncurred Losses at 24 Months )
Source SNL Financial
( Incurred Losses Deficient[Redundant])
Historical Accident-Year Reserve Development Related to Paid Levels(Accident Years 1987ndash2011)
Correlation = 92
R-Squared = 84
Reserve Ratio Analysis mdash Accident-Year PaidIncurred
Analysis of Industry MPLI Claims Made for Accident Years 1987ndash2011
bull LowerHigher Cumulative Paid Loss Levels Relative to Incurred Losses at Early Periods of
Development Related to Ultimate Loss Experience
Deficient
Redundant
32
MPLI Reserve Ratio Analysis mdash Accident-Year IBNRIncurred
bull At Same Period of Development Incurred but Not Reported (IBNR) to Incurred Should Be Similar
Across Accident Years
bull LowerHigher IBNR Levels for One AY Versus Others Indicative of Reserve WeaknessStrength
PropertyCasualty Industry mdash Medical Malpractice Claims Made( IBNRIncurred)
Months of Development
Accident Year 12 24 36 48 60 72 84 96 108 120
2007 616 382 264 177 110 69 35 21 16 11
2008 599 335 203 141 87 46 33 27 14 mdash
2009 599 330 207 142 93 54 39 20 mdash mdash
2010 588 321 181 121 79 47 33 mdash mdash mdash
2011 600 300 169 114 72 36 mdash mdash mdash mdash
2012 611 299 162 104 63 mdash mdash mdash mdash mdash
2013 605 296 168 106 mdash mdash mdash mdash mdash mdash
2014 615 334 194 mdash mdash mdash mdash mdash mdash mdash
2015 635 329 mdash mdash mdash mdash mdash mdash mdash mdash
2016 617 mdash mdash mdash mdash mdash mdash mdash mdash mdash
Average 608 325 194 129 84 50 35 22 15 mdash
Difference 08 04 01 (24) (21) (14) (03) (03) (01) mdash
Source SNL Financial
33
Reserve Adequacy mdash Ratio Analysis
(40)
(30)
(20)
(10)
0
10
20
30
0 5 10 15 20 25 30 35 40 45
(IBNRIncurred Losses at 24 Months )IBNR ndash Incurred but not reported
Source SNL Financial
( Incurred Losses Deficient[Redundant])
Historical Accident-Year Reserve Development Related to IBNR Levels(Accident Years 1987ndash2011)
Correlation = (78)
R-Squared = 74
Deficient
Redundant
Analysis of Industry MPLI Claims Made for Accident Years 1987ndash2011
bull HigherLower IBNR Levels Relative to Incurred Losses at Early Periods of Development Related
to Ultimate Loss Experience
34
ALL FITCH CREDIT RATINGS ARE SUBJECT TO CERTAIN LIMITATIONS AND DISCLAIMERS
PLEASE READ THESE LIMITATIONS AND DISCLAIMERS BY FOLLOWING THIS LINK
HTTPSFITCHRATINGSCOMUNDERSTANDINGCREDITRATINGS IN ADDITION RATING
DEFINITIONS AND THE TERMS OF USE OF SUCH RATINGS ARE AVAILABLE ON THE
AGENCYS PUBLIC WEB SITE
AT WWWFITCHRATINGSCOM PUBLISHED RATINGS CRITERIA AND METHODOLOGIES ARE
AVAILABLE FROM THIS SITE AT ALL TIMES FITCHS CODE OF CONDUCT CONFIDENTIALITY
CONFLICTS OF INTEREST AFFILIATE FIREWALL COMPLIANCE AND OTHER RELEVANT
POLICIES AND PROCEDURES ARE ALSO AVAILABLE FROM THE CODE OF CONDUCT
SECTION OF THIS SITE FITCH MAY HAVE PROVIDED ANOTHER PERMISSIBLE SERVICE TO
THE RATED ENTITY OR ITS RELATED THIRD PARTIES DETAILS OF THIS SERVICE FOR
RATINGS FOR WHICH THE LEAD ANALYST IS BASED IN AN EU-REGISTERED ENTITY CAN BE
FOUND ON THE ENTITY SUMMARY PAGE FOR THIS ISSUER ON THE FITCH WEBSITE
Copyright copy 2017 by Fitch Ratings Inc Fitch Ratings Ltd and its subsidiaries 33 Whitehall Street
NY NY 10004 Telephone 1-800-753-4824 (212) 908-0500 Fax (212) 480-4435 Reproduction or
retransmission in whole or in part is prohibited except by permission All rights reserved In issuing
and maintaining its ratings and in making other reports (including forecast information) Fitch relies on
factual information it receives from issuers and underwriters and from other sources Fitch believes to
be credible Fitch conducts a reasonable investigation of the factual information relied upon by it in
accordance with its ratings methodology and obtains reasonable verification of that information from
independent sources to the extent such sources are available for a given security or in a given
jurisdiction The manner of Fitchrsquos factual investigation and the scope of the third-party verification it
obtains will vary depending on the nature of the rated security and its issuer the requirements and
practices in the jurisdiction in which the rated security is offered and sold andor the issuer is located
the availability and nature of relevant public information access to the management of the issuer and
its advisers the availability of pre-existing third-party verifications such as audit reports agreed-upon
procedures letters appraisals actuarial reports engineering reports legal opinions and other reports
provided by third parties the availability of independent and competent third-party verification sources
with respect to the particular security or in the particular jurisdiction of the issuer and a variety of
other factors Users of Fitchrsquos ratings and reports should understand that neither an enhanced factual
investigation nor any third-party verification can ensure that all of the information Fitch relies on in
connection with a rating or a report will be accurate and complete Ultimately the issuer and its
advisers are responsible for the accuracy of the information they provide to Fitch and to the market in
offering documents and other reports In issuing its ratings and its reports Fitch must rely on the work
of experts including independent auditors with respect to financial statements and attorneys with
respect to legal and tax matters Further ratings and forecasts of financial and other information are
inherently forward-looking and embody assumptions and predictions about future events that by their
nature cannot be verified as facts As a result despite any verification of current facts ratings and
forecasts can be affected by future events or conditions that were not anticipated at the time a rating
or forecast was issued or affirmed
The information in this report is provided ldquoas isrdquo without any representation or warranty of any kind
and Fitch does not represent or warrant that the report or any of its contents will meet any of the
requirements of a recipient of the report A Fitch rating is an opinion as to the creditworthiness of a
security This opinion and reports made by Fitch are based on established criteria and methodologies
that Fitch is continuously evaluating and updating Therefore ratings and reports are the collective
work product of Fitch and no individual or group of individuals is solely responsible for a rating or a
report The rating does not address the risk of loss due to risks other than credit risk unless such risk
is specifically mentioned Fitch is not engaged in the offer or sale of any security All Fitch reports
have shared authorship Individuals identified in a Fitch report were involved in but are not solely
responsible for the opinions stated therein The individuals are named for contact purposes only A
report providing a Fitch rating is neither a prospectus nor a substitute for the information assembled
verified and presented to investors by the issuer and its agents in connection with the sale of the
securities Ratings may be changed or withdrawn at any time for any reason in the sole discretion of
Fitch Fitch does not provide investment advice of any sort Ratings are not a recommendation to buy
sell or hold any security Ratings do not comment on the adequacy of market price the suitability of
any security for a particular investor or the tax-exempt nature or taxability of payments made in
respect to any security Fitch receives fees from issuers insurers guarantors other obligors and
underwriters for rating securities Such fees generally vary from US$1000 to US$750000 (or the
applicable currency equivalent) per issue In certain cases Fitch will rate all or a number of issues
issued by a particular issuer or insured or guaranteed by a particular insurer or guarantor for a single
annual fee Such fees are expected to vary from US$10000 to US$1500000 (or the applicable
currency equivalent) The assignment publication or dissemination of a rating by Fitch shall not
constitute a consent by Fitch to use its name as an expert in connection with any registration
statement filed under the United States securities laws the Financial Services and Markets Act of
2000 of the United Kingdom or the securities laws of any particular jurisdiction Due to the relative
efficiency of electronic publishing and distribution Fitch research may be available to electronic
subscribers up to three days earlier than to print subscribers
For Australia New Zealand Taiwan and South Korea only Fitch Australia Pty Ltd holds an Australian
financial services license (AFS license no 337123) which authorizes it to provide credit ratings to
wholesale clients only Credit ratings information published by Fitch is not intended to be used by
persons who are retail clients within the meaning of the Corporations Act 2001
fitchratings
fitchratingscom
New York London33 Whitehall Street
New York NY 10004
30 North Colonnade
Canary Wharf
London E14 5GN
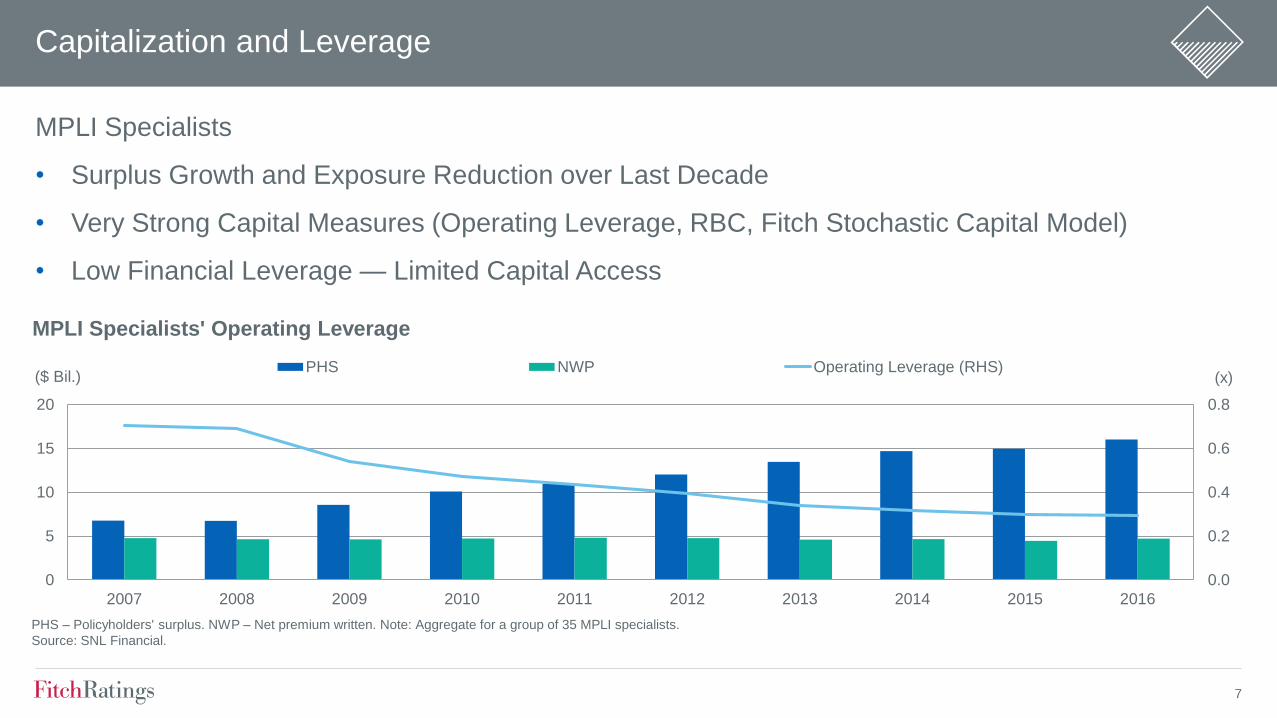
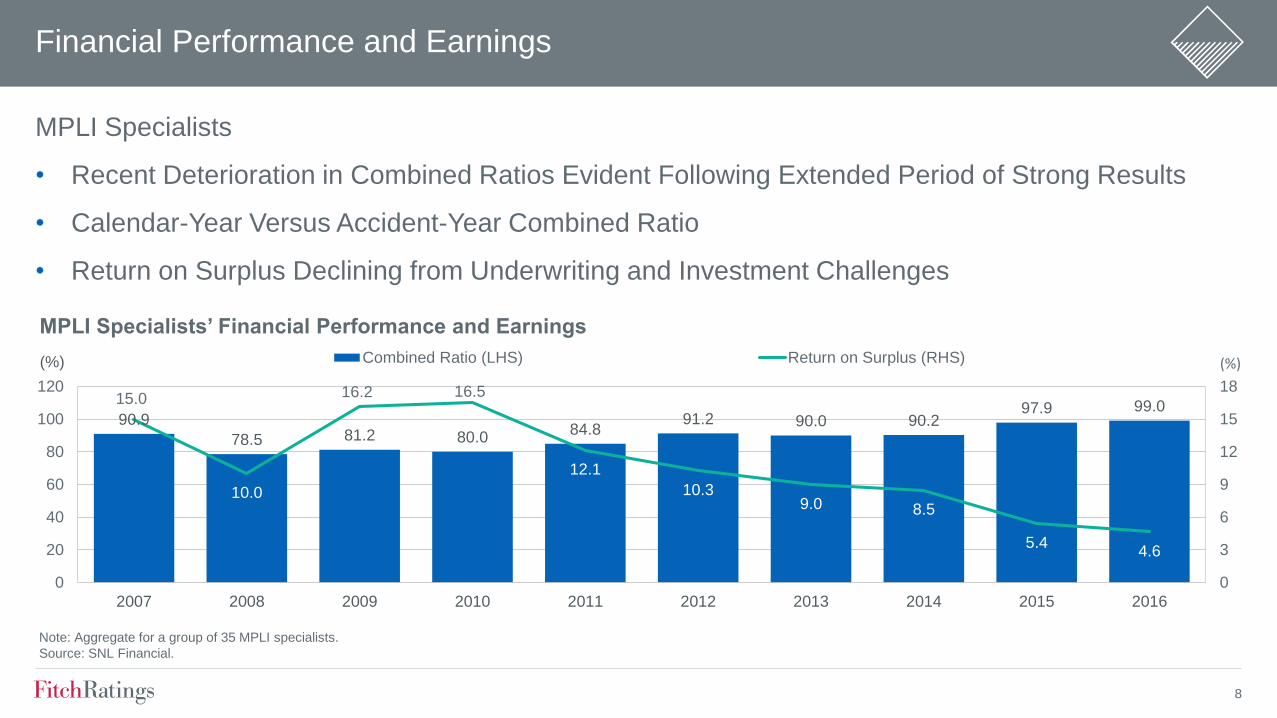
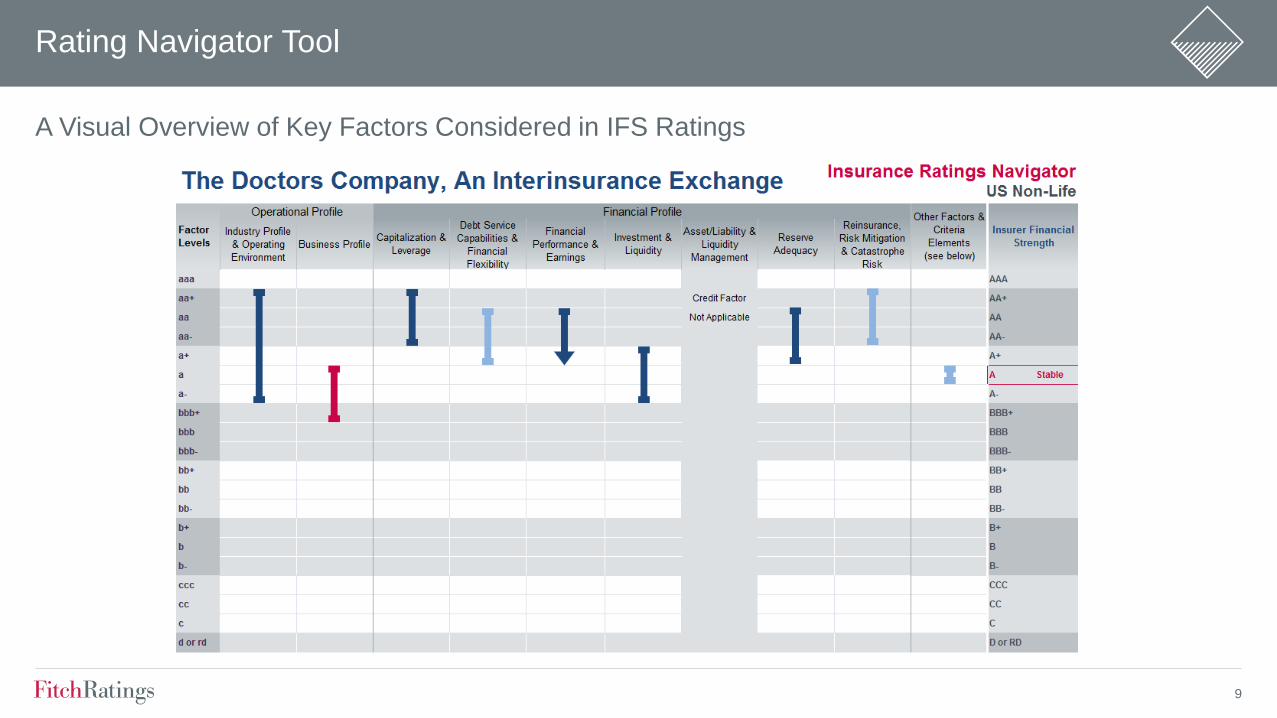
9
Rating Navigator Tool
A Visual Overview of Key Factors Considered in IFS Ratings
10
MPLI Reserve Analysis2
11
Workers Comp24
Other Liability22
Commercial Multiperil
6
Reinsurance6
MPLI4
Homeowners4
Special Property
2Other
Reserves3
Source SNL Financial
PropertyCasualty Industry Loss Reserves YE 2016(Total Industry Reserves = $621 Bil)
Private
Passenger Auto
20
Commercial Auto
5
Financial
Guaranty
Mortgage
Insurance
2Product Liability
2
MPLI mdash Reserve Characteristics
bull Represent 44 of Industry 2016 Loss
Reserves
bull More Volatile Segment Versus Other PC Lines
bull Longer-Tail Claims Liabilities
bull Large Defense Costs Component to Claims
12
MPLI mdash Underwriting and Reserve Cyclicality
(60)
(40)
(20)
0
20
40
60
80
100
120
140
()
PropertyCasualty Industry Historical Accident-Year Results
Loss Ratio Change (Original Versus Latest Reported) Latest Loss Ratio Estimate
Note MPLI claims made
Source SNL Financial
13
Reserve Characteristics Volatility
MPLI Claims Made Has Higher Underwriting and Reserve Volatility than Nearly All Major PC Segments
Private Passenger Auto WCAll Lines
Commercial AutoCMP
HO
OL OCC
Specialty LiabilityMPLI CM
OL CM
Prod Liab Occ
0
5
10
15
20
25
30
0 5 10 15 20 25 30
(Average Loss Ratio Volatility )
Average Loss Ratio Volatility Versus Reserve Volatility by Segment
WC ndash Workers compensation CMP ndash Commercial multiperil HO ndash Homeowners OL OCC ndash Other liability ndash occurrence MPLI CM ndash Medical practice liability insurance claims made OL CM ndash Other
liability ndash claims made Liab OCC ndash Liability occurrence
Source SNL Financial Fitch
()
14
bull Slower Payout Versus Most PC Segments
bull Tail Risk Higher in Workersrsquo Compensation
Reserves Characteristics mdash Claims Duration
0
20
40
60
80
100
120
1 2 3 4 5 6 7 8 9 10
()
Loss Payment Pattern by Segment
Homeowners Workers Comp CMP MPLI CM
CMP ndash Commercial multiperil Note Propertycasualty industry aggregate
Source SNL Financial
(Years of Development)
15
bull Approximately 73 of Industry MPLI Reserves Are in Latest Four Accident Years 2013ndash2016
MPLI Reserve Composition
201624
201521
201416
201312
20128
20116
20104
20092
20082
20071 2006 and Prior
4
Source SNL Financial
Industry MPLI Reserves by Accident Year(73 of Reserves Relate to Accident-Years 2013ndash2016)
16
Large Litigation Component of MPLI Claims mdash Higher of Losses in Defense
and Cost Containment Costs
Reserve Characteristics mdash Defense Costs
0
5
10
15
20
25
30
35
MPLI CM MPLI OCC Other LiabilityCM
Other LiabilityOCC
CMP Workers Comp CommercialAuto
All Lines Personal Auto Homeowners
()
Defense and Cost Containment Costs of Total Net Incurred(Average Accident Years 2006ndash2015)
CM ndash Claims made OCC ndash Occurrence CMP ndash Commercial multiperil Note Propertycasualty industry aggregate data
Source SNL Financial
17
MPLI Reserve Analysis
bull Reserve Profile
bull Reserve Growth
bull Reserve Experience
bull Reserve Adequacy
18
Reserve Profile
Reserve Composition and Inherent Risk
bull Reserve Segment Mix and Diversification
bull Reserve Leverage
bull Reserve Risk Relative to Underwriting Risk
Implied Weighting of Reserves in Rating
Loss Reserves
Incurred Losses
Reserve Leverage
lt10 10ndash15 gt15
gt20 Medium High High
10ndash20 Medium Medium High
lt10 Low Medium Medium
19
MPLI Specialists Reserve Leverage Declining over Time with Surplus Growth
ReservesIncurred Ratio Very High mdash Implies Greater Capital Sensitivity to Reserve Changes than
Current Underwriting Period
MPLI Reserve Profile
00
05
10
15
20
25
0
3
6
9
12
15
18
2007 2008 2009 2010 2011 2012 2013 2014 2015 2016
($ Bil)
MPLI Specialists Reserve Leverage
PHS Reserves Reserve Leverage
PHS ndash Policyholders surplus Note Aggregate for a group of 35 MPLI specialists
Source SNL Financial
(x)
00
10
20
30
40
50
60
70
2007 2008 2009 2010 2011 2012 2013 2014 2015 2016
(x)ReservesCY Incurred Reserve Leverage
CY ndash Calendar year Note Aggregate for a group of 35 MPLI specialists
Source SNL Financial
MPLI Specialists Reserve Leverage Versus Reserves
CY Incurred
20
Over Long Term an Insurerrsquos Reserves Should Grow Commensurate with Exposures
Key Ratios
bull Calendar-Year PaidCalendar-Year Incurred Losses
bull ReservesEarned Premiums (Changes over Time)
MPLI Reserve Growth
00
02
04
06
08
10
12
14
2007 2008 2009 2010 2011 2012 2013 2014 2015 2016
(x)
Note Aggregate for a group of 35 MPLI specialists Calendar-year paid and incurred losses
Source SNL Financial
Paid gt Incurred Loss Indicative of
Reserve Weakness but Incurred
Influence by Reserve Takedowns
MPLI Specialists Reserve Growth Indications(PaidIncurred Losses)
30
31
32
33
34
2007 2008 2009 2010 2011 2012 2013 2014 2015 2016
(x)
Note Aggregate for a group of 35 MPLI specialists
Source SNL Financial
Stable Ratio = Reserve
Changes Keeping Pace
with Premium Changes
MPLI Specialists Reserve Growth Indications(ReservesEarned Premium)
21
Key Ratios
bull Calendar Year
‒ One Year Development Prior-Year Reserves
‒ One Year Development Prior-Year Surplus
‒ One Year Development Earned Premiums
bull Accident Year
‒ Current Loss Ratio Estimate Versus Original Estimate
‒ Accident-Year Development History and Trends
MPLI Reserve Experience
22
Reserve Experience mdash Favorable MPLI Development
bull Reserve Development Still Highly Favorable but Slowing Considerably
196
237228
266
221206
245
198
166
116
0
5
10
15
20
25
30
2007 2008 2009 2010 2011 2012 2013 2014 2015 2016
( of Earned Premiums)
MPLI Calendar-Year Reserve Development
Note Excludes MCIC Vermont Propertycasualty industry aggregate
Source SNL Financial
Favorable
Development
23
Reserve Experience mdash Calendar-Year Development
bull MPLI Development Greatly Exceeds Other Commercial Lines Segments over Last Decade
bull Magnitude of Favorable Development in MPLI Declining
(30)
(25)
(20)
(15)
(10)
(5)
0
5
10
15
Commercial Auto Other Liability mdash Claims Made Other Liability mdash Occurrence MPLI mdash Claims Made Workers Compensation
() 2012 2013 2014 2015 2016
Source SNL Financial
Segment Calendar-Year Development as a of Earned Premium mdash (Favorable)Unfavorable
24
Favorable Reserve Development Slowing
(5)
0
5
10
15
20
2015 2014 2013 2012 2011 2010 2009 2008 2007 2006 2005 2004 2003
12ndash24 Months 24ndash36 Months 36ndash48 Months
Note Propertycasualty industry aggregate MPLI claims made
Source SNL Financial
( Favorable[Unfavorable])
Favorable MPLI Accident-Year Development Slowing mdash Change in Loss Ratio
25
Favorable Reserve Development Slowing
0
10
20
30
40
50
60
70
80
90
2015 2014 2013 2012 2011 2010 2009 2008 2007
()
Accident-Year Loss Ratio Changes by Time of Development
12 Months 24 Months 36 Months 48 Months 60 Months 72 Months 84 Months 96 Months 108 Months 120 Months
Note Industry aggregate MPLI claims made
Source SNL Financial
26
Accident-Year Loss Ratio
bull Claims Made Accident-Year Loss Ratio Rising
bull Will Recent Accident-Years Develop Downward Like 2003ndash2010
510 574
619 672
736 788
829 859 886 867
0
10
20
30
40
50
60
70
80
90
100
2007 2008 2009 2010 2011 2012 2013 2014 2015 2016
()
Accident-Year Loss and LAE Ratio(Current Loss Ratio Estimate)
Note Propertycasualty industry aggregate MPLI claims made
Source SNL Financial Fitch
27
Accident-Year Loss Ratio Development
bull Recent Accident-Years Favorable Development Pattern Lagging Past Highly Redundant AYs
(27) (21)(19) (16) (9)
(5) 00 1
0
10
20
30
40
50
60
70
80
90
100
2007 2008 2009 2010 2011 2012 2013 2014 2015
()
Accident-Year Loss and LAE Ratio Development
Current LR Est Original LR Est
LR ndash Loss ratio Note Propertycasualty industry aggregate MPLI claims made
Source SNL Financial Fitch
Change Current
LR Versus Original
28
MPLI Reserve Adequacy
Key Considerations
bull Likelihood of Balance Sheet Reported Reserves to Develop HigherLower over Time
bull Stress Test Capital Impact of Potential Deficiencies
Analytical Tools
bull Project Reserve Adequacy Using Loss Development Methods (PaidCase Incurred)
bull Accident-Year Ratio Analysis
29
Reserve Adequacy mdash MPLI
bull Initial Analysis of Industry 2016 Reserves
bull MPLI Claims Made and Occurrence Reserves Still 5ndash7 Redundant ($14 Billionndash$20 Billion)
(09)
(09)(20)
(20) (34) (37) (20)
0
10
20
30
40
50
60
70
80
90
2007 2008 2009 2010 2011 2012 2013 2014 2015 2016
()
Estimated Reserve Adequacy mdash Paid Development Method
Reported Loss Ratio Projected Loss Ratio
Note Propertycasualty industry aggregate MPLI claims made
Source SNL Financial
Accident-Year Loss
Ratio Redundant
30
MPLI Reserve Ratio Analysis mdash Accident-Year PaidIncurred
bull At Same Period of Development Paid to Incurred Losses Should Be Similar Across Accident Years
bull HigherLower Paid to Incurred for One Accident Year Versus Others Indicative of Reserve
WeaknessStrength
PropertyCasualty Industry mdash Medical Malpractice Claims Made( PaidIncurred)
Months of Development
Accident Year 12 24 36 48 60 72 84 96 108 120
2007 33 182 378 540 692 788 865 902 932 962
2008 37 189 391 568 712 817 862 899 945 mdash
2009 38 203 405 580 719 806 857 928 mdash mdash
2010 41 206 408 576 713 816 871 mdash mdash mdash
2011 39 202 420 577 731 831 mdash mdash mdash mdash
2012 38 219 420 607 743 mdash mdash mdash mdash mdash
2013 45 218 442 615 mdash mdash mdash mdash mdash mdash
2014 44 218 430 mdash mdash mdash mdash mdash mdash mdash
2015 40 207 mdash mdash mdash mdash mdash mdash mdash mdash
2016 43 mdash mdash mdash mdash mdash mdash mdash mdash mdash
Average 40 205 412 580 718 811 864 909 939 mdash
Difference 03 02 18 34 25 19 07 18 06 mdash
Source SNL Financial
31
(50)
(40)
(30)
(20)
(10)
0
10
20
30
10 15 20 25 30 35
(PaidIncurred Losses at 24 Months )
Source SNL Financial
( Incurred Losses Deficient[Redundant])
Historical Accident-Year Reserve Development Related to Paid Levels(Accident Years 1987ndash2011)
Correlation = 92
R-Squared = 84
Reserve Ratio Analysis mdash Accident-Year PaidIncurred
Analysis of Industry MPLI Claims Made for Accident Years 1987ndash2011
bull LowerHigher Cumulative Paid Loss Levels Relative to Incurred Losses at Early Periods of
Development Related to Ultimate Loss Experience
Deficient
Redundant
32
MPLI Reserve Ratio Analysis mdash Accident-Year IBNRIncurred
bull At Same Period of Development Incurred but Not Reported (IBNR) to Incurred Should Be Similar
Across Accident Years
bull LowerHigher IBNR Levels for One AY Versus Others Indicative of Reserve WeaknessStrength
PropertyCasualty Industry mdash Medical Malpractice Claims Made( IBNRIncurred)
Months of Development
Accident Year 12 24 36 48 60 72 84 96 108 120
2007 616 382 264 177 110 69 35 21 16 11
2008 599 335 203 141 87 46 33 27 14 mdash
2009 599 330 207 142 93 54 39 20 mdash mdash
2010 588 321 181 121 79 47 33 mdash mdash mdash
2011 600 300 169 114 72 36 mdash mdash mdash mdash
2012 611 299 162 104 63 mdash mdash mdash mdash mdash
2013 605 296 168 106 mdash mdash mdash mdash mdash mdash
2014 615 334 194 mdash mdash mdash mdash mdash mdash mdash
2015 635 329 mdash mdash mdash mdash mdash mdash mdash mdash
2016 617 mdash mdash mdash mdash mdash mdash mdash mdash mdash
Average 608 325 194 129 84 50 35 22 15 mdash
Difference 08 04 01 (24) (21) (14) (03) (03) (01) mdash
Source SNL Financial
33
Reserve Adequacy mdash Ratio Analysis
(40)
(30)
(20)
(10)
0
10
20
30
0 5 10 15 20 25 30 35 40 45
(IBNRIncurred Losses at 24 Months )IBNR ndash Incurred but not reported
Source SNL Financial
( Incurred Losses Deficient[Redundant])
Historical Accident-Year Reserve Development Related to IBNR Levels(Accident Years 1987ndash2011)
Correlation = (78)
R-Squared = 74
Deficient
Redundant
Analysis of Industry MPLI Claims Made for Accident Years 1987ndash2011
bull HigherLower IBNR Levels Relative to Incurred Losses at Early Periods of Development Related
to Ultimate Loss Experience
34
ALL FITCH CREDIT RATINGS ARE SUBJECT TO CERTAIN LIMITATIONS AND DISCLAIMERS
PLEASE READ THESE LIMITATIONS AND DISCLAIMERS BY FOLLOWING THIS LINK
HTTPSFITCHRATINGSCOMUNDERSTANDINGCREDITRATINGS IN ADDITION RATING
DEFINITIONS AND THE TERMS OF USE OF SUCH RATINGS ARE AVAILABLE ON THE
AGENCYS PUBLIC WEB SITE
AT WWWFITCHRATINGSCOM PUBLISHED RATINGS CRITERIA AND METHODOLOGIES ARE
AVAILABLE FROM THIS SITE AT ALL TIMES FITCHS CODE OF CONDUCT CONFIDENTIALITY
CONFLICTS OF INTEREST AFFILIATE FIREWALL COMPLIANCE AND OTHER RELEVANT
POLICIES AND PROCEDURES ARE ALSO AVAILABLE FROM THE CODE OF CONDUCT
SECTION OF THIS SITE FITCH MAY HAVE PROVIDED ANOTHER PERMISSIBLE SERVICE TO
THE RATED ENTITY OR ITS RELATED THIRD PARTIES DETAILS OF THIS SERVICE FOR
RATINGS FOR WHICH THE LEAD ANALYST IS BASED IN AN EU-REGISTERED ENTITY CAN BE
FOUND ON THE ENTITY SUMMARY PAGE FOR THIS ISSUER ON THE FITCH WEBSITE
Copyright copy 2017 by Fitch Ratings Inc Fitch Ratings Ltd and its subsidiaries 33 Whitehall Street
NY NY 10004 Telephone 1-800-753-4824 (212) 908-0500 Fax (212) 480-4435 Reproduction or
retransmission in whole or in part is prohibited except by permission All rights reserved In issuing
and maintaining its ratings and in making other reports (including forecast information) Fitch relies on
factual information it receives from issuers and underwriters and from other sources Fitch believes to
be credible Fitch conducts a reasonable investigation of the factual information relied upon by it in
accordance with its ratings methodology and obtains reasonable verification of that information from
independent sources to the extent such sources are available for a given security or in a given
jurisdiction The manner of Fitchrsquos factual investigation and the scope of the third-party verification it
obtains will vary depending on the nature of the rated security and its issuer the requirements and
practices in the jurisdiction in which the rated security is offered and sold andor the issuer is located
the availability and nature of relevant public information access to the management of the issuer and
its advisers the availability of pre-existing third-party verifications such as audit reports agreed-upon
procedures letters appraisals actuarial reports engineering reports legal opinions and other reports
provided by third parties the availability of independent and competent third-party verification sources
with respect to the particular security or in the particular jurisdiction of the issuer and a variety of
other factors Users of Fitchrsquos ratings and reports should understand that neither an enhanced factual
investigation nor any third-party verification can ensure that all of the information Fitch relies on in
connection with a rating or a report will be accurate and complete Ultimately the issuer and its
advisers are responsible for the accuracy of the information they provide to Fitch and to the market in
offering documents and other reports In issuing its ratings and its reports Fitch must rely on the work
of experts including independent auditors with respect to financial statements and attorneys with
respect to legal and tax matters Further ratings and forecasts of financial and other information are
inherently forward-looking and embody assumptions and predictions about future events that by their
nature cannot be verified as facts As a result despite any verification of current facts ratings and
forecasts can be affected by future events or conditions that were not anticipated at the time a rating
or forecast was issued or affirmed
The information in this report is provided ldquoas isrdquo without any representation or warranty of any kind
and Fitch does not represent or warrant that the report or any of its contents will meet any of the
requirements of a recipient of the report A Fitch rating is an opinion as to the creditworthiness of a
security This opinion and reports made by Fitch are based on established criteria and methodologies
that Fitch is continuously evaluating and updating Therefore ratings and reports are the collective
work product of Fitch and no individual or group of individuals is solely responsible for a rating or a
report The rating does not address the risk of loss due to risks other than credit risk unless such risk
is specifically mentioned Fitch is not engaged in the offer or sale of any security All Fitch reports
have shared authorship Individuals identified in a Fitch report were involved in but are not solely
responsible for the opinions stated therein The individuals are named for contact purposes only A
report providing a Fitch rating is neither a prospectus nor a substitute for the information assembled
verified and presented to investors by the issuer and its agents in connection with the sale of the
securities Ratings may be changed or withdrawn at any time for any reason in the sole discretion of
Fitch Fitch does not provide investment advice of any sort Ratings are not a recommendation to buy
sell or hold any security Ratings do not comment on the adequacy of market price the suitability of
any security for a particular investor or the tax-exempt nature or taxability of payments made in
respect to any security Fitch receives fees from issuers insurers guarantors other obligors and
underwriters for rating securities Such fees generally vary from US$1000 to US$750000 (or the
applicable currency equivalent) per issue In certain cases Fitch will rate all or a number of issues
issued by a particular issuer or insured or guaranteed by a particular insurer or guarantor for a single
annual fee Such fees are expected to vary from US$10000 to US$1500000 (or the applicable
currency equivalent) The assignment publication or dissemination of a rating by Fitch shall not
constitute a consent by Fitch to use its name as an expert in connection with any registration
statement filed under the United States securities laws the Financial Services and Markets Act of
2000 of the United Kingdom or the securities laws of any particular jurisdiction Due to the relative
efficiency of electronic publishing and distribution Fitch research may be available to electronic
subscribers up to three days earlier than to print subscribers
For Australia New Zealand Taiwan and South Korea only Fitch Australia Pty Ltd holds an Australian
financial services license (AFS license no 337123) which authorizes it to provide credit ratings to
wholesale clients only Credit ratings information published by Fitch is not intended to be used by
persons who are retail clients within the meaning of the Corporations Act 2001
fitchratings
fitchratingscom
New York London33 Whitehall Street
New York NY 10004
30 North Colonnade
Canary Wharf
London E14 5GN

10
MPLI Reserve Analysis2
11
Workers Comp24
Other Liability22
Commercial Multiperil
6
Reinsurance6
MPLI4
Homeowners4
Special Property
2Other
Reserves3
Source SNL Financial
PropertyCasualty Industry Loss Reserves YE 2016(Total Industry Reserves = $621 Bil)
Private
Passenger Auto
20
Commercial Auto
5
Financial
Guaranty
Mortgage
Insurance
2Product Liability
2
MPLI mdash Reserve Characteristics
bull Represent 44 of Industry 2016 Loss
Reserves
bull More Volatile Segment Versus Other PC Lines
bull Longer-Tail Claims Liabilities
bull Large Defense Costs Component to Claims
12
MPLI mdash Underwriting and Reserve Cyclicality
(60)
(40)
(20)
0
20
40
60
80
100
120
140
()
PropertyCasualty Industry Historical Accident-Year Results
Loss Ratio Change (Original Versus Latest Reported) Latest Loss Ratio Estimate
Note MPLI claims made
Source SNL Financial
13
Reserve Characteristics Volatility
MPLI Claims Made Has Higher Underwriting and Reserve Volatility than Nearly All Major PC Segments
Private Passenger Auto WCAll Lines
Commercial AutoCMP
HO
OL OCC
Specialty LiabilityMPLI CM
OL CM
Prod Liab Occ
0
5
10
15
20
25
30
0 5 10 15 20 25 30
(Average Loss Ratio Volatility )
Average Loss Ratio Volatility Versus Reserve Volatility by Segment
WC ndash Workers compensation CMP ndash Commercial multiperil HO ndash Homeowners OL OCC ndash Other liability ndash occurrence MPLI CM ndash Medical practice liability insurance claims made OL CM ndash Other
liability ndash claims made Liab OCC ndash Liability occurrence
Source SNL Financial Fitch
()
14
bull Slower Payout Versus Most PC Segments
bull Tail Risk Higher in Workersrsquo Compensation
Reserves Characteristics mdash Claims Duration
0
20
40
60
80
100
120
1 2 3 4 5 6 7 8 9 10
()
Loss Payment Pattern by Segment
Homeowners Workers Comp CMP MPLI CM
CMP ndash Commercial multiperil Note Propertycasualty industry aggregate
Source SNL Financial
(Years of Development)
15
bull Approximately 73 of Industry MPLI Reserves Are in Latest Four Accident Years 2013ndash2016
MPLI Reserve Composition
201624
201521
201416
201312
20128
20116
20104
20092
20082
20071 2006 and Prior
4
Source SNL Financial
Industry MPLI Reserves by Accident Year(73 of Reserves Relate to Accident-Years 2013ndash2016)
16
Large Litigation Component of MPLI Claims mdash Higher of Losses in Defense
and Cost Containment Costs
Reserve Characteristics mdash Defense Costs
0
5
10
15
20
25
30
35
MPLI CM MPLI OCC Other LiabilityCM
Other LiabilityOCC
CMP Workers Comp CommercialAuto
All Lines Personal Auto Homeowners
()
Defense and Cost Containment Costs of Total Net Incurred(Average Accident Years 2006ndash2015)
CM ndash Claims made OCC ndash Occurrence CMP ndash Commercial multiperil Note Propertycasualty industry aggregate data
Source SNL Financial
17
MPLI Reserve Analysis
bull Reserve Profile
bull Reserve Growth
bull Reserve Experience
bull Reserve Adequacy
18
Reserve Profile
Reserve Composition and Inherent Risk
bull Reserve Segment Mix and Diversification
bull Reserve Leverage
bull Reserve Risk Relative to Underwriting Risk
Implied Weighting of Reserves in Rating
Loss Reserves
Incurred Losses
Reserve Leverage
lt10 10ndash15 gt15
gt20 Medium High High
10ndash20 Medium Medium High
lt10 Low Medium Medium
19
MPLI Specialists Reserve Leverage Declining over Time with Surplus Growth
ReservesIncurred Ratio Very High mdash Implies Greater Capital Sensitivity to Reserve Changes than
Current Underwriting Period
MPLI Reserve Profile
00
05
10
15
20
25
0
3
6
9
12
15
18
2007 2008 2009 2010 2011 2012 2013 2014 2015 2016
($ Bil)
MPLI Specialists Reserve Leverage
PHS Reserves Reserve Leverage
PHS ndash Policyholders surplus Note Aggregate for a group of 35 MPLI specialists
Source SNL Financial
(x)
00
10
20
30
40
50
60
70
2007 2008 2009 2010 2011 2012 2013 2014 2015 2016
(x)ReservesCY Incurred Reserve Leverage
CY ndash Calendar year Note Aggregate for a group of 35 MPLI specialists
Source SNL Financial
MPLI Specialists Reserve Leverage Versus Reserves
CY Incurred
20
Over Long Term an Insurerrsquos Reserves Should Grow Commensurate with Exposures
Key Ratios
bull Calendar-Year PaidCalendar-Year Incurred Losses
bull ReservesEarned Premiums (Changes over Time)
MPLI Reserve Growth
00
02
04
06
08
10
12
14
2007 2008 2009 2010 2011 2012 2013 2014 2015 2016
(x)
Note Aggregate for a group of 35 MPLI specialists Calendar-year paid and incurred losses
Source SNL Financial
Paid gt Incurred Loss Indicative of
Reserve Weakness but Incurred
Influence by Reserve Takedowns
MPLI Specialists Reserve Growth Indications(PaidIncurred Losses)
30
31
32
33
34
2007 2008 2009 2010 2011 2012 2013 2014 2015 2016
(x)
Note Aggregate for a group of 35 MPLI specialists
Source SNL Financial
Stable Ratio = Reserve
Changes Keeping Pace
with Premium Changes
MPLI Specialists Reserve Growth Indications(ReservesEarned Premium)
21
Key Ratios
bull Calendar Year
‒ One Year Development Prior-Year Reserves
‒ One Year Development Prior-Year Surplus
‒ One Year Development Earned Premiums
bull Accident Year
‒ Current Loss Ratio Estimate Versus Original Estimate
‒ Accident-Year Development History and Trends
MPLI Reserve Experience
22
Reserve Experience mdash Favorable MPLI Development
bull Reserve Development Still Highly Favorable but Slowing Considerably
196
237228
266
221206
245
198
166
116
0
5
10
15
20
25
30
2007 2008 2009 2010 2011 2012 2013 2014 2015 2016
( of Earned Premiums)
MPLI Calendar-Year Reserve Development
Note Excludes MCIC Vermont Propertycasualty industry aggregate
Source SNL Financial
Favorable
Development
23
Reserve Experience mdash Calendar-Year Development
bull MPLI Development Greatly Exceeds Other Commercial Lines Segments over Last Decade
bull Magnitude of Favorable Development in MPLI Declining
(30)
(25)
(20)
(15)
(10)
(5)
0
5
10
15
Commercial Auto Other Liability mdash Claims Made Other Liability mdash Occurrence MPLI mdash Claims Made Workers Compensation
() 2012 2013 2014 2015 2016
Source SNL Financial
Segment Calendar-Year Development as a of Earned Premium mdash (Favorable)Unfavorable
24
Favorable Reserve Development Slowing
(5)
0
5
10
15
20
2015 2014 2013 2012 2011 2010 2009 2008 2007 2006 2005 2004 2003
12ndash24 Months 24ndash36 Months 36ndash48 Months
Note Propertycasualty industry aggregate MPLI claims made
Source SNL Financial
( Favorable[Unfavorable])
Favorable MPLI Accident-Year Development Slowing mdash Change in Loss Ratio
25
Favorable Reserve Development Slowing
0
10
20
30
40
50
60
70
80
90
2015 2014 2013 2012 2011 2010 2009 2008 2007
()
Accident-Year Loss Ratio Changes by Time of Development
12 Months 24 Months 36 Months 48 Months 60 Months 72 Months 84 Months 96 Months 108 Months 120 Months
Note Industry aggregate MPLI claims made
Source SNL Financial
26
Accident-Year Loss Ratio
bull Claims Made Accident-Year Loss Ratio Rising
bull Will Recent Accident-Years Develop Downward Like 2003ndash2010
510 574
619 672
736 788
829 859 886 867
0
10
20
30
40
50
60
70
80
90
100
2007 2008 2009 2010 2011 2012 2013 2014 2015 2016
()
Accident-Year Loss and LAE Ratio(Current Loss Ratio Estimate)
Note Propertycasualty industry aggregate MPLI claims made
Source SNL Financial Fitch
27
Accident-Year Loss Ratio Development
bull Recent Accident-Years Favorable Development Pattern Lagging Past Highly Redundant AYs
(27) (21)(19) (16) (9)
(5) 00 1
0
10
20
30
40
50
60
70
80
90
100
2007 2008 2009 2010 2011 2012 2013 2014 2015
()
Accident-Year Loss and LAE Ratio Development
Current LR Est Original LR Est
LR ndash Loss ratio Note Propertycasualty industry aggregate MPLI claims made
Source SNL Financial Fitch
Change Current
LR Versus Original
28
MPLI Reserve Adequacy
Key Considerations
bull Likelihood of Balance Sheet Reported Reserves to Develop HigherLower over Time
bull Stress Test Capital Impact of Potential Deficiencies
Analytical Tools
bull Project Reserve Adequacy Using Loss Development Methods (PaidCase Incurred)
bull Accident-Year Ratio Analysis
29
Reserve Adequacy mdash MPLI
bull Initial Analysis of Industry 2016 Reserves
bull MPLI Claims Made and Occurrence Reserves Still 5ndash7 Redundant ($14 Billionndash$20 Billion)
(09)
(09)(20)
(20) (34) (37) (20)
0
10
20
30
40
50
60
70
80
90
2007 2008 2009 2010 2011 2012 2013 2014 2015 2016
()
Estimated Reserve Adequacy mdash Paid Development Method
Reported Loss Ratio Projected Loss Ratio
Note Propertycasualty industry aggregate MPLI claims made
Source SNL Financial
Accident-Year Loss
Ratio Redundant
30
MPLI Reserve Ratio Analysis mdash Accident-Year PaidIncurred
bull At Same Period of Development Paid to Incurred Losses Should Be Similar Across Accident Years
bull HigherLower Paid to Incurred for One Accident Year Versus Others Indicative of Reserve
WeaknessStrength
PropertyCasualty Industry mdash Medical Malpractice Claims Made( PaidIncurred)
Months of Development
Accident Year 12 24 36 48 60 72 84 96 108 120
2007 33 182 378 540 692 788 865 902 932 962
2008 37 189 391 568 712 817 862 899 945 mdash
2009 38 203 405 580 719 806 857 928 mdash mdash
2010 41 206 408 576 713 816 871 mdash mdash mdash
2011 39 202 420 577 731 831 mdash mdash mdash mdash
2012 38 219 420 607 743 mdash mdash mdash mdash mdash
2013 45 218 442 615 mdash mdash mdash mdash mdash mdash
2014 44 218 430 mdash mdash mdash mdash mdash mdash mdash
2015 40 207 mdash mdash mdash mdash mdash mdash mdash mdash
2016 43 mdash mdash mdash mdash mdash mdash mdash mdash mdash
Average 40 205 412 580 718 811 864 909 939 mdash
Difference 03 02 18 34 25 19 07 18 06 mdash
Source SNL Financial
31
(50)
(40)
(30)
(20)
(10)
0
10
20
30
10 15 20 25 30 35
(PaidIncurred Losses at 24 Months )
Source SNL Financial
( Incurred Losses Deficient[Redundant])
Historical Accident-Year Reserve Development Related to Paid Levels(Accident Years 1987ndash2011)
Correlation = 92
R-Squared = 84
Reserve Ratio Analysis mdash Accident-Year PaidIncurred
Analysis of Industry MPLI Claims Made for Accident Years 1987ndash2011
bull LowerHigher Cumulative Paid Loss Levels Relative to Incurred Losses at Early Periods of
Development Related to Ultimate Loss Experience
Deficient
Redundant
32
MPLI Reserve Ratio Analysis mdash Accident-Year IBNRIncurred
bull At Same Period of Development Incurred but Not Reported (IBNR) to Incurred Should Be Similar
Across Accident Years
bull LowerHigher IBNR Levels for One AY Versus Others Indicative of Reserve WeaknessStrength
PropertyCasualty Industry mdash Medical Malpractice Claims Made( IBNRIncurred)
Months of Development
Accident Year 12 24 36 48 60 72 84 96 108 120
2007 616 382 264 177 110 69 35 21 16 11
2008 599 335 203 141 87 46 33 27 14 mdash
2009 599 330 207 142 93 54 39 20 mdash mdash
2010 588 321 181 121 79 47 33 mdash mdash mdash
2011 600 300 169 114 72 36 mdash mdash mdash mdash
2012 611 299 162 104 63 mdash mdash mdash mdash mdash
2013 605 296 168 106 mdash mdash mdash mdash mdash mdash
2014 615 334 194 mdash mdash mdash mdash mdash mdash mdash
2015 635 329 mdash mdash mdash mdash mdash mdash mdash mdash
2016 617 mdash mdash mdash mdash mdash mdash mdash mdash mdash
Average 608 325 194 129 84 50 35 22 15 mdash
Difference 08 04 01 (24) (21) (14) (03) (03) (01) mdash
Source SNL Financial
33
Reserve Adequacy mdash Ratio Analysis
(40)
(30)
(20)
(10)
0
10
20
30
0 5 10 15 20 25 30 35 40 45
(IBNRIncurred Losses at 24 Months )IBNR ndash Incurred but not reported
Source SNL Financial
( Incurred Losses Deficient[Redundant])
Historical Accident-Year Reserve Development Related to IBNR Levels(Accident Years 1987ndash2011)
Correlation = (78)
R-Squared = 74
Deficient
Redundant
Analysis of Industry MPLI Claims Made for Accident Years 1987ndash2011
bull HigherLower IBNR Levels Relative to Incurred Losses at Early Periods of Development Related
to Ultimate Loss Experience
34
ALL FITCH CREDIT RATINGS ARE SUBJECT TO CERTAIN LIMITATIONS AND DISCLAIMERS
PLEASE READ THESE LIMITATIONS AND DISCLAIMERS BY FOLLOWING THIS LINK
HTTPSFITCHRATINGSCOMUNDERSTANDINGCREDITRATINGS IN ADDITION RATING
DEFINITIONS AND THE TERMS OF USE OF SUCH RATINGS ARE AVAILABLE ON THE
AGENCYS PUBLIC WEB SITE
AT WWWFITCHRATINGSCOM PUBLISHED RATINGS CRITERIA AND METHODOLOGIES ARE
AVAILABLE FROM THIS SITE AT ALL TIMES FITCHS CODE OF CONDUCT CONFIDENTIALITY
CONFLICTS OF INTEREST AFFILIATE FIREWALL COMPLIANCE AND OTHER RELEVANT
POLICIES AND PROCEDURES ARE ALSO AVAILABLE FROM THE CODE OF CONDUCT
SECTION OF THIS SITE FITCH MAY HAVE PROVIDED ANOTHER PERMISSIBLE SERVICE TO
THE RATED ENTITY OR ITS RELATED THIRD PARTIES DETAILS OF THIS SERVICE FOR
RATINGS FOR WHICH THE LEAD ANALYST IS BASED IN AN EU-REGISTERED ENTITY CAN BE
FOUND ON THE ENTITY SUMMARY PAGE FOR THIS ISSUER ON THE FITCH WEBSITE
Copyright copy 2017 by Fitch Ratings Inc Fitch Ratings Ltd and its subsidiaries 33 Whitehall Street
NY NY 10004 Telephone 1-800-753-4824 (212) 908-0500 Fax (212) 480-4435 Reproduction or
retransmission in whole or in part is prohibited except by permission All rights reserved In issuing
and maintaining its ratings and in making other reports (including forecast information) Fitch relies on
factual information it receives from issuers and underwriters and from other sources Fitch believes to
be credible Fitch conducts a reasonable investigation of the factual information relied upon by it in
accordance with its ratings methodology and obtains reasonable verification of that information from
independent sources to the extent such sources are available for a given security or in a given
jurisdiction The manner of Fitchrsquos factual investigation and the scope of the third-party verification it
obtains will vary depending on the nature of the rated security and its issuer the requirements and
practices in the jurisdiction in which the rated security is offered and sold andor the issuer is located
the availability and nature of relevant public information access to the management of the issuer and
its advisers the availability of pre-existing third-party verifications such as audit reports agreed-upon
procedures letters appraisals actuarial reports engineering reports legal opinions and other reports
provided by third parties the availability of independent and competent third-party verification sources
with respect to the particular security or in the particular jurisdiction of the issuer and a variety of
other factors Users of Fitchrsquos ratings and reports should understand that neither an enhanced factual
investigation nor any third-party verification can ensure that all of the information Fitch relies on in
connection with a rating or a report will be accurate and complete Ultimately the issuer and its
advisers are responsible for the accuracy of the information they provide to Fitch and to the market in
offering documents and other reports In issuing its ratings and its reports Fitch must rely on the work
of experts including independent auditors with respect to financial statements and attorneys with
respect to legal and tax matters Further ratings and forecasts of financial and other information are
inherently forward-looking and embody assumptions and predictions about future events that by their
nature cannot be verified as facts As a result despite any verification of current facts ratings and
forecasts can be affected by future events or conditions that were not anticipated at the time a rating
or forecast was issued or affirmed
The information in this report is provided ldquoas isrdquo without any representation or warranty of any kind
and Fitch does not represent or warrant that the report or any of its contents will meet any of the
requirements of a recipient of the report A Fitch rating is an opinion as to the creditworthiness of a
security This opinion and reports made by Fitch are based on established criteria and methodologies
that Fitch is continuously evaluating and updating Therefore ratings and reports are the collective
work product of Fitch and no individual or group of individuals is solely responsible for a rating or a
report The rating does not address the risk of loss due to risks other than credit risk unless such risk
is specifically mentioned Fitch is not engaged in the offer or sale of any security All Fitch reports
have shared authorship Individuals identified in a Fitch report were involved in but are not solely
responsible for the opinions stated therein The individuals are named for contact purposes only A
report providing a Fitch rating is neither a prospectus nor a substitute for the information assembled
verified and presented to investors by the issuer and its agents in connection with the sale of the
securities Ratings may be changed or withdrawn at any time for any reason in the sole discretion of
Fitch Fitch does not provide investment advice of any sort Ratings are not a recommendation to buy
sell or hold any security Ratings do not comment on the adequacy of market price the suitability of
any security for a particular investor or the tax-exempt nature or taxability of payments made in
respect to any security Fitch receives fees from issuers insurers guarantors other obligors and
underwriters for rating securities Such fees generally vary from US$1000 to US$750000 (or the
applicable currency equivalent) per issue In certain cases Fitch will rate all or a number of issues
issued by a particular issuer or insured or guaranteed by a particular insurer or guarantor for a single
annual fee Such fees are expected to vary from US$10000 to US$1500000 (or the applicable
currency equivalent) The assignment publication or dissemination of a rating by Fitch shall not
constitute a consent by Fitch to use its name as an expert in connection with any registration
statement filed under the United States securities laws the Financial Services and Markets Act of
2000 of the United Kingdom or the securities laws of any particular jurisdiction Due to the relative
efficiency of electronic publishing and distribution Fitch research may be available to electronic
subscribers up to three days earlier than to print subscribers
For Australia New Zealand Taiwan and South Korea only Fitch Australia Pty Ltd holds an Australian
financial services license (AFS license no 337123) which authorizes it to provide credit ratings to
wholesale clients only Credit ratings information published by Fitch is not intended to be used by
persons who are retail clients within the meaning of the Corporations Act 2001
fitchratings
fitchratingscom
New York London33 Whitehall Street
New York NY 10004
30 North Colonnade
Canary Wharf
London E14 5GN
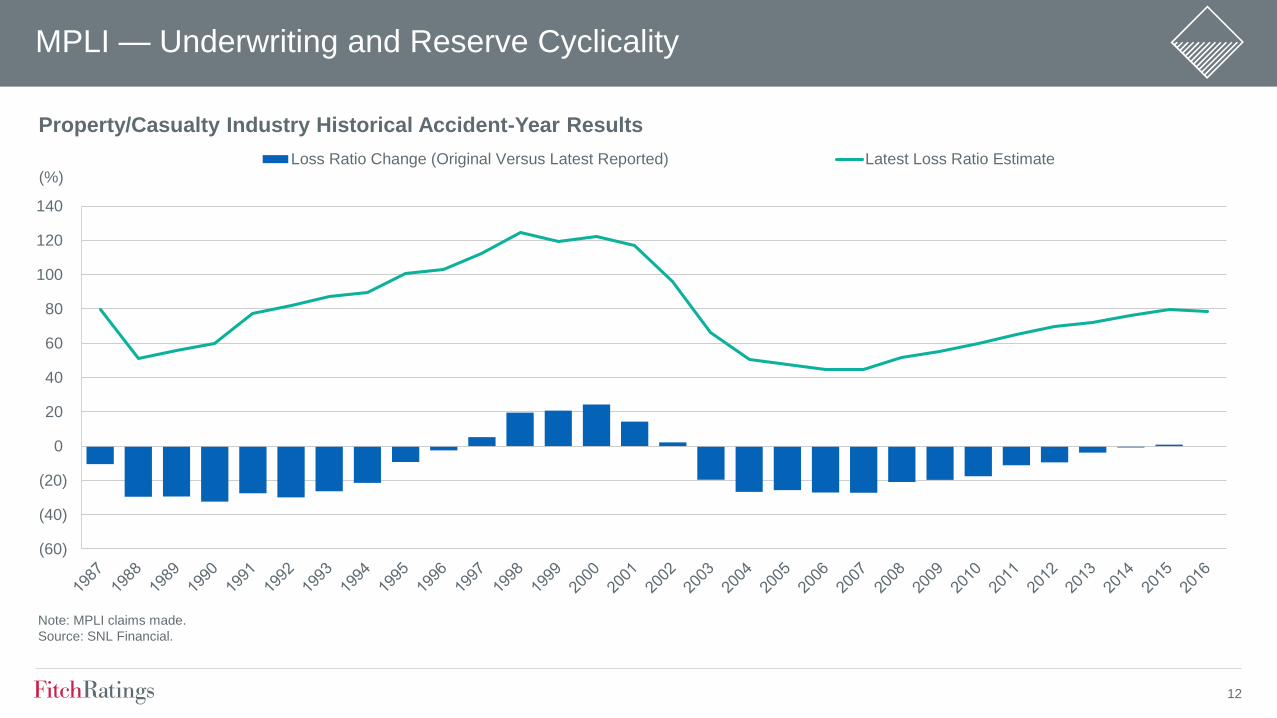
12
MPLI mdash Underwriting and Reserve Cyclicality
(60)
(40)
(20)
0
20
40
60
80
100
120
140
()
PropertyCasualty Industry Historical Accident-Year Results
Loss Ratio Change (Original Versus Latest Reported) Latest Loss Ratio Estimate
Note MPLI claims made
Source SNL Financial
13
Reserve Characteristics Volatility
MPLI Claims Made Has Higher Underwriting and Reserve Volatility than Nearly All Major PC Segments
Private Passenger Auto WCAll Lines
Commercial AutoCMP
HO
OL OCC
Specialty LiabilityMPLI CM
OL CM
Prod Liab Occ
0
5
10
15
20
25
30
0 5 10 15 20 25 30
(Average Loss Ratio Volatility )
Average Loss Ratio Volatility Versus Reserve Volatility by Segment
WC ndash Workers compensation CMP ndash Commercial multiperil HO ndash Homeowners OL OCC ndash Other liability ndash occurrence MPLI CM ndash Medical practice liability insurance claims made OL CM ndash Other
liability ndash claims made Liab OCC ndash Liability occurrence
Source SNL Financial Fitch
()
14
bull Slower Payout Versus Most PC Segments
bull Tail Risk Higher in Workersrsquo Compensation
Reserves Characteristics mdash Claims Duration
0
20
40
60
80
100
120
1 2 3 4 5 6 7 8 9 10
()
Loss Payment Pattern by Segment
Homeowners Workers Comp CMP MPLI CM
CMP ndash Commercial multiperil Note Propertycasualty industry aggregate
Source SNL Financial
(Years of Development)
15
bull Approximately 73 of Industry MPLI Reserves Are in Latest Four Accident Years 2013ndash2016
MPLI Reserve Composition
201624
201521
201416
201312
20128
20116
20104
20092
20082
20071 2006 and Prior
4
Source SNL Financial
Industry MPLI Reserves by Accident Year(73 of Reserves Relate to Accident-Years 2013ndash2016)
16
Large Litigation Component of MPLI Claims mdash Higher of Losses in Defense
and Cost Containment Costs
Reserve Characteristics mdash Defense Costs
0
5
10
15
20
25
30
35
MPLI CM MPLI OCC Other LiabilityCM
Other LiabilityOCC
CMP Workers Comp CommercialAuto
All Lines Personal Auto Homeowners
()
Defense and Cost Containment Costs of Total Net Incurred(Average Accident Years 2006ndash2015)
CM ndash Claims made OCC ndash Occurrence CMP ndash Commercial multiperil Note Propertycasualty industry aggregate data
Source SNL Financial
17
MPLI Reserve Analysis
bull Reserve Profile
bull Reserve Growth
bull Reserve Experience
bull Reserve Adequacy
18
Reserve Profile
Reserve Composition and Inherent Risk
bull Reserve Segment Mix and Diversification
bull Reserve Leverage
bull Reserve Risk Relative to Underwriting Risk
Implied Weighting of Reserves in Rating
Loss Reserves
Incurred Losses
Reserve Leverage
lt10 10ndash15 gt15
gt20 Medium High High
10ndash20 Medium Medium High
lt10 Low Medium Medium
19
MPLI Specialists Reserve Leverage Declining over Time with Surplus Growth
ReservesIncurred Ratio Very High mdash Implies Greater Capital Sensitivity to Reserve Changes than
Current Underwriting Period
MPLI Reserve Profile
00
05
10
15
20
25
0
3
6
9
12
15
18
2007 2008 2009 2010 2011 2012 2013 2014 2015 2016
($ Bil)
MPLI Specialists Reserve Leverage
PHS Reserves Reserve Leverage
PHS ndash Policyholders surplus Note Aggregate for a group of 35 MPLI specialists
Source SNL Financial
(x)
00
10
20
30
40
50
60
70
2007 2008 2009 2010 2011 2012 2013 2014 2015 2016
(x)ReservesCY Incurred Reserve Leverage
CY ndash Calendar year Note Aggregate for a group of 35 MPLI specialists
Source SNL Financial
MPLI Specialists Reserve Leverage Versus Reserves
CY Incurred
20
Over Long Term an Insurerrsquos Reserves Should Grow Commensurate with Exposures
Key Ratios
bull Calendar-Year PaidCalendar-Year Incurred Losses
bull ReservesEarned Premiums (Changes over Time)
MPLI Reserve Growth
00
02
04
06
08
10
12
14
2007 2008 2009 2010 2011 2012 2013 2014 2015 2016
(x)
Note Aggregate for a group of 35 MPLI specialists Calendar-year paid and incurred losses
Source SNL Financial
Paid gt Incurred Loss Indicative of
Reserve Weakness but Incurred
Influence by Reserve Takedowns
MPLI Specialists Reserve Growth Indications(PaidIncurred Losses)
30
31
32
33
34
2007 2008 2009 2010 2011 2012 2013 2014 2015 2016
(x)
Note Aggregate for a group of 35 MPLI specialists
Source SNL Financial
Stable Ratio = Reserve
Changes Keeping Pace
with Premium Changes
MPLI Specialists Reserve Growth Indications(ReservesEarned Premium)
21
Key Ratios
bull Calendar Year
‒ One Year Development Prior-Year Reserves
‒ One Year Development Prior-Year Surplus
‒ One Year Development Earned Premiums
bull Accident Year
‒ Current Loss Ratio Estimate Versus Original Estimate
‒ Accident-Year Development History and Trends
MPLI Reserve Experience
22
Reserve Experience mdash Favorable MPLI Development
bull Reserve Development Still Highly Favorable but Slowing Considerably
196
237228
266
221206
245
198
166
116
0
5
10
15
20
25
30
2007 2008 2009 2010 2011 2012 2013 2014 2015 2016
( of Earned Premiums)
MPLI Calendar-Year Reserve Development
Note Excludes MCIC Vermont Propertycasualty industry aggregate
Source SNL Financial
Favorable
Development
23
Reserve Experience mdash Calendar-Year Development
bull MPLI Development Greatly Exceeds Other Commercial Lines Segments over Last Decade
bull Magnitude of Favorable Development in MPLI Declining
(30)
(25)
(20)
(15)
(10)
(5)
0
5
10
15
Commercial Auto Other Liability mdash Claims Made Other Liability mdash Occurrence MPLI mdash Claims Made Workers Compensation
() 2012 2013 2014 2015 2016
Source SNL Financial
Segment Calendar-Year Development as a of Earned Premium mdash (Favorable)Unfavorable
24
Favorable Reserve Development Slowing
(5)
0
5
10
15
20
2015 2014 2013 2012 2011 2010 2009 2008 2007 2006 2005 2004 2003
12ndash24 Months 24ndash36 Months 36ndash48 Months
Note Propertycasualty industry aggregate MPLI claims made
Source SNL Financial
( Favorable[Unfavorable])
Favorable MPLI Accident-Year Development Slowing mdash Change in Loss Ratio
25
Favorable Reserve Development Slowing
0
10
20
30
40
50
60
70
80
90
2015 2014 2013 2012 2011 2010 2009 2008 2007
()
Accident-Year Loss Ratio Changes by Time of Development
12 Months 24 Months 36 Months 48 Months 60 Months 72 Months 84 Months 96 Months 108 Months 120 Months
Note Industry aggregate MPLI claims made
Source SNL Financial
26
Accident-Year Loss Ratio
bull Claims Made Accident-Year Loss Ratio Rising
bull Will Recent Accident-Years Develop Downward Like 2003ndash2010
510 574
619 672
736 788
829 859 886 867
0
10
20
30
40
50
60
70
80
90
100
2007 2008 2009 2010 2011 2012 2013 2014 2015 2016
()
Accident-Year Loss and LAE Ratio(Current Loss Ratio Estimate)
Note Propertycasualty industry aggregate MPLI claims made
Source SNL Financial Fitch
27
Accident-Year Loss Ratio Development
bull Recent Accident-Years Favorable Development Pattern Lagging Past Highly Redundant AYs
(27) (21)(19) (16) (9)
(5) 00 1
0
10
20
30
40
50
60
70
80
90
100
2007 2008 2009 2010 2011 2012 2013 2014 2015
()
Accident-Year Loss and LAE Ratio Development
Current LR Est Original LR Est
LR ndash Loss ratio Note Propertycasualty industry aggregate MPLI claims made
Source SNL Financial Fitch
Change Current
LR Versus Original
28
MPLI Reserve Adequacy
Key Considerations
bull Likelihood of Balance Sheet Reported Reserves to Develop HigherLower over Time
bull Stress Test Capital Impact of Potential Deficiencies
Analytical Tools
bull Project Reserve Adequacy Using Loss Development Methods (PaidCase Incurred)
bull Accident-Year Ratio Analysis
29
Reserve Adequacy mdash MPLI
bull Initial Analysis of Industry 2016 Reserves
bull MPLI Claims Made and Occurrence Reserves Still 5ndash7 Redundant ($14 Billionndash$20 Billion)
(09)
(09)(20)
(20) (34) (37) (20)
0
10
20
30
40
50
60
70
80
90
2007 2008 2009 2010 2011 2012 2013 2014 2015 2016
()
Estimated Reserve Adequacy mdash Paid Development Method
Reported Loss Ratio Projected Loss Ratio
Note Propertycasualty industry aggregate MPLI claims made
Source SNL Financial
Accident-Year Loss
Ratio Redundant
30
MPLI Reserve Ratio Analysis mdash Accident-Year PaidIncurred
bull At Same Period of Development Paid to Incurred Losses Should Be Similar Across Accident Years
bull HigherLower Paid to Incurred for One Accident Year Versus Others Indicative of Reserve
WeaknessStrength
PropertyCasualty Industry mdash Medical Malpractice Claims Made( PaidIncurred)
Months of Development
Accident Year 12 24 36 48 60 72 84 96 108 120
2007 33 182 378 540 692 788 865 902 932 962
2008 37 189 391 568 712 817 862 899 945 mdash
2009 38 203 405 580 719 806 857 928 mdash mdash
2010 41 206 408 576 713 816 871 mdash mdash mdash
2011 39 202 420 577 731 831 mdash mdash mdash mdash
2012 38 219 420 607 743 mdash mdash mdash mdash mdash
2013 45 218 442 615 mdash mdash mdash mdash mdash mdash
2014 44 218 430 mdash mdash mdash mdash mdash mdash mdash
2015 40 207 mdash mdash mdash mdash mdash mdash mdash mdash
2016 43 mdash mdash mdash mdash mdash mdash mdash mdash mdash
Average 40 205 412 580 718 811 864 909 939 mdash
Difference 03 02 18 34 25 19 07 18 06 mdash
Source SNL Financial
31
(50)
(40)
(30)
(20)
(10)
0
10
20
30
10 15 20 25 30 35
(PaidIncurred Losses at 24 Months )
Source SNL Financial
( Incurred Losses Deficient[Redundant])
Historical Accident-Year Reserve Development Related to Paid Levels(Accident Years 1987ndash2011)
Correlation = 92
R-Squared = 84
Reserve Ratio Analysis mdash Accident-Year PaidIncurred
Analysis of Industry MPLI Claims Made for Accident Years 1987ndash2011
bull LowerHigher Cumulative Paid Loss Levels Relative to Incurred Losses at Early Periods of
Development Related to Ultimate Loss Experience
Deficient
Redundant
32
MPLI Reserve Ratio Analysis mdash Accident-Year IBNRIncurred
bull At Same Period of Development Incurred but Not Reported (IBNR) to Incurred Should Be Similar
Across Accident Years
bull LowerHigher IBNR Levels for One AY Versus Others Indicative of Reserve WeaknessStrength
PropertyCasualty Industry mdash Medical Malpractice Claims Made( IBNRIncurred)
Months of Development
Accident Year 12 24 36 48 60 72 84 96 108 120
2007 616 382 264 177 110 69 35 21 16 11
2008 599 335 203 141 87 46 33 27 14 mdash
2009 599 330 207 142 93 54 39 20 mdash mdash
2010 588 321 181 121 79 47 33 mdash mdash mdash
2011 600 300 169 114 72 36 mdash mdash mdash mdash
2012 611 299 162 104 63 mdash mdash mdash mdash mdash
2013 605 296 168 106 mdash mdash mdash mdash mdash mdash
2014 615 334 194 mdash mdash mdash mdash mdash mdash mdash
2015 635 329 mdash mdash mdash mdash mdash mdash mdash mdash
2016 617 mdash mdash mdash mdash mdash mdash mdash mdash mdash
Average 608 325 194 129 84 50 35 22 15 mdash
Difference 08 04 01 (24) (21) (14) (03) (03) (01) mdash
Source SNL Financial
33
Reserve Adequacy mdash Ratio Analysis
(40)
(30)
(20)
(10)
0
10
20
30
0 5 10 15 20 25 30 35 40 45
(IBNRIncurred Losses at 24 Months )IBNR ndash Incurred but not reported
Source SNL Financial
( Incurred Losses Deficient[Redundant])
Historical Accident-Year Reserve Development Related to IBNR Levels(Accident Years 1987ndash2011)
Correlation = (78)
R-Squared = 74
Deficient
Redundant
Analysis of Industry MPLI Claims Made for Accident Years 1987ndash2011
bull HigherLower IBNR Levels Relative to Incurred Losses at Early Periods of Development Related
to Ultimate Loss Experience
34
ALL FITCH CREDIT RATINGS ARE SUBJECT TO CERTAIN LIMITATIONS AND DISCLAIMERS
PLEASE READ THESE LIMITATIONS AND DISCLAIMERS BY FOLLOWING THIS LINK
HTTPSFITCHRATINGSCOMUNDERSTANDINGCREDITRATINGS IN ADDITION RATING
DEFINITIONS AND THE TERMS OF USE OF SUCH RATINGS ARE AVAILABLE ON THE
AGENCYS PUBLIC WEB SITE
AT WWWFITCHRATINGSCOM PUBLISHED RATINGS CRITERIA AND METHODOLOGIES ARE
AVAILABLE FROM THIS SITE AT ALL TIMES FITCHS CODE OF CONDUCT CONFIDENTIALITY
CONFLICTS OF INTEREST AFFILIATE FIREWALL COMPLIANCE AND OTHER RELEVANT
POLICIES AND PROCEDURES ARE ALSO AVAILABLE FROM THE CODE OF CONDUCT
SECTION OF THIS SITE FITCH MAY HAVE PROVIDED ANOTHER PERMISSIBLE SERVICE TO
THE RATED ENTITY OR ITS RELATED THIRD PARTIES DETAILS OF THIS SERVICE FOR
RATINGS FOR WHICH THE LEAD ANALYST IS BASED IN AN EU-REGISTERED ENTITY CAN BE
FOUND ON THE ENTITY SUMMARY PAGE FOR THIS ISSUER ON THE FITCH WEBSITE
Copyright copy 2017 by Fitch Ratings Inc Fitch Ratings Ltd and its subsidiaries 33 Whitehall Street
NY NY 10004 Telephone 1-800-753-4824 (212) 908-0500 Fax (212) 480-4435 Reproduction or
retransmission in whole or in part is prohibited except by permission All rights reserved In issuing
and maintaining its ratings and in making other reports (including forecast information) Fitch relies on
factual information it receives from issuers and underwriters and from other sources Fitch believes to
be credible Fitch conducts a reasonable investigation of the factual information relied upon by it in
accordance with its ratings methodology and obtains reasonable verification of that information from
independent sources to the extent such sources are available for a given security or in a given
jurisdiction The manner of Fitchrsquos factual investigation and the scope of the third-party verification it
obtains will vary depending on the nature of the rated security and its issuer the requirements and
practices in the jurisdiction in which the rated security is offered and sold andor the issuer is located
the availability and nature of relevant public information access to the management of the issuer and
its advisers the availability of pre-existing third-party verifications such as audit reports agreed-upon
procedures letters appraisals actuarial reports engineering reports legal opinions and other reports
provided by third parties the availability of independent and competent third-party verification sources
with respect to the particular security or in the particular jurisdiction of the issuer and a variety of
other factors Users of Fitchrsquos ratings and reports should understand that neither an enhanced factual
investigation nor any third-party verification can ensure that all of the information Fitch relies on in
connection with a rating or a report will be accurate and complete Ultimately the issuer and its
advisers are responsible for the accuracy of the information they provide to Fitch and to the market in
offering documents and other reports In issuing its ratings and its reports Fitch must rely on the work
of experts including independent auditors with respect to financial statements and attorneys with
respect to legal and tax matters Further ratings and forecasts of financial and other information are
inherently forward-looking and embody assumptions and predictions about future events that by their
nature cannot be verified as facts As a result despite any verification of current facts ratings and
forecasts can be affected by future events or conditions that were not anticipated at the time a rating
or forecast was issued or affirmed
The information in this report is provided ldquoas isrdquo without any representation or warranty of any kind
and Fitch does not represent or warrant that the report or any of its contents will meet any of the
requirements of a recipient of the report A Fitch rating is an opinion as to the creditworthiness of a
security This opinion and reports made by Fitch are based on established criteria and methodologies
that Fitch is continuously evaluating and updating Therefore ratings and reports are the collective
work product of Fitch and no individual or group of individuals is solely responsible for a rating or a
report The rating does not address the risk of loss due to risks other than credit risk unless such risk
is specifically mentioned Fitch is not engaged in the offer or sale of any security All Fitch reports
have shared authorship Individuals identified in a Fitch report were involved in but are not solely
responsible for the opinions stated therein The individuals are named for contact purposes only A
report providing a Fitch rating is neither a prospectus nor a substitute for the information assembled
verified and presented to investors by the issuer and its agents in connection with the sale of the
securities Ratings may be changed or withdrawn at any time for any reason in the sole discretion of
Fitch Fitch does not provide investment advice of any sort Ratings are not a recommendation to buy
sell or hold any security Ratings do not comment on the adequacy of market price the suitability of
any security for a particular investor or the tax-exempt nature or taxability of payments made in
respect to any security Fitch receives fees from issuers insurers guarantors other obligors and
underwriters for rating securities Such fees generally vary from US$1000 to US$750000 (or the
applicable currency equivalent) per issue In certain cases Fitch will rate all or a number of issues
issued by a particular issuer or insured or guaranteed by a particular insurer or guarantor for a single
annual fee Such fees are expected to vary from US$10000 to US$1500000 (or the applicable
currency equivalent) The assignment publication or dissemination of a rating by Fitch shall not
constitute a consent by Fitch to use its name as an expert in connection with any registration
statement filed under the United States securities laws the Financial Services and Markets Act of
2000 of the United Kingdom or the securities laws of any particular jurisdiction Due to the relative
efficiency of electronic publishing and distribution Fitch research may be available to electronic
subscribers up to three days earlier than to print subscribers
For Australia New Zealand Taiwan and South Korea only Fitch Australia Pty Ltd holds an Australian
financial services license (AFS license no 337123) which authorizes it to provide credit ratings to
wholesale clients only Credit ratings information published by Fitch is not intended to be used by
persons who are retail clients within the meaning of the Corporations Act 2001
fitchratings
fitchratingscom
New York London33 Whitehall Street
New York NY 10004
30 North Colonnade
Canary Wharf
London E14 5GN
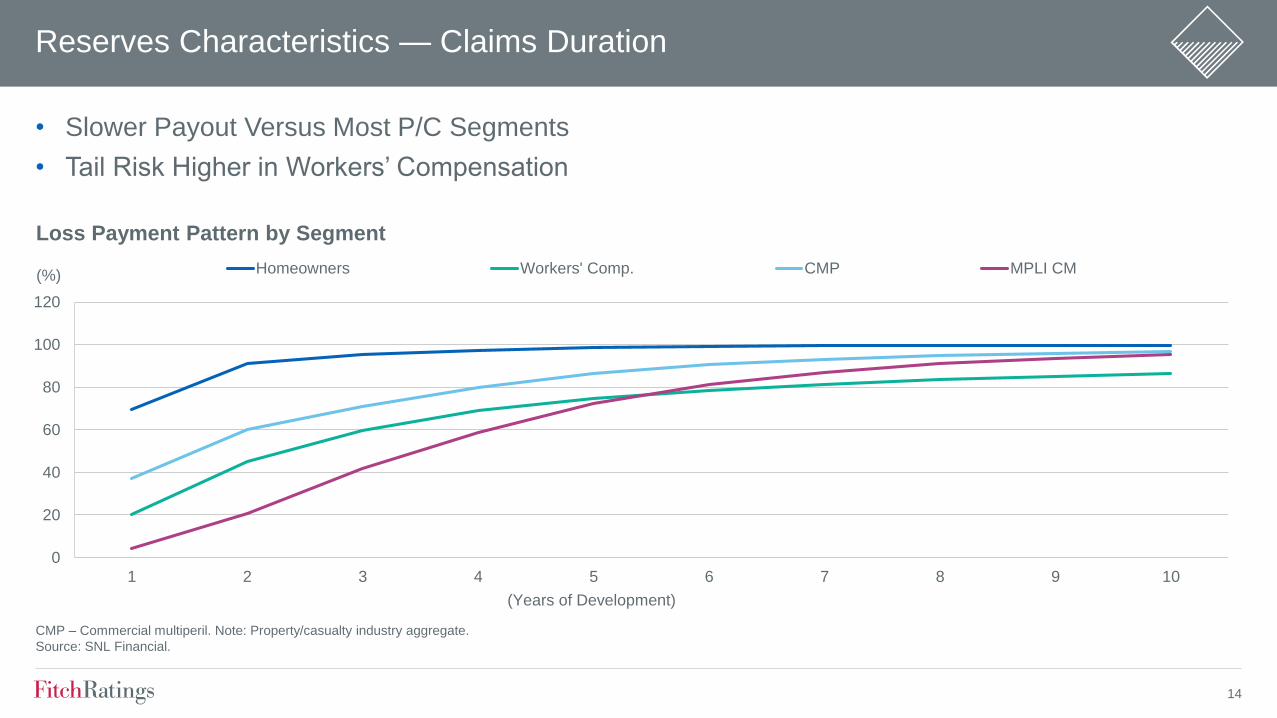
14
bull Slower Payout Versus Most PC Segments
bull Tail Risk Higher in Workersrsquo Compensation
Reserves Characteristics mdash Claims Duration
0
20
40
60
80
100
120
1 2 3 4 5 6 7 8 9 10
()
Loss Payment Pattern by Segment
Homeowners Workers Comp CMP MPLI CM
CMP ndash Commercial multiperil Note Propertycasualty industry aggregate
Source SNL Financial
(Years of Development)
15
bull Approximately 73 of Industry MPLI Reserves Are in Latest Four Accident Years 2013ndash2016
MPLI Reserve Composition
201624
201521
201416
201312
20128
20116
20104
20092
20082
20071 2006 and Prior
4
Source SNL Financial
Industry MPLI Reserves by Accident Year(73 of Reserves Relate to Accident-Years 2013ndash2016)
16
Large Litigation Component of MPLI Claims mdash Higher of Losses in Defense
and Cost Containment Costs
Reserve Characteristics mdash Defense Costs
0
5
10
15
20
25
30
35
MPLI CM MPLI OCC Other LiabilityCM
Other LiabilityOCC
CMP Workers Comp CommercialAuto
All Lines Personal Auto Homeowners
()
Defense and Cost Containment Costs of Total Net Incurred(Average Accident Years 2006ndash2015)
CM ndash Claims made OCC ndash Occurrence CMP ndash Commercial multiperil Note Propertycasualty industry aggregate data
Source SNL Financial
17
MPLI Reserve Analysis
bull Reserve Profile
bull Reserve Growth
bull Reserve Experience
bull Reserve Adequacy
18
Reserve Profile
Reserve Composition and Inherent Risk
bull Reserve Segment Mix and Diversification
bull Reserve Leverage
bull Reserve Risk Relative to Underwriting Risk
Implied Weighting of Reserves in Rating
Loss Reserves
Incurred Losses
Reserve Leverage
lt10 10ndash15 gt15
gt20 Medium High High
10ndash20 Medium Medium High
lt10 Low Medium Medium
19
MPLI Specialists Reserve Leverage Declining over Time with Surplus Growth
ReservesIncurred Ratio Very High mdash Implies Greater Capital Sensitivity to Reserve Changes than
Current Underwriting Period
MPLI Reserve Profile
00
05
10
15
20
25
0
3
6
9
12
15
18
2007 2008 2009 2010 2011 2012 2013 2014 2015 2016
($ Bil)
MPLI Specialists Reserve Leverage
PHS Reserves Reserve Leverage
PHS ndash Policyholders surplus Note Aggregate for a group of 35 MPLI specialists
Source SNL Financial
(x)
00
10
20
30
40
50
60
70
2007 2008 2009 2010 2011 2012 2013 2014 2015 2016
(x)ReservesCY Incurred Reserve Leverage
CY ndash Calendar year Note Aggregate for a group of 35 MPLI specialists
Source SNL Financial
MPLI Specialists Reserve Leverage Versus Reserves
CY Incurred
20
Over Long Term an Insurerrsquos Reserves Should Grow Commensurate with Exposures
Key Ratios
bull Calendar-Year PaidCalendar-Year Incurred Losses
bull ReservesEarned Premiums (Changes over Time)
MPLI Reserve Growth
00
02
04
06
08
10
12
14
2007 2008 2009 2010 2011 2012 2013 2014 2015 2016
(x)
Note Aggregate for a group of 35 MPLI specialists Calendar-year paid and incurred losses
Source SNL Financial
Paid gt Incurred Loss Indicative of
Reserve Weakness but Incurred
Influence by Reserve Takedowns
MPLI Specialists Reserve Growth Indications(PaidIncurred Losses)
30
31
32
33
34
2007 2008 2009 2010 2011 2012 2013 2014 2015 2016
(x)
Note Aggregate for a group of 35 MPLI specialists
Source SNL Financial
Stable Ratio = Reserve
Changes Keeping Pace
with Premium Changes
MPLI Specialists Reserve Growth Indications(ReservesEarned Premium)
21
Key Ratios
bull Calendar Year
‒ One Year Development Prior-Year Reserves
‒ One Year Development Prior-Year Surplus
‒ One Year Development Earned Premiums
bull Accident Year
‒ Current Loss Ratio Estimate Versus Original Estimate
‒ Accident-Year Development History and Trends
MPLI Reserve Experience
22
Reserve Experience mdash Favorable MPLI Development
bull Reserve Development Still Highly Favorable but Slowing Considerably
196
237228
266
221206
245
198
166
116
0
5
10
15
20
25
30
2007 2008 2009 2010 2011 2012 2013 2014 2015 2016
( of Earned Premiums)
MPLI Calendar-Year Reserve Development
Note Excludes MCIC Vermont Propertycasualty industry aggregate
Source SNL Financial
Favorable
Development
23
Reserve Experience mdash Calendar-Year Development
bull MPLI Development Greatly Exceeds Other Commercial Lines Segments over Last Decade
bull Magnitude of Favorable Development in MPLI Declining
(30)
(25)
(20)
(15)
(10)
(5)
0
5
10
15
Commercial Auto Other Liability mdash Claims Made Other Liability mdash Occurrence MPLI mdash Claims Made Workers Compensation
() 2012 2013 2014 2015 2016
Source SNL Financial
Segment Calendar-Year Development as a of Earned Premium mdash (Favorable)Unfavorable
24
Favorable Reserve Development Slowing
(5)
0
5
10
15
20
2015 2014 2013 2012 2011 2010 2009 2008 2007 2006 2005 2004 2003
12ndash24 Months 24ndash36 Months 36ndash48 Months
Note Propertycasualty industry aggregate MPLI claims made
Source SNL Financial
( Favorable[Unfavorable])
Favorable MPLI Accident-Year Development Slowing mdash Change in Loss Ratio
25
Favorable Reserve Development Slowing
0
10
20
30
40
50
60
70
80
90
2015 2014 2013 2012 2011 2010 2009 2008 2007
()
Accident-Year Loss Ratio Changes by Time of Development
12 Months 24 Months 36 Months 48 Months 60 Months 72 Months 84 Months 96 Months 108 Months 120 Months
Note Industry aggregate MPLI claims made
Source SNL Financial
26
Accident-Year Loss Ratio
bull Claims Made Accident-Year Loss Ratio Rising
bull Will Recent Accident-Years Develop Downward Like 2003ndash2010
510 574
619 672
736 788
829 859 886 867
0
10
20
30
40
50
60
70
80
90
100
2007 2008 2009 2010 2011 2012 2013 2014 2015 2016
()
Accident-Year Loss and LAE Ratio(Current Loss Ratio Estimate)
Note Propertycasualty industry aggregate MPLI claims made
Source SNL Financial Fitch
27
Accident-Year Loss Ratio Development
bull Recent Accident-Years Favorable Development Pattern Lagging Past Highly Redundant AYs
(27) (21)(19) (16) (9)
(5) 00 1
0
10
20
30
40
50
60
70
80
90
100
2007 2008 2009 2010 2011 2012 2013 2014 2015
()
Accident-Year Loss and LAE Ratio Development
Current LR Est Original LR Est
LR ndash Loss ratio Note Propertycasualty industry aggregate MPLI claims made
Source SNL Financial Fitch
Change Current
LR Versus Original
28
MPLI Reserve Adequacy
Key Considerations
bull Likelihood of Balance Sheet Reported Reserves to Develop HigherLower over Time
bull Stress Test Capital Impact of Potential Deficiencies
Analytical Tools
bull Project Reserve Adequacy Using Loss Development Methods (PaidCase Incurred)
bull Accident-Year Ratio Analysis
29
Reserve Adequacy mdash MPLI
bull Initial Analysis of Industry 2016 Reserves
bull MPLI Claims Made and Occurrence Reserves Still 5ndash7 Redundant ($14 Billionndash$20 Billion)
(09)
(09)(20)
(20) (34) (37) (20)
0
10
20
30
40
50
60
70
80
90
2007 2008 2009 2010 2011 2012 2013 2014 2015 2016
()
Estimated Reserve Adequacy mdash Paid Development Method
Reported Loss Ratio Projected Loss Ratio
Note Propertycasualty industry aggregate MPLI claims made
Source SNL Financial
Accident-Year Loss
Ratio Redundant
30
MPLI Reserve Ratio Analysis mdash Accident-Year PaidIncurred
bull At Same Period of Development Paid to Incurred Losses Should Be Similar Across Accident Years
bull HigherLower Paid to Incurred for One Accident Year Versus Others Indicative of Reserve
WeaknessStrength
PropertyCasualty Industry mdash Medical Malpractice Claims Made( PaidIncurred)
Months of Development
Accident Year 12 24 36 48 60 72 84 96 108 120
2007 33 182 378 540 692 788 865 902 932 962
2008 37 189 391 568 712 817 862 899 945 mdash
2009 38 203 405 580 719 806 857 928 mdash mdash
2010 41 206 408 576 713 816 871 mdash mdash mdash
2011 39 202 420 577 731 831 mdash mdash mdash mdash
2012 38 219 420 607 743 mdash mdash mdash mdash mdash
2013 45 218 442 615 mdash mdash mdash mdash mdash mdash
2014 44 218 430 mdash mdash mdash mdash mdash mdash mdash
2015 40 207 mdash mdash mdash mdash mdash mdash mdash mdash
2016 43 mdash mdash mdash mdash mdash mdash mdash mdash mdash
Average 40 205 412 580 718 811 864 909 939 mdash
Difference 03 02 18 34 25 19 07 18 06 mdash
Source SNL Financial
31
(50)
(40)
(30)
(20)
(10)
0
10
20
30
10 15 20 25 30 35
(PaidIncurred Losses at 24 Months )
Source SNL Financial
( Incurred Losses Deficient[Redundant])
Historical Accident-Year Reserve Development Related to Paid Levels(Accident Years 1987ndash2011)
Correlation = 92
R-Squared = 84
Reserve Ratio Analysis mdash Accident-Year PaidIncurred
Analysis of Industry MPLI Claims Made for Accident Years 1987ndash2011
bull LowerHigher Cumulative Paid Loss Levels Relative to Incurred Losses at Early Periods of
Development Related to Ultimate Loss Experience
Deficient
Redundant
32
MPLI Reserve Ratio Analysis mdash Accident-Year IBNRIncurred
bull At Same Period of Development Incurred but Not Reported (IBNR) to Incurred Should Be Similar
Across Accident Years
bull LowerHigher IBNR Levels for One AY Versus Others Indicative of Reserve WeaknessStrength
PropertyCasualty Industry mdash Medical Malpractice Claims Made( IBNRIncurred)
Months of Development
Accident Year 12 24 36 48 60 72 84 96 108 120
2007 616 382 264 177 110 69 35 21 16 11
2008 599 335 203 141 87 46 33 27 14 mdash
2009 599 330 207 142 93 54 39 20 mdash mdash
2010 588 321 181 121 79 47 33 mdash mdash mdash
2011 600 300 169 114 72 36 mdash mdash mdash mdash
2012 611 299 162 104 63 mdash mdash mdash mdash mdash
2013 605 296 168 106 mdash mdash mdash mdash mdash mdash
2014 615 334 194 mdash mdash mdash mdash mdash mdash mdash
2015 635 329 mdash mdash mdash mdash mdash mdash mdash mdash
2016 617 mdash mdash mdash mdash mdash mdash mdash mdash mdash
Average 608 325 194 129 84 50 35 22 15 mdash
Difference 08 04 01 (24) (21) (14) (03) (03) (01) mdash
Source SNL Financial
33
Reserve Adequacy mdash Ratio Analysis
(40)
(30)
(20)
(10)
0
10
20
30
0 5 10 15 20 25 30 35 40 45
(IBNRIncurred Losses at 24 Months )IBNR ndash Incurred but not reported
Source SNL Financial
( Incurred Losses Deficient[Redundant])
Historical Accident-Year Reserve Development Related to IBNR Levels(Accident Years 1987ndash2011)
Correlation = (78)
R-Squared = 74
Deficient
Redundant
Analysis of Industry MPLI Claims Made for Accident Years 1987ndash2011
bull HigherLower IBNR Levels Relative to Incurred Losses at Early Periods of Development Related
to Ultimate Loss Experience
34
ALL FITCH CREDIT RATINGS ARE SUBJECT TO CERTAIN LIMITATIONS AND DISCLAIMERS
PLEASE READ THESE LIMITATIONS AND DISCLAIMERS BY FOLLOWING THIS LINK
HTTPSFITCHRATINGSCOMUNDERSTANDINGCREDITRATINGS IN ADDITION RATING
DEFINITIONS AND THE TERMS OF USE OF SUCH RATINGS ARE AVAILABLE ON THE
AGENCYS PUBLIC WEB SITE
AT WWWFITCHRATINGSCOM PUBLISHED RATINGS CRITERIA AND METHODOLOGIES ARE
AVAILABLE FROM THIS SITE AT ALL TIMES FITCHS CODE OF CONDUCT CONFIDENTIALITY
CONFLICTS OF INTEREST AFFILIATE FIREWALL COMPLIANCE AND OTHER RELEVANT
POLICIES AND PROCEDURES ARE ALSO AVAILABLE FROM THE CODE OF CONDUCT
SECTION OF THIS SITE FITCH MAY HAVE PROVIDED ANOTHER PERMISSIBLE SERVICE TO
THE RATED ENTITY OR ITS RELATED THIRD PARTIES DETAILS OF THIS SERVICE FOR
RATINGS FOR WHICH THE LEAD ANALYST IS BASED IN AN EU-REGISTERED ENTITY CAN BE
FOUND ON THE ENTITY SUMMARY PAGE FOR THIS ISSUER ON THE FITCH WEBSITE
Copyright copy 2017 by Fitch Ratings Inc Fitch Ratings Ltd and its subsidiaries 33 Whitehall Street
NY NY 10004 Telephone 1-800-753-4824 (212) 908-0500 Fax (212) 480-4435 Reproduction or
retransmission in whole or in part is prohibited except by permission All rights reserved In issuing
and maintaining its ratings and in making other reports (including forecast information) Fitch relies on
factual information it receives from issuers and underwriters and from other sources Fitch believes to
be credible Fitch conducts a reasonable investigation of the factual information relied upon by it in
accordance with its ratings methodology and obtains reasonable verification of that information from
independent sources to the extent such sources are available for a given security or in a given
jurisdiction The manner of Fitchrsquos factual investigation and the scope of the third-party verification it
obtains will vary depending on the nature of the rated security and its issuer the requirements and
practices in the jurisdiction in which the rated security is offered and sold andor the issuer is located
the availability and nature of relevant public information access to the management of the issuer and
its advisers the availability of pre-existing third-party verifications such as audit reports agreed-upon
procedures letters appraisals actuarial reports engineering reports legal opinions and other reports
provided by third parties the availability of independent and competent third-party verification sources
with respect to the particular security or in the particular jurisdiction of the issuer and a variety of
other factors Users of Fitchrsquos ratings and reports should understand that neither an enhanced factual
investigation nor any third-party verification can ensure that all of the information Fitch relies on in
connection with a rating or a report will be accurate and complete Ultimately the issuer and its
advisers are responsible for the accuracy of the information they provide to Fitch and to the market in
offering documents and other reports In issuing its ratings and its reports Fitch must rely on the work
of experts including independent auditors with respect to financial statements and attorneys with
respect to legal and tax matters Further ratings and forecasts of financial and other information are
inherently forward-looking and embody assumptions and predictions about future events that by their
nature cannot be verified as facts As a result despite any verification of current facts ratings and
forecasts can be affected by future events or conditions that were not anticipated at the time a rating
or forecast was issued or affirmed
The information in this report is provided ldquoas isrdquo without any representation or warranty of any kind
and Fitch does not represent or warrant that the report or any of its contents will meet any of the
requirements of a recipient of the report A Fitch rating is an opinion as to the creditworthiness of a
security This opinion and reports made by Fitch are based on established criteria and methodologies
that Fitch is continuously evaluating and updating Therefore ratings and reports are the collective
work product of Fitch and no individual or group of individuals is solely responsible for a rating or a
report The rating does not address the risk of loss due to risks other than credit risk unless such risk
is specifically mentioned Fitch is not engaged in the offer or sale of any security All Fitch reports
have shared authorship Individuals identified in a Fitch report were involved in but are not solely
responsible for the opinions stated therein The individuals are named for contact purposes only A
report providing a Fitch rating is neither a prospectus nor a substitute for the information assembled
verified and presented to investors by the issuer and its agents in connection with the sale of the
securities Ratings may be changed or withdrawn at any time for any reason in the sole discretion of
Fitch Fitch does not provide investment advice of any sort Ratings are not a recommendation to buy
sell or hold any security Ratings do not comment on the adequacy of market price the suitability of
any security for a particular investor or the tax-exempt nature or taxability of payments made in
respect to any security Fitch receives fees from issuers insurers guarantors other obligors and
underwriters for rating securities Such fees generally vary from US$1000 to US$750000 (or the
applicable currency equivalent) per issue In certain cases Fitch will rate all or a number of issues
issued by a particular issuer or insured or guaranteed by a particular insurer or guarantor for a single
annual fee Such fees are expected to vary from US$10000 to US$1500000 (or the applicable
currency equivalent) The assignment publication or dissemination of a rating by Fitch shall not
constitute a consent by Fitch to use its name as an expert in connection with any registration
statement filed under the United States securities laws the Financial Services and Markets Act of
2000 of the United Kingdom or the securities laws of any particular jurisdiction Due to the relative
efficiency of electronic publishing and distribution Fitch research may be available to electronic
subscribers up to three days earlier than to print subscribers
For Australia New Zealand Taiwan and South Korea only Fitch Australia Pty Ltd holds an Australian
financial services license (AFS license no 337123) which authorizes it to provide credit ratings to
wholesale clients only Credit ratings information published by Fitch is not intended to be used by
persons who are retail clients within the meaning of the Corporations Act 2001
fitchratings
fitchratingscom
New York London33 Whitehall Street
New York NY 10004
30 North Colonnade
Canary Wharf
London E14 5GN

15
bull Approximately 73 of Industry MPLI Reserves Are in Latest Four Accident Years 2013ndash2016
MPLI Reserve Composition
201624
201521
201416
201312
20128
20116
20104
20092
20082
20071 2006 and Prior
4
Source SNL Financial
Industry MPLI Reserves by Accident Year(73 of Reserves Relate to Accident-Years 2013ndash2016)
16
Large Litigation Component of MPLI Claims mdash Higher of Losses in Defense
and Cost Containment Costs
Reserve Characteristics mdash Defense Costs
0
5
10
15
20
25
30
35
MPLI CM MPLI OCC Other LiabilityCM
Other LiabilityOCC
CMP Workers Comp CommercialAuto
All Lines Personal Auto Homeowners
()
Defense and Cost Containment Costs of Total Net Incurred(Average Accident Years 2006ndash2015)
CM ndash Claims made OCC ndash Occurrence CMP ndash Commercial multiperil Note Propertycasualty industry aggregate data
Source SNL Financial
17
MPLI Reserve Analysis
bull Reserve Profile
bull Reserve Growth
bull Reserve Experience
bull Reserve Adequacy
18
Reserve Profile
Reserve Composition and Inherent Risk
bull Reserve Segment Mix and Diversification
bull Reserve Leverage
bull Reserve Risk Relative to Underwriting Risk
Implied Weighting of Reserves in Rating
Loss Reserves
Incurred Losses
Reserve Leverage
lt10 10ndash15 gt15
gt20 Medium High High
10ndash20 Medium Medium High
lt10 Low Medium Medium
19
MPLI Specialists Reserve Leverage Declining over Time with Surplus Growth
ReservesIncurred Ratio Very High mdash Implies Greater Capital Sensitivity to Reserve Changes than
Current Underwriting Period
MPLI Reserve Profile
00
05
10
15
20
25
0
3
6
9
12
15
18
2007 2008 2009 2010 2011 2012 2013 2014 2015 2016
($ Bil)
MPLI Specialists Reserve Leverage
PHS Reserves Reserve Leverage
PHS ndash Policyholders surplus Note Aggregate for a group of 35 MPLI specialists
Source SNL Financial
(x)
00
10
20
30
40
50
60
70
2007 2008 2009 2010 2011 2012 2013 2014 2015 2016
(x)ReservesCY Incurred Reserve Leverage
CY ndash Calendar year Note Aggregate for a group of 35 MPLI specialists
Source SNL Financial
MPLI Specialists Reserve Leverage Versus Reserves
CY Incurred
20
Over Long Term an Insurerrsquos Reserves Should Grow Commensurate with Exposures
Key Ratios
bull Calendar-Year PaidCalendar-Year Incurred Losses
bull ReservesEarned Premiums (Changes over Time)
MPLI Reserve Growth
00
02
04
06
08
10
12
14
2007 2008 2009 2010 2011 2012 2013 2014 2015 2016
(x)
Note Aggregate for a group of 35 MPLI specialists Calendar-year paid and incurred losses
Source SNL Financial
Paid gt Incurred Loss Indicative of
Reserve Weakness but Incurred
Influence by Reserve Takedowns
MPLI Specialists Reserve Growth Indications(PaidIncurred Losses)
30
31
32
33
34
2007 2008 2009 2010 2011 2012 2013 2014 2015 2016
(x)
Note Aggregate for a group of 35 MPLI specialists
Source SNL Financial
Stable Ratio = Reserve
Changes Keeping Pace
with Premium Changes
MPLI Specialists Reserve Growth Indications(ReservesEarned Premium)
21
Key Ratios
bull Calendar Year
‒ One Year Development Prior-Year Reserves
‒ One Year Development Prior-Year Surplus
‒ One Year Development Earned Premiums
bull Accident Year
‒ Current Loss Ratio Estimate Versus Original Estimate
‒ Accident-Year Development History and Trends
MPLI Reserve Experience
22
Reserve Experience mdash Favorable MPLI Development
bull Reserve Development Still Highly Favorable but Slowing Considerably
196
237228
266
221206
245
198
166
116
0
5
10
15
20
25
30
2007 2008 2009 2010 2011 2012 2013 2014 2015 2016
( of Earned Premiums)
MPLI Calendar-Year Reserve Development
Note Excludes MCIC Vermont Propertycasualty industry aggregate
Source SNL Financial
Favorable
Development
23
Reserve Experience mdash Calendar-Year Development
bull MPLI Development Greatly Exceeds Other Commercial Lines Segments over Last Decade
bull Magnitude of Favorable Development in MPLI Declining
(30)
(25)
(20)
(15)
(10)
(5)
0
5
10
15
Commercial Auto Other Liability mdash Claims Made Other Liability mdash Occurrence MPLI mdash Claims Made Workers Compensation
() 2012 2013 2014 2015 2016
Source SNL Financial
Segment Calendar-Year Development as a of Earned Premium mdash (Favorable)Unfavorable
24
Favorable Reserve Development Slowing
(5)
0
5
10
15
20
2015 2014 2013 2012 2011 2010 2009 2008 2007 2006 2005 2004 2003
12ndash24 Months 24ndash36 Months 36ndash48 Months
Note Propertycasualty industry aggregate MPLI claims made
Source SNL Financial
( Favorable[Unfavorable])
Favorable MPLI Accident-Year Development Slowing mdash Change in Loss Ratio
25
Favorable Reserve Development Slowing
0
10
20
30
40
50
60
70
80
90
2015 2014 2013 2012 2011 2010 2009 2008 2007
()
Accident-Year Loss Ratio Changes by Time of Development
12 Months 24 Months 36 Months 48 Months 60 Months 72 Months 84 Months 96 Months 108 Months 120 Months
Note Industry aggregate MPLI claims made
Source SNL Financial
26
Accident-Year Loss Ratio
bull Claims Made Accident-Year Loss Ratio Rising
bull Will Recent Accident-Years Develop Downward Like 2003ndash2010
510 574
619 672
736 788
829 859 886 867
0
10
20
30
40
50
60
70
80
90
100
2007 2008 2009 2010 2011 2012 2013 2014 2015 2016
()
Accident-Year Loss and LAE Ratio(Current Loss Ratio Estimate)
Note Propertycasualty industry aggregate MPLI claims made
Source SNL Financial Fitch
27
Accident-Year Loss Ratio Development
bull Recent Accident-Years Favorable Development Pattern Lagging Past Highly Redundant AYs
(27) (21)(19) (16) (9)
(5) 00 1
0
10
20
30
40
50
60
70
80
90
100
2007 2008 2009 2010 2011 2012 2013 2014 2015
()
Accident-Year Loss and LAE Ratio Development
Current LR Est Original LR Est
LR ndash Loss ratio Note Propertycasualty industry aggregate MPLI claims made
Source SNL Financial Fitch
Change Current
LR Versus Original
28
MPLI Reserve Adequacy
Key Considerations
bull Likelihood of Balance Sheet Reported Reserves to Develop HigherLower over Time
bull Stress Test Capital Impact of Potential Deficiencies
Analytical Tools
bull Project Reserve Adequacy Using Loss Development Methods (PaidCase Incurred)
bull Accident-Year Ratio Analysis
29
Reserve Adequacy mdash MPLI
bull Initial Analysis of Industry 2016 Reserves
bull MPLI Claims Made and Occurrence Reserves Still 5ndash7 Redundant ($14 Billionndash$20 Billion)
(09)
(09)(20)
(20) (34) (37) (20)
0
10
20
30
40
50
60
70
80
90
2007 2008 2009 2010 2011 2012 2013 2014 2015 2016
()
Estimated Reserve Adequacy mdash Paid Development Method
Reported Loss Ratio Projected Loss Ratio
Note Propertycasualty industry aggregate MPLI claims made
Source SNL Financial
Accident-Year Loss
Ratio Redundant
30
MPLI Reserve Ratio Analysis mdash Accident-Year PaidIncurred
bull At Same Period of Development Paid to Incurred Losses Should Be Similar Across Accident Years
bull HigherLower Paid to Incurred for One Accident Year Versus Others Indicative of Reserve
WeaknessStrength
PropertyCasualty Industry mdash Medical Malpractice Claims Made( PaidIncurred)
Months of Development
Accident Year 12 24 36 48 60 72 84 96 108 120
2007 33 182 378 540 692 788 865 902 932 962
2008 37 189 391 568 712 817 862 899 945 mdash
2009 38 203 405 580 719 806 857 928 mdash mdash
2010 41 206 408 576 713 816 871 mdash mdash mdash
2011 39 202 420 577 731 831 mdash mdash mdash mdash
2012 38 219 420 607 743 mdash mdash mdash mdash mdash
2013 45 218 442 615 mdash mdash mdash mdash mdash mdash
2014 44 218 430 mdash mdash mdash mdash mdash mdash mdash
2015 40 207 mdash mdash mdash mdash mdash mdash mdash mdash
2016 43 mdash mdash mdash mdash mdash mdash mdash mdash mdash
Average 40 205 412 580 718 811 864 909 939 mdash
Difference 03 02 18 34 25 19 07 18 06 mdash
Source SNL Financial
31
(50)
(40)
(30)
(20)
(10)
0
10
20
30
10 15 20 25 30 35
(PaidIncurred Losses at 24 Months )
Source SNL Financial
( Incurred Losses Deficient[Redundant])
Historical Accident-Year Reserve Development Related to Paid Levels(Accident Years 1987ndash2011)
Correlation = 92
R-Squared = 84
Reserve Ratio Analysis mdash Accident-Year PaidIncurred
Analysis of Industry MPLI Claims Made for Accident Years 1987ndash2011
bull LowerHigher Cumulative Paid Loss Levels Relative to Incurred Losses at Early Periods of
Development Related to Ultimate Loss Experience
Deficient
Redundant
32
MPLI Reserve Ratio Analysis mdash Accident-Year IBNRIncurred
bull At Same Period of Development Incurred but Not Reported (IBNR) to Incurred Should Be Similar
Across Accident Years
bull LowerHigher IBNR Levels for One AY Versus Others Indicative of Reserve WeaknessStrength
PropertyCasualty Industry mdash Medical Malpractice Claims Made( IBNRIncurred)
Months of Development
Accident Year 12 24 36 48 60 72 84 96 108 120
2007 616 382 264 177 110 69 35 21 16 11
2008 599 335 203 141 87 46 33 27 14 mdash
2009 599 330 207 142 93 54 39 20 mdash mdash
2010 588 321 181 121 79 47 33 mdash mdash mdash
2011 600 300 169 114 72 36 mdash mdash mdash mdash
2012 611 299 162 104 63 mdash mdash mdash mdash mdash
2013 605 296 168 106 mdash mdash mdash mdash mdash mdash
2014 615 334 194 mdash mdash mdash mdash mdash mdash mdash
2015 635 329 mdash mdash mdash mdash mdash mdash mdash mdash
2016 617 mdash mdash mdash mdash mdash mdash mdash mdash mdash
Average 608 325 194 129 84 50 35 22 15 mdash
Difference 08 04 01 (24) (21) (14) (03) (03) (01) mdash
Source SNL Financial
33
Reserve Adequacy mdash Ratio Analysis
(40)
(30)
(20)
(10)
0
10
20
30
0 5 10 15 20 25 30 35 40 45
(IBNRIncurred Losses at 24 Months )IBNR ndash Incurred but not reported
Source SNL Financial
( Incurred Losses Deficient[Redundant])
Historical Accident-Year Reserve Development Related to IBNR Levels(Accident Years 1987ndash2011)
Correlation = (78)
R-Squared = 74
Deficient
Redundant
Analysis of Industry MPLI Claims Made for Accident Years 1987ndash2011
bull HigherLower IBNR Levels Relative to Incurred Losses at Early Periods of Development Related
to Ultimate Loss Experience
34
ALL FITCH CREDIT RATINGS ARE SUBJECT TO CERTAIN LIMITATIONS AND DISCLAIMERS
PLEASE READ THESE LIMITATIONS AND DISCLAIMERS BY FOLLOWING THIS LINK
HTTPSFITCHRATINGSCOMUNDERSTANDINGCREDITRATINGS IN ADDITION RATING
DEFINITIONS AND THE TERMS OF USE OF SUCH RATINGS ARE AVAILABLE ON THE
AGENCYS PUBLIC WEB SITE
AT WWWFITCHRATINGSCOM PUBLISHED RATINGS CRITERIA AND METHODOLOGIES ARE
AVAILABLE FROM THIS SITE AT ALL TIMES FITCHS CODE OF CONDUCT CONFIDENTIALITY
CONFLICTS OF INTEREST AFFILIATE FIREWALL COMPLIANCE AND OTHER RELEVANT
POLICIES AND PROCEDURES ARE ALSO AVAILABLE FROM THE CODE OF CONDUCT
SECTION OF THIS SITE FITCH MAY HAVE PROVIDED ANOTHER PERMISSIBLE SERVICE TO
THE RATED ENTITY OR ITS RELATED THIRD PARTIES DETAILS OF THIS SERVICE FOR
RATINGS FOR WHICH THE LEAD ANALYST IS BASED IN AN EU-REGISTERED ENTITY CAN BE
FOUND ON THE ENTITY SUMMARY PAGE FOR THIS ISSUER ON THE FITCH WEBSITE
Copyright copy 2017 by Fitch Ratings Inc Fitch Ratings Ltd and its subsidiaries 33 Whitehall Street
NY NY 10004 Telephone 1-800-753-4824 (212) 908-0500 Fax (212) 480-4435 Reproduction or
retransmission in whole or in part is prohibited except by permission All rights reserved In issuing
and maintaining its ratings and in making other reports (including forecast information) Fitch relies on
factual information it receives from issuers and underwriters and from other sources Fitch believes to
be credible Fitch conducts a reasonable investigation of the factual information relied upon by it in
accordance with its ratings methodology and obtains reasonable verification of that information from
independent sources to the extent such sources are available for a given security or in a given
jurisdiction The manner of Fitchrsquos factual investigation and the scope of the third-party verification it
obtains will vary depending on the nature of the rated security and its issuer the requirements and
practices in the jurisdiction in which the rated security is offered and sold andor the issuer is located
the availability and nature of relevant public information access to the management of the issuer and
its advisers the availability of pre-existing third-party verifications such as audit reports agreed-upon
procedures letters appraisals actuarial reports engineering reports legal opinions and other reports
provided by third parties the availability of independent and competent third-party verification sources
with respect to the particular security or in the particular jurisdiction of the issuer and a variety of
other factors Users of Fitchrsquos ratings and reports should understand that neither an enhanced factual
investigation nor any third-party verification can ensure that all of the information Fitch relies on in
connection with a rating or a report will be accurate and complete Ultimately the issuer and its
advisers are responsible for the accuracy of the information they provide to Fitch and to the market in
offering documents and other reports In issuing its ratings and its reports Fitch must rely on the work
of experts including independent auditors with respect to financial statements and attorneys with
respect to legal and tax matters Further ratings and forecasts of financial and other information are
inherently forward-looking and embody assumptions and predictions about future events that by their
nature cannot be verified as facts As a result despite any verification of current facts ratings and
forecasts can be affected by future events or conditions that were not anticipated at the time a rating
or forecast was issued or affirmed
The information in this report is provided ldquoas isrdquo without any representation or warranty of any kind
and Fitch does not represent or warrant that the report or any of its contents will meet any of the
requirements of a recipient of the report A Fitch rating is an opinion as to the creditworthiness of a
security This opinion and reports made by Fitch are based on established criteria and methodologies
that Fitch is continuously evaluating and updating Therefore ratings and reports are the collective
work product of Fitch and no individual or group of individuals is solely responsible for a rating or a
report The rating does not address the risk of loss due to risks other than credit risk unless such risk
is specifically mentioned Fitch is not engaged in the offer or sale of any security All Fitch reports
have shared authorship Individuals identified in a Fitch report were involved in but are not solely
responsible for the opinions stated therein The individuals are named for contact purposes only A
report providing a Fitch rating is neither a prospectus nor a substitute for the information assembled
verified and presented to investors by the issuer and its agents in connection with the sale of the
securities Ratings may be changed or withdrawn at any time for any reason in the sole discretion of
Fitch Fitch does not provide investment advice of any sort Ratings are not a recommendation to buy
sell or hold any security Ratings do not comment on the adequacy of market price the suitability of
any security for a particular investor or the tax-exempt nature or taxability of payments made in
respect to any security Fitch receives fees from issuers insurers guarantors other obligors and
underwriters for rating securities Such fees generally vary from US$1000 to US$750000 (or the
applicable currency equivalent) per issue In certain cases Fitch will rate all or a number of issues
issued by a particular issuer or insured or guaranteed by a particular insurer or guarantor for a single
annual fee Such fees are expected to vary from US$10000 to US$1500000 (or the applicable
currency equivalent) The assignment publication or dissemination of a rating by Fitch shall not
constitute a consent by Fitch to use its name as an expert in connection with any registration
statement filed under the United States securities laws the Financial Services and Markets Act of
2000 of the United Kingdom or the securities laws of any particular jurisdiction Due to the relative
efficiency of electronic publishing and distribution Fitch research may be available to electronic
subscribers up to three days earlier than to print subscribers
For Australia New Zealand Taiwan and South Korea only Fitch Australia Pty Ltd holds an Australian
financial services license (AFS license no 337123) which authorizes it to provide credit ratings to
wholesale clients only Credit ratings information published by Fitch is not intended to be used by
persons who are retail clients within the meaning of the Corporations Act 2001
fitchratings
fitchratingscom
New York London33 Whitehall Street
New York NY 10004
30 North Colonnade
Canary Wharf
London E14 5GN
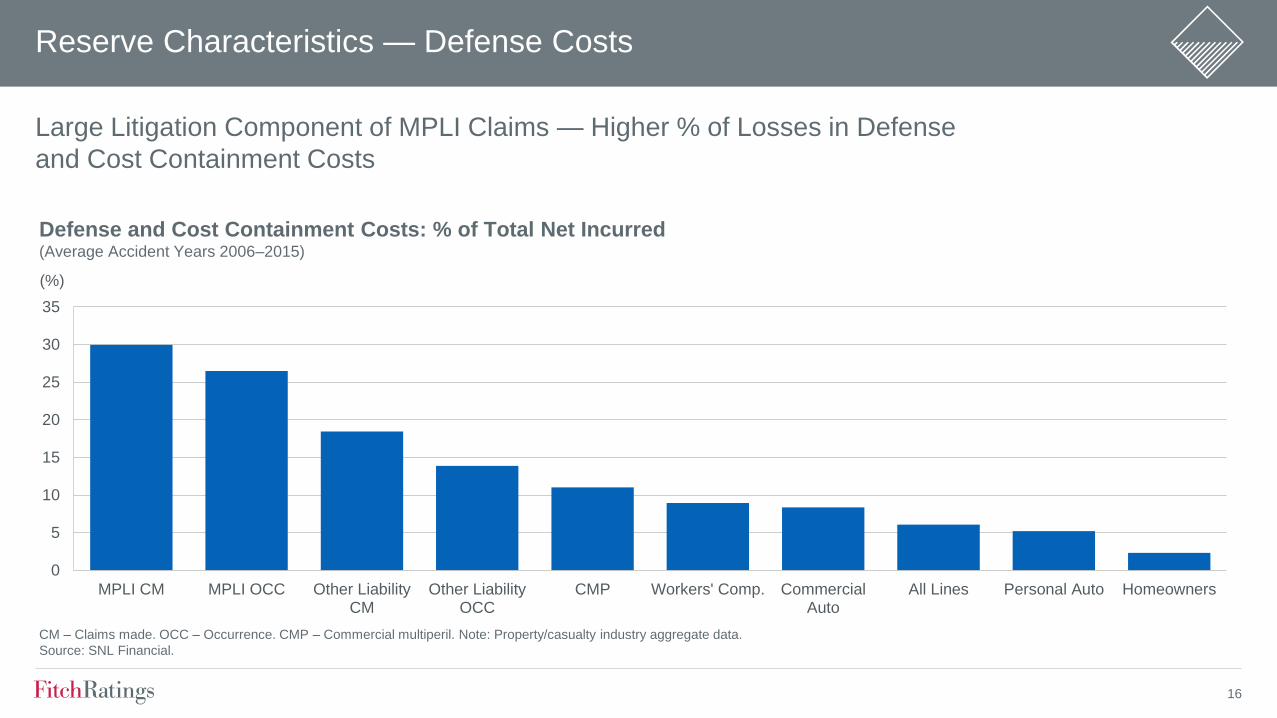
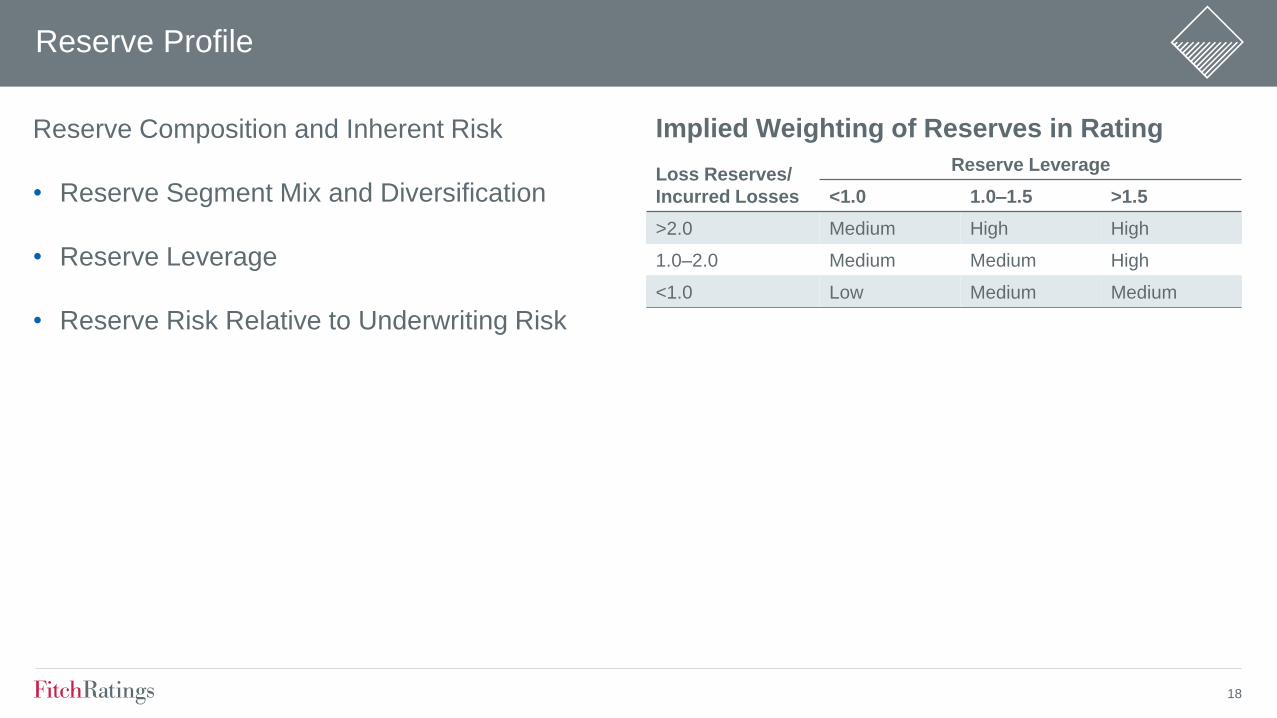
18
Reserve Profile
Reserve Composition and Inherent Risk
bull Reserve Segment Mix and Diversification
bull Reserve Leverage
bull Reserve Risk Relative to Underwriting Risk
Implied Weighting of Reserves in Rating
Loss Reserves
Incurred Losses
Reserve Leverage
lt10 10ndash15 gt15
gt20 Medium High High
10ndash20 Medium Medium High
lt10 Low Medium Medium
19
MPLI Specialists Reserve Leverage Declining over Time with Surplus Growth
ReservesIncurred Ratio Very High mdash Implies Greater Capital Sensitivity to Reserve Changes than
Current Underwriting Period
MPLI Reserve Profile
00
05
10
15
20
25
0
3
6
9
12
15
18
2007 2008 2009 2010 2011 2012 2013 2014 2015 2016
($ Bil)
MPLI Specialists Reserve Leverage
PHS Reserves Reserve Leverage
PHS ndash Policyholders surplus Note Aggregate for a group of 35 MPLI specialists
Source SNL Financial
(x)
00
10
20
30
40
50
60
70
2007 2008 2009 2010 2011 2012 2013 2014 2015 2016
(x)ReservesCY Incurred Reserve Leverage
CY ndash Calendar year Note Aggregate for a group of 35 MPLI specialists
Source SNL Financial
MPLI Specialists Reserve Leverage Versus Reserves
CY Incurred
20
Over Long Term an Insurerrsquos Reserves Should Grow Commensurate with Exposures
Key Ratios
bull Calendar-Year PaidCalendar-Year Incurred Losses
bull ReservesEarned Premiums (Changes over Time)
MPLI Reserve Growth
00
02
04
06
08
10
12
14
2007 2008 2009 2010 2011 2012 2013 2014 2015 2016
(x)
Note Aggregate for a group of 35 MPLI specialists Calendar-year paid and incurred losses
Source SNL Financial
Paid gt Incurred Loss Indicative of
Reserve Weakness but Incurred
Influence by Reserve Takedowns
MPLI Specialists Reserve Growth Indications(PaidIncurred Losses)
30
31
32
33
34
2007 2008 2009 2010 2011 2012 2013 2014 2015 2016
(x)
Note Aggregate for a group of 35 MPLI specialists
Source SNL Financial
Stable Ratio = Reserve
Changes Keeping Pace
with Premium Changes
MPLI Specialists Reserve Growth Indications(ReservesEarned Premium)
21
Key Ratios
bull Calendar Year
‒ One Year Development Prior-Year Reserves
‒ One Year Development Prior-Year Surplus
‒ One Year Development Earned Premiums
bull Accident Year
‒ Current Loss Ratio Estimate Versus Original Estimate
‒ Accident-Year Development History and Trends
MPLI Reserve Experience
22
Reserve Experience mdash Favorable MPLI Development
bull Reserve Development Still Highly Favorable but Slowing Considerably
196
237228
266
221206
245
198
166
116
0
5
10
15
20
25
30
2007 2008 2009 2010 2011 2012 2013 2014 2015 2016
( of Earned Premiums)
MPLI Calendar-Year Reserve Development
Note Excludes MCIC Vermont Propertycasualty industry aggregate
Source SNL Financial
Favorable
Development
23
Reserve Experience mdash Calendar-Year Development
bull MPLI Development Greatly Exceeds Other Commercial Lines Segments over Last Decade
bull Magnitude of Favorable Development in MPLI Declining
(30)
(25)
(20)
(15)
(10)
(5)
0
5
10
15
Commercial Auto Other Liability mdash Claims Made Other Liability mdash Occurrence MPLI mdash Claims Made Workers Compensation
() 2012 2013 2014 2015 2016
Source SNL Financial
Segment Calendar-Year Development as a of Earned Premium mdash (Favorable)Unfavorable
24
Favorable Reserve Development Slowing
(5)
0
5
10
15
20
2015 2014 2013 2012 2011 2010 2009 2008 2007 2006 2005 2004 2003
12ndash24 Months 24ndash36 Months 36ndash48 Months
Note Propertycasualty industry aggregate MPLI claims made
Source SNL Financial
( Favorable[Unfavorable])
Favorable MPLI Accident-Year Development Slowing mdash Change in Loss Ratio
25
Favorable Reserve Development Slowing
0
10
20
30
40
50
60
70
80
90
2015 2014 2013 2012 2011 2010 2009 2008 2007
()
Accident-Year Loss Ratio Changes by Time of Development
12 Months 24 Months 36 Months 48 Months 60 Months 72 Months 84 Months 96 Months 108 Months 120 Months
Note Industry aggregate MPLI claims made
Source SNL Financial
26
Accident-Year Loss Ratio
bull Claims Made Accident-Year Loss Ratio Rising
bull Will Recent Accident-Years Develop Downward Like 2003ndash2010
510 574
619 672
736 788
829 859 886 867
0
10
20
30
40
50
60
70
80
90
100
2007 2008 2009 2010 2011 2012 2013 2014 2015 2016
()
Accident-Year Loss and LAE Ratio(Current Loss Ratio Estimate)
Note Propertycasualty industry aggregate MPLI claims made
Source SNL Financial Fitch
27
Accident-Year Loss Ratio Development
bull Recent Accident-Years Favorable Development Pattern Lagging Past Highly Redundant AYs
(27) (21)(19) (16) (9)
(5) 00 1
0
10
20
30
40
50
60
70
80
90
100
2007 2008 2009 2010 2011 2012 2013 2014 2015
()
Accident-Year Loss and LAE Ratio Development
Current LR Est Original LR Est
LR ndash Loss ratio Note Propertycasualty industry aggregate MPLI claims made
Source SNL Financial Fitch
Change Current
LR Versus Original
28
MPLI Reserve Adequacy
Key Considerations
bull Likelihood of Balance Sheet Reported Reserves to Develop HigherLower over Time
bull Stress Test Capital Impact of Potential Deficiencies
Analytical Tools
bull Project Reserve Adequacy Using Loss Development Methods (PaidCase Incurred)
bull Accident-Year Ratio Analysis
29
Reserve Adequacy mdash MPLI
bull Initial Analysis of Industry 2016 Reserves
bull MPLI Claims Made and Occurrence Reserves Still 5ndash7 Redundant ($14 Billionndash$20 Billion)
(09)
(09)(20)
(20) (34) (37) (20)
0
10
20
30
40
50
60
70
80
90
2007 2008 2009 2010 2011 2012 2013 2014 2015 2016
()
Estimated Reserve Adequacy mdash Paid Development Method
Reported Loss Ratio Projected Loss Ratio
Note Propertycasualty industry aggregate MPLI claims made
Source SNL Financial
Accident-Year Loss
Ratio Redundant
30
MPLI Reserve Ratio Analysis mdash Accident-Year PaidIncurred
bull At Same Period of Development Paid to Incurred Losses Should Be Similar Across Accident Years
bull HigherLower Paid to Incurred for One Accident Year Versus Others Indicative of Reserve
WeaknessStrength
PropertyCasualty Industry mdash Medical Malpractice Claims Made( PaidIncurred)
Months of Development
Accident Year 12 24 36 48 60 72 84 96 108 120
2007 33 182 378 540 692 788 865 902 932 962
2008 37 189 391 568 712 817 862 899 945 mdash
2009 38 203 405 580 719 806 857 928 mdash mdash
2010 41 206 408 576 713 816 871 mdash mdash mdash
2011 39 202 420 577 731 831 mdash mdash mdash mdash
2012 38 219 420 607 743 mdash mdash mdash mdash mdash
2013 45 218 442 615 mdash mdash mdash mdash mdash mdash
2014 44 218 430 mdash mdash mdash mdash mdash mdash mdash
2015 40 207 mdash mdash mdash mdash mdash mdash mdash mdash
2016 43 mdash mdash mdash mdash mdash mdash mdash mdash mdash
Average 40 205 412 580 718 811 864 909 939 mdash
Difference 03 02 18 34 25 19 07 18 06 mdash
Source SNL Financial
31
(50)
(40)
(30)
(20)
(10)
0
10
20
30
10 15 20 25 30 35
(PaidIncurred Losses at 24 Months )
Source SNL Financial
( Incurred Losses Deficient[Redundant])
Historical Accident-Year Reserve Development Related to Paid Levels(Accident Years 1987ndash2011)
Correlation = 92
R-Squared = 84
Reserve Ratio Analysis mdash Accident-Year PaidIncurred
Analysis of Industry MPLI Claims Made for Accident Years 1987ndash2011
bull LowerHigher Cumulative Paid Loss Levels Relative to Incurred Losses at Early Periods of
Development Related to Ultimate Loss Experience
Deficient
Redundant
32
MPLI Reserve Ratio Analysis mdash Accident-Year IBNRIncurred
bull At Same Period of Development Incurred but Not Reported (IBNR) to Incurred Should Be Similar
Across Accident Years
bull LowerHigher IBNR Levels for One AY Versus Others Indicative of Reserve WeaknessStrength
PropertyCasualty Industry mdash Medical Malpractice Claims Made( IBNRIncurred)
Months of Development
Accident Year 12 24 36 48 60 72 84 96 108 120
2007 616 382 264 177 110 69 35 21 16 11
2008 599 335 203 141 87 46 33 27 14 mdash
2009 599 330 207 142 93 54 39 20 mdash mdash
2010 588 321 181 121 79 47 33 mdash mdash mdash
2011 600 300 169 114 72 36 mdash mdash mdash mdash
2012 611 299 162 104 63 mdash mdash mdash mdash mdash
2013 605 296 168 106 mdash mdash mdash mdash mdash mdash
2014 615 334 194 mdash mdash mdash mdash mdash mdash mdash
2015 635 329 mdash mdash mdash mdash mdash mdash mdash mdash
2016 617 mdash mdash mdash mdash mdash mdash mdash mdash mdash
Average 608 325 194 129 84 50 35 22 15 mdash
Difference 08 04 01 (24) (21) (14) (03) (03) (01) mdash
Source SNL Financial
33
Reserve Adequacy mdash Ratio Analysis
(40)
(30)
(20)
(10)
0
10
20
30
0 5 10 15 20 25 30 35 40 45
(IBNRIncurred Losses at 24 Months )IBNR ndash Incurred but not reported
Source SNL Financial
( Incurred Losses Deficient[Redundant])
Historical Accident-Year Reserve Development Related to IBNR Levels(Accident Years 1987ndash2011)
Correlation = (78)
R-Squared = 74
Deficient
Redundant
Analysis of Industry MPLI Claims Made for Accident Years 1987ndash2011
bull HigherLower IBNR Levels Relative to Incurred Losses at Early Periods of Development Related
to Ultimate Loss Experience
34
ALL FITCH CREDIT RATINGS ARE SUBJECT TO CERTAIN LIMITATIONS AND DISCLAIMERS
PLEASE READ THESE LIMITATIONS AND DISCLAIMERS BY FOLLOWING THIS LINK
HTTPSFITCHRATINGSCOMUNDERSTANDINGCREDITRATINGS IN ADDITION RATING
DEFINITIONS AND THE TERMS OF USE OF SUCH RATINGS ARE AVAILABLE ON THE
AGENCYS PUBLIC WEB SITE
AT WWWFITCHRATINGSCOM PUBLISHED RATINGS CRITERIA AND METHODOLOGIES ARE
AVAILABLE FROM THIS SITE AT ALL TIMES FITCHS CODE OF CONDUCT CONFIDENTIALITY
CONFLICTS OF INTEREST AFFILIATE FIREWALL COMPLIANCE AND OTHER RELEVANT
POLICIES AND PROCEDURES ARE ALSO AVAILABLE FROM THE CODE OF CONDUCT
SECTION OF THIS SITE FITCH MAY HAVE PROVIDED ANOTHER PERMISSIBLE SERVICE TO
THE RATED ENTITY OR ITS RELATED THIRD PARTIES DETAILS OF THIS SERVICE FOR
RATINGS FOR WHICH THE LEAD ANALYST IS BASED IN AN EU-REGISTERED ENTITY CAN BE
FOUND ON THE ENTITY SUMMARY PAGE FOR THIS ISSUER ON THE FITCH WEBSITE
Copyright copy 2017 by Fitch Ratings Inc Fitch Ratings Ltd and its subsidiaries 33 Whitehall Street
NY NY 10004 Telephone 1-800-753-4824 (212) 908-0500 Fax (212) 480-4435 Reproduction or
retransmission in whole or in part is prohibited except by permission All rights reserved In issuing
and maintaining its ratings and in making other reports (including forecast information) Fitch relies on
factual information it receives from issuers and underwriters and from other sources Fitch believes to
be credible Fitch conducts a reasonable investigation of the factual information relied upon by it in
accordance with its ratings methodology and obtains reasonable verification of that information from
independent sources to the extent such sources are available for a given security or in a given
jurisdiction The manner of Fitchrsquos factual investigation and the scope of the third-party verification it
obtains will vary depending on the nature of the rated security and its issuer the requirements and
practices in the jurisdiction in which the rated security is offered and sold andor the issuer is located
the availability and nature of relevant public information access to the management of the issuer and
its advisers the availability of pre-existing third-party verifications such as audit reports agreed-upon
procedures letters appraisals actuarial reports engineering reports legal opinions and other reports
provided by third parties the availability of independent and competent third-party verification sources
with respect to the particular security or in the particular jurisdiction of the issuer and a variety of
other factors Users of Fitchrsquos ratings and reports should understand that neither an enhanced factual
investigation nor any third-party verification can ensure that all of the information Fitch relies on in
connection with a rating or a report will be accurate and complete Ultimately the issuer and its
advisers are responsible for the accuracy of the information they provide to Fitch and to the market in
offering documents and other reports In issuing its ratings and its reports Fitch must rely on the work
of experts including independent auditors with respect to financial statements and attorneys with
respect to legal and tax matters Further ratings and forecasts of financial and other information are
inherently forward-looking and embody assumptions and predictions about future events that by their
nature cannot be verified as facts As a result despite any verification of current facts ratings and
forecasts can be affected by future events or conditions that were not anticipated at the time a rating
or forecast was issued or affirmed
The information in this report is provided ldquoas isrdquo without any representation or warranty of any kind
and Fitch does not represent or warrant that the report or any of its contents will meet any of the
requirements of a recipient of the report A Fitch rating is an opinion as to the creditworthiness of a
security This opinion and reports made by Fitch are based on established criteria and methodologies
that Fitch is continuously evaluating and updating Therefore ratings and reports are the collective
work product of Fitch and no individual or group of individuals is solely responsible for a rating or a
report The rating does not address the risk of loss due to risks other than credit risk unless such risk
is specifically mentioned Fitch is not engaged in the offer or sale of any security All Fitch reports
have shared authorship Individuals identified in a Fitch report were involved in but are not solely
responsible for the opinions stated therein The individuals are named for contact purposes only A
report providing a Fitch rating is neither a prospectus nor a substitute for the information assembled
verified and presented to investors by the issuer and its agents in connection with the sale of the
securities Ratings may be changed or withdrawn at any time for any reason in the sole discretion of
Fitch Fitch does not provide investment advice of any sort Ratings are not a recommendation to buy
sell or hold any security Ratings do not comment on the adequacy of market price the suitability of
any security for a particular investor or the tax-exempt nature or taxability of payments made in
respect to any security Fitch receives fees from issuers insurers guarantors other obligors and
underwriters for rating securities Such fees generally vary from US$1000 to US$750000 (or the
applicable currency equivalent) per issue In certain cases Fitch will rate all or a number of issues
issued by a particular issuer or insured or guaranteed by a particular insurer or guarantor for a single
annual fee Such fees are expected to vary from US$10000 to US$1500000 (or the applicable
currency equivalent) The assignment publication or dissemination of a rating by Fitch shall not
constitute a consent by Fitch to use its name as an expert in connection with any registration
statement filed under the United States securities laws the Financial Services and Markets Act of
2000 of the United Kingdom or the securities laws of any particular jurisdiction Due to the relative
efficiency of electronic publishing and distribution Fitch research may be available to electronic
subscribers up to three days earlier than to print subscribers
For Australia New Zealand Taiwan and South Korea only Fitch Australia Pty Ltd holds an Australian
financial services license (AFS license no 337123) which authorizes it to provide credit ratings to
wholesale clients only Credit ratings information published by Fitch is not intended to be used by
persons who are retail clients within the meaning of the Corporations Act 2001
fitchratings
fitchratingscom
New York London33 Whitehall Street
New York NY 10004
30 North Colonnade
Canary Wharf
London E14 5GN

20
Over Long Term an Insurerrsquos Reserves Should Grow Commensurate with Exposures
Key Ratios
bull Calendar-Year PaidCalendar-Year Incurred Losses
bull ReservesEarned Premiums (Changes over Time)
MPLI Reserve Growth
00
02
04
06
08
10
12
14
2007 2008 2009 2010 2011 2012 2013 2014 2015 2016
(x)
Note Aggregate for a group of 35 MPLI specialists Calendar-year paid and incurred losses
Source SNL Financial
Paid gt Incurred Loss Indicative of
Reserve Weakness but Incurred
Influence by Reserve Takedowns
MPLI Specialists Reserve Growth Indications(PaidIncurred Losses)
30
31
32
33
34
2007 2008 2009 2010 2011 2012 2013 2014 2015 2016
(x)
Note Aggregate for a group of 35 MPLI specialists
Source SNL Financial
Stable Ratio = Reserve
Changes Keeping Pace
with Premium Changes
MPLI Specialists Reserve Growth Indications(ReservesEarned Premium)
21
Key Ratios
bull Calendar Year
‒ One Year Development Prior-Year Reserves
‒ One Year Development Prior-Year Surplus
‒ One Year Development Earned Premiums
bull Accident Year
‒ Current Loss Ratio Estimate Versus Original Estimate
‒ Accident-Year Development History and Trends
MPLI Reserve Experience
22
Reserve Experience mdash Favorable MPLI Development
bull Reserve Development Still Highly Favorable but Slowing Considerably
196
237228
266
221206
245
198
166
116
0
5
10
15
20
25
30
2007 2008 2009 2010 2011 2012 2013 2014 2015 2016
( of Earned Premiums)
MPLI Calendar-Year Reserve Development
Note Excludes MCIC Vermont Propertycasualty industry aggregate
Source SNL Financial
Favorable
Development
23
Reserve Experience mdash Calendar-Year Development
bull MPLI Development Greatly Exceeds Other Commercial Lines Segments over Last Decade
bull Magnitude of Favorable Development in MPLI Declining
(30)
(25)
(20)
(15)
(10)
(5)
0
5
10
15
Commercial Auto Other Liability mdash Claims Made Other Liability mdash Occurrence MPLI mdash Claims Made Workers Compensation
() 2012 2013 2014 2015 2016
Source SNL Financial
Segment Calendar-Year Development as a of Earned Premium mdash (Favorable)Unfavorable
24
Favorable Reserve Development Slowing
(5)
0
5
10
15
20
2015 2014 2013 2012 2011 2010 2009 2008 2007 2006 2005 2004 2003
12ndash24 Months 24ndash36 Months 36ndash48 Months
Note Propertycasualty industry aggregate MPLI claims made
Source SNL Financial
( Favorable[Unfavorable])
Favorable MPLI Accident-Year Development Slowing mdash Change in Loss Ratio
25
Favorable Reserve Development Slowing
0
10
20
30
40
50
60
70
80
90
2015 2014 2013 2012 2011 2010 2009 2008 2007
()
Accident-Year Loss Ratio Changes by Time of Development
12 Months 24 Months 36 Months 48 Months 60 Months 72 Months 84 Months 96 Months 108 Months 120 Months
Note Industry aggregate MPLI claims made
Source SNL Financial
26
Accident-Year Loss Ratio
bull Claims Made Accident-Year Loss Ratio Rising
bull Will Recent Accident-Years Develop Downward Like 2003ndash2010
510 574
619 672
736 788
829 859 886 867
0
10
20
30
40
50
60
70
80
90
100
2007 2008 2009 2010 2011 2012 2013 2014 2015 2016
()
Accident-Year Loss and LAE Ratio(Current Loss Ratio Estimate)
Note Propertycasualty industry aggregate MPLI claims made
Source SNL Financial Fitch
27
Accident-Year Loss Ratio Development
bull Recent Accident-Years Favorable Development Pattern Lagging Past Highly Redundant AYs
(27) (21)(19) (16) (9)
(5) 00 1
0
10
20
30
40
50
60
70
80
90
100
2007 2008 2009 2010 2011 2012 2013 2014 2015
()
Accident-Year Loss and LAE Ratio Development
Current LR Est Original LR Est
LR ndash Loss ratio Note Propertycasualty industry aggregate MPLI claims made
Source SNL Financial Fitch
Change Current
LR Versus Original
28
MPLI Reserve Adequacy
Key Considerations
bull Likelihood of Balance Sheet Reported Reserves to Develop HigherLower over Time
bull Stress Test Capital Impact of Potential Deficiencies
Analytical Tools
bull Project Reserve Adequacy Using Loss Development Methods (PaidCase Incurred)
bull Accident-Year Ratio Analysis
29
Reserve Adequacy mdash MPLI
bull Initial Analysis of Industry 2016 Reserves
bull MPLI Claims Made and Occurrence Reserves Still 5ndash7 Redundant ($14 Billionndash$20 Billion)
(09)
(09)(20)
(20) (34) (37) (20)
0
10
20
30
40
50
60
70
80
90
2007 2008 2009 2010 2011 2012 2013 2014 2015 2016
()
Estimated Reserve Adequacy mdash Paid Development Method
Reported Loss Ratio Projected Loss Ratio
Note Propertycasualty industry aggregate MPLI claims made
Source SNL Financial
Accident-Year Loss
Ratio Redundant
30
MPLI Reserve Ratio Analysis mdash Accident-Year PaidIncurred
bull At Same Period of Development Paid to Incurred Losses Should Be Similar Across Accident Years
bull HigherLower Paid to Incurred for One Accident Year Versus Others Indicative of Reserve
WeaknessStrength
PropertyCasualty Industry mdash Medical Malpractice Claims Made( PaidIncurred)
Months of Development
Accident Year 12 24 36 48 60 72 84 96 108 120
2007 33 182 378 540 692 788 865 902 932 962
2008 37 189 391 568 712 817 862 899 945 mdash
2009 38 203 405 580 719 806 857 928 mdash mdash
2010 41 206 408 576 713 816 871 mdash mdash mdash
2011 39 202 420 577 731 831 mdash mdash mdash mdash
2012 38 219 420 607 743 mdash mdash mdash mdash mdash
2013 45 218 442 615 mdash mdash mdash mdash mdash mdash
2014 44 218 430 mdash mdash mdash mdash mdash mdash mdash
2015 40 207 mdash mdash mdash mdash mdash mdash mdash mdash
2016 43 mdash mdash mdash mdash mdash mdash mdash mdash mdash
Average 40 205 412 580 718 811 864 909 939 mdash
Difference 03 02 18 34 25 19 07 18 06 mdash
Source SNL Financial
31
(50)
(40)
(30)
(20)
(10)
0
10
20
30
10 15 20 25 30 35
(PaidIncurred Losses at 24 Months )
Source SNL Financial
( Incurred Losses Deficient[Redundant])
Historical Accident-Year Reserve Development Related to Paid Levels(Accident Years 1987ndash2011)
Correlation = 92
R-Squared = 84
Reserve Ratio Analysis mdash Accident-Year PaidIncurred
Analysis of Industry MPLI Claims Made for Accident Years 1987ndash2011
bull LowerHigher Cumulative Paid Loss Levels Relative to Incurred Losses at Early Periods of
Development Related to Ultimate Loss Experience
Deficient
Redundant
32
MPLI Reserve Ratio Analysis mdash Accident-Year IBNRIncurred
bull At Same Period of Development Incurred but Not Reported (IBNR) to Incurred Should Be Similar
Across Accident Years
bull LowerHigher IBNR Levels for One AY Versus Others Indicative of Reserve WeaknessStrength
PropertyCasualty Industry mdash Medical Malpractice Claims Made( IBNRIncurred)
Months of Development
Accident Year 12 24 36 48 60 72 84 96 108 120
2007 616 382 264 177 110 69 35 21 16 11
2008 599 335 203 141 87 46 33 27 14 mdash
2009 599 330 207 142 93 54 39 20 mdash mdash
2010 588 321 181 121 79 47 33 mdash mdash mdash
2011 600 300 169 114 72 36 mdash mdash mdash mdash
2012 611 299 162 104 63 mdash mdash mdash mdash mdash
2013 605 296 168 106 mdash mdash mdash mdash mdash mdash
2014 615 334 194 mdash mdash mdash mdash mdash mdash mdash
2015 635 329 mdash mdash mdash mdash mdash mdash mdash mdash
2016 617 mdash mdash mdash mdash mdash mdash mdash mdash mdash
Average 608 325 194 129 84 50 35 22 15 mdash
Difference 08 04 01 (24) (21) (14) (03) (03) (01) mdash
Source SNL Financial
33
Reserve Adequacy mdash Ratio Analysis
(40)
(30)
(20)
(10)
0
10
20
30
0 5 10 15 20 25 30 35 40 45
(IBNRIncurred Losses at 24 Months )IBNR ndash Incurred but not reported
Source SNL Financial
( Incurred Losses Deficient[Redundant])
Historical Accident-Year Reserve Development Related to IBNR Levels(Accident Years 1987ndash2011)
Correlation = (78)
R-Squared = 74
Deficient
Redundant
Analysis of Industry MPLI Claims Made for Accident Years 1987ndash2011
bull HigherLower IBNR Levels Relative to Incurred Losses at Early Periods of Development Related
to Ultimate Loss Experience
34
ALL FITCH CREDIT RATINGS ARE SUBJECT TO CERTAIN LIMITATIONS AND DISCLAIMERS
PLEASE READ THESE LIMITATIONS AND DISCLAIMERS BY FOLLOWING THIS LINK
HTTPSFITCHRATINGSCOMUNDERSTANDINGCREDITRATINGS IN ADDITION RATING
DEFINITIONS AND THE TERMS OF USE OF SUCH RATINGS ARE AVAILABLE ON THE
AGENCYS PUBLIC WEB SITE
AT WWWFITCHRATINGSCOM PUBLISHED RATINGS CRITERIA AND METHODOLOGIES ARE
AVAILABLE FROM THIS SITE AT ALL TIMES FITCHS CODE OF CONDUCT CONFIDENTIALITY
CONFLICTS OF INTEREST AFFILIATE FIREWALL COMPLIANCE AND OTHER RELEVANT
POLICIES AND PROCEDURES ARE ALSO AVAILABLE FROM THE CODE OF CONDUCT
SECTION OF THIS SITE FITCH MAY HAVE PROVIDED ANOTHER PERMISSIBLE SERVICE TO
THE RATED ENTITY OR ITS RELATED THIRD PARTIES DETAILS OF THIS SERVICE FOR
RATINGS FOR WHICH THE LEAD ANALYST IS BASED IN AN EU-REGISTERED ENTITY CAN BE
FOUND ON THE ENTITY SUMMARY PAGE FOR THIS ISSUER ON THE FITCH WEBSITE
Copyright copy 2017 by Fitch Ratings Inc Fitch Ratings Ltd and its subsidiaries 33 Whitehall Street
NY NY 10004 Telephone 1-800-753-4824 (212) 908-0500 Fax (212) 480-4435 Reproduction or
retransmission in whole or in part is prohibited except by permission All rights reserved In issuing
and maintaining its ratings and in making other reports (including forecast information) Fitch relies on
factual information it receives from issuers and underwriters and from other sources Fitch believes to
be credible Fitch conducts a reasonable investigation of the factual information relied upon by it in
accordance with its ratings methodology and obtains reasonable verification of that information from
independent sources to the extent such sources are available for a given security or in a given
jurisdiction The manner of Fitchrsquos factual investigation and the scope of the third-party verification it
obtains will vary depending on the nature of the rated security and its issuer the requirements and
practices in the jurisdiction in which the rated security is offered and sold andor the issuer is located
the availability and nature of relevant public information access to the management of the issuer and
its advisers the availability of pre-existing third-party verifications such as audit reports agreed-upon
procedures letters appraisals actuarial reports engineering reports legal opinions and other reports
provided by third parties the availability of independent and competent third-party verification sources
with respect to the particular security or in the particular jurisdiction of the issuer and a variety of
other factors Users of Fitchrsquos ratings and reports should understand that neither an enhanced factual
investigation nor any third-party verification can ensure that all of the information Fitch relies on in
connection with a rating or a report will be accurate and complete Ultimately the issuer and its
advisers are responsible for the accuracy of the information they provide to Fitch and to the market in
offering documents and other reports In issuing its ratings and its reports Fitch must rely on the work
of experts including independent auditors with respect to financial statements and attorneys with
respect to legal and tax matters Further ratings and forecasts of financial and other information are
inherently forward-looking and embody assumptions and predictions about future events that by their
nature cannot be verified as facts As a result despite any verification of current facts ratings and
forecasts can be affected by future events or conditions that were not anticipated at the time a rating
or forecast was issued or affirmed
The information in this report is provided ldquoas isrdquo without any representation or warranty of any kind
and Fitch does not represent or warrant that the report or any of its contents will meet any of the
requirements of a recipient of the report A Fitch rating is an opinion as to the creditworthiness of a
security This opinion and reports made by Fitch are based on established criteria and methodologies
that Fitch is continuously evaluating and updating Therefore ratings and reports are the collective
work product of Fitch and no individual or group of individuals is solely responsible for a rating or a
report The rating does not address the risk of loss due to risks other than credit risk unless such risk
is specifically mentioned Fitch is not engaged in the offer or sale of any security All Fitch reports
have shared authorship Individuals identified in a Fitch report were involved in but are not solely
responsible for the opinions stated therein The individuals are named for contact purposes only A
report providing a Fitch rating is neither a prospectus nor a substitute for the information assembled
verified and presented to investors by the issuer and its agents in connection with the sale of the
securities Ratings may be changed or withdrawn at any time for any reason in the sole discretion of
Fitch Fitch does not provide investment advice of any sort Ratings are not a recommendation to buy
sell or hold any security Ratings do not comment on the adequacy of market price the suitability of
any security for a particular investor or the tax-exempt nature or taxability of payments made in
respect to any security Fitch receives fees from issuers insurers guarantors other obligors and
underwriters for rating securities Such fees generally vary from US$1000 to US$750000 (or the
applicable currency equivalent) per issue In certain cases Fitch will rate all or a number of issues
issued by a particular issuer or insured or guaranteed by a particular insurer or guarantor for a single
annual fee Such fees are expected to vary from US$10000 to US$1500000 (or the applicable
currency equivalent) The assignment publication or dissemination of a rating by Fitch shall not
constitute a consent by Fitch to use its name as an expert in connection with any registration
statement filed under the United States securities laws the Financial Services and Markets Act of
2000 of the United Kingdom or the securities laws of any particular jurisdiction Due to the relative
efficiency of electronic publishing and distribution Fitch research may be available to electronic
subscribers up to three days earlier than to print subscribers
For Australia New Zealand Taiwan and South Korea only Fitch Australia Pty Ltd holds an Australian
financial services license (AFS license no 337123) which authorizes it to provide credit ratings to
wholesale clients only Credit ratings information published by Fitch is not intended to be used by
persons who are retail clients within the meaning of the Corporations Act 2001
fitchratings
fitchratingscom
New York London33 Whitehall Street
New York NY 10004
30 North Colonnade
Canary Wharf
London E14 5GN
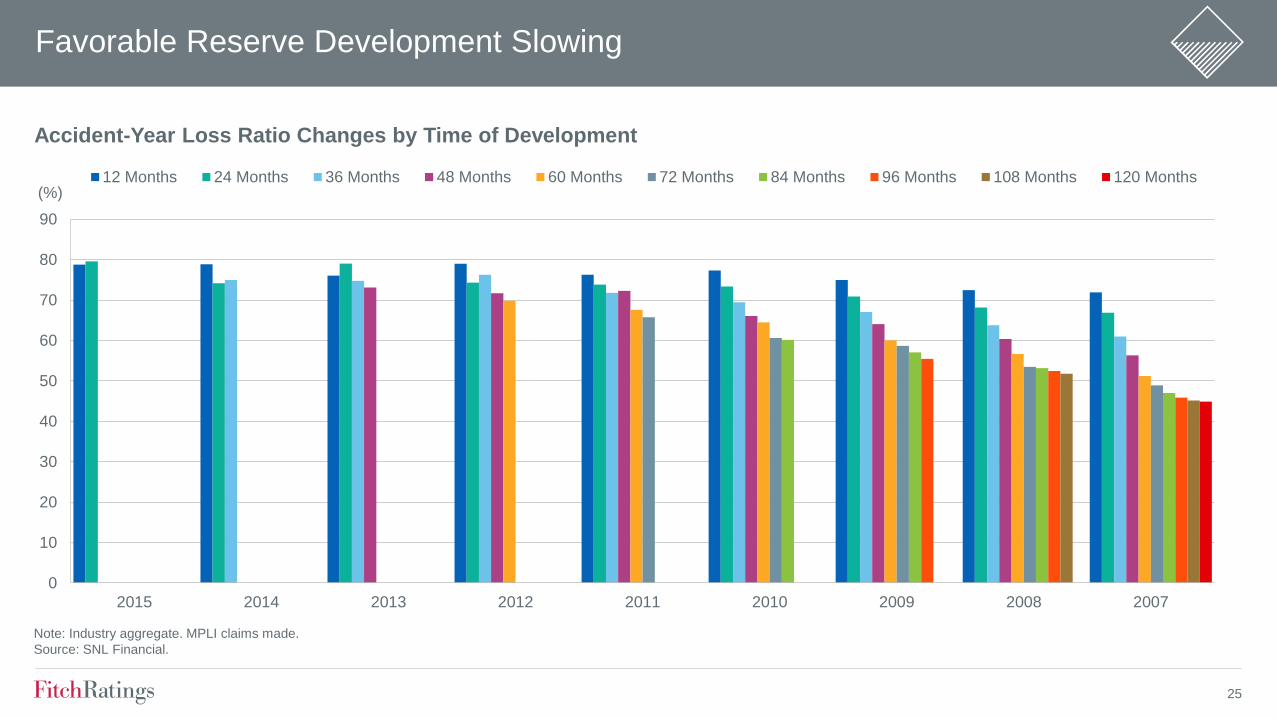
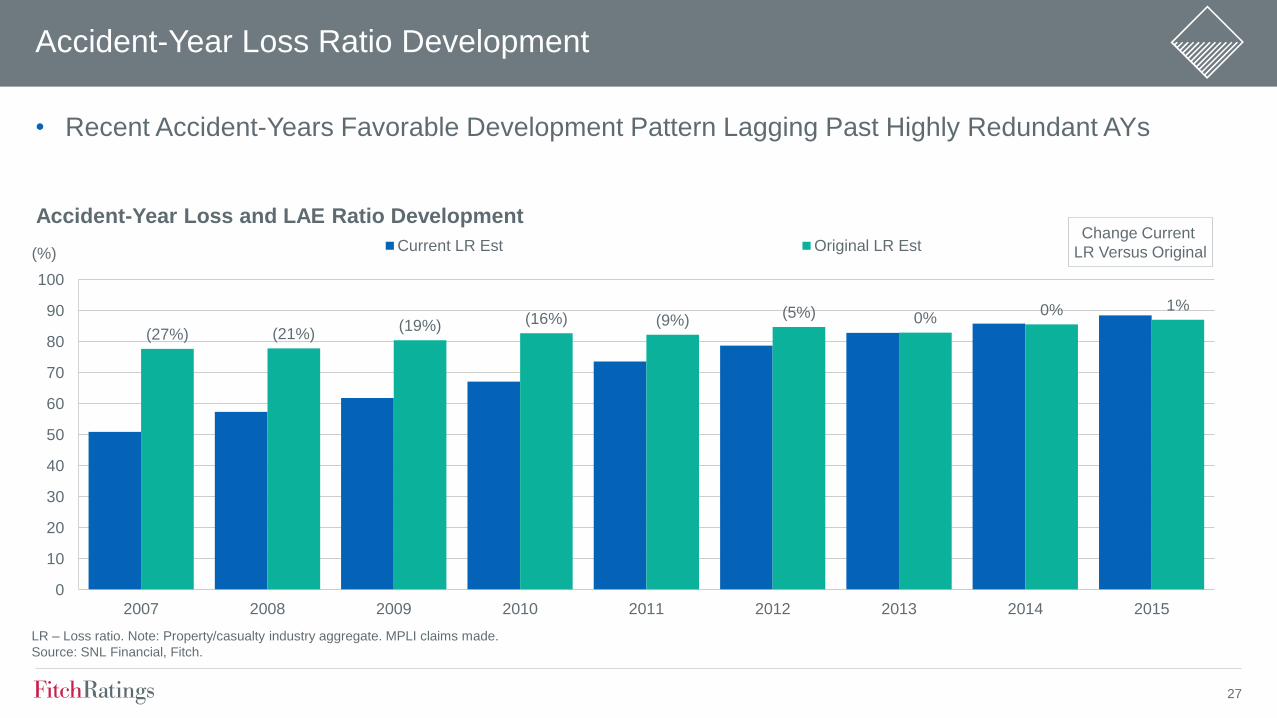
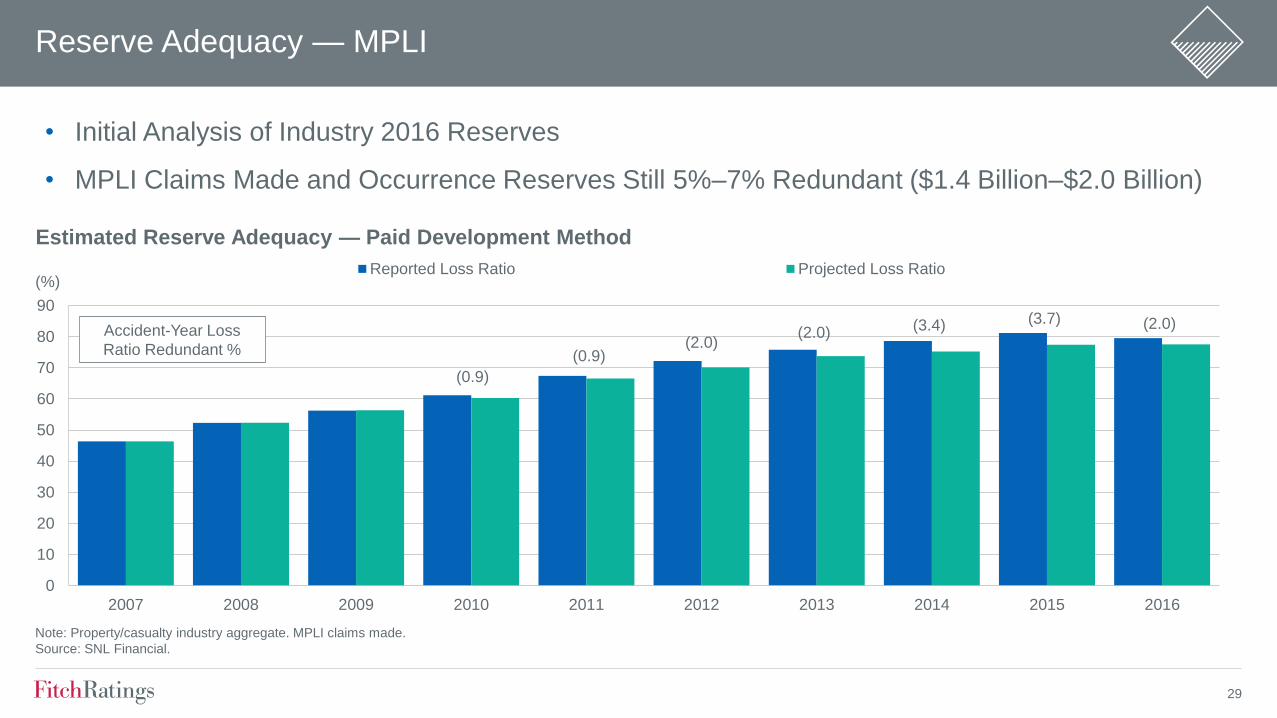
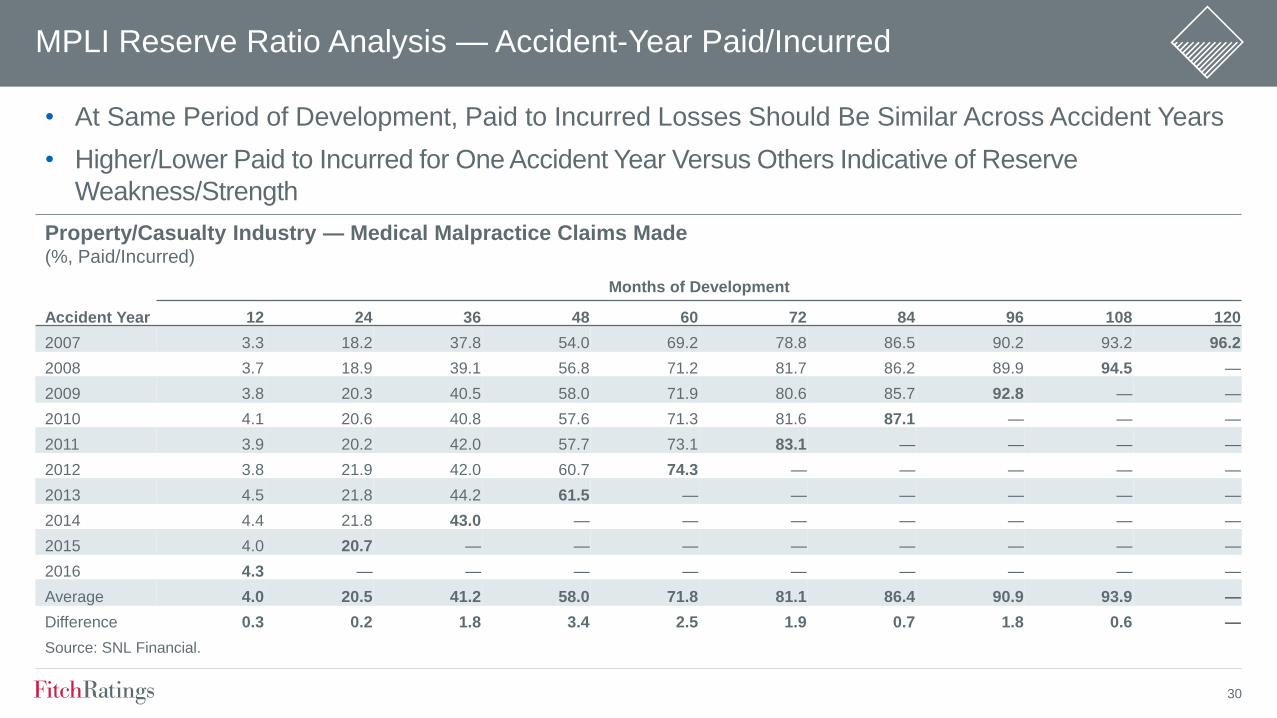
30
MPLI Reserve Ratio Analysis mdash Accident-Year PaidIncurred
bull At Same Period of Development Paid to Incurred Losses Should Be Similar Across Accident Years
bull HigherLower Paid to Incurred for One Accident Year Versus Others Indicative of Reserve
WeaknessStrength
PropertyCasualty Industry mdash Medical Malpractice Claims Made( PaidIncurred)
Months of Development
Accident Year 12 24 36 48 60 72 84 96 108 120
2007 33 182 378 540 692 788 865 902 932 962
2008 37 189 391 568 712 817 862 899 945 mdash
2009 38 203 405 580 719 806 857 928 mdash mdash
2010 41 206 408 576 713 816 871 mdash mdash mdash
2011 39 202 420 577 731 831 mdash mdash mdash mdash
2012 38 219 420 607 743 mdash mdash mdash mdash mdash
2013 45 218 442 615 mdash mdash mdash mdash mdash mdash
2014 44 218 430 mdash mdash mdash mdash mdash mdash mdash
2015 40 207 mdash mdash mdash mdash mdash mdash mdash mdash
2016 43 mdash mdash mdash mdash mdash mdash mdash mdash mdash
Average 40 205 412 580 718 811 864 909 939 mdash
Difference 03 02 18 34 25 19 07 18 06 mdash
Source SNL Financial
31
(50)
(40)
(30)
(20)
(10)
0
10
20
30
10 15 20 25 30 35
(PaidIncurred Losses at 24 Months )
Source SNL Financial
( Incurred Losses Deficient[Redundant])
Historical Accident-Year Reserve Development Related to Paid Levels(Accident Years 1987ndash2011)
Correlation = 92
R-Squared = 84
Reserve Ratio Analysis mdash Accident-Year PaidIncurred
Analysis of Industry MPLI Claims Made for Accident Years 1987ndash2011
bull LowerHigher Cumulative Paid Loss Levels Relative to Incurred Losses at Early Periods of
Development Related to Ultimate Loss Experience
Deficient
Redundant
32
MPLI Reserve Ratio Analysis mdash Accident-Year IBNRIncurred
bull At Same Period of Development Incurred but Not Reported (IBNR) to Incurred Should Be Similar
Across Accident Years
bull LowerHigher IBNR Levels for One AY Versus Others Indicative of Reserve WeaknessStrength
PropertyCasualty Industry mdash Medical Malpractice Claims Made( IBNRIncurred)
Months of Development
Accident Year 12 24 36 48 60 72 84 96 108 120
2007 616 382 264 177 110 69 35 21 16 11
2008 599 335 203 141 87 46 33 27 14 mdash
2009 599 330 207 142 93 54 39 20 mdash mdash
2010 588 321 181 121 79 47 33 mdash mdash mdash
2011 600 300 169 114 72 36 mdash mdash mdash mdash
2012 611 299 162 104 63 mdash mdash mdash mdash mdash
2013 605 296 168 106 mdash mdash mdash mdash mdash mdash
2014 615 334 194 mdash mdash mdash mdash mdash mdash mdash
2015 635 329 mdash mdash mdash mdash mdash mdash mdash mdash
2016 617 mdash mdash mdash mdash mdash mdash mdash mdash mdash
Average 608 325 194 129 84 50 35 22 15 mdash
Difference 08 04 01 (24) (21) (14) (03) (03) (01) mdash
Source SNL Financial
33
Reserve Adequacy mdash Ratio Analysis
(40)
(30)
(20)
(10)
0
10
20
30
0 5 10 15 20 25 30 35 40 45
(IBNRIncurred Losses at 24 Months )IBNR ndash Incurred but not reported
Source SNL Financial
( Incurred Losses Deficient[Redundant])
Historical Accident-Year Reserve Development Related to IBNR Levels(Accident Years 1987ndash2011)
Correlation = (78)
R-Squared = 74
Deficient
Redundant
Analysis of Industry MPLI Claims Made for Accident Years 1987ndash2011
bull HigherLower IBNR Levels Relative to Incurred Losses at Early Periods of Development Related
to Ultimate Loss Experience
34
ALL FITCH CREDIT RATINGS ARE SUBJECT TO CERTAIN LIMITATIONS AND DISCLAIMERS
PLEASE READ THESE LIMITATIONS AND DISCLAIMERS BY FOLLOWING THIS LINK
HTTPSFITCHRATINGSCOMUNDERSTANDINGCREDITRATINGS IN ADDITION RATING
DEFINITIONS AND THE TERMS OF USE OF SUCH RATINGS ARE AVAILABLE ON THE
AGENCYS PUBLIC WEB SITE
AT WWWFITCHRATINGSCOM PUBLISHED RATINGS CRITERIA AND METHODOLOGIES ARE
AVAILABLE FROM THIS SITE AT ALL TIMES FITCHS CODE OF CONDUCT CONFIDENTIALITY
CONFLICTS OF INTEREST AFFILIATE FIREWALL COMPLIANCE AND OTHER RELEVANT
POLICIES AND PROCEDURES ARE ALSO AVAILABLE FROM THE CODE OF CONDUCT
SECTION OF THIS SITE FITCH MAY HAVE PROVIDED ANOTHER PERMISSIBLE SERVICE TO
THE RATED ENTITY OR ITS RELATED THIRD PARTIES DETAILS OF THIS SERVICE FOR
RATINGS FOR WHICH THE LEAD ANALYST IS BASED IN AN EU-REGISTERED ENTITY CAN BE
FOUND ON THE ENTITY SUMMARY PAGE FOR THIS ISSUER ON THE FITCH WEBSITE
Copyright copy 2017 by Fitch Ratings Inc Fitch Ratings Ltd and its subsidiaries 33 Whitehall Street
NY NY 10004 Telephone 1-800-753-4824 (212) 908-0500 Fax (212) 480-4435 Reproduction or
retransmission in whole or in part is prohibited except by permission All rights reserved In issuing
and maintaining its ratings and in making other reports (including forecast information) Fitch relies on
factual information it receives from issuers and underwriters and from other sources Fitch believes to
be credible Fitch conducts a reasonable investigation of the factual information relied upon by it in
accordance with its ratings methodology and obtains reasonable verification of that information from
independent sources to the extent such sources are available for a given security or in a given
jurisdiction The manner of Fitchrsquos factual investigation and the scope of the third-party verification it
obtains will vary depending on the nature of the rated security and its issuer the requirements and
practices in the jurisdiction in which the rated security is offered and sold andor the issuer is located
the availability and nature of relevant public information access to the management of the issuer and
its advisers the availability of pre-existing third-party verifications such as audit reports agreed-upon
procedures letters appraisals actuarial reports engineering reports legal opinions and other reports
provided by third parties the availability of independent and competent third-party verification sources
with respect to the particular security or in the particular jurisdiction of the issuer and a variety of
other factors Users of Fitchrsquos ratings and reports should understand that neither an enhanced factual
investigation nor any third-party verification can ensure that all of the information Fitch relies on in
connection with a rating or a report will be accurate and complete Ultimately the issuer and its
advisers are responsible for the accuracy of the information they provide to Fitch and to the market in
offering documents and other reports In issuing its ratings and its reports Fitch must rely on the work
of experts including independent auditors with respect to financial statements and attorneys with
respect to legal and tax matters Further ratings and forecasts of financial and other information are
inherently forward-looking and embody assumptions and predictions about future events that by their
nature cannot be verified as facts As a result despite any verification of current facts ratings and
forecasts can be affected by future events or conditions that were not anticipated at the time a rating
or forecast was issued or affirmed
The information in this report is provided ldquoas isrdquo without any representation or warranty of any kind
and Fitch does not represent or warrant that the report or any of its contents will meet any of the
requirements of a recipient of the report A Fitch rating is an opinion as to the creditworthiness of a
security This opinion and reports made by Fitch are based on established criteria and methodologies
that Fitch is continuously evaluating and updating Therefore ratings and reports are the collective
work product of Fitch and no individual or group of individuals is solely responsible for a rating or a
report The rating does not address the risk of loss due to risks other than credit risk unless such risk
is specifically mentioned Fitch is not engaged in the offer or sale of any security All Fitch reports
have shared authorship Individuals identified in a Fitch report were involved in but are not solely
responsible for the opinions stated therein The individuals are named for contact purposes only A
report providing a Fitch rating is neither a prospectus nor a substitute for the information assembled
verified and presented to investors by the issuer and its agents in connection with the sale of the
securities Ratings may be changed or withdrawn at any time for any reason in the sole discretion of
Fitch Fitch does not provide investment advice of any sort Ratings are not a recommendation to buy
sell or hold any security Ratings do not comment on the adequacy of market price the suitability of
any security for a particular investor or the tax-exempt nature or taxability of payments made in
respect to any security Fitch receives fees from issuers insurers guarantors other obligors and
underwriters for rating securities Such fees generally vary from US$1000 to US$750000 (or the
applicable currency equivalent) per issue In certain cases Fitch will rate all or a number of issues
issued by a particular issuer or insured or guaranteed by a particular insurer or guarantor for a single
annual fee Such fees are expected to vary from US$10000 to US$1500000 (or the applicable
currency equivalent) The assignment publication or dissemination of a rating by Fitch shall not
constitute a consent by Fitch to use its name as an expert in connection with any registration
statement filed under the United States securities laws the Financial Services and Markets Act of
2000 of the United Kingdom or the securities laws of any particular jurisdiction Due to the relative
efficiency of electronic publishing and distribution Fitch research may be available to electronic
subscribers up to three days earlier than to print subscribers
For Australia New Zealand Taiwan and South Korea only Fitch Australia Pty Ltd holds an Australian
financial services license (AFS license no 337123) which authorizes it to provide credit ratings to
wholesale clients only Credit ratings information published by Fitch is not intended to be used by
persons who are retail clients within the meaning of the Corporations Act 2001
fitchratings
fitchratingscom
New York London33 Whitehall Street
New York NY 10004
30 North Colonnade
Canary Wharf
London E14 5GN
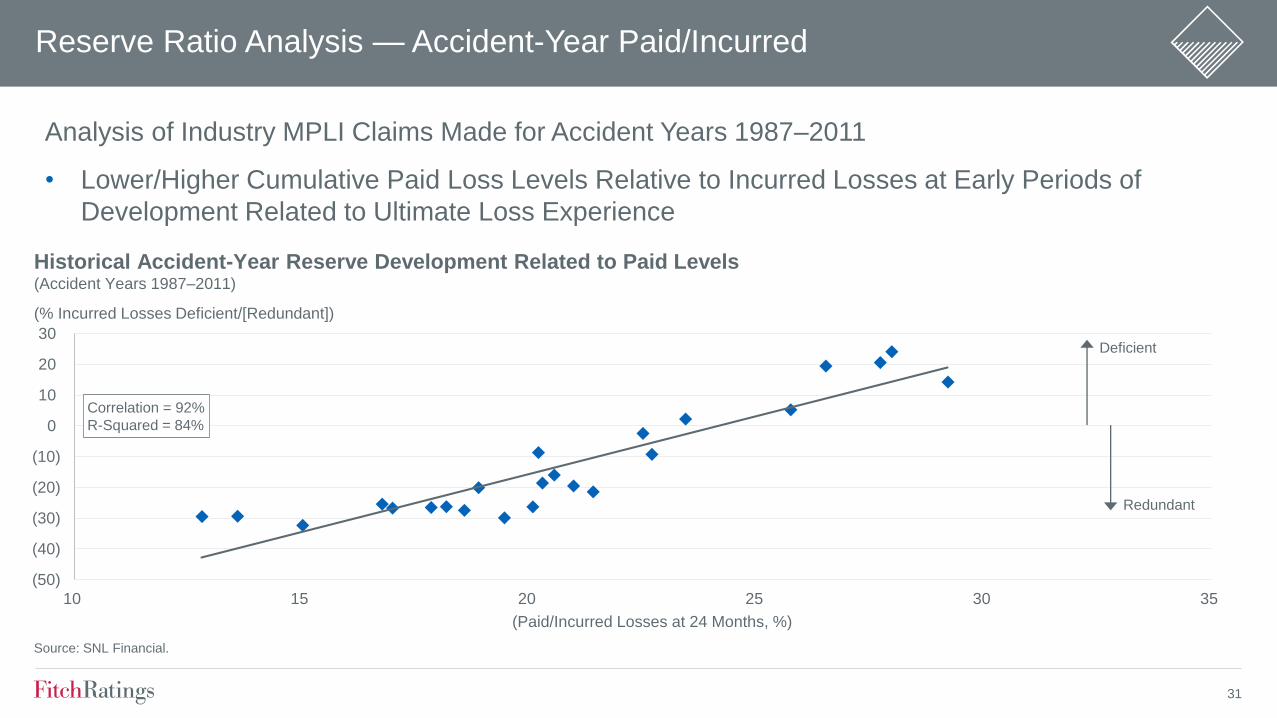
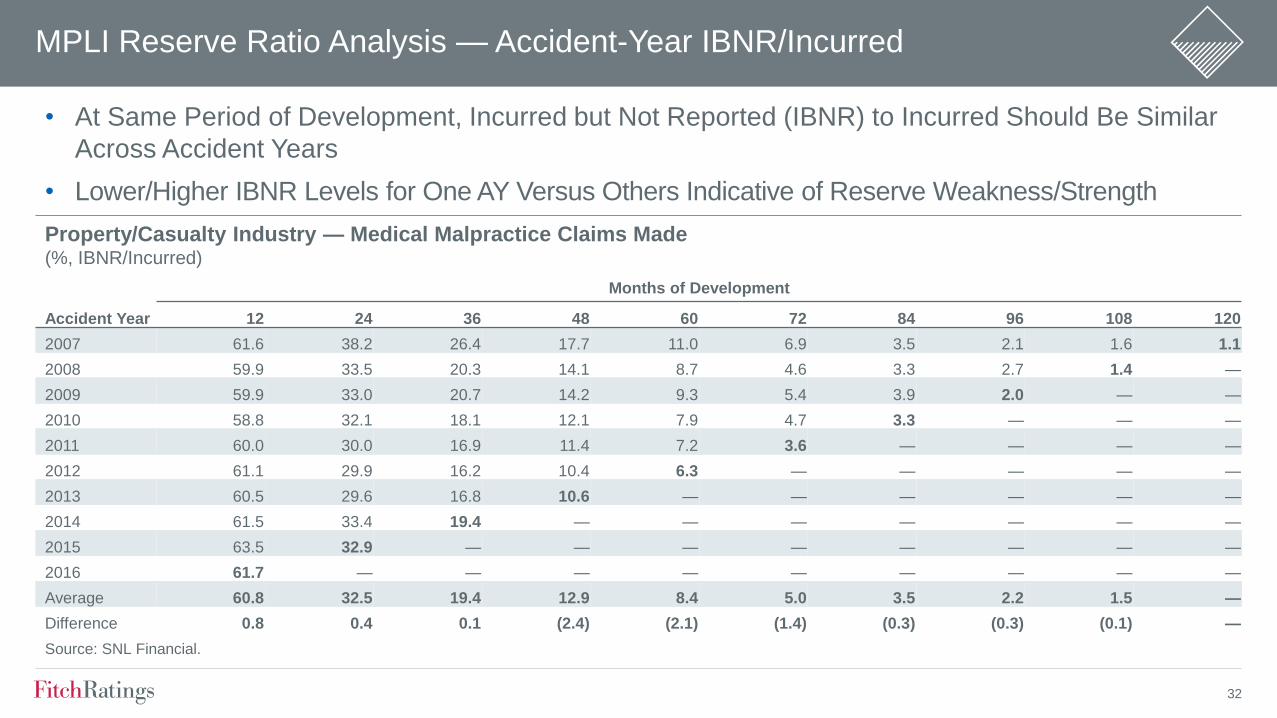

fitchratings
fitchratingscom
New York London33 Whitehall Street
New York NY 10004
30 North Colonnade
Canary Wharf
London E14 5GN