rates of weathering and soil formation - kinki-ecotech.jp · the rates of weathering and soil...
TRANSCRIPT

Geoderma, 52 (1992) 251-263 251 Elsevier Science Publishers B.V., Amsterdam
Rates of weathering and soil formation
T o s h i y u k i W a k a t s u k i a n d A z w a r R a s y i d i n Faculty of Agriculture, Shimane University, Matsue 690, Japan
Received February 26, 1990; accepted after revision August 27, 1991 )
ABSTRACT
Wakatsuki, T. and Rasyidin, A., 1992. Rates of weathering and soil formation, Geoderma, 52: 251- 263.
A new method for evaluation of rates of weathering and soil formation is proposed. For the ele- ments derived exclusively from rocks, geochemical mass balances were assumed to exist between par- ent rocks, soils and river waters on both global and regional scales. Seven geochemical mass balance equations, which include the rate of weathering and soil formation as unknown quantities, were set up using the mean contents of seven major elements (AI, Fe, Ca, K, Mg, Na, and Si) in the earth's crust, soils and river waters, respectively. Solutions of 2 i sets of simultaneous equations made from the seven equations gave 21 sets of values of rates of rock weathering and soil formation. Reliability of the results were checked by the criterion that the rate of rock weathering is higher than that of soil formation and both of them have to be positive values. The ranges of results which satisfied the cri- terion were 520-1310 (mean= 1100) kg ha -~ yr - t for the rate of rock weathering and 370-1290 (mean = 700) kg ha-1 yr- t for the rate of soil formation on a global scale. The comparison with the reported value of the mean rate of erosion, 906 kg ha- ~ yr - 1, suggested that the results of the calcu- lations were reliable.
By applying this method, we could calculate the annual rate of soil formation not only on a global scale but also on a regional scale. Some regional examples in small watersheds were tested. The rate of soil formation was 569 kg ha- J yr- ~ in Hubbard Brook watershed, New Hampshire, USA and 2700-5700 kg ha- l yr- 1 in Iu river watersheds in southwestern Japan.
The rates of weathering and soil formation in watersheds are basic items of information for estab- lishing sustainable watershed management practices to protect soil from degradation, to control de- sertification, and to minimize the effects of acid precipitation.
INTRODUCTION
H o w l o n g d o e s i t t a k e to f o r m a c e n t i m e t e r o f so i l ? ( B u o l e t a l . , 1989 ) . T h i s
is a b a s i c q u e s t i o n t h a t s h o u l d b e a n s w e r e d in so i l s c i e n c e . A l t h o u g h w e h a v e
b e e n a c c u m u l a t i n g d a t a o n r a t e s o f so i l e r o s i o n , d a t a o n r a t e s o f so i l f o r m a -
t i o n a r e s ca rce . S u s t a i n a b l e e c o s y s t e m s s h o u l d h a v e a d y n a m i c b a l a n c e b e -
t w e e n so i l f o r m a t i o n a n d e r o s i o n . I f t h e r a t e s o f so i l f o r m a t i o n a r e f a r g r e a t e r t h a n t h o s e o f so i l e r o s i o n , o l d l e a c h e d so i l s l i k e O x i s o l s u n d e r t r o p i c a l f o r e s t s
w i l l d e v e l o p , a n d i f e r o s i o n is n o t c o m p e n s a t e d f o r b y so i l f o r m a t i o n , so i l d e g r a d a t i o n a n d f i n a l l y d e s e r t i f i c a t i o n wi l l o c c u r . A c i d p r e c i p i t a t i o n p r o - m o t e s w e a t h e r i n g a n d l e a c h i n g , a n d t h u s so i l age ing .
0016-7061/92/$05.00 © 1992 Elsevier Science Publishers B.V. All rights reserved.

252 T. WAKATSUKI AND A. RASYIDIN
In order to assess the balance between the rates of soil erosion and soil for- mation we need to know the rates of soil formation in quantitative terms, e.g. t ha - ~ yr- I. To simplify this task, we have defined the rate of soil formation in this report as the rate of formation of soil materials that have the same mean composition as the mean composition of the A, B and C horizons of soils in the area.
Since soil materials are the products of rock weathering, the rates of soil tbrmation are closely coupled with the rates of weathering. This study de- scribes a method of calculating the mean rate of soil formation on the earth, using a geochemical mass balance equation (Barth, 1961; Owens and Wat- son, 1979; Drever, 1988 ). Some examples of the application of this method to the calculation of rates of soil formation in watersheds of various geological materials are given.
THEORY
Hypothes&: On the surface of the earth, weathering processes drive a large scale geochemical cycling. Yoshioka (1987) and Drever (1988), adopting the thesis of Barth ( 1961 ), postulated the general weathering equations as:
primary rock + atmospheric input = altered rock + solution
This implies that the chemistry of surface waters can be related to weathering reactions of rocks (Drever, 1988 ).
The basic hypothesis used in the following calculations is that rocks are weathered to form soils and solutes in surface waters, i.e., the reaction of weathering on a global scale can be formulated as:
R + G = S + W (1)
where R denotes parent rocks of the earth's crust which are being subjected to weathering reactions, G denotes weathering agents such as water, carbon dioxide, and volcanic gases, S denotes soils, and W denotes solutes in surface water. Equation (1) and the postulation of Yoshioka (1987) and Drever ( 1988 ) are essentially the same, if we consider altered rock=S. This, the first assumption adopted in this report, is that the composition of the altered rock is similar to S, the mean composition of soil materials.
Calculation: We can calculate how many grams of rocks must be weathered in order to form the solutes contained in 1 litre of surface water. The mass balance equation of eq. ( 1 ) is:
( R ) + ( G ) = ( S ) + (W) (2)
where (W) is the amount of solute in grams per liter of surface water, (R) and (G) are the necessary amounts of parent rocks and atmospheric inputs

RATES OF WEATHERING AND SOIL FORMATION 253
in grams in order to produce the solutes in 1 liter of surface water. As a result, (S) grams of soil materials are formed.
For the elements which originate exclusively from rocks, we can neglect the contribution from the atmosphere. Further, the mass balance equations could be applied to the distribution of each element among the three components, i.e. R, S, and W. That is:
CiR {R} = Cis {S} + M~w ( 3 )
where {R} is the unit amount of rocks in grams that have to be weathered to release M,w milligrams of the ith element in 1 liter of surface water. {S} is the unit amount of soils formed in grams as the results of the weathering of rocks.CiR and Cis are the mean concentration of the ith element in mg g- l in rocks and soils, respectively. This is the second assumption adopted in this report. Although there are large differences in stabilities of minerals to weath- ering, and in geochemical mobilities of elements (Loughnan, 1968), the au- thors consider that eq. (3) can be applied to hypothetical mean rock, soil, and river water.
If we have at least two mean values of any two elements in rock and soil as well as those in river water, we can make two simultaneous equations which give {R} and {S}. Data on annual water discharge, D, in liters yr-~ and area of watershed, A, in hectares, give the annual rage of weathering, Tw, in g ha - yr - 1 and the annual rate of soil formation, Ts, in g ha - 1 yr - 1 as:
Tw = {R} × D/A (4)
Ts = {S} X D/A ( 5 )
RESULTS AND DISCUSSION
Basic equations on weathering and soil formation on the earth
Mean compositions of major elements in the earth's crust, soils and rivers (Bowen, 1979; Kawaguchi and Kyuma, 1977) are shown in Table 1. Major components of surface river water which are higher than 1 mg 1- ~, are O, Ca, C, C1, Si, Na, Mg, and S. Of these elements O, C, CI, and S are considered to originate from the atmosphere, volcanic gases, and from human activities. Since the mean compositions of these elements in the atmosphere and the amount of flux participating in weathering reactions are highly variable and uncertain, data for those elements cannot be used for the geochemical mass balance equation ( 3 ).
The seven major elements of rocks and soils in Table 1 are considered to originate exclusively from rocks. Therefore we can get the following seven

254 x. WAKATSUKI AND A. RASYIDIN
TABLE 1
Mean composition of major elements derived from igneous rocks in earth's crust, soils, and rivers
Element Earth's crust a Mean soil composition b Mean composition of river water ~
(mgg - l ) (mgg t) ( m g l - i )
A1 82 79 (93) c 0.3 Ca 41 13 15 (9.5) c Fe 41 41 (45) ' 0.5 K 21 15 (16) c 2.2 Mg 23 5.6 (12) c 4.0 Na 23 5.0 a (4.9) c 6.0 Si 277 330 (292)c 7.0
aFrom Bowen (1979). bMeans of Bowen ( 1979 ) and Kawaguchi and Kyuma ( 1977 ) except for Na. ~Values in parentheses are estimates of the authors using {R} and {S} in eq. (3).
mass balance equations using the mean compositions of A1, Ca, Fe, K, Mg, Na, and Si in the earth's crust, soils, and river waters:
AI: 82{R}=79{S} + 0.3 (6)
Ca: 41{R}=13{S} +15 (7)
Fe: 41{R}=41{S} + 0.5 (8)
K: 21{R}=15{S} + 2.2 (9)
Mg: 23{R}= 5.6{S}+ 4.0 (10)
Na: 23{R}= 5.0{S}+ 6.0 (11)
Si: 277{R}=330{S} + 7.0 (12)
Calculation results
A set of simultaneous equations for A1 (eq. 6), and Ca (eq. 7) gave {R} =0.54 and {S} =0.56. From the seven equations it is possible to make 21 sets of simultaneous equations. The results of all 21 sets of simultaneous equations are given in Table 2. Since rock weathering produces soils and sol- utes in river water, and concentrations in soils are expressed on a water-free basis, we can check the reliability of the values of calculation using the follow- ing criterion:
{R}>{S}>0 (13)
The answers that clear the above criterion are in rather narrow ranges: {R}=0.21-0.53 (mean=0.32) , and {S}=0.15-0.52 (mean=0.28) . A1-

RATES OF WEATHERING AND SOIL FORMATION
TABLE 2
Results of calculations of {R} and {S} and their reliability a
255
Combination of {R} {S} Reliability ~ simultaneous equation b (g) (g)
A1/Ca 0.54 0.56 × A1/Fe - 0 . 2 2 - 0 . 2 3 × A I / K 0.39 0.41 × A I / M g 0.23 0.24 × A I / N a 0.34 0.35 × AI/Si - 0.088 - 0.095 X C a / F e 0.53 0.52 o C a / K 0.57 0.66 × C a / M g - 0.46 - 2.60 × C a / N a 0.032 - 1.05 × Ca /S i 0.49 0.39 o F e / K 0.34 0.32 o F e / M g 0.23 0.21 o F e / N a 0.33 0.32 o Fe /S i - 0.056 - 0.068 × K / M g 0.21 0.15 o K / N a 0.33 0.31 o K / S i 0.22 0.17 o M g / N a 0.99 3.30 × Mg/S i 0.21 0.16 o N a / S i 0.31 0.24 o
Reliable range 0.21-0 .53 0 .15-0 .52 Mean 0.32 0.28
aCriterion of reliability is {R} > {S} > 0. bNumber of reliable combinations were: Fe = 4, K = 4, Si = 4, Mg = 3, Na = 3, Ca = 2, and AI = 0.
though of the 21 sets of results, only 10 sets passed the criterion, an additional five sets of combinations, i.e. AI/Ca, AI/K, A1/Mg, A1/Na, and Ca/K gave fairly similar values to those of successful combinations. Thus only 6 sets, i.e. A1/Fe, A1/Si, Ca/Mg, Ca/Na, Fe/Si, and Mg/Na, gave abnormal results. This suggests that the mean values of {R} and {S} are sufficiently reliable as the first approximation.
Conversely we can use {R} and {S} for checking the data of the mean com- position of rocks, soils, and river waters. There were considerable differences among the elements in numbers of reliable combinations, as shown in the footnote of Table 2. For example, Fe, K, and Si had four sets of combinations, whereas A1 had no successful sets. This connotes that the mean values of A1 in Table 1 contain some errors. Since A1, like Fe and Si, is highly immobile during weathering and soil formation, the mean concentration in soils should be higher than in rocks. Therefore, if we adopt the mean {R} and {S} as true values, we can calculate a more reasonable mean composition of soils using

256 T. WAKATSUKI AND A. RASYIDIN
the mean data of rocks and river waters with eq. (3). For example, a more reasonable estimation of mean A1 in soil = ( 82 × {R } - 0.3 ) /{S} = 92.6 mg g- 1. Similar calculations are possible for other elements. Results are shown in pa- rentheses in Table 1. According to the present authors' estimation of mean soil composition based on {R}, {S}, and eq. (3), the mean level of Mg in soils is double the estimates ofBowen ( 1979 ) and Kawaguchi and Kyuma ( 1977 ). Although Mg has a high geochemical mobility like Ca and Na, it shows a higher affinity for the secondary clay minerals than those of Ca and Na (Wakatsuki et al., 1978 ). Thus a somewhat higher mean concentration than 5.6 mg g - ' is reasonable, if the mean composit ion of earth's crust is correct. Since the cal- culation of mean Ca in soil gives a negative value, i.e. 41 X0.32 - 15 = - 1.88, the mean river concentrat ion seems to be too high. Thus using eq. (3) and rock and soil data we can estimate the mean river concentration of Ca to be Miw=41 X 0 . 3 2 - 13X0.28=9.48 mg 1-~.
It appears that the mean values in Table 1 are influenced too much from a huge number of data reported from temperate regions like Europe and North America. It will be necessary to include more data from tropical regions. On the other hand, since rocks originate from magma and the composition of magma is not influenced by climate the mean composit ion of rocks may be more reliable than those of soils and river waters.
The mean rate of soil formation on the Earth
The total volume of river water which is returned to the sea every year is est imated to be 3.7X 10¹⁶ litres (Bowen, 1979; Holland, 1978). Since the to- tal land area on the earth is 1.49X 101° ha, the annual rate of soil formation per ha can be calculated using eq. ( 5 ) as:
0.28X 3.7X 1016/1.49X 101°/103=695 kgha - l yr - j
The global estimation of annual suspended sediment yield is 1.35 X 10¹³ kg (World Resource Institute, 1988 ). If we divide this by the total land area, we can get the estimation of mean rate of soil erosion on the earth as:
1.35X 10¹³/1.49X 101°=906 kgha -1 yr -1
Soil systems should be in dynamic equilibrium with soil formation and ero- sion on a global scale if the total ecosystems on the earth are in a dynamic equilibrium, i.e. in sustainable steady state. Excess rates of soil formation may result in prolonged leaching and acidification of soil materials. Acid precipi- tation may accelerate the rate of soil formation. On the other hand, excess erosion promotes soil degradation and desertification as well as its adverse effects on the quality of surface waters.
The estimate of the rate of erosion is somewhat bigger than the mean rate of soil formation (695 kg ha-1 yr -1) on the earth. This may mean that soil
RATES OF WEATHERING AND SOIL FORMATION 2 5 7
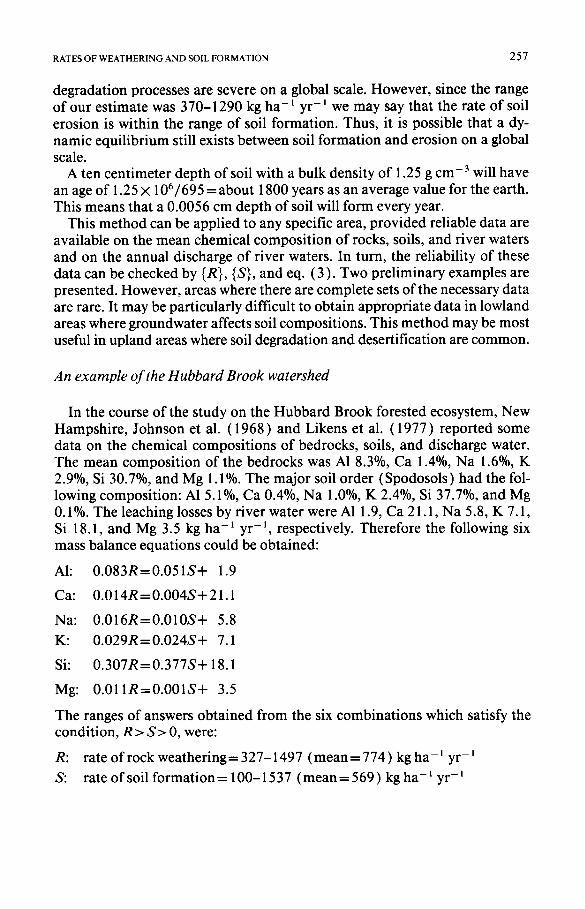
degradation processes are severe on a global scale. However, since the range of our estimate was 370-1290 kg h a - t yr-1 we may say that the rate of soil erosion is within the range of soil formation. Thus, it is possible that a dy- namic equilibrium still exists between soil formation and erosion on a global scale.
A ten centimeter depth of soil with a bulk density of 1.25 g c m - 3 will have an age of 1.25 × 10⁶/695 = about 1800 years as an average value for the earth. This means that a 0.0056 cm depth of soil will form every year.
This method can be applied to any specific area, provided reliable data are available on the mean chemical composit ion of rocks, soils, and river waters and on the annual discharge of river waters. In turn, the reliability of these data can be checked by {R}, {S}, and eq. (3). Two preliminary examples are presented. However, areas where there are complete sets of the necessary data are rare. It may be particularly difficult to obtain appropriate data in lowland areas where groundwater affects soil compositions. This method may be most useful in upland areas where soil degradation and desertification are common.
An example of the Hubbard Brook watershed
In the course of the study on the Hubbard Brook forested ecosystem, New Hampshire, Johnson et al. (1968 ) and Likens et al. (1977 ) reported some data on the chemical compositions of bedrocks, soils, and discharge water. The mean composit ion of the bedrocks was A1 8.3%, Ca 1.4%, Na 1.6%, K 2.9%, Si 30.7%, and Mg 1.1%. The major soil order (Spodosols) had the fol- lowing composition: A1 5.1%, Ca 0.4%, Na 1.0%, K 2.4%, Si 37.7%, and Mg 0.1%. The leaching losses by river water were A1 1.9, Ca 21.1, Na 5.8, K 7.1, Si 18.1, and Mg 3.5 kg ha-~ yr-~, respectively. Therefore the following six mass balance equations could be obtained:
AI: 0 .083R=0.051S+ 1.9
Ca: 0 .014R=0.004S+21.1
Na: 0 .016R=0.010S+ 5.8
K: 0 .029R=0.024S+ 7.1
Si: 0 .307R=0.377S+ 18.1
Mg: 0 .011R=0.001S+ 3.5
The ranges of answers obtained from the six combinations which satisfy the condition, R > S> 0, were:
R: rate of rock weathering= 327-1497 (mean = 774) kg ha - ~ yr -
S: rate of soil format ion= 100-1537 ( m e a n = 5 6 9 ) kg ha -~ yr -~

258 T. WAKATSUKI A N D A. RASY1DIN
Although the ranges are very wide, the means seem to be reliable compared to those of the earth. The number of successful sets of combinations was Si = 4, K = 3, Mg = Na = 2, Ca = 1, A1 = 0, the leaching loss of Ca seems to be too high compared to the levels of Ca in the bedrocks, whereas the concentration of A1 in soils seems too low.
Preliminary measurement in the Iu river watershed
Figure 1 shows the map of the watershed of the Iu river with its various sub-watersheds. Of these, two sub-watersheds were selected: one drains 127 ha of Miocene-Neogene basic pyroclastic materials and the other drains 180 ha of Paleogene granitic rocks (Miura and Matsui, 1974 ). Stream water sam- ples were collected at the lowest end of each watershed once a month during April to December 1988. After filtration of colloidal material, concentrations of Ca, Mg, Na, and K in river water were determined by atomic absorption and flame photometry. Fresh rocks were collected from valley bottoms of the main stream at the upper, the intermediate, and the lower sites in each sub- watershed, as shown by pluses in Fig. 1. Soil samples were collected by auger from 0-10 cm, 15-25 cm, and 40-50 cm depth at middle slopes near the sites of rock samplings. Total concentrations of the four elements in soils and rocks were also analyzed by atomic absorption and flame photometry after hydro- chloric acid digestion in a pressure decomposit ion apparatus (Uchida et al., 1979).
Annual water discharge rates of the two watershed were estimated at 92% of the total precipitation based on the monitoring data for the Yamasa dam (Tanaka, 1989), which is located at about 5 km southeast from the two sub- watersheds shown in Fig. 1. This gave a mean water discharge of 1.79 X 1071 h a - 1 y r - ~ during the years 1981-1985 which are used for the calculation.
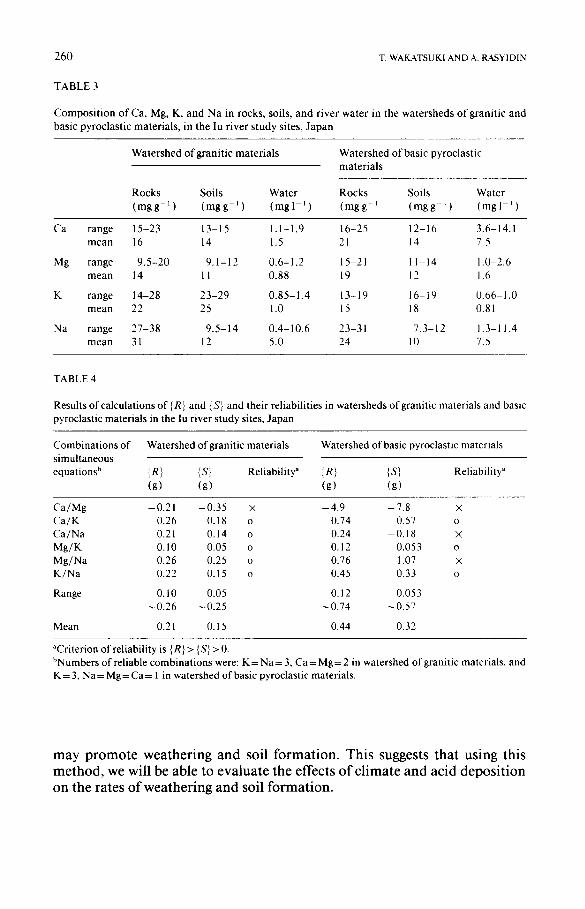
All the necessary data and results of calculations of {R} and {S} in both sub-watersheds are summarized in Tables 3 and 4. Numbers of successful combinations were K = Na = 3 and Ca = Mg = 2 in granitic area, whereas K = 3 and Na = Mg = Ca = 1 in the area of basic pyroclastic materials.
Annual rates of weathering were 3.8 t h a - 1 y r - 1 ( = 0.21 X 1.79 X 107/103) in the granitic watershed and 7.9 t h a - ~ y r - ~ ( = 0.44 × 1.79 X 107/103 ) in the watershed of basic pyroclastic materials. Annual rates of soil formation were 2.7 t h a - l y r - l in the granitic and 5.7 t ha-1 yr-~ in the basic pyroclastic watershed. Although the rates of weathering and soil formation are consider- ably higher than the mean rate reported for the earth, they seem to be good. These watersheds have about seven times higher annual discharge per hectare than the mean for the earth. In addit ion to the abundant precipitation, acid depositions were detected in these watersheds (Yamaguchi et al., 1991 ), which

R A T E S O F W E A T H E R I N G A N D S O I L F O R M A T I O N 259
S e a O f
r aP a ~ ~ . ~ ~ ~TSUE
BIROSItlMA '~A~
14(~E
AN
~TSUE OOH4~ Lake NAKA-UMI
i I
/ i
I
f
k
I
/
j// f / i
f ~
I _ / . . . . . .
Granite
¥- I I|
I I I
I
I ~ o
, ) /
/ gX
Ntershed Of ;ic P y r o c l a s t i / _ ~
Materials dam
N
! 2k~
Fig. 1. Map showing preliminary study sites: two sub-watersheds of granitic materials and basic pyroclastic materials in the Iu river watershed, southwestern Japan.
260 T. WAKATSUKI AND A. RASY1D1N
TABLE 3
Compos i t ion o f Ca, Mg, K, and Na in rocks, soils, and river water in the watersheds o f granitic and basic pyroclastic materials, in the Iu river s tudy sites, Japan
Watershed o f granitic mater ia ls Watershed o f basic pyroclastic mater ia ls
Rocks Soils Water Rocks Soils Water ( m g g -1) ( m g g -L) ( m g l - I ) ( m g g -I ( m g g t) ( m g l I)
Ca range 15-23 13-15 1.1-1.9 16-25 12-16 3.6-14.1 mean 16 14 1.5 21 14 7.5
Mg range 9 .5 -20 9 .1-12 0 .6-1 .2 15-21 11-14 1.0-2.6 mean 14 11 0.88 19 12 1.6
K range 14-28 23-29 0 .85-1 .4 13-19 16-19 0 .66-1 .0 mean 22 25 1.0 15 18 0.81
Na range 27-38 9 .5 -14 0 .4-10 .6 23-31 7 .3-12 1.3-11.4 mean 31 12 5.0 24 10 7.5
TABLE 4
Results of calculations of {R} and {S} and their reliabilities in watersheds of granitic materials and basic pyroclastic materials in the lu river study sites, Japan
Combinat ions of s imultaneous equations b
Watershed of granitic materials Watershed of basic pyroclastic materials
t f ~R t ~Rj ~S} Reliability a ~ ~ {S] Reliability a (g) (g) (g) (g)
Ca /Mg - 0 . 2 1 - 0 . 3 5 × - 4 . 9 - 7 . 8 C a / K 0.26 0.18 o 0.74 0.57 C a / N a 0.21 0.14 o 0.24 - 0 . 1 8 M g / K 0.10 0.05 o 0.12 0.053 Mg/Na 0.26 0.25 o 0.76 1.07 K / N a 0.22 0.15 o 0.45 0.33
Range 0.10 0.05 0.12 0.053 ~0 .26 ~0.25 ~0 .74 ~0.57
Mean 0.21 0.15 0.44 0.32
×
O
×
O
×
O
aCriterion of reliability is {R} > {S} > 0. bNumbers of reliable combinat ions were: K = Na = 3, Ca = M g = 2 in watershed of granitic materials, and K = 3, Na = Mg = Ca = 1 in watershed of basic pyroclastic materials.
may promote weathering and soil formation. This suggests that using this method, we will be able to evaluate the effects of climate and acid deposition on the rates of weathering and soil formation.

RATES OF WEATHERING AND SOIL FORMATION 261
Theoretical and practical problems and implications of th& method
The basic problem is the definition and the method of characterization of S in eqs. (2) and (3). Barth ( 1961 ) considered S to be mainly hydrolyzates that form the shales and schists. Owens and Watson (1979) and Yoshioka ( 1987 ) considered S to be weathering products. Since soils are major prod- ucts of weathering, we can consider S to be soil. Particularly this is true in mountainous river source areas. On a global scale, since shales and schists are the products of eroded soil materials, our assumption, S is soil, seems to be reasonable. Since there was no relation between the number of successful sets and the geochemical mobilities of the elements, the second assumption, i.e. differential weathering of minerals and differential geochemical mobilities of elements do not affect the calculation with eq. ( 3 ), was supported too.
A major limitation of this method of calculation is that each set of elements gives different rates of weathering and soil formation. It is not certain that for all cases of {S} being less than {R} the calculation is reliable. Although we used the mean values as the reasonable estimate, we have to find better math- ematical methods which give only one set of {R} and {S} values from eqs. ( 6 ) - ( 12 ). Perhaps multiple regression analysis will be useful.
The third problem is the method of evaluation of inputs from both wet and dry deposition (Creasey et al., 1986). Even for Ca, K, Mg, Na, and Si, which were considered to originate from rock exclusively in this article, there may be additional contributions in the forms of both wet and dry depositions. We have to subtract those contributions from leaching output. Fortunately, the contributions of dry and wet depositions to watersheds are being evaluated widely, because of public attention on acid precipitation. Those monitoring data can be useful in this calculation. In turn we can evaluate the effects of acid precipitation on the rate of soil formation and leaching in a given watershed.
The fourth problem is an evaluation of output in the form of suspended materials in water. The amount of suspended materials is an indicator of ero- sion. Although we considered only the amount of leaching output in the form of true solution in this article, colloidal and suspended forms may affect the rates of weathering and soil formation. Fortunately there are a~so many data on soil erosion. So, if we can accumulate the data on the rates of soil forma- tion as described here, we will be able to get information on the relationships between soil formation and erosion. Thus it will be possible for soil scientists to give guidelines on reasonable levels of soil erosion in comparison with the rate of soil formation. This will be important for the sustainable management of watersheds.
The fifth problem is related to sampling of soils. Even in a small watershed, there may be great heterogeneity. Therefore we have to develop a sampling strategy for a reasonable estimation of mean soil compositions in a given wa-

262 T. WAKATSUKI AND A. RASYIDIN
tershed. Auger soil samplings to the C horizons along the toposequences may be the practical sampling strategy.
The sixth problem is the effects of vegetation. Since young forests are ac- cumulating mineral elements, leaching output may decrease. On the other hand, rapidly growing vegetation may activate weathering and soil formation. The biological mineral cycles are superimposed on the dynamics of rock weathering, soil formation and soil erosion in a watershed. Weathering, soil formation and erosion are involved in large-scale geochemical mineral cycles, too. Since information is now accumulating on biological mineral cycling in many watersheds, we will be able to evaluate the relationships between geo- chemical and biochemical mineral cycles, using our method proposed here.
CONCLUSION
The method proposed in this article has some theoretical and practical problems which must be solved. Testing the proposed model in other regions of the world is necessary. Nevertheless, the method seems worthy of consid- eration as a standard procedure for the evaluation of the rate of weathering and soil formation. Such information is valuable in planning sustainable management of watershed.
ACKNOWLEDGEMENTS
The authors deeply thank Prof. K. Kyuma, Kyoto University, Japan for guidance and constructive criticism, and Mr. Y. Tsukamoto for analytical works.
REFERENCES
Barlh, F.W., 1961. Abundance of the elements, areal averages and geochemical cycles. Geo- chim. Cosmochim. Acta, 23: 1-8.
Bowen, H.J.M., 1979. Environmental Chemistry of the Elements. Academic Press, London, 333 PP.
Buol, S.W., Hole, F.D. and MacCracken, R.J., 1989. Soil Genesis and Classification. lowa State Univ. Press, Ames, 446 pp.
Creasey, J., Edwards, A.C., Reid, J.M., Macleod, D.A. and Cresser, M.S., 1986. The use of catchment studies for assessing chemical weathering rates in two contrasting upland areas in northeast Scotland. In: S.M. Colman and D.P. Dethier (Editors), Rates of Chemical Weath- ering of Rocks and Minerals. Academic Press, Orlando, pp. 467-502.
Drever, J.I., 1988. The Geochemistry of Natural Waters. Prentice Hall, Englewood Cliffs, N J, 437 pp.
Holland, H.D., 1978. Taiki Kasen Kaiyo No Kagaku [The Chemistry of the Atmosphere and Oceans ]. Sangyo Tosho Press, Tokyo, 318 pp. (Japanese translation).
Johnson, N.M., Likens, G.E., Bormann, F.H. and Pierce, R.S., 1968. Rate of chemical weath- ering of silicate minerals in New Hampshire. Geochim. Cosmochim. Acta, 32:531-545.

RATES OF WEATHERING AND SOIL FORMATION 263
Kawaguchi, K. and Kyuma, K., 1977. Paddy soils in Tropical Asia, Their Materials, Nature and Fertility, The Univ. Press Hawaii, Honolulu, 258 pp.
Likens, G.E., Bormann, F.H., Pierce, R.S., Eaton, J.S. and Johnson, N.M., 1977. Biogeochem- istry of a Forested Ecosystem, Springer, New York, 146 pp.
Loughnan, F.C., 1968. Chemical Weathering of the Silicate Minerals, Elsevier, Amsterdam, 154 PP.
Miura, K. and Matsui, S., 1974. Matsue 1:50,000 Hyousou Chisitu Zu. Geological Map of Mat- sue, 1:50,000. Shimane Prefecture, 59 pp. (in Japanese).
Owens, L.B. and Watson, J.P., 1979. Rate of weathering and soil formation on granite in Rho- desia, Soil Sci. Soc. Am. J., 43" 160-166.
Tanaka, R. and Fukushima, A., 1989. Hiigawa Shyusuiiki No Ryushutsuryou. [Duration of discharge in Hii river Basin]. San-In Chiiki Kenkyuu, Shimane Univ., 5:113-126 (in Japanese).
Uchida, H., 1979. Determination of major and minor elements in silicates by inductively cou- pled plasma emission spectrometry. Anal. Chim. Acta, 108: 87-92.
Yamaguchi, K., Tanaka, F., Tatano, T., Nakao, M., Gomyoda, M. and Hara, H., 1991. Sanin Chiku Niokeru Sanseiu Genshou No Jittai To Suii. [Present status and Transition of Acid Precipitation in San-In Area ]. Kougai To Taisaku, 27:160-166 (in Japanese).
Yoshioka, R., 1987. Geochemical study of weathering through chemical composition in natural waters. J. Earth Sci., 35" 417-444.
Wakatsuki, T., Katayama, Y., Ishida, N. and Matsuo, Y., 1978. Chuuseki Oyobi Kouseki Dojou No Fuuka Katei Ni Okeru Shogenso No Kyodou. Dai 2 Hou, Genso No Soutaiteki resistate Sei, hydrolyzate Sei, Oyobi Oxidate Sei. [Behaviors of mineral elements during weathering of alluvial and diluvial soil materials. (2) Relative resistate, hydrolyzate and oxidate nature of elements]. Nihon Dojou Hiryou Gaku Zasshi, 49:39-45 (in Japanese).
World Resource Institute, 1988. World Resources 1988-1989, 383 pp.