rates of return on flow-through shares: … · rates of return on flow-through shares: investors...
TRANSCRIPT

www.policyschool.ca
Volume 9 • Issue 4 • February 2016
RATES OF RETURN ON FLOW-THROUGH SHARES: INVESTORS AND GOVERNMENTS BEWAREVijay Jog†
SUMMARYCanada’s tax code allows the use of flow-through shares for mining and oil and gas companies on the assumption that they are a good way to spur new productive exploration and are also beneficial to investors. In reality, it appears that flow-through shares are lousy for both.
Flow-through shares are designed for corporations that cannot make good use of expense deductions from their taxes and so, through the use of these special type of shares, can pass along their expenses for shareholders to deduct from their own income taxes. This tax break is not insignificant: The amount of revenue foregone by the federal government due to flow-through shares and the related Mineral Exploration Tax Credit averaged $440 million every year between 2007 and 2012.
But the steepest price has arguably been borne by investors, with returns on flow-through shares performing extraordinarily poorly. For small companies that issued these shares, the annualized absolute return was a nearly 100 per cent loss. For larger companies, the returns were not as bad — negative 14 per cent — but still a loss. And if adjusted for corresponding benchmarks, the returns were even worse. From the $2.5 billion raised from Canadians using flow-through shares, investors have lost $1.2 billion.
Certainly these results would indicate that flow-through shares are hardly helping Canadian explorers strike lucrative new discoveries (it is impossible to say whether the limited success some larger companies had in locating productive assets, using flow-through shares, would not have occurred anyway). Meanwhile, these share issues, bearing the imprimatur of a special government right and the incentive of an investor tax benefit, have likely led to market distortions, luring capital that might have otherwise gone to more productive and rewarding investments. Compounding matters is the very real possibility that those projects that were funded by flow-through shares, but would have been better not begun at all, added competition for inputs and labour, increasing their prices — and lowering returns — for other mining and oil and gas projects with better prospects.
In sum, the legacy of flow-through shares is effectively a list of everything that would indicate the policy’s failure. They have hurt investors. They have hurt economic efficiency. They have distorted market competition. And all at a cost to the federal government of nearly half-a-billion dollars a year. Furthermore, the incentives created by flow-through shares can only run counter to any desires among federal and provincial governments to diversify their economies and reduce dependency on mineral and fossil fuel resources. And even where it remains a goal to increase investment in such resources — or any other government-favoured sector, for that matter — it is clear that flow-through shares or tax incentives similar to this policy mechanism are an extremely poor way to achieve it.
† I gratefully acknowledge the support of many people. These include: David Whitehead for data collection, Mimi Lam for data validation and analysis, Lisa Jog for editing, Jack Mintz and Bev Dahlby for their usual insightful comments, and two anonymous reviewers for their comments and suggestions. I bear the sole responsibility for any errors and conclusions.

1
INTRODUCTION
Flow-through shares (FTS) are a special type of common share issued by oil and gas or mineral exploration companies that allow the corporation to renounce, or “flow through” certain expenses that it has incurred to investors. Those investors are then permitted to deduct the amount against their own taxes instead of the corporation deducting the expenses from its taxes. In this paper, I focus on rates of return earned by investors in FTS issued during the 2008–12 period and premiums received by companies issuing these FTS. Our analysis is based on a large sample of issues representing a total financing of $4 billion, with FTS representing $2.5 billion and simultaneously issued non- FTS representing the remaining $1.5 billion.
The paper calculates the risk-adjusted rates of returns received by an individual investor in these securities on both a before- and after-tax basis, as well as the premiums accorded to FTS over non-FTS at the time of issuance. While justification for FTS is that they promote activity in the oil and gas and mining exploration and development sectors, it is unclear whether investors received a reasonable rate of return.1 FTS are one of the main tax-based mechanisms used by the federal government in this sector, and the rates of return on FTS provide a measure of the effectiveness of this tax incentive, which is estimated to cost the federal government $300 million in foregone tax revenues.2 Our overall conclusion is that FTS seem to do more harm than good and that the time has come to reconsider the wisdom of providing tax incentives such as FTS for investments in particular sectors of the economy.
The paper is organized as follows. The first section briefly describes the three main parties involved in FTS: the firm that issues FTS, the individual investor who buys the FTS, and the government that has provided an impetus for these securities due to specific tax treatments awarded to them. The second section provides a brief overview of existing research in this area. Other tax-incentive mechanisms that attempt to assist industrial sectors, such as Quebec Stock Savings Plans (QSSP) and Labour Sponsored Venture Capital Corporations (LSVCC), are also reviewed. This is important as it allows for a rethinking public policy associated with these tax-based incentives similar to FTS, which are targeted towards individual investors. The third section describes the methodology used to calculate investor returns and the data used for empirical analysis. This is followed by results, observations, and conclusions.
1 Naturally, a key issue is whether instruments such as FTS generate incremental activity. Using data from 1987–2005 for gold exploration, Khindanova attributes the increase in exploration activity by junior companies in the 1983–87 period to the introduction of flow-through shares (FTS) and the mining exploration depletion allowance (MEDA). Irina Khindanova, “Impacts of Tax Incentive Programs on Mineral Exploration Expenditures in Canada: An Empirical Analysis,” Journal of Management Policy and Practice 13, 5 (2012): 81-87. In an evaluation paper published by the Government of Canada, it was claimed that FTS resulted in significant incremental spending on mining and petroleum activities and significant incremental exploration drilling activities by junior mining companies from 1983–1991. However, it also states that the incremental exploration activity (as opposed to spending) was not very high, inflated exploration drilling costs were experienced, and there was little evidence that the incremental exploration activity resulted in incremental discoveries attributable to the FTS financing mechanism. Canada. Department of Finance Canada, “Flow-Through Shares: An Evaluation Report” (Ottawa: October 1994), xvi.
2 Canada, Tax Expenditures and Evaluation (Government of Canada, 2013). The personal tax expenditures associated with FTS were estimated to be $300 million in 2013.

2
THE FTS RATIONALE AND MECHANICS3
In the mining exploration and development business it is quite common to have many years of low or no payouts and startup losses (especially for small mining companies) and thus to have no net income for tax purposes. Such mining companies may find themselves with deductions for tax purposes that they will not be in a position to use for many years (if ever) because they are not generating enough taxable income. Companies in such circumstances may also need to raise additional financing in order to fund ongoing operations. Flow-through shares can provide mining companies with access to financing in this situation.4
The basic principle behind FTS is that a corporation willing to forego the tax benefit of certain Canadian exploration expenses (CEE), Canadian development expenses (CDE), or any other allowable expenses that it incurs, can renounce or “flow through” these expenditures to investors by issuing shares in the corporation with flow-through privilege. Investors purchasing the FTS are permitted to deduct the amount that the corporation has incurred and renounced to them.5 In essence, these expenses are treated as if the investors had incurred the CEE or CDE, instead of the corporation. From an overall policy perspective, this mechanism improves loss refundability in the tax system and puts startups and established firms on an even playing field.
In theory, the firm issuing FTS benefits because it can issue FTS to investors for a higher price than they would otherwise be willing to pay, due to the tax benefit associated with being able to deduct the CEE or CDE. This in turn lowers the firm’s cost of capital. The shareholders benefit by being able to reduce their income for tax purposes (and pay less income tax in the year of FTS acquisition) by virtue of claiming deductions for the renounced CEE and CDE. While the corporation loses the ability to deduct the CEE or CDE renounced to the FTS investors, the net present value of those deductions may be quite small if the corporation is unlikely to have enough taxable income to utilize these deductions in the near future. In this way, FTS represent one of very few ways in which an investor in a taxable position is permitted to monetize or sell the benefit of tax deductions not being utilized by a corporation.
Although FTS are available to all mining and petroleum companies, the mechanism is intended to be of principal benefit to non-taxpaying junior exploration companies—that is, companies that cannot immediately use income tax deductions for exploration and development and whose access to traditional sources of debt or equity financing is limited. Investors can purchase FTS either directly from mining and petroleum companies or
3 This section and the paper as a whole have benefited considerably from an earlier paper and work on this topic: Vijay M. Jog, G. Lenjosek and K. McKenzie, “Economics of Flow-through Shares,” Canadian Tax Journal 44, 4 (1996): 1016-1051; and Department of Finance Canada, “Flow-Through Shares.” We do not discuss specific details of the mechanics, as these are not central to this paper. These include, for example, rules related to the timing of the renouncement period, look-back rules and maximum renunciation limits. These are available in many places including http://www.cra-arc.gc.ca/tx/bsnss/tpcs/fts-paa/menu-eng.html.
4 For more details, please see http://mininigtaxcanada.com/flow-through-shares/.5 A common misconception is that flow-through shares are a special class of equity. According to the Income Tax Act, they
have to be ordinary common shares. The process of transferring the exploration expense to the investor is done by an agreement that is separate from the documentation that creates the shares.
3
indirectly through limited partnerships that have acquired FTS from these companies. The latter approach is currently the most common.6, 7
By allowing FTS financing, the government provides significant support for the exploration and development of natural resources. For some specific expenses, this support is complemented by additional incentives to flow-through-share investors that are provided by certain provincial governments.8 Thus, from a tax policy perspective, FTS can be considered as tax expenditure incurred by the government to provide a tax benefit to a specific industry or sector to reduce its marginal effective tax rate.9 During the 2007 to 2012 period, federal tax expenditures associated with public and private issuances of flow-through shares, in addition to the Mineral Exploration Tax Credit (an incentive for investment in certain mining flow-through shares), averaged $440 million per year. The federal government lost these tax revenues in the form of tax benefits to investors.
The public-policy rationale for the continued existence of the FTS financing mechanism is to increase exploration activity and employment in that sector. The purpose of this paper is to investigate the return on FTS from the perspectives of issuing companies and investors. To be more specific, the article has three main objectives. The first is to demonstrate the rationale for the FTS premium, which can be considered as the sharing of tax benefits between issuing companies and investors, and to provide empirical observations. This premium also allows us to analyze whether FTS deliver the value of income tax deductions to issuing companies or whether this tax benefit is completely captured by investors. The second objective is to investigate the investment performance of FTS—that is, their cost-
6 Limited-partnership intermediaries generally operate in the following manner: First, investors are solicited through a public offering of partnership units and contribute a lump-sum capital payment to subscribe as limited partners. Second, the general partner, who is responsible for managing the daily affairs of the limited partnership, enters into FTS purchase agreements, typically through private placements, with individual mining or petroleum companies. Third, the resource companies incur exploration and development expenses. Fourth, the resource companies renounce their eligible expenses to the limited partnership and issue FTS to the partnership. Fifth, the limited partnership attributes (or flows through) the renounced expenses to the limited partners, who can then use the income tax deductions related to the expenses in computing their taxable income. Sixth, after a predetermined holding period during which all FTS agreements are to be completed and all expenses renounced to the limited partners (typically with a holding period of 12 months), the assets of the limited partnership (principally the FTS) are transferred to a mutual fund and the partnership is dissolved. At this “conversion date,” each limited partner receives a pro rata number of shares in the mutual fund, which is listed on a Canadian stock exchange. As per the terms of the original partnership agreement, the mutual fund may be either open-ended or closed-ended. An open-end mutual fund does not have a set capitalization, and the management company will issue or redeem shares upon request. A closed-end mutual fund issues a fixed number of shares, which are traded on a stock exchange and are not generally redeemed by the management company itself.
7 For example, a recent offering of such a limited partnership (LP) was by Marquest Asset Management Inc. through a fund called Marquest Mining 2015-I, which planned to raise $250 million to invest in turn in FTS issued by TSX-, TSX-V- and CNSX-listed companies. The fund’s management fees were one per cent of the net asset value (NAV) of the partnership plus a performance bonus of 20 per cent paid after investors had recouped their entire pre-tax investment. On the Marquest website, there is no data about the performance of the earlier such partnerships and the section on performance has not, as of August 9, 2015, been updated since Sept. 30, 2014: http://marquest.ca/funds&group=OM%2520Flow-Through%2520LPs#performance.
8 For example, according to tax rates analyzed by the Prospectors and Developers Association of Canada for 2011, the after-tax cost of a $1,000 investment under the “super flow-through” program varied between a low of $284 in Quebec to a high of $519 in Alberta. “Super flow-through” includes the regular 100 per cent deduction that’s available under the Income Tax Act, along with a federal program that provides another 15 per cent non-refundable tax credit for grassroots exploration completed by Canadian companies.
9 Canada, Tax Expenditures, Table 2, provides a listing of many general and sector-specific corporate tax expenditure items; these measures result in corporate tax revenue forgone due to these corporate tax expenditures that is estimated to be well in excess of $20 billion. For METR calculation methodology and related papers, please see Jog, Lenjosek and McKenzie, “Economics of,” 1016-1051.

4
effectiveness from the perspective of investors—by examining the rates of return earned on FTS purchased by investors between 2008 and 2012. The third objective is to evaluate the implications of these results from a public-policy perspective.
PREVIOUS RESEARCH
Published research on FTS falls into three broad categories. The first category consists of articles in the financial press (including resource-sector publications)10 that are mainly descriptive and topical. The second consists of articles published by investment intermediaries that document the tax implications for FTS investors. The third consists of papers that consider the pricing of FTS, evaluate the capital-market implications of FTS financing, and enhance understanding of the financial and economic issues associated with FTS. In addition, I also review related research on similar tax-incentive mechanisms, such as the Quebec Stock Savings Plan and Labour Sponsored Venture Capital Corporations, which provides additional and broader insights into such mechanisms in the context of economic efficiency, adverse selection and crowding out of good projects. This research has direct bearing to the analysis and conclusions of this paper.
It is the third category that is of particular relevance to this article. The research papers in this category model the pricing of FTS relative to the pricing of common shares and take account of the income tax positions of the issuing company and the investors. As noted in Jog, Lenjosek and McKenzie, some researchers have developed theoretical pricing equations and consider the relative effectiveness of FTS as a mechanism for delivering the value of income tax deductions to issuing firms.11 Except for Jenkins, however, none of the earlier papers provide empirical evidence.12 Nor do any of them acknowledge that the sharing of premiums between the investors and the issuing company occurs in well-functioning capital markets, and that this sharing has important implications for assessing effectiveness. There are two studies that provide empirical evidence on the rates of return accorded to investors from their FTS investments and those results are compared with the results of this paper in subsequent sections.13
As noted above, FTS are not the only mechanism whereby government policy has incentivized investors to invest in specific types of securities by providing a tax incentive. Two notable such instruments are the Quebec Stock Savings Plan and Labour Sponsored Venture Capital Corporations, which are briefly reviewed below to provide additional context.
10 See, for example, Mining Tax Canada website, “Flow-Through Shares,” http://mininigtaxcanada.com/flow-through-shares/; and Drew Hasselback, “Flow-through shares: Canada’s quirky tax innovation,” Financial Post, March 7, 2013, http://business.financialpost.com/2013/03/07/flow-through-shares-canadas-quirky-tax-innovation.
11 Jog, Lenjosek and McKenzie, “Economics of.”12 Glenn P. Jenkins, “Cost-Effectiveness of After-Tax Financing: Flow-Through Shares in Canada,” Discussion Paper no. 327
(Ottawa: Economic Council of Canada, June 1987). The challenges with his methodology and its empirical implications are described in Jog, Lenjosek and McKenzie, “Economics of.”
13 These are Jog, Lenjosek and McKenzie, “Economics of,” and Department of Finance Canada, “Flow-Through.”

5
The Quebec Stock Savings Plan (QSSP) was first introduced by the Quebec government in 1979 and was structured to allow individuals who acquire shares newly issued by an eligible company to deduct a percentage (varying from 50 to 100 per cent, depending on the type of firm) of the acquisition cost in the calculation of their taxable income in Quebec. The deduction was 100 per cent for shares issued by a growth corporation, compared with 50 per cent for eligible convertible shares of such companies. The original intent of the QSSP program was threefold: to reduce the tax burden on individual taxpayers with high incomes; to stimulate the demand for shares; and to facilitate the growth of permanent business capital. Clearly, the argument behind the plan was that, by providing incentives to high-marginal-tax investors, access to equity capital to eligible firms would increase and their cost of capital would be lowered. Carpentier and Suret provide an analysis and review of investor returns of this plan.14 They also refer to earlier evidence on QSSP and note that the operational performance of small companies that were listed on the stock market under the QSSP was very poor and that the companies’ success rates were dismal. In late 1994, only 20 per cent of issues of small companies arising from the QSSP could be considered successes and the rate of bankruptcy or repurchase at a very low price was approximately 32 per cent. Moreover, neither investors nor brokers were able to correctly evaluate the shares of small companies that floated issues under the QSSP. Carpentier and Suret refer to an earlier paper by Suret and Cormier, who evaluated the opportunity loss of investors—that is, the gap between the cumulative value of investment in QSSP shares and the value they would have accumulated by the same date in an index investment.15 According to that study, this loss amounted to $745.79 million as of Dec. 31, 1994, if the tax deduction is not considered, for a gross investment of $1,252.03 million. Even when the tax deduction is accounted for, the opportunity loss was still $217.66 million. Carpentier and Suret directly measure the annual average stock-market returns of the four QSSP funds from their inception until May 31, 2005, and compare it to that of the Nesbitt Burns small-capitalization index.16 Their analysis indicates that all four funds report a negative relative return ranging from -3.98 to -21.48 per cent, averaging -9.58 per cent. They conclude that the QSSP program did not foster optimal allocation of funds in the economy and that tax expenditures associated with the program are indeed extremely costly.
In a similar vein, Cumming and MacIntosh focus on another Canadian tax-driven venture capital vehicle known as a Labour Sponsored Venture Capital Corporation (LSVCC).17 Their analysis reaches similar conclusions: LSVCCs demonstrate higher agency costs and lower profitability than do private venture capital funds. More interestingly, they also show that the tax advantages conferred on LSVCCs have resulted in LSVCCs “crowding out,” or displacing other types of venture capital funds. They state that the generous tax subsidies underlying the LSVCC programs lower the LSVCCs’ required rate of return, allowing LSVCCs to outbid other types of funds (even those with tax-exempt investors), drive up
14 C. Carpentier and J.M. Suret, “The Quebec Stock Saving Plan: A Tax Expenditure Analysis,” Canadian Tax Journal 54, 1 (March 2006): 142-166.
15 Jean-Marc Suret and Élise Cormier, “Le Régime d’épargne-actions du Québec: vue d’ensemble et évaluation,” in Paul J.N. Halpern, ed., Le financement de la croissance au Canada (Calgary: University of Calgary Press, 1997).
16 Carpentier and Suret, “The Quebec.”17 D. J. Cumming, J. G. MacIntosh, “Crowding out private equity: Canadian evidence,” Journal of Business Venturing 21
(2006): 569-609; D. J. Cumming and J. G. MacIntosh, “Canadian labour sponsored venture capital corporations: bane or boon?” in Venture Capital, Entrepreneurship and Growth, ed. A. Ginsberg and I. Hasan (London: Elsevier Science Academic Press, 2003): 169-200.

6
deal prices and lower returns in the market. If institutional investors are risk averse and commit capital prior to knowing the increase in LSVCC fundraising in any given year, then institutional investors overestimate the extent of LSVCC funding, and reduce their commitments to private venture capital funds. As a result, government sponsorship through the particular tax breaks exclusive to LSVCCs may paradoxically decrease the overall supply of venture funds. They show evidence not merely that LSVCCs have crowded out other Canadian funds, but that they have led to a reduction in the overall size of the venture capital pool. This is a very interesting result and may even prove similar for programs such as FTS and QSSP. They acknowledge that, although their focus is on a unique institutional setting, they nonetheless believe that their results have general implications for the efficacy of focused government subsidization of venture capital. Tax breaks to particular types of venture capital funds may exacerbate, not mitigate, capital gaps.
The rate of return on LSVCCs in Cumming and MacIntosh’s sample (during the 1992–99 period) was 28 per cent, compared to 160 per cent for the TSE 300 index, 180 per cent for the Globe Canadian Small Cap Peer Index, and 650 per cent for the U.S. Venture Capital Index. They go on to say that the Canadian experience with LSVCCs is highly suggestive that similar structures should not be adopted in other countries. They also state that “while no systematic evidence exists, anecdotal evidence suggests that many of the LSVCC fund managers have little or no background in venture capital investing” and that “ownership is highly atomized, resulting in free rider and collective action problems that greatly impair the incentive of the owners to monitor the managers.” These are troubling comments from a policy perspective. The first comment suggests that a tax-driven program may bring inexperienced intermediaries into the marketplace who may actually crowd out established intermediaries and further damage the overall reputation of well-established intermediaries. The second comment indicates that there is a potential that these new intermediaries may attract inexperienced investors who are in no position to establish a proper governance mechanism on the issuing firms.18
Overall, these papers indicate that tax-based incentives accorded to individual investors may do more harm than good. The evidence also indicates that, in addition to wealth losses experienced by these individuals, these mechanisms do not promote economic efficiency, do not achieve their intended policy objectives, crowd out other potentially better investments, and bring inexperienced intermediaries and investors into the capital markets in the short term who may prove damaging in the long run. I now turn my attention to providing evidence on the efficacy and efficiency of FTS.
18 It should be noted that LSVCC tax credits in Ontario were phased out in 2012 and federal LSVCC tax credits will be eliminated starting in 2017.

7
PREMIUMS AND SHARING
An assessment of the effectiveness or cost-effectiveness of FTS depends on the share premium received for them by the issuing firm.19 Following Jog, Lenjosek and McKenzie,20 this section establishes the relationship between the special income-tax features of FTS and the maximum (theoretical) premium—that is, the largest premium that the issuing firm could obtain by selling FTS on capital markets compared to a simultaneous issue of common shares that have no special tax incentive. This premium is valued by investors and depends on the income tax rates, the capital gains inclusion rate, and the write-off rates and timing for renounced expenses.
To derive the algebraic relationships that express the essence of a flow-through share, certain simplifying assumptions are required:21
• Income tax deductions are used each year to the extent allowed by the legislation.• No capital gains exemption is available. If available, this would enhance returns. The
exemption is limited, so it may not be important at the margin anyway.• Various specific forms of government assistance and the bonus deductions that may
periodically affect the FTS premium are ignored.• The “quality” of a flow-through share and the underlying common share of the issuing
firm are taken as equivalent; it is assumed that these alternative instruments generate identical rates of return when they are held for the same length of time.
• The purchase and sale of shares occurs instantaneously; this assumption eliminates the need to specify a “time” parameter for the rate of return on FTS or common shares.
• Capital markets function perfectly—distortions are introduced later in the discussion.Given these assumptions and the standard “no-arbitrage” condition, the after-tax cost of a common share, ATCCS, equals the market price of the common share, PC, plus the expected capital gains tax payable by the investor when the share is sold, CGTCS. This after-tax cost can be expressed as
ATCCS = PC + CGTCS = PC + [E(PC) - PC] iC tH (1)
where
E(PC) is the expected selling price of the common share,
19 The premium is the difference between the price of a flow-through share and a common share that is issued simultaneously with the FTS. As seen from the data, there are many cases where a firm issues only FTS. In that case, like any other seasoned equity offering, FTS are issued at a discount to existing common shares. In our discussion and development of a premium, we are only considering the joint issues—those issues where both FTS and non-FTS were issued simultaneously.
20 Jog, Lenjosek and McKenzie, “Economics of.”21 Appendix V of Department of Finance Canada, “Flow-Through Shares,” provides a more comprehensive treatment that
explicitly includes grants, bonus deductions, and differing rates of return on common shares and FTS. Appendix III describes past and present government incentives related to FTS financing. Chapter V of the document contains the formula for calculating the maximum premium when a capital gains exemption is available.

8
iC is the capital gains inclusion rate, and
tH is the (typically top) investor income tax rate.
The after-tax cost of an FTS, ATCFTS, is the market price of the share, PF, minus the income tax savings associated with renounced expenses, ITS, plus the expected capital gains tax payable when the share is sold, CGTFTS. It can be represented as
ATCFTS = PF − ITS + CGTFTS = PF − PFztH + E(PC)iCtH, (2)
where z is a weighted average of the present values of the rates of deductibility for the renounced expenses and other grants, and bonus deductions—renunciations expense would typically have a z-value of unity. The expected capital gains tax in Equation (2) reflects the impact of the zero-adjusted cost base for FTS and the equivalence of the expected selling prices of common shares and FTS.
Equating equations 1 and 2 yields the ratio of the market price of FTS to the market price of common shares, which reflects the maximum FTS premium:
PF/PC = (1 − iCtH)/(1 − ztH). (3)
A necessary condition for FTS to sell at a premium is that z exceeds ic. Since in most cases, ic is 0.5 and z is close to or is one, PF will exceed PC. From Equation 3, the maximum premium, PMAX, can be defined as a percentage of the price of a common share:
PMAX = PF/PC - 1 = (z - iC)tH/(1 - ztH). (4)
Equations 3 and 4 show that the maximum premium depends entirely on income tax parameters—the income tax rate for the FTS investor, the capital gains inclusion rate, and the weighted-average present-value rate of deductibility for renounced expenses. Furthermore, only “current prices” are relevant;22 the expected future price of the common share is not a factor. Comparative static analysis shows that the maximum premium increases with: (1) increases in the rate at which expenditures can be deducted; (2) decreases in the capital gains inclusion rate; and, (3) if z > iC, increases in the income tax rate.
If the market price of a FTS equalled the price of a common share multiplied by one plus PMAX, then the investor would be indifferent between purchasing a FTS and a common share of the issuing company. In other words, the tax benefits of the FTS, as valued by investors, would accrue entirely to the issuing firm through the premium.
Even in a well-functioning capital market, however, the observed price of FTS will invariably reflect a premium—the observed premium—that is less than the maximum premium. And in paying a premium that is less than the maximum, investors effectively share in the tax benefits of the FTS with the issuing firm. This outcome parallels the
22 “Current” means at the time the sale of a new issue of FTS is announced publicly. This criterion ensures that the pricing of common shares and the pricing of FTS reflect the same information set and differ only because common shares and FTS have different tax features. As will be seen in the data section, more often than not, FTS are issued simultaneously with common shares.

9
situation in which two parties settle, through direct bargaining (purchasing a house) or by auction (eBay), on an equilibrium price that is mutually satisfactory.
One could think of five reasons why observed premiums differ from maximum premiums:23
1) Tax-induced investor surplus. If issuing firms fail to attract investors in the highest marginal tax bracket, then the observed premium will be less than the maximum premium.24
2) Incremental liquidity risk. FTS agreements usually are associated with a minimum holding period and an investor who has committed funds to FTS normally cannot sell the shares until this holding period has expired.25 This situation imposes a “liquidity risk” on FTS investors that may result in an observed premium that is less than the maximum premium.
3) Incremental transaction costs. Issuing FTS involves transaction costs—legal, accounting, underwriting, filing, and brokerage fees and, if the shares are sold to a limited partnership, management and operating fees as well. These costs are typically much larger than those of a standard non-FTS secondary offering of common shares. To the extent that these costs exceed those associated with financing the exploration through the issuance of common shares, the cost-effectiveness of FTS will be reduced. This factor may also explain why firms do not receive the full value of the tax benefits as valued by investors.
4) Common share valuation. The formula for calculating the maximum FTS premium assumes that the correct price to use for the issuing firm’s common shares is the price on the stock exchanges when the FTS issue is announced. Although this assumption is a standard one, a given firm may in fact not be able to issue the desired quantity of common shares at the established market price, especially if it is a junior firm with a relatively short history. If so, then ideally one would estimate the premium to account for the lower price that would be obtainable on the sale of the underlying common shares. This price cannot be observed, however, and so what might be regarded as a low premium, given the market price, may actually be regarded by the firm as a high
23 Of course, the same reasons would apply equally to any market-based mechanism that was designed to help firms finance new expenditures by issuing equity instruments that allowed taxpayers to realize the value of associated tax deductions. For a more comprehensive discussion of the subject, see Department of Finance Canada, “Flow-Through Shares”; K.J. McKenzie, “The Effectiveness of Flow Through Shares,” (paper prepared for the Department of Finance Canada, March 1994); and Kenneth J. McKenzie, “Refundability and the Incentive Effects of Flow through Shares,” Canadian Tax Journal 42, 4 (1994): 1100-1114.
24 Evidence compiled by the Department of Finance in 1996 and in the latest 2013 study shows that not all investors in FTS are high-tax-bracket investors.
25 In addition, the “at-risk rules” of the Income Tax Act, RSC 1985, c. 1 (5th Supp.), as amended, effectively prevent investors from selling their rights to the shares by prohibiting investors from claiming amounts renounced when they do not have money at risk.
10
premium. However, there are many instances where a firm issues FTS and common shares at the same time; in these cases, it is easy to calculate the premiums accorded to FTS.26
5) Investor behaviour. Individual investors weigh the trade-off between the benefits of immediate tax deductions and the investment risk.
The estimates of the maximum premiums would depend on the tax rates faced by a “typical” FTS investor. Assuming that an “average” individual flow-through-share investor residing in Ontario, subject to a combined federal-provincial marginal income tax rate of 42 per cent (i.e., the marginal income tax rate on ordinary income), is able to fully use the deductions and dispose of the flow-through shares in the same tax year that they are purchased, and that renounced expenses are Canadian exploration expenses (equal to the price of the flow-through share and deductible at a rate of 100 per cent in the year expenditures are renounced), i.e., z = 1, one can estimate the maximum theoretical premium.
The Department of Finance’s Tax Expenditure and Evaluations report27 presents two scenarios, depending on whether or not the investor is eligible for investment tax credits. In each scenario, the maximum premium is equal to the value of the tax benefits. Under these stylized assumptions, the estimated maximum premium ranges between 36 and 69 per cent, depending on whether the investor is eligible for investment tax credits. Appendix 1 reproduces the detailed calculations presented in that report.
COST-EFFECTIVENESS FOR INVESTORS
The previous section considered the cost-effectiveness and effectiveness of FTS from the perspective of the issuing firm based on the sharing of the maximum premium with the investor. This section considers cost-effectiveness from the perspective of the other party to the transaction: the investor, or buyer.
We address the question of the cost-effectiveness of FTS for the investor by comparing the rates of return for FTS with the rates of return for alternative equity-investment opportunities. Three outcomes are possible: either the rates of return for FTS exceeded, fell below, or equalled the rates of return for investments in common shares in the resource sector on a risk-adjusted basis.
26 There are at least three reasons why corporations might simultaneously issue FTS and non-FTS (common shares). First, FTS are not relevant for tax-exempt or corporate investors who are unwilling to pay the premium on FTS. Second, it is possible that FTS investors are more willing to buy FTS when they see that other investors are also interested in buying shares, even without the tax advantage, and may view this as an indirect signal for the quality of the issue. Third, the demand for financing is in excess of supply of FTS financing and therefore non-FTS (common shares) have to be issued.
27 Canada, Tax Expenditures.

11
If the rates of return for investment in FTS were positive, on a net-of-tax basis, relative to the rates of return for alternative types of equity investment, then one or more of the following things must be true:
1. FTS investors paid a premium substantially below the maximum premium;
2. the exploration financed by FTS resulted in relatively attractive ore findings and unexpectedly high prices for the underlying shares; or
3. the share prices of issuing companies increased substantially for other reasons.
Alternatively, if the relative rates of return for FTS were negative, in spite of the FTS’ attractive tax features, then at least one of the following statements must be true:
1. FTS investors paid a premium higher than the maximum premium;
2. the exploration financed by FTS was relatively unsuccessful and resulted in unexpectedly low prices for the underlying shares;
3. the share prices of issuing companies decreased substantially for other reasons; or
4. there were high costs associated with intermediation.
Finally, if the relative rates of return for FTS were close to zero (that is, if they were similar to the rates for alternative equity investments), then the FTS were priced so that neither the investor nor the firm benefited at the expense of the other.
METHODOLOGY AND ANALYSIS
The analysis in this paper related to rates of returns rests on an evaluation of both the absolute rates of return and the relative rates of return to investors for FTS purchased on the TSX and TSX-V exchanges. Since the income tax consequences associated with FTS significantly affect the returns to FTS investors, my calculations of these results are both pre-tax and net of tax.
In determining the absolute rates of return, I assume that the investor purchased the shares on the date the FTS were issued and sold them at various holding periods (one year, two year, etc.). I then adjust the gross-of-tax absolute returns from these investments to take into account both the income tax deductions associated with the FTS and the capital gains tax payable by the investor.28 This calculation of absolute rates of return provides an overall indication of the performance of FTS.
Next, I investigate relative rates of return from investments in FTS by comparing the absolute rates of returns with what these investors would have earned had they instead invested in an “average” share in the mining industry or the petroleum industry. This comparison adjusts for general trends in stock-market activity. For example, increases in the market prices for precious metals might cause the stock market to rise during the period
28 The analysis of rates of return ignores certain complications attributable to the cumulative net-investment-loss rules.

12
between the issuance date and the sale date for FTS issued by a company engaged in the mining of precious metals.29 In this situation, the rate of return realized by the shareholders in the company’s FTS would be high regardless of the outcome of the exploration activity financed by those particular share issues. Therefore, any evaluation of the rates of return for such shares must reflect the general change in the level of share prices due to the cyclical nature of the resource sector. It is the resulting relative rates of return that allow inferences to be made about the quality of investment and, consequently, the performance of the exploration activity financed by FTS.
THE ANALYTICS OF RATES OF RETURN
As noted above, rates of return depend on investors’ tax situations. To separate the impact of taxes on returns, I provide calculations under four different measures of the rate of returns for comparison.
Net Rate of Return on Shares Subject to Capital Gains Taxation
The first rate-of-return formula applies to what the investor would have earned from an investment in common shares, subject to capital gains taxation. Accordingly, the calculation of this rate of return assumes that the investor in FTS does not benefit from the tax deductions associated with FTS. In addition, it is assumed that the investor is required to pay capital gains tax on disposition of the common shares. This rate of return provides an indication of the inherent quality of the investment and serves as a benchmark against which to compare the other three rates of return. It is given by the formula:
R1 = (1 − iCtH)(PS − PP) /PP, (5)
where PP is the price on the date of issuance, PS is the price on the date of sale, tH represents the marginal tax rate of salaries and wages for an investor in the highest tax bracket, and iC is the capital gains inclusion rate.
Gross Rate of Return on Shares with Lifetime Capital Gains Exemption
The gross rate of return on the shares, defined in Equation 6, is a useful benchmark for evaluating the return on investment and the effects of capital gains taxation and FTS treatment on the shareholder’s return.
R2 = (PS − PP) /PP, (6)
where the variables are the same as in Equation 5.
29 Department of Finance Canada, “Flow-Through Shares,” Chapter 3, shows that significant increases in prices for precious metals and for the stocks of precious-metal companies did occur during this period.

13
Net Rate of Return on FTS with Capital Gains Taxation
The third rate-of-return formula explicitly accounts for the tax deductions available to the FTS investor and assumes that capital gains taxes are payable on the date of sale. Thus, the difference between the rate of return in this case and the corresponding common-share rate of return given by Equation 5 is attributable entirely to the tax deductions enjoyed by the FTS investor. This rate of return is calculated as:
R3 = [PS(1 −iCtH) + PPtHZ −PP] /PP. (7)
The first term, PS (1 - iCtH), represents the after-tax proceeds from the sale of the FTS, given the zero-adjusted cost base for the purposes of the capital gains tax. The second term, PPtHZ, represents the tax savings from the investment, where Z is the present value of the deductions, grants, and bonus deductions in respect of amounts renounced to the investor per dollar of investment. The tax value of these deductions depends upon the investor’s marginal tax rate, tH.30
Net Rate of Return on FTS with Lifetime Capital Gains Exemption
The rate-of-return formula in this case differs from Equation 7 only in assuming that the investor pays no capital gains tax, due to the lifetime capital gains exemption on the proceeds of disposition. The formula is:
R4 = [PS + PPtHZ - PP] /PP. (8)
One can compare the rate of return derived from equations 7 and 8 with the rate of return from equations 5 and 6 to evaluate the tax-benefit component of the FTS depending on the investor’s tax situation with respect to the capital gains exemption.
If the holding period is one year and all tax benefits accrue in the same year, then the comparative statics based on R3 and R4 using a marginal tax rate of 42 per cent, a capital gains rate of half the marginal tax rate and 100 per cent deduction indicate that an investor in FTS would not lose her capital as long as the price at the sale date (Ps) is at least 73 per cent of the purchase price (Pp) under the no-capital-gains-exemption scenario and 58 per cent under the full-capital-gains-exemption scenario, respectively.31
30 In the empirical part of this paper, we use one as the value for Z, meaning that these deductions are available immediately to investors. This means our results for rates of returns with holding periods higher than Year 2 are biased upwards.
31 Canada, Tax Expenditures, Table 5, provides data on the tax characteristics of the investors of FTS. It shows that 90 per cent of flow-through shares purchased by individuals are acquired by those in the top two federal income tax brackets. The average combined federal-provincial marginal income tax rate of individuals investing in flow-through shares is estimated to be 42 per cent. We use this rate as a representative rate for investors in our sample. The report also states that, in general, the distribution of individual flow-through-share investors reflects the provincial population distribution, with two notable exceptions: Quebec (10 per cent of flow-through-share investors, with about 23 per cent of Canada’s population in 2012) and Alberta (23 per cent of flow-through-share investors, with about 11 per cent of Canada’s population in 2012). The availability of certain tax credits for investments in mining flow-through shares (Ontario: five per cent; Manitoba: 30 per cent; Saskatchewan: 10 per cent; and British Columbia: 20 per cent), as well as the “bonus” deduction available in Quebec, do not seem to have a large impact on the distribution of flow-through-share investors across jurisdictions.

14
Next, I compare these returns to the benchmark returns (see section below) to calculate relative returns. When comparing R1 and R3, it is assumed that the investor in the benchmark portfolio did not have capital gains exemptions; when comparing R2 and R4, it is assumed that the investor benefited from the capital gains exemption (meaning, she paid no taxes at disposal). This allows for a direct comparison of benefits of the FTS deductions on investor returns on a relative basis.
DATA AND SAMPLE CHARACTERISTICS
The primary sources of data were companies listed on the TSX -V using TSX daily sheets. This was collected manually and then augmented with data available from Capital IQ.
For a total of 2,677 total issuances (made by 987 unique companies), the price data from Capital IQ were collected from Jan. 1, 2008 through June 6, 2014. This sample was reduced to 1,783 usable sample companies; issuances were discarded if company return data were unavailable from Capital IQ or there were errors in the data between periods analyzed. The sample represents a total financing of $4 billion with FTS representing $2.5 billion and simultaneously issued non-FTS representing the remaining $1.5 billion.
Table 1 provides the classification of the set of 1,783 issuances based on single issuers versus multiple issuers. As can be seen, there are 179 issuances associated with a one-time issuance by a company, the remaining 1,603 are by multiple issuers. Of the multiple issuers, companies with two to five issues accounted for 863 issues, companies with six to nine issues accounted for 543 issues, companies with 10 to 14 issues accounted for 106 issues, and companies with 15 or more issues accounted for 91 issues.
Table 2 shows the distribution of 639 companies and their issues by market capitalization as well as the total amount raised and average amount per issue. Companies are grouped as those with less than $1 million in capitalization to those with over $10 million in market capitalization.32 Of the total of $4 billion raised by our sample companies, 50 per cent was raised by companies with a market capitalization of less than $5 million, with each individual issue of approximately $1 million. Naturally, companies with higher capitalization have larger issue sizes and accounted for the rest.
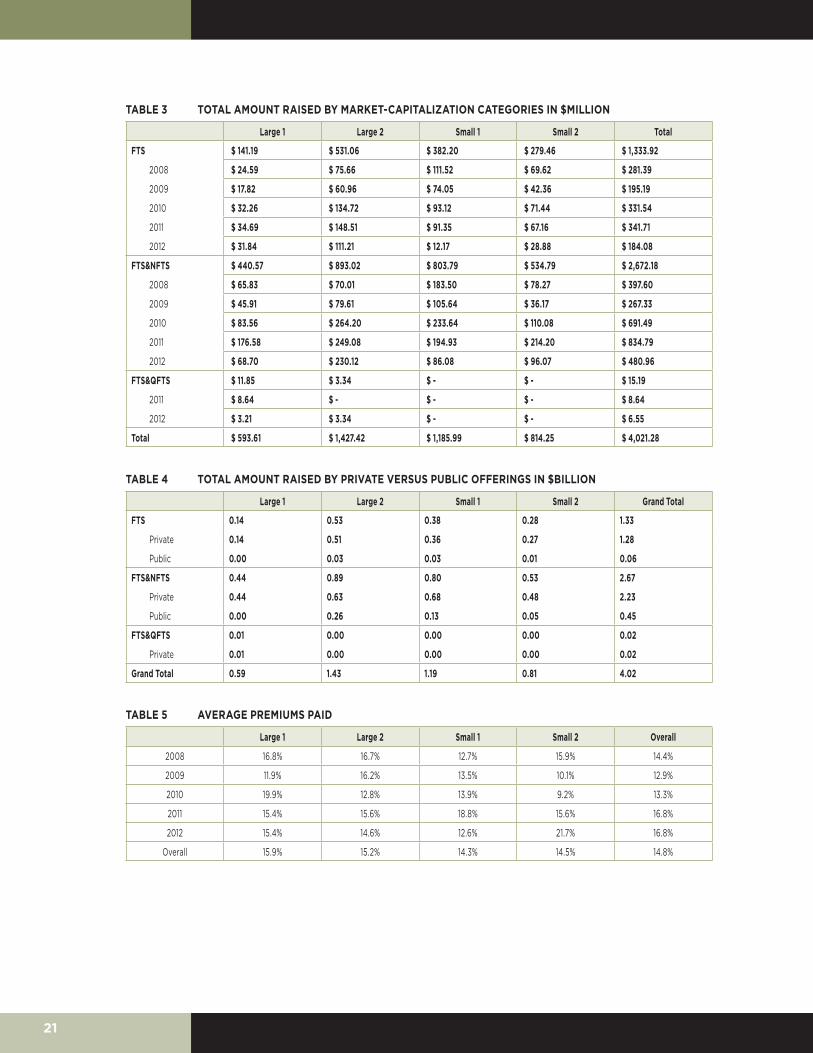
The sample companies either raised capital by issuances of only FTS or they issued both FTS and non-FTS (that is, common shares with no flow-through tax benefits) simultaneously. Table 3 shows that of the total $4.02 billion, pure FTS issuances accounted for $1.33 billion and the joint issuances accounted for $2.67 billion. Although not shown here, of the $2.67 billion raised through paired (joint) offerings, FTS accounted for $1.3 billion. Thus, of the total $4.02 billion of capital, FTS account for $2.63 billion. The joint offerings allow us to evaluate the premiums paid by investors in FTS compared to their non-FTS counterparts.
32 We did not have access to the debt-financing or capital structure of all these firms, especially market value of debt. However, in most instances, these firms were mostly equity financed, reflecting the inherent riskiness of these firms.

15
Table 4 shows another interesting characteristic of the FTS marketplace. Of the $4.02 billion raised by our sample companies, $3.58 billion (89 per cent) was raised through private placements, meaning shares with potential restrictions on their immediate trading as normal shares. This means that FTS may not be strictly comparable with normal common shares, which have a much higher liquidity than do flow-through shares.
Table 5 focuses on premiums paid by investors on FTS compared to non-FTS; this is applicable only when FTS were issued simultaneously with non-FTS. As can be seen, the average premiums range between nine and 21 per cent, with an overall average of 14.8 per cent. These premiums are significantly below the theoretical premiums as stated above, implying that firms were unable to retain a significant portion of the tax benefits for themselves. However, it should be noted that the maximum theoretical premium calculations assume that the firm renounces all its allowable deductions and that all investors are in the highest personal income tax bracket; in reality this may not be the case.33 The results of this paper are comparable to the Government of Canada’s report, which shows the premiums to be in the 19 to 26 per cent range.
RATES OF RETURN
Next I turn my attention to the rates of returns enjoyed by investors of FTS in the sample. I analyze both absolute and relative returns — returns adjusted for risk. The use of benchmarks ensures that the comparison is on a “risk-adjusted” basis, where the benchmark represents performance of an average common share in that industry. While Table 3 shows that a significant majority of issuers are smaller than $50 million, there are some that are large. Thus, I constructed two separate benchmarks (synthetic indices) based on size, and then date-matched them with the issuer so as to provide a time-matched risk-adjusted comparison. The procedure for constructing these two synthetic indices follows.
From the Capital IQ database, I selected all traded companies (common shares) that belong to the “basic material” and “energy” sectors, which resulted in a total of 627 securities. Next, for each of these securities, I extracted from the database returns data beginning Jan. 1, 2008 and ending June 6, 2014 that contained no errors or large numbers of missing values. This reduced the sample to 480 stocks. I then retrieved daily market capitalization information for these stocks (price multiplied by outstanding shares) for each day. I separated these companies into two groups: those with a market capitalization below $50 million and those above $50 million as of Jan. 1, 2008. Using the index value of 100 as of Jan. 1, 2008, I constructed a market-capitalization-weighted synthetic index for each of these two subsets of stocks. The small cap index consists of 366 companies and the large cap index consists of 114 companies.34 Figure 1 shows the performance of these indices during the time period under consideration. Although highly correlated, the small cap index
33 The Government of Canada study (Canada, Tax Expenditures) reveals that 25 per cent of flow-through shares are held by corporations and the maximum premium for a corporate investor subject to a combined federal-provincial general corporate income tax rate of 25 per cent would be 16 per cent.
34 It can be argued that one could construct an index of companies with even smaller market capitalization. However, that set includes companies with very thinly traded stocks and stocks that show significant price variations when a sale occurs; they also show very large bid-and-ask spreads. This makes the benchmark of these very small-market-capitalization companies highly suspect for any meaningful comparisons.
16
outperforms the large cap index by a small percentage but with a higher overall variation. I intend to use these two benchmarks in comparing the relative returns of the sample issues.
Table 6 shows the annualized gross rates of returns corresponding to R2 (Equation 6). This rate of return could be interpreted as the after-tax rate of return that an investor would receive with full capital gains exemption, no FTS deductions, and without any adjustment for benchmark returns.35 In this table, we separate issues that were pure FTS, issues that were joint (FTS and NFTS) and FTS issued jointly in Ontario and Quebec (FTS and QFTS). As can be seen, the gross rates of return are disappointing. The results show that FTS issued by small companies either alone or in conjunction with non-FTS had an annualized return of negative 92 per cent, which improved monotonically for the issues of larger issuers. The results are only marginally different if the FTS were issued by themselves or along with the non-FTS or issued jointly in Quebec (QFTS). For issues raised by companies with market capitalization higher than $10 million, the average gross return was negative 14 per cent annualized for FTS and negative 13 per cent when issued jointly. However, if the intent was to provide tax incentives to junior mining and resource firms, then that intent has resulted in significant losses without adjusting for taxes. Since the total funds raised in each of these categories is known, one can calculate the weighted average of wealth loss (on a pre-tax basis) suffered by investors. This amounts to $1.2 billion based on the total investment of $2.55 billion in FTS.
Table 7 shows the results for relative (differential) returns net of the synthetic benchmark index returns. As can be seen in all cases, the relative rates of return are worse than the corresponding absolute rates of returns, meaning that on a risk-adjusted basis, FTS fared worse than an investment in an average stock in the sector.
Next, I investigate whether the rates of return vary between single issuers versus multiple issuers as shown. The hypothesis is that investors would fare better with multiple issuers as they can learn from the historical performance of multiple issuers and invest in those who have shown better performance.36 Surprisingly, except for the subgroup “Large 2,” there were only marginal differences in performance. Since the differences in returns are only marginal, for the sake of brevity I do not report those results and I do not provide separate results of these subgroupings in the section on post-tax returns that follows. The overall and somewhat surprising conclusion is that investors seem to completely discount the historical performance of companies issuing FTS.
POST-TAX RETURNS
Quite clearly, comparing pre-tax returns associated with FTS in absolute or relative terms ignores the key tax advantage of FTS as demonstrated in equations 5 through 8. To
35 Since companies in our sample are dispersed across years, some with almost five years of history and some with only one year of history, we are using annualized rates of returns so as to get a consistent comparison; it also allows us to condense the presentation of our results without losing the key insights.
36 This assumes that, at the margin, investors in the FTS market evaluate past performance of FTS issued by the same company. Our results show that this is also not the case. Neither does a typical term sheet provide this information to the investors.

17
calculate post-tax returns, one needs to know the specific tax situation faced by the investor as well as the holding period.
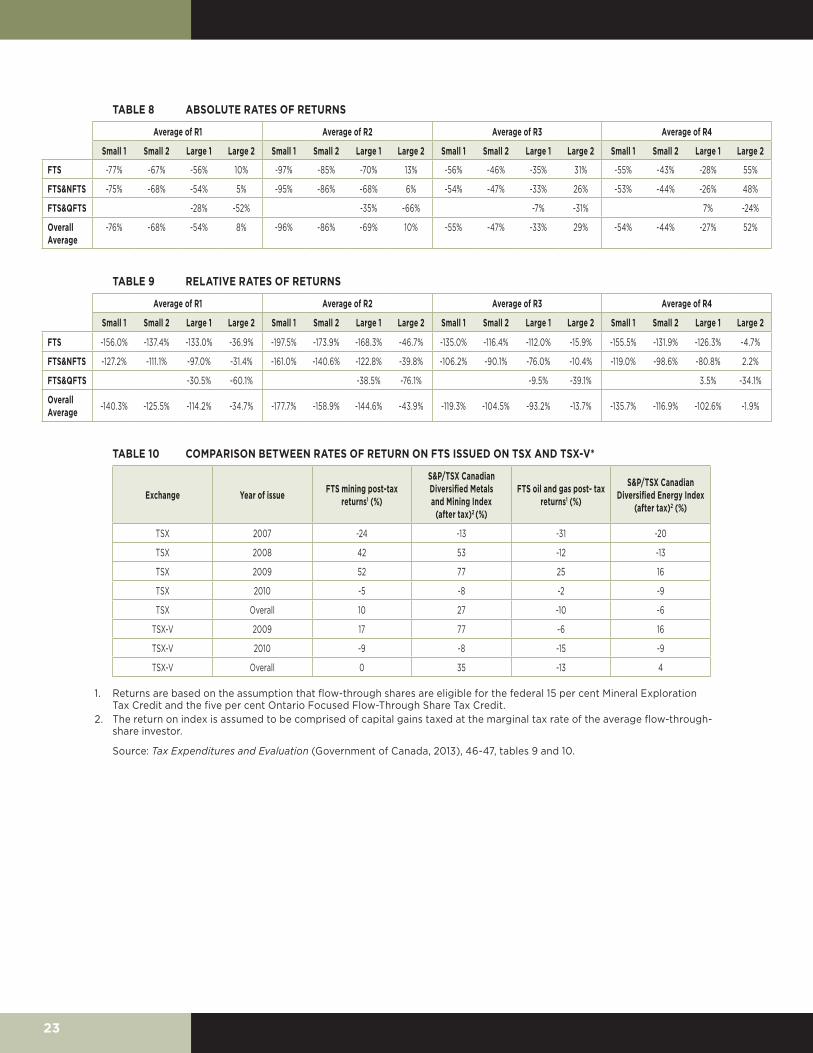
Table 8 shows the results of these pre-tax and post-tax return estimations of FTS in absolute terms. It should be noted that the post-tax returns will be better than pre-tax returns since except when Ps (selling price) equals or is lower than Pp (the purchase price), R2 is going to be unambiguously better than R1. Similarly R3 and R4 are going to be better with or without capital gains exemption due to the flow-through deductions accorded to FTS. The degree of differential returns would depend on the Ps relative to Pp. With respect to benchmark returns, their returns would be influenced by the lack of any deduction, but their cost base does not go to zero. Table 8 shows the absolute returns and Table 9 shows relative returns.
As can be seen in Table 8, absolute rates of return are always higher when the tax impact is included in the return calculations. It is no surprise that R4 would be higher than R3, which in turn would be higher than R2, which in turn would be higher (lower) than R1 if Ps is higher (lower) than Pp. When one compares across the four size groups, issues from larger firms provide better returns than those from smaller issues. However, the only positive returns occurred when investors benefited from capital gains exemption and when they invested in large company issues. However, these returns need to be compared with benchmark returns where the investor does not get any tax benefits. Table 9 results show that relative (differential) returns on every type of FTS grouping were disappointing. Even with the most favourable tax-treatment assumption, investors fared worse in their investment in FTS except in large company issues. In all other groupings, the relative returns are very disappointing to say the least. Overall, these results show that FTS investments were extremely cost-ineffective from an investor’s perspective.
These results are directionally similar to Jog, Lenjosek and McKenzie37 and those reported in Part 2 of the Government of Canada’s recent Tax Expenditure and Evaluation report.38 Jog, Lenjosek and McKenzie based their conclusions based on 44 FTS limited partnerships that invested in FTS during the period 1986 through 1990 and accounted for $1.67 billion of FTS financing. Based on the resource type of FTS (mining versus oil and gas) and using corresponding sub-indices for calculating relative returns, they conclude that the most attractive returns from FTS were earned from investments in the earlier years of their sample period and by investors who had access to the lifetime capital gains exemption. Since the lifetime exemption affected returns from all investments, the most representative results for FTS investments would be those that assume an absence of the capital gains exemption. Given this assumption, the earnings from FTS partnerships were not excessive; on average, the investor earned two per cent over the period, though the returns were highly variable both between and within years. Correspondingly, if the management costs associated with the limited partnerships were small, then the firms, rather than the investors, received most of the benefits of the FTS in absolute terms.
However, their results based on relative returns showed that FTS investments earned negative relative rates of returns. In fact, if one leaves the tax deductions out of the equation, the performance of their sample of limited partnerships was significantly below
37 Jog, Lenjosek and McKenzie, “Economics of.”38 Canada, Tax Expenditures.

18
average: the common shares purchased by the limited partnerships in the sample fared much worse than a typical share in the same sub-industry. This outcome could be the result of either poor exploration results associated with the expenditures undertaken by the firms or a relatively high premium paid by the investor, which allowed the firms to reduce the cost of financing to undertake exploration. However, from the investor perspective, FTS were unattractive investments.
The second and most recent evidence is found tables 9 and 10 in Part 2 of the recent Tax Expenditure and Evaluation report by the Government of Canada.39 That report analyzed rates of returns of 100 FTS listed on the Toronto Stock Exchange during 2007–12 (total amount raised was $700 million) and 510 FTS issued on the TSX-V exchange (amounting to $660 million) during the 2009–12 period. That study essentially used the same methodology as Jog, Lenjosek and McKenzie.40 The analysis is summarized in Table 10. These results are similar to the results of this study: even with tax credits (post-tax returns) FTS performed worse than the corresponding benchmark indices. 41
CONCLUSIONS
The results of this study indicate that, even with their considerable tax benefits, FTS did not generate reasonable and positive rates of return for investors after adjusting for the corresponding benchmark returns. While these investments may have stimulated more financing for exploration activity, FTS have not been a sound investment for investors. Indirectly, this also indicates that even if the financing may have resulted in incremental exploration activity (as opposed to just spending on exploration), there is little evidence that the incremental exploration activity resulted in incremental discoveries. Moreover, investors of FTS of junior companies fared worse. The results of other studies on FTS stretching back to the early 1990s have also come to similar conclusions. Similar conclusions have been reached for other programs such as QSSP and LSVCC.
In light of the continued debate in the U.S. of reducing overall corporate tax rates and eliminating preferential tax considerations that are targeted to specific sectors, and a continued desire of Canadian policy-makers to diversify the Canadian economy from being resource-based, these results may suggest that investors and government might consider instruments that do not depend so much on preferential tax treatments in a specific sector. If more investment in resource sectors or other sectors with similar characteristics (e.g., biotechnology, or other R&D-intensive industries where there is negative taxable income in early years) is required, FTS as an investment vehicle may not be the right vehicle for investors. While FTS may have provided financing to junior resource companies for undertaking exploration activity and may have provided employment opportunities for some, this additional investment came at a considerable cost to investors. The poor investment returns are also indicative of the fact that incremental activity in the resource
39 ibid., 46-47.40 Jog, Lenjosek and McKenzie, “Economics of.”41 Pre-tax returns assume no flow-through deductions accorded to the investor, whereas post-tax returns include the impact of
tax deductions.

19
sector did not result in successful exploration results. Although FTS issued by large companies have done relatively better, these companies may not have required any specific tax incentives to entice investors to invest in their issues. Overall, it may be that the time has come to reflect on the current FTS regime and to ask whether this type of tax-incentivized vehicle is the right one to channel investment money into this sector. Moreover, as noted in the literature-review section, studies that analyzed similar tax-based investment mechanisms, namely QSSP and LSVCC, have also reached similar conclusions and the LSVCC program is now being phased out.
These are troubling conclusions and raise many interesting issues that relate to investor behaviour and expertise, as well as tax policy. It is possible that investors focus only on the immediate tax deduction in the first year of investment and do not pay sufficient attention to the economic returns in the subsequent years. Perhaps intermediaries do the same when they promote these investment vehicles to investors. In a typical joint issue of FTS and non-FTS, the intermediary gets a higher commission to sell FTS and it may be easier to sell FTS, presuming the conjecture above is correct.42 It is also possible that investors naively believe that if governments are providing such tax incentives then, on average, these investments must provide a reasonable rate of return. Another explanation would be an adverse-selection issue, which may be even more troubling. More specifically, FTS may encourage too many poor projects and allow marginal players to enter the industry, thereby driving down economic returns and raising costs of exploration for other participants in that sector.43 Similar to the QSSP and LSVCC results, this may make it harder for good projects to attract financing and thus they could give up on some high-return projects. In the end, this situation results in investors receiving low average returns. Despite the claim that the FTS program may promote additional exploration activity, prior studies and this analysis suggest that the time may have come to question whether these types of tax-based incentive mechanisms targeted towards individual investors are consistent with economic efficiency and good economic and tax policy.44
42 As an example, and as pointed out by one reviewer, the same percentage of underwriting fee (typically four per cent) is applied to FTS, which is typically issued at a premium over the corresponding non-FTS.
43 This increase in costs was noted in the government study: Canada, Tax Expenditures.44 On March 1, 2015, the government of Canada announced that it would broaden the definition of Canadian exploration
expenses and extend the availability of the Mineral Exploration Tax Credit. Under this broadened definition, companies can now flow through expenses associated with environmental studies and for consultations with communities and other interested parties. The government also announced an extension of the availability of the Mineral Exploration Tax Credit, which was set to expire on March 31, 2015.

20
FIGURE 1 PERFORMANCE OF THE TWO SYNTHETIC INDICES
TABLE 1 NUMBER OF ISSUANCES BY YEAR
Year # of issues Single issuers Multiple Issuers
2012 276 35 241
2011 386 37 349
2010 438 35 403
2009 334 16 318
2008 348 56 292
Total 1,782 179 1,603
TABLE 2 NUMBER OF COMPANIES AND ISSUES BY MARKET CAP AND AMOUNT RAISED
Size Market capitalization Number of companies Issuances Amount raised $billion
Average issue size $million
Small 1 Under $1M 262 699 1.19 1.70
Small 2 $2M-$5M 208 564 0.81 1.44
Large 1 $6M-$10M 67 231 0.59 2.57
Large 2 Over $10M 102 288 1.43 4.96
Total 639 1,782 4.02 2.26
21
TABLE 3 TOTAL AMOUNT RAISED BY MARKET-CAPITALIZATION CATEGORIES IN $MILLION
Large 1 Large 2 Small 1 Small 2 Total
FTS $ 141.19 $ 531.06 $ 382.20 $ 279.46 $ 1,333.92
2008 $ 24.59 $ 75.66 $ 111.52 $ 69.62 $ 281.39
2009 $ 17.82 $ 60.96 $ 74.05 $ 42.36 $ 195.19
2010 $ 32.26 $ 134.72 $ 93.12 $ 71.44 $ 331.54
2011 $ 34.69 $ 148.51 $ 91.35 $ 67.16 $ 341.71
2012 $ 31.84 $ 111.21 $ 12.17 $ 28.88 $ 184.08
FTS&NFTS $ 440.57 $ 893.02 $ 803.79 $ 534.79 $ 2,672.18
2008 $ 65.83 $ 70.01 $ 183.50 $ 78.27 $ 397.60
2009 $ 45.91 $ 79.61 $ 105.64 $ 36.17 $ 267.33
2010 $ 83.56 $ 264.20 $ 233.64 $ 110.08 $ 691.49
2011 $ 176.58 $ 249.08 $ 194.93 $ 214.20 $ 834.79
2012 $ 68.70 $ 230.12 $ 86.08 $ 96.07 $ 480.96
FTS&QFTS $ 11.85 $ 3.34 $ - $ - $ 15.19
2011 $ 8.64 $ - $ - $ - $ 8.64
2012 $ 3.21 $ 3.34 $ - $ - $ 6.55
Total $ 593.61 $ 1,427.42 $ 1,185.99 $ 814.25 $ 4,021.28
TABLE 4 TOTAL AMOUNT RAISED BY PRIVATE VERSUS PUBLIC OFFERINGS IN $BILLION
Large 1 Large 2 Small 1 Small 2 Grand Total
FTS 0.14 0.53 0.38 0.28 1.33
Private 0.14 0.51 0.36 0.27 1.28
Public 0.00 0.03 0.03 0.01 0.06
FTS&NFTS 0.44 0.89 0.80 0.53 2.67
Private 0.44 0.63 0.68 0.48 2.23
Public 0.00 0.26 0.13 0.05 0.45
FTS&QFTS 0.01 0.00 0.00 0.00 0.02
Private 0.01 0.00 0.00 0.00 0.02
Grand Total 0.59 1.43 1.19 0.81 4.02
TABLE 5 AVERAGE PREMIUMS PAID
Large 1 Large 2 Small 1 Small 2 Overall
2008 16.8% 16.7% 12.7% 15.9% 14.4%
2009 11.9% 16.2% 13.5% 10.1% 12.9%
2010 19.9% 12.8% 13.9% 9.2% 13.3%
2011 15.4% 15.6% 18.8% 15.6% 16.8%
2012 15.4% 14.6% 12.6% 21.7% 16.8%
Overall 15.9% 15.2% 14.3% 14.5% 14.8%

22
TABLE 6 ANNUALIZED RATES OF RETURN (R2 - EQUATION 6) OF FTS BY SIZE CATEGORY
Small 1 Small 2 Large 1 Large 2
FTS FTS&NFTS FTS FTS&NFTS FTS FTS&NFTS FTS&QFTS FTS FTS&NFTS FTS&QFTS
Average of Annualized Return to date
-92% -87% -59% -67% -47% -42% -6% -14% -13% -21%
Max of Annualized Return to date
-7% -7% 11% 11% 28% -3% 4% 97% 108% -21%
Min of Annualized Return to date -100% -100% -100% -100% -100% -100% -18% -100% -100% -21%
Sum of Total $ Raised $382,203,442 $803,788,769 $279,460,514 $534,790,462 $141,190,632 $440,573,931 $11,849,359 $531,062,004 $893,023,226 $3,338,080
Sum of $ Raised FTS $382,203,442 $353,869,307 $279,460,514 $275,912,691 $141,190,632 $205,639,645 $11,849,359 $531,062,004 $370,879,048 $3,338,080
Sum of $ Raised Non-FTS $0 $1,183,999 $0 $1,019,204 $0 $2,097,628 $0 $0 $4,279,870 $0
Wealth Distruction FTS $-350,463,704.58 $-307,972,542.58 $-164,961,266.56 $-184,552,354.08 $-66,426,381.65 $-85,898,671.78 $-700,135.08 $-74,459,254.73 $-47,114,392.77 $-709,059.57
* FTS&NFTS column refers to issues with simultaneous issuances of FTS and non-FTS; FTS&QFTS refers to issues with simultaneous issuances of FTS and non-FTS in Ontario and Quebec.
TABLE 7 RELATIVE RATES OF RETURN
Small 1 Small 2 Large 1 Large 2
FTS FTS&NFTS FTS FTS&NFTS FTS FTS&NFTS FTS&QFTS FTS FTS&NFTS FTS&QFTS
Relative returns -105% -99% -73% -78% -57% -50% -20% -25% -23% -42%
Maximum of relative returns -8% -9% 16% 16% 31% -14% -4% 106% 117% -42%
Minimum of relative returns -134% -134% -134% -134% -129% -129% -40% -125% -119% -42%
Average of Total $ Raised $1,198,130 $2,115,234 $901,486 $2,105,474 $1,217,161 $3,933,696 $3,949,786 $3,218,558 $7,319,863 $3,338,080
Average of $ Raised FTS $1,198,130 $931,235 $901,486 $1,086,270 $1,217,161 $1,836,068 $3,949,786 $3,218,558 $3,039,992 $3,338,080
Average of $ Raised Non-FTS $0 $1,183,999 $0 $1,019,204 $0 $2,097,628 $0 $0 $4,279,870 $0
* Relative (differential) rates of return correspond to returns net of the corresponding synthetic indices (benchmarks).
23
TABLE 8 ABSOLUTE RATES OF RETURNS
Average of R1 Average of R2 Average of R3 Average of R4
Small 1 Small 2 Large 1 Large 2 Small 1 Small 2 Large 1 Large 2 Small 1 Small 2 Large 1 Large 2 Small 1 Small 2 Large 1 Large 2
FTS -77% -67% -56% 10% -97% -85% -70% 13% -56% -46% -35% 31% -55% -43% -28% 55%
FTS&NFTS -75% -68% -54% 5% -95% -86% -68% 6% -54% -47% -33% 26% -53% -44% -26% 48%
FTS&QFTS -28% -52% -35% -66% -7% -31% 7% -24%
Overall Average
-76% -68% -54% 8% -96% -86% -69% 10% -55% -47% -33% 29% -54% -44% -27% 52%
TABLE 9 RELATIVE RATES OF RETURNS
Average of R1 Average of R2 Average of R3 Average of R4
Small 1 Small 2 Large 1 Large 2 Small 1 Small 2 Large 1 Large 2 Small 1 Small 2 Large 1 Large 2 Small 1 Small 2 Large 1 Large 2
FTS -156.0% -137.4% -133.0% -36.9% -197.5% -173.9% -168.3% -46.7% -135.0% -116.4% -112.0% -15.9% -155.5% -131.9% -126.3% -4.7%
FTS&NFTS -127.2% -111.1% -97.0% -31.4% -161.0% -140.6% -122.8% -39.8% -106.2% -90.1% -76.0% -10.4% -119.0% -98.6% -80.8% 2.2%
FTS&QFTS -30.5% -60.1% -38.5% -76.1% -9.5% -39.1% 3.5% -34.1%
Overall Average -140.3% -125.5% -114.2% -34.7% -177.7% -158.9% -144.6% -43.9% -119.3% -104.5% -93.2% -13.7% -135.7% -116.9% -102.6% -1.9%
TABLE 10 COMPARISON BETWEEN RATES OF RETURN ON FTS ISSUED ON TSX AND TSX-V*
Exchange Year of issue FTS mining post-tax returns1 (%)
S&P/TSX Canadian Diversified Metals and Mining Index
(after tax)2 (%)
FTS oil and gas post- tax returns1 (%)
S&P/TSX Canadian Diversified Energy Index
(after tax)2 (%)
TSX 2007 -24 -13 -31 -20
TSX 2008 42 53 -12 -13
TSX 2009 52 77 25 16
TSX 2010 -5 -8 -2 -9
TSX Overall 10 27 -10 -6
TSX-V 2009 17 77 -6 16
TSX-V 2010 -9 -8 -15 -9
TSX-V Overall 0 35 -13 4
1. Returns are based on the assumption that flow-through shares are eligible for the federal 15 per cent Mineral Exploration Tax Credit and the five per cent Ontario Focused Flow-Through Share Tax Credit.
2. The return on index is assumed to be comprised of capital gains taxed at the marginal tax rate of the average flow-through-share investor.
Source: Tax Expenditures and Evaluation (Government of Canada, 2013), 46-47, tables 9 and 10.

24
APPENDIX 1*
MAXIMUM FLOW-THROUGH-SHARE PREMIUM UNDER STYLIZED ASSUMPTIONS
In dollars, except when otherwise noted
Flow-Through Shares Not Eligible for Investment Tax Credits
Flow-Through Shares Eligible for Investment Tax Credits1
Value of underlying common share 100 100
Maximum flow-through-share premium (net value of tax benefits) 36% 69%
Price of flow-through share 136 169
Premium to market 36 69
Value of flow-through-share tax deductions 57 71
Value of flow-through-share tax credits 0 33
Income inclusion of tax credits2 0 (14)
Capital gains tax3 (21) (21)
Net tax benefits 36 69
1. Federal 15 per cent Mineral Exploration Tax Credit plus the five per cent Ontario Focused Flow-Through Share Tax Credit.
2. In practice, the income inclusion occurs in the following tax year. 3. Calculated as the capital gains tax payable on the value of the underlying common shares (i.e., the incremental
capital gain due to the rule deeming the cost of a flow-through share to be nil for tax purposes).
* Source: Tax Expenditures and Evaluation (Government of Canada, 2013), Table 6.

25
About the Author
Vijay Jog is a Research Fellow at the University of Calgary's School of Public Policy, as well as the Chancellor Professor at the Sprott School of Business at Carleton University and a leading authority in corporate finance and performance. He consults extensively for many government departments, crown corporations, and private sector firms in Canada, U.S., Caribbean, Europe and South Africa.

26
ABOUT THE SCHOOL OF PUBLIC POLICY
The School of Public Policy will become the flagship school of its kind in Canada by providing a practical, global and focused perspective on public policy analysis and practice in areas of energy and environmental policy, international policy and economic and social policy that is unique in Canada.
The mission of The School of Public Policy is to strengthen Canada’s public service, institutions and economic performance for the betterment of our families, communities and country. We do this by:
• Building capacity in Government through the formal training of public servants in degree and non-degree programs, giving the people charged with making public policy work for Canada the hands-on expertise to represent our vital interests both here and abroad;
• Improving Public Policy Discourse outside Government through executive and strategic assessment programs, building a stronger understanding of what makes public policy work for those outside of the public sector and helps everyday Canadians make informed decisions on the politics that will shape their futures;
• Providing a Global Perspective on Public Policy Research through international collaborations, education, and community outreach programs, bringing global best practices to bear on Canadian public policy, resulting in decisions that benefit all people for the long term, not a few people for the short term.
Our research is conducted to the highest standards of scholarship and objectivity. The decision to pursue research is made by a Research Committee chaired by the Research Director and made up of Area and Program Directors. All research is subject to blind peer-review and the final decision whether or not to publish is made by an independent Director.
The School of Public PolicyUniversity of Calgary, Downtown Campus906 8th Avenue S.W., 5th FloorCalgary, Alberta T2P 1H9Phone: 403 210 3802
DISTRIBUTIONOur publications are available online at www.policyschool.ca.
DISCLAIMERThe opinions expressed in these publications are the authors' alone and therefore do not necessarily reflect the opinions of the supporters, staff, or boards of The School of Public Policy.
COPYRIGHTCopyright © 2016 by The School of Public Policy. All rights reserved. No part of this publication may be reproduced in any manner whatsoever without written permission except in the case of brief passages quoted in critical articles and reviews.
ISSN1919-112x SPP Research Papers (Print) 1919-1138 SPP Research Papers (Online)
DATE OF ISSUEFebruary 2016
MEDIA INQUIRIES AND INFORMATIONFor media inquiries, please contact Morten Paulsen at 403-220-2540. Our web site, www.policyschool.ca, contains more information about The School's events, publications, and staff.
DEVELOPMENTFor information about contributing to The School of Public Policy, please contact Rachael Lehr by telephone at 403-210-7183 or by e-mail at [email protected].

27
RECENT PUBLICATIONS BY THE SCHOOL OF PUBLIC POLICY
THE FALSE PANACEA OF CITY CHARTERS? A POLITICAL PERSPECTIVE ON THE CASE OF TORONTOhttp://policyschool.ucalgary.ca/?q=content/false-panacea-city-charters-political-perspective-case-toronto-0Andrew Sancton | January 2016
IS ‘CHARTER-CITY STATUS’ A SOLUTION FOR FINANCING CITY SERVICES IN CANADA — OR IS THAT A MYTH?http://policyschool.ucalgary.ca/?q=content/%E2%80%98charter-city-status%E2%80%99-solution-financing-city-services-canada-%E2%80%94-or-myth-0Harry Kitchen | January 2016
LAYING THE FOUNDATION FOR POLICY: MEASURING LOCAL PREVALENCE FOR AUTISM SPECTRUM DISORDERhttp://policyschool.ucalgary.ca/?q=content/laying-foundation-policy-measuring-local-prevalence-autism-spectrum-disorder-0Carolyn Dudley and Jennifer D. Zwicker | January 2016
WHAT DO WE KNOW ABOUT IMPROVING EMPLOYMENT OUTCOMES FOR INDIVIDUALS WITH AUTISM SPECTRUM DISORDER?http://policyschool.ucalgary.ca/?q=content/what-do-we-know-about-improving-employment-outcomes-individuals-autism-spectrum-disorder-0Carolyn Dudley and Jennifer D. Zwicker | January 2016
THE VALUE OF CAREGIVER TIME: COSTS OF SUPPORT AND CARE FOR INDIVIDUALS LIVING WITH AUTISM SPECTRUM DISORDERhttp://policyschool.ucalgary.ca/?q=content/value-caregiver-time-costs-support-and-care-individuals-living-autism-spectrum-disorder-0Carolyn Dudley and Jennifer D. Zwicker | January 2016
MIND THE GAP: TRANSPORTATION CHALLENGES FOR INDIVIDUALS LIVING WITH AUTISM SPECTRUM DISORDERhttp://policyschool.ucalgary.ca/?q=content/mind-gap-transportation-challenges-individuals-living-autism-spectrum-disorderCarolyn Dudley and Jennifer D. Zwicker | January 2016
ENERGY LITERACY IN CANADA: A SUMMARYhttp://policyschool.ucalgary.ca/?q=content/energy-literacy-canada-summaryDale Eisler | January 2016
THE CANADIAN RMB TRADING CENTRE: A SMALL STEP IN THE LONG ROAD OF CHINA'S PEACEFUL RISE IN INTERNATIONAL FINANCIAL MARKETShttp://policyschool.ucalgary.ca/?q=content/canadian-rmb-trading-centre-small-step-long-road-chinas-peaceful-rise-international-financiaJohn M. Curtis | January 2016
A PRIMER ON ALBERTA’S OIL SANDS ROYALTIEShttp://policyschool.ucalgary.ca/?q=content/primer-alberta%E2%80%99s-oil-sands-royaltiesSarah Dobson | December 2015
2015 STATUS REPORT ON MAJOR DEFENCE EQUIPMENT PROCUREMENTShttp://policyschool.ucalgary.ca/?q=content/2015-status-report-major-defence-equipment-procurementsDavid Perry | December 2015
THE TRANS-PACIFIC PARTNERSHIP (TPP): AN OVERVIEWhttp://policyschool.ucalgary.ca/?q=content/trans-pacific-partnership-tpp-overviewJohn M. Curtis | December 2015
THE CASE FOR A CARBON TAX IN ALBERTAhttp://policyschool.ucalgary.ca/?q=content/case-carbon-tax-albertaSarah Dobson and Jennifer Winter | November 2015
CHAMPIONING THE JOINT FORCE: A JOB FOR THE PUBLIC AND OUR POLITICAL LEADERS - NOT JUST MILITARY PROFESSIONALS ALONEhttp://policyschool.ucalgary.ca/?q=content/championing-joint-force-job-public-and-our-political-leaders-not-just-military-professionalsStuart Beare | November 2015