rare-gas clusters studied by electron spectroscopy
TRANSCRIPT
ACTAUNIVERSITATISUPSALIENSISUPPSALA2007
Digital Comprehensive Summaries of Uppsala Dissertationsfrom the Faculty of Science and Technology 260
Rare-gas Clusters Studied byElectron Spectroscopy
Structure of Heterogeneous Clusters and Effects ofElectron Scattering on Auger Decay
MARCUS LUNDWALL
ISSN 1651-6214ISBN 978-91-554-6769-2urn:nbn:se:uu:diva-7431


T ill M amma och Pappa


List of Papers
This thesis is based on the following papers, which are referred to in the textby their Roman numerals. Reprints were made with permission from the pub-lishers.
I Variable surface composition and radial interface formationin self-assembled free, mixed Ar/Xe clustersM. Tchaplyguine, M. Lundwall, M. Gisselbrecht, G. Öhrwall,R. Feifel, S. Sorensen, S. Svensson, N. Mårtensson, and O.BjörneholmPhys. Rev. A 69, 031201(R), 2004
II Radial surface segregation in free heterogeneousargon/krypton clustersM. Lundwall, M. Tchaplyguine, G. Öhrwall, R. Feifel, A.Lindblad, A. Lindgren, S. Sörensen, S. Svensson, and O.BjörneholmChem. Phys. Lett. 392, 433, 2004
III The far from equilibrium structure of argon clusters dopedwith krypton or xenonA. Lindblad, H. Bergersen, T. Rander, M. Lundwall, G. Öhrwall,M. Tchaplyguine, S. Svensson, and O. BjörneholmPhys. Chem. Chem. Phys. 8, 1899, 2006
IV Preferential site occupancy of krypton atoms on freeargon-cluster surfacesM. Lundwall, A. Lindblad, H. Bergersen, T. Rander, G. Öhrwall,M. Tchaplyguine, S. Svensson, and O. BjörneholmJ. Chem. Phys. 125, 014305, 2006
V Preferential site occupancy observed in co-expandedargon/krypton clustersM. Lundwall, H. Bergersen, A. Lindblad, G. Öhrwall, M.Tchaplyguine, S. Svensson, and O. BjörneholmPhys. Rev. A, 74, 043206, 2006
5
VI Self-assembled heterogeneous argon/neon core-shell clustersstudied by photoelectron spectroscopyM. Lundwall, W. Pokapanich, H. Bergersen, A. Lindblad, T.Rander, G. Öhrwall, M. Tchaplyguine, S. Barth, U. Hergenhahn,S. Svensson, and O. Björneholm(Submitted to J. Chem. Phys.)
VII Femtosecond interatomic coulombic decay in free neonclusters: large lifetime differences between surface and bulkG. Öhrwall, M. Tchaplyguine, M. Lundwall, R. Feifel, H.Bergersen, T. Rander, A. Lindblad, J. Schulz, S. Peredkov,S. Barth, S. Marburger, U. Hergenhahn, S. Svensson, and O.BjörneholmPhys. Rev. Lett. 93, 173401, 2005
VIII Enhanced surface sensitivity in AES relative to XPS observedin free argon clustersM. Lundwall, M. Tchaplyguine, G. Öhrwall, A. Lindblad, S.Peredkov, T. Rander, S. Svensson, and O. BjörneholmSurf. Sci. 594, 12, 2005
IX Shell-dependent core-level chemical shifts observed in freexenon clustersM. Lundwall, R. F. Fink, M. Tchaplyguine, A. Lindblad, G.Öhrwall, H. Bergersen, S. Peredkov, T. Rander, S. Svensson, andO. BjörneholmJ. Phys. B: At. Mol. Opt. Phys. 39, 5225, 2006
X Photon energy dependent intensity variations observed inAuger spectra of free argon clustersM. Lundwall, A. Lindblad, H. Bergersen, T. Rander, G. Öhrwall,M. Tchaplyguine, S. Peredkov, S. Svensson, and O. BjörneholmJ. Phys. B: At. Mol. Opt. Phys. 39, 3321, 2006
XI Pre-Auger photoelectron recapture observed in argonclusters: A photon energy dependent study of Auger spectraM. Lundwall, A. Lindblad, G. Öhrwall, S. Svensson, and O.Björneholm(In manuscript)
6

The following is a list of papers to which I have contributed but that are notincluded in this Thesis.
Observation of elastic scattering effects on photoelectron angulardistributions in free Xe clustersG. Öhrwall, M. Tchaplyguine, M. Gisselbrecht, M. Lundwall, R. Feifel,T. Rander, J. Schulz, R. R. T. Marinho, A. Lindgren, S. L. Sorensen, S.Svensson, O. BjörneholmJ. Phys. B: At. Mol. Opt. Phys., 36, 3937, 2003
The size of neutral free clusters as manifested in the relativebulk-to-surface intensity in core level photoelectron spectroscopyM. Tchaplyguine, R. R. T. Marinho, M. Gisselbrecht, J. Schulz, N.Martensson, S. L. Sorensen, A. Naves de Brito, R. Feifel, G. Öhrwall, M.Lundwall, S. Svensson, O. BjörneholmJ. Chem. Phys., 120, 345, 2004
From localised to delocalised electronic states in free Ar, Kr and XeclustersR. Feifel, M. Tchaplyguine, G. Öhrwall, M. Salonen, M. Lundwall, R. R. T.Marinho, M. Gisselbrecht, S. L. Sorensen, A. Naves de Brito, L. Karlsson, N.Mårtensson, S. Svensson, and O. BjörneholmEuro. Phys. J. D, 30, 343, 2004
Ioniclike energy structure of neutral core-excited states in free KrclustersS. Peredkov, A. Kivimäki, S. L. Sorensen, , J. Schulz, N. Mårtensson, G.Öhrwall, M. Lundwall, T. Rander, A. Lindblad, H. Bergersen, S. Svensson,O. Björneholm, and M. TchaplyguinePhys. Rev. A, 72, 021201(R), 2005
The electronic structure of free water clusters probed by AugerspectroscopyG. Öhrwall, R. F. Fink, M. Tchaplyguine, L. Ojamae, M. Lundwall, R. R. T.Marinho, A. Naves de Brito, S. L. Sorensen, M. Gisselbrecht, R. Feifel, T.Rander, A. Lindblad, J. Schulz, L. J. Sæthre, N. Mårtensson, S. Svensson,and O. BjörneholmJ. Chem. Phys., 123, 054310, 2005
7

Photon energy dependence of fragmentation of small argon clustersM. Gisselbrecht, A. Lindgren, M. Tchaplyguine, F. Burmeister, G. Öhrwall,M. Lundwall, M. Lundin, R. R. T. Marinho, A. Naves de Brito, S. Svensson,O. Björneholm, and S. L. SorensenJ. Chem. Phys 123, 194301, 2005
Postcollision interaction in noble gas clusters; Observation of differencesin surface and bulk line shapesA. Lindblad, R. F. Fink, H. Bergersen, M. Lundwall, T. Rander, R. Feifel, G.Öhrwall, M. Tchaplyguine, U. Hergenhahn, S. Svensson, and O. BjörneholmJ. Chem. Phys., 123, 211101, 2005
Magnetron-based source of neutral metal vapors for photoelectronspectroscopyM. Tchaplyguine, S. Peredkov, H. Svensson, J. Schulz, G. Öhrwall,M. Lundwall, T. Rander, A. Lindblad, H. Bergersen, S. Svensson, M.Gisselbrecht, S. L. Sorensen, L. Gridneva, N. Mårtensson, and O. BjörneholmRev. Sci. Instrum., 77, 033106, 2006
The role of molecular polarity in cluster local structure studied byphotoelectron spectroscopyA. Rosso, T. Rander, H. Bergersen, A. Lindblad, M. Lundwall, S. Svensson,M. Tchaplyguine, G. Öhrwall, L. J. Sætre, and O. BjörneholmAccepted for publication in Chem. Phys. Lett.
8

Comments on my own participation
The works presented in this Thesis are the result of team-work. My contri-bution to the papers has therefore varied but always includes performing theexperiments. In all papers, except number III and VII, my work also involvedthe planning of the projects and doing the data analysis. Finally, in all papers ofwhich I am the first author I was responsible for preparation and finalizationof the manuscripts. Papers IV–VI and IX include theoretical considerationsand calculations. These contributions were not performed by me but providedby other members of our group.
9

Contents
List of Papers . . . . . . . . . . . . . . . . . . . . . . . . . . . . . . . . . . . . . . . . . . . 5Comments on my own participation . . . . . . . . . . . . . . . . . . . . . . . . . . . 91 Populärvetenskaplig sammanfattning . . . . . . . . . . . . . . . . . . . . . . . 132 Introduction . . . . . . . . . . . . . . . . . . . . . . . . . . . . . . . . . . . . . . . . . . 19
2.1 Clusters and nano-particles . . . . . . . . . . . . . . . . . . . . . . . . . . . 192.2 Rare-gas clusters . . . . . . . . . . . . . . . . . . . . . . . . . . . . . . . . . . . 21
3 Methods and concepts . . . . . . . . . . . . . . . . . . . . . . . . . . . . . . . . . . 233.1 Cluster formation . . . . . . . . . . . . . . . . . . . . . . . . . . . . . . . . . . 23
3.1.1 Thermodynamics of an adiabatic expansion . . . . . . . . . . . 233.1.2 Bonding of rare-gas clusters . . . . . . . . . . . . . . . . . . . . . . 253.1.3 Clustering of atoms . . . . . . . . . . . . . . . . . . . . . . . . . . . . . 273.1.4 Geometric structure of rare-gas clusters . . . . . . . . . . . . . . 32
3.2 Electron Spectroscopies . . . . . . . . . . . . . . . . . . . . . . . . . . . . . . 343.2.1 Photoionization . . . . . . . . . . . . . . . . . . . . . . . . . . . . . . . . 343.2.2 Photoelectron spectroscopy . . . . . . . . . . . . . . . . . . . . . . . 353.2.3 Decay processes . . . . . . . . . . . . . . . . . . . . . . . . . . . . . . . 373.2.4 Angular distribution effects . . . . . . . . . . . . . . . . . . . . . . . 40
3.3 Intrinsic and extrinsic scattering processes . . . . . . . . . . . . . . . . 413.3.1 Electron flux attenuation . . . . . . . . . . . . . . . . . . . . . . . . . 41
3.4 Cluster spectrum interpretation . . . . . . . . . . . . . . . . . . . . . . . . 433.4.1 Polarization screening . . . . . . . . . . . . . . . . . . . . . . . . . . . 433.4.2 Line shapes and line widths . . . . . . . . . . . . . . . . . . . . . . . 46
4 Experimental equipment . . . . . . . . . . . . . . . . . . . . . . . . . . . . . . . . 514.1 High vacuum (HV) . . . . . . . . . . . . . . . . . . . . . . . . . . . . . . . . . 514.2 Synchrotron radiation . . . . . . . . . . . . . . . . . . . . . . . . . . . . . . . 524.3 Beamline I411 . . . . . . . . . . . . . . . . . . . . . . . . . . . . . . . . . . . . . 534.4 Cluster production . . . . . . . . . . . . . . . . . . . . . . . . . . . . . . . . . . 55
5 Results . . . . . . . . . . . . . . . . . . . . . . . . . . . . . . . . . . . . . . . . . . . . . . 575.1 Heterocluster structure . . . . . . . . . . . . . . . . . . . . . . . . . . . . . . . 575.2 Decay processes in clusters . . . . . . . . . . . . . . . . . . . . . . . . . . . 63
6 Summary and outlook . . . . . . . . . . . . . . . . . . . . . . . . . . . . . . . . . . 69Acknowledgements . . . . . . . . . . . . . . . . . . . . . . . . . . . . . . . . . . . . . . . 71A Adiabatic expansion into vacuum . . . . . . . . . . . . . . . . . . . . . . . . . . 73B Nomenclature of electron spectroscopy . . . . . . . . . . . . . . . . . . . . . 77Bibliography . . . . . . . . . . . . . . . . . . . . . . . . . . . . . . . . . . . . . . . . . . . . 79


1. Populärvetenskaplig sammanfattning
Alla material i vår vardag har en yta och ett inre, en så kallad bulk. Ytan ärintressant av flera anledningar. Exempelvis sker kemiska reaktioner på ytoroch inte inne i fasta material. Ett koppartak blir grönt med tiden eftersomsyret i luften reagerar med kopparytan, men putsar man taket blir det blanktigen eftersom syret bara påverkat de yttersta lagren av atomer i taket.
Forskningen som presenteras i den här avhandlingen handlar till stor del omjust ytor, nämligen ytan på nanopartiklar eller så kallade kluster. Ett kluster ären liten samling atomer som är bundna till varandra. Kluster kan bestå av alltfrån tiotals till tusentals atomer. I denna avhandling är det största studeradeklustret ungefär 12 nanometer (nm, miljarddels meter) och det minsta 1,5 nmi diameter, vilket motsvarar 30 000 respektive 60 atomer bundna till varandra.Figur 1.1 illustrerar längdskalan från vardagliga föremål ner till atomen, ochett kluster finns inritat i nanometerområdet.
Kluster är intressanta eftersom egenskaper hos material ofta förändras medstorleken på systemet. Exempelvis är smältpunkten för rent guld i ett stortsystem, som en vigselring, 1065C, medan smältpunkten för ett guldklusterav 140 atomer bara är 227C.
När vi ska studera ett material måste vi välja ett passande verktyg. I vårvardag studerar vi ofta omgivningen med hjälp av vår känsel eller syn. Om viblundar kan vi exempelvis känna formen på en fotboll, men fingrarnas käns-lighet räcker inte för att studera så små saker som kluster — hudens känsel-celler sitter helt enkelt för långt isär.
För ögat finns en del hjälpverktyg att ta fram när vår normala synskärpainte räcker till. Astronomer använder teleskop för att se Jupiters månar, ochbiologer kan med hjälp av mikroskop förstora så små ting som bakterier såatt de blir synliga för ögat. Båda dessa observationsmetoder bygger på attögat uppfattar ljuset som bakterien eller månen reflekterar från en lampa ellersolen. Detta innebär en begränsning för vad som är möjligt att studera, ävenmed de mest fantastiska optiska verktygen.
Ljuset som ögat klarar av att uppfatta har nämligen ett begränsatvåglängdsområde. Olika våglängder ser vi som olika färger. I de två ändarnaav den synliga ljusskalan finns violett ljus med våglängden 400 nm och röttljus med våglängden 650 nm. Alla andra färger ryms där emellan. Dettalängdområde finns markerat som synligt ljus i Figur 1.1. Ljus kan barareflekteras mot ett föremål som är minst lika stort (i meter) som våglängdenpå ljuset (i meter). En fotboll reflekterar synligt ljus eftersom den är mycket
13

Fotbollsplan
Människa
Fotboll
Knappnål
Bakterie
Kluster
Atom
1 km
1 m
1 cm
1 mm
1 mikro
meter
1 nanomete
r
103 102 10-1 10-2 10-3 10-4 10-5 10-6 10-7 10-8 10-9 10-10 10 1
Radiovågor
Mikro
vågor
Infra
röd
Synligt l
jus
Ultravio
lett
Röntgen
Våglängd
Figure 1.1: Illustration av kopplingen mellan längdskala och våglängd där bland annatdet synliga våglängdsområdet finns markerat. Tack till B. Wickström för figuren.
större än våglängden på ljuset. Detta sätter en undre gräns för storleken påpartiklar som kan reflektera synligt ljus, alltså 400 nm. Figur 1.1 visar attnanokluster är mindre än våglängden på synligt ljus. De är därför osynligaför människoögat. Små partiklar måste därför studeras med andra verktygän känsel och syn. För att kunna göra detta behöver vi veta hur atomer äruppbyggda.
En atom består av negativt laddade elektroner som omger en kärna som isin tur innehåller neutrala neutroner och positivt laddade protoner. Vilket avde olika atomslagen i periodiska systemet, till exempel guld, kol eller argon,som kärnan och elektronerna tillsammans bildar beror på antalet protoner ikärnan. Antalet elektroner är sedan lika många som protonerna i kärnan. Vi-dare har atomer en väldigt strikt struktur. För att illustrera detta kan vi betraktaatomen som en sjö med fiskar i, där fiskarna representerar elektroner och bot-tnen atomkärnan.
I en normal sjö finns många olika sorters fisk och inga regler bestämmeri vilken riktning de får simma (Figur 1.2a). Livet i atomsjön är däremot merbegränsat (Figur 1.2b). Det finns bara en typ av ”fisk” (alla elektroner är lika)och de tillåts bara simma på vissa bestämda ”djup”. I atomen kallas dessa djupför energinivåer (Figur 1.2c). Olika många fiskar är tillåtna på olika djup ochen fisk som befinner sig på ett djup är förbjuden att på egen hand simma till ettannat. Det är bara genom yttre påverkan, alltså tillförsel av energi, som dettafår ske.
14
Elektroner
Atomkärna
c. Atom
Foton
Energinivåer
Sjöbotten
b. Atomsjö
Sjöbotten
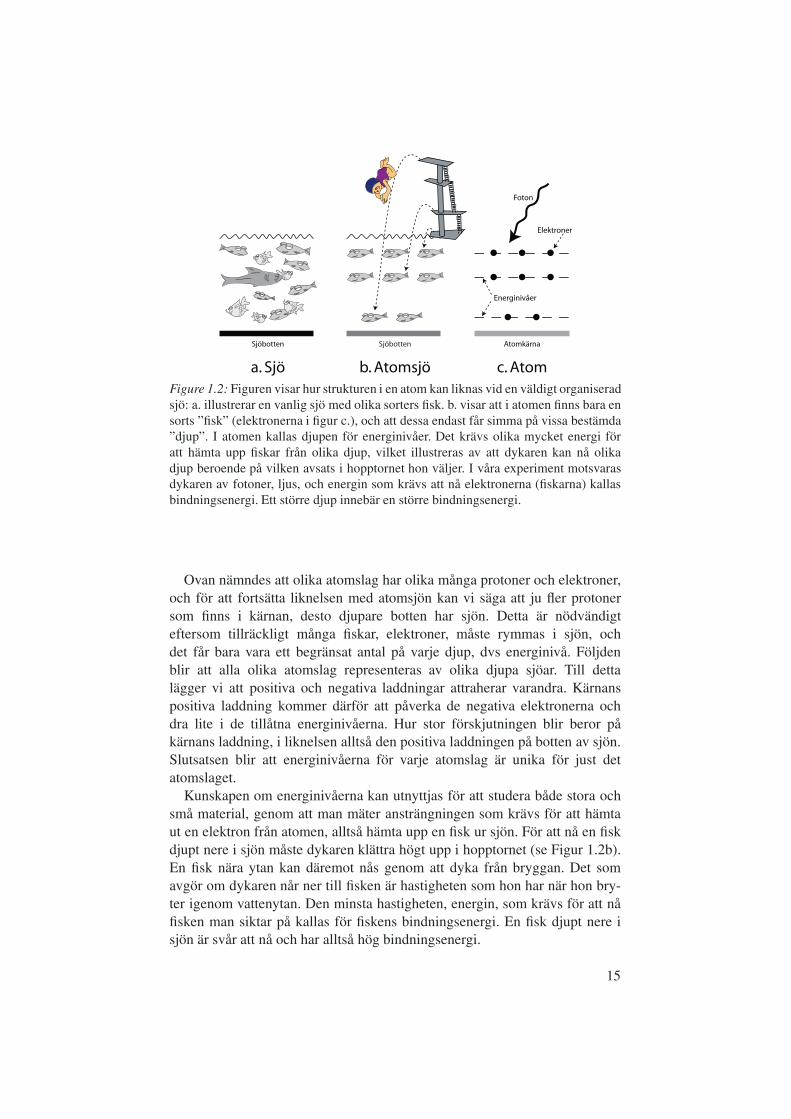
a. SjöFigure 1.2: Figuren visar hur strukturen i en atom kan liknas vid en väldigt organiseradsjö: a. illustrerar en vanlig sjö med olika sorters fisk. b. visar att i atomen finns bara ensorts ”fisk” (elektronerna i figur c.), och att dessa endast får simma på vissa bestämda”djup”. I atomen kallas djupen för energinivåer. Det krävs olika mycket energi föratt hämta upp fiskar från olika djup, vilket illustreras av att dykaren kan nå olikadjup beroende på vilken avsats i hopptornet hon väljer. I våra experiment motsvarasdykaren av fotoner, ljus, och energin som krävs att nå elektronerna (fiskarna) kallasbindningsenergi. Ett större djup innebär en större bindningsenergi.
Ovan nämndes att olika atomslag har olika många protoner och elektroner,och för att fortsätta liknelsen med atomsjön kan vi säga att ju fler protonersom finns i kärnan, desto djupare botten har sjön. Detta är nödvändigteftersom tillräckligt många fiskar, elektroner, måste rymmas i sjön, ochdet får bara vara ett begränsat antal på varje djup, dvs energinivå. Följdenblir att alla olika atomslag representeras av olika djupa sjöar. Till dettalägger vi att positiva och negativa laddningar attraherar varandra. Kärnanspositiva laddning kommer därför att påverka de negativa elektronerna ochdra lite i de tillåtna energinivåerna. Hur stor förskjutningen blir beror påkärnans laddning, i liknelsen alltså den positiva laddningen på botten av sjön.Slutsatsen blir att energinivåerna för varje atomslag är unika för just detatomslaget.
Kunskapen om energinivåerna kan utnyttjas för att studera både stora ochsmå material, genom att man mäter ansträngningen som krävs för att hämtaut en elektron från atomen, alltså hämta upp en fisk ur sjön. För att nå en fiskdjupt nere i sjön måste dykaren klättra högt upp i hopptornet (se Figur 1.2b).En fisk nära ytan kan däremot nås genom att dyka från bryggan. Det somavgör om dykaren når ner till fisken är hastigheten som hon har när hon bry-ter igenom vattenytan. Den minsta hastigheten, energin, som krävs för att nåfisken man siktar på kallas för fiskens bindningsenergi. En fisk djupt nere isjön är svår att nå och har alltså hög bindningsenergi.
15
Eftersom energinivåerna är unika för varje atomslag så är bindnings-energierna som är kopplade till varje nivå också unika. Slutsats: genom attmäta energin som krävs för att hämta ut elektronerna från atomen kan vibestämma vilket atomslag, till exempel guld, kol eller syre, elektronen satt i,trots att atomen är osynlig för ögat.
I våra experiment motsvaras dykaren av fotoner (neutrala energibärare),ljus, som tillför energi till elektronerna. Elektronerna som hämtats ur atomernaav fotoner fångas upp av en så kallad elektronspektrometer. Tekniken kallasfotoelektronspektroskopi och kan användas till mer än att bara bestämma ivilket atomslag elektronen satt — man kan faktiskt även få veta en del omatomens grannar också. Det går att ta reda på både hur många grannarna är,och vilka atomslag de tillhör, eftersom precis som att den positiva laddningenfrån kärnan påverkar elektronernas energinivåer, så påverkar även de negativaelektronladdningarna i grannatomerna den studerade atomens energinivåer —lika laddningar stöter som bekant bort varandra. Storleken på laddningen,alltså hur många elektroner grannarna har, och avståndet till dessa bestäm-mer hur stor påverkan blir på den studerade atomens energinivåer och alltsåäven på elektronernas bindningsenergi.
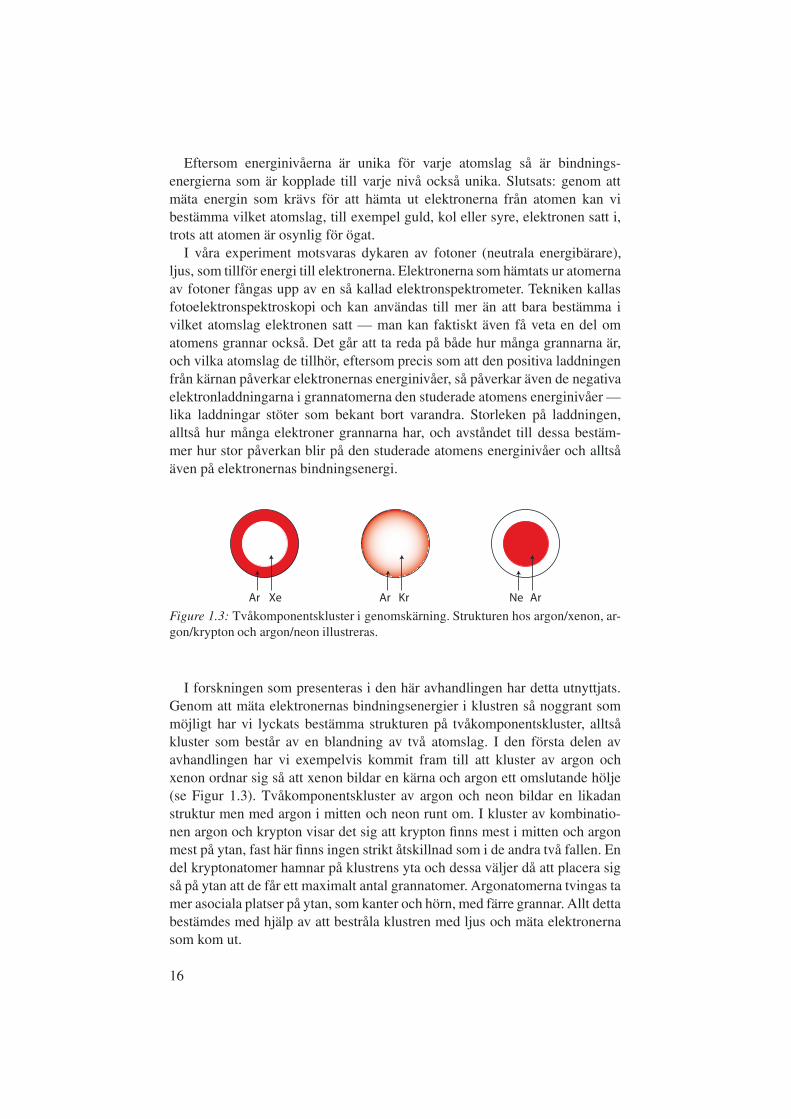
Ar Xe Ar Kr Ne Ar
Figure 1.3: Tvåkomponentskluster i genomskärning. Strukturen hos argon/xenon, ar-gon/krypton och argon/neon illustreras.
I forskningen som presenteras i den här avhandlingen har detta utnyttjats.Genom att mäta elektronernas bindningsenergier i klustren så noggrant sommöjligt har vi lyckats bestämma strukturen på tvåkomponentskluster, alltsåkluster som består av en blandning av två atomslag. I den första delen avavhandlingen har vi exempelvis kommit fram till att kluster av argon ochxenon ordnar sig så att xenon bildar en kärna och argon ett omslutande hölje(se Figur 1.3). Tvåkomponentskluster av argon och neon bildar en likadanstruktur men med argon i mitten och neon runt om. I kluster av kombinatio-nen argon och krypton visar det sig att krypton finns mest i mitten och argonmest på ytan, fast här finns ingen strikt åtskillnad som i de andra två fallen. Endel kryptonatomer hamnar på klustrens yta och dessa väljer då att placera sigså på ytan att de får ett maximalt antal grannatomer. Argonatomerna tvingas tamer asociala platser på ytan, som kanter och hörn, med färre grannar. Allt dettabestämdes med hjälp av att bestråla klustren med ljus och mäta elektronernasom kom ut.
16

Den andra delen av avhandlingen studerar vad som händer med atomernanär en elektron tagits bort från atomen, alltså när det saknas en fisk i atomsjön,och hur vi kan utnyttja detta för att lära oss ännu mer om klustren. Eftersompositiva och negativa laddningar attraherar varandra fylls elektronerna i enatom alltid på från botten och upp. Helst av allt skulle alla elektroner viljavara i en energinivå närmast den positiva kärnan, med det går inte eftersomdet bara får plats ett begränsat antal på varje nivå. Men, när en elektron harhämtats ut ur atomen från en djup energinivå kommer elektronerna i nivåernärmare ytan känna att det finns en plats ledig i en bekvämare, djupare nivå.Detta leder till att en elektron från en nivå närmare ytan får hoppa ner och taden lediga platsen i den djupa energinivån (se Figur 1.4). Resultatet blir attatomen plötsligt har ett överskott av energi — skillnaden i bindningsenergimellan nivån elektronen lämnar och nivån den hoppar till är en energivinstför systemet. Denna energi måste avges på något sätt och atomen löser dettagenom att skicka iväg en elektron från den ytligaste energinivån. Elektronenfår då ta med sig atomens överskottsenergi i form av kinetisk energi, alltsåhastighet. Hög hastighet motsvarar hög kinetisk energi. I liknelsen med atom-sjön motsvaras denna process av att i samma ögonblick som en fisk simmarner till den djupare energinivån kastas en fisk spontant upp ur sjön. I fysikenkallas denna process Augersönderfall, efter den franske fysikern Pierre Auger(1899–1993), och elektronerna som kastas ut ur atomen kallas Augerelek-troner.
Atomkärna
AtomAtomsjö
Sjöbotten
Figure 1.4: Illustration av vad som sker i en atom när det saknas en elektron i endjup energinivå. En elektron från en nivå nära ytan kommer att hoppa ner och fylladen lediga platsen. Processen leder till ett energiöverskott som måste avyttras. Dettalöser atomen genom att kasta ut en elektron som får ta med sig energiöverskottet somkinetisk energi.
I våra studier mäts den kinetiska energin, hastigheten, hos Augerelek-tronerna av elektronspektrometern. Den uppmätta energin berättar omavståndet mellan de olika energinivåerna i atomen, vilket ju avgjordehur mycket överskottsenergi atomen behövde bli av med. Resultatensom presenteras i den andra delen av den här avhandlingen beskriver
17

hur informationen om energinivåernas djup relativt varandra påverkas avgrannatomer och hur detta kan användas för att få fram information omklustrens struktur.
Ovan nämndes att kemiska reaktioner sker på ytor och ett koppartak togssom exempel. Om kopparplåten på taket hade byggts av kopparkluster, ochinte tätt packade atomer, hade plåten inte bara haft yta mot solen och mot tak-bjälkarna, utan faktiskt också yta inne i själva materialet. Om vi liknar klustrenvid fotbollar skulle materialet kunna liknas vid ett rum fyllt av hårt pumpadefotbollar — det kommer att finnas massor av tomrum mellan bollarna ävennär rummet fyllts till taket. Detta innebär att en större yta är exponerad motluft och alltså tillgänglig för kemiska reaktioner. Materialet har nu inte baraen yta som är lika med arean av taket utan ytan beror även på materialetsvolym. Ett tjockt material byggt av kluster har alltså mer yta än ett tunt. Taketdär plåten är uppbyggd av kopparkluster skulle alltså bli grönt inte bara påytan mot solen utan hela vägen igenom till takbjälkarna. Detta är kanske inteåtråvärt i ett tak, men för tillämpningar i kemiska industrin är det intressant attnanomaterial med liten volym och liten vikt maximerar effekten av en önskadprocess.
Metoderna som utvecklats i de arbeten som presenteras i denna avhandlingkan i framtiden användas till studier av material som exempelvis kopparklus-terplåten. Fotoelektronspektroskopi och Augerelektronspektroskopi är bådavitt spridda och etablerade experimentella metoder i studier av fria atomeroch molekyler samt av fasta material men det är först nu som teknikerna harbörjat tillämpas på kluster och forskningen som presenteras här visar att de ärkraftfulla metoder även i nano-området. I avhandlingens första del har vi visatdet är möjligt att avläsa ytstrukturen på kluster, och den andra delen angriperklustrens struktur genom att studera Augerelektroner. Analysmetoderna somutvecklats och de processer som upptäckts i den sistnämnda studien har bety-delse inte bara inom klusterforskningen utan även i studier av fasta materialdär Augerelektronspektroskopi används.
18

2. Introduction
The main subject of this Thesis is cluster science. The word "cluster" maygive associations in numerous directions since "to cluster" generally meansto gather something into a small group. In music a cluster is a chord consist-ing of three or more notes spaced only a semitone apart. Astronomers speakof a cluster when they mean a group of galaxies, or stars, that are gravita-tionally interacting in space. In this work a cluster is a small group of atoms.More strictly, we define our clusters to be a finite group of atoms or moleculesbonded together. In recent years atomic clusters have also adopted the namenano-particles.
2.1 Clusters and nano-particlesInvestigations of clusters and nano-particles are pursued with a multitude ofmotivations ranging from optimization of the conductivity, magnetic proper-ties, and electronic properties of a material to tailoring substances for use inchemical reactions or for catalysis. Clusters of deuterated methane are usedto study fusion [1] while carbon nano-structures are used in such widely sep-arated areas as safe hydrogen storage [2, 3] and to increase the durability innew materials for fighter jets and motorcycle helmets. Much of the activity inthis research area is connected to the fact that matter has different propertiesin the macroscopic solid than in the nano-scaled size regime.
The most striking difference, geometrically, between the macroscopic solidand a nano-cluster is the surface fraction, i.e. the number of atoms on the sur-face of the material compared to the total number of atoms in the material.This has many implications. One of the basic assumptions in solid state sci-ence is that the surface of the material may be neglected. This is valid for themacroscopic solid since the atoms situated in the interior of the material, theso-called bulk, far outnumber the atoms on the surface. The situation is dif-ferent in nano-clusters. The left graph of Figure 2.1 shows the cluster surfacefraction as a function of cluster size. Small clusters almost entirely consist ofsurface atoms; a cluster of 13 atoms has a surface percentage of 92%. A largecluster also has a considerable amount of surface atoms; a spherical cluster often thousand atoms (diameter∼10 nm) has a surface percentage of about 25%.Thus, the fraction of surface atoms in the material is no longer negligible whenthe dimensions reach the nano-scale, and the basic solid-state assumption isno longer valid.
19

Mel
ting
tem
pera
ture
(K
)
Gold cluster size (N)
0
200
400
600
800
1000
1200
1400
10000 1000 100 10 1
Sur
face
per
cent
age
(%)
Cluster size (N-1/3)
Cluster size (N)
00.10.0 0.2 0.3 0.4 0.5
10
20
30
40
50
60
70
80
90
100101001000∞
∞
Figure 2.1: To the left a graph of the cluster surface fraction (number of surfaceatoms/total number of atoms in the cluster) as a function of cluster size is displayed.The right graph shows the melting temperature in gold clusters as a function of clustersize N [4]. The dashed line shows the melting temperature for bulk gold (1338 K).
An example of a property that changes drastically from the solid bulk valuewhen the nano size-range is reached is melting temperature. The right graph inFigure 2.1 shows calculated melting temperatures for gold clusters as a func-tion of cluster size [4]. In bulk gold the melting temperature is 1338 K [5], butas the number of atoms in the ensemble is decreased also the melting temper-ature drops. A cluster of 140 gold atoms has a melting temperature of 500 K,i.e. only 37% of the bulk value. When even smaller cluster sizes are probedthe smooth trend predicted for the gold melting temperature does not hold. Insodium clusters large variations in melting temperatures, ±30 K, have beenobserved for clusters of 70 to 200 atoms [6]. This cluster size regime is wherethe so-called size specific cluster effects occur [7]. Especially dramatic varia-tions occur when the cluster size is near a so-called magic number, i.e. whenthe cluster has a geometrically, or electronically, closed shell structure [8].
Chemical reactions take place on the surface of solid matter, not in the bulk.Therefore, the large surface fraction of clusters may play an important role infinding efficient surfaces for chemistry. In the future, if materials are builtby clusters in a lattice, the material would receive a large surface fractioncompared to the ordinary solid. Hence the surface area per volume, and theavailable surface for reactions to occur, is increased. Furthermore, since theband gap in semiconducting clusters may be tuned by altering the cluster size,a potential use could be solar cells. Absorption of visible light occurs in thesurface layer of matter and therefore cluster built matter with great surfacefraction are of interest also in energy production community.
20

2.2 Rare-gas clustersIn order to fully exploit the potential of the nano-sized particles, it is impor-tant to understand and control the systems. The quest for such knowledge andskills is non-trivial since many obstacles must be overcome along the path.The production of clusters is the first obvious challenge, how to probe themthe second, and interpretation of data the third. In this Thesis clusters of therare-gas elements are investigated. Rare-gases in the solid phase are bondedby so-called van der Waals forces. The non-directionality of the bonds formedin rare-gas clusters is common with the metallic bonding. Rare-gas clustersshow the same structures and size dependent structural transitions as metalclusters [9, 10]. Hence, for structural investigations of metal nano-clusters,rare-gas clusters are suitable model systems. This is favorable since the con-densation of rare-gas atoms into clusters is well-studied and allows for clus-ter production in sufficient abundance to allow detection by electron spectro-scopies, our investigative tool of choice. This is more complicated to achievefrom metal clusters sources.
Chapter 3 in this Thesis describes the physics behind our cluster productionsource. Also the techniques we use to probe the clusters as well as a sectionon cluster spectrum interpretation is given in that chapter. Three electron spec-troscopy techniques have been used to obtain information: Ultraviolet Photo-electron Spectroscopy (UPS), X-ray Photoelectron Spectroscopy (XPS), andAuger Electron Spectroscopy (AES). These methods are all photon in — elec-tron out techniques. The presented research was performed at a synchrotronradiation facility. This type of light sources is presented in Chapter 4 alongwith a brief description of the electron analyzer and other important parts ofthe experimental set-up.
The Papers presented in this Thesis can be divided into two groups: thosereporting on cluster spectrum interpretation and those investigating geomet-rical structures of heterogeneous clusters. The latter group shows how themethod of heterogeneous cluster production, co-expansion or doping/pick-up,influences the cluster structure. We learn that heterogeneous clusters with forexample argon atoms on the surface of a krypton cluster may be producedby co-expansion, while the reverse structure, placing argon in the core andkrypton on the surface, may be achieved using the doping/pick-up technique.In this specific case, the analysis of the spectra also shows that the surfacestructure is similar in both these cases. The width and energy position of thesignal from the krypton atoms on the cluster surface show that only high co-ordination sites are occupied. Hence, clusters with the same surface structure,but drastically different radial composition, may be produced. When design-ing surfaces for chemical reactions, as discussed above, this result may in thefuture contribute to the cost-minimization when combining two elements totailor a desired surface structure.
21

The question of what information is available in electron spectra of clus-ters is set in the first topic group mentioned above. The challenging workof assigning physical meaning to the peaks recorded in the experiment hasbeen undertaken, both in the more established UPS and XPS cluster prob-ing techniques, but especially in the, for cluster research more unusual, AEStechnique. The characteristic parameters are energy position, line shape, linewidth, and intensity. In the interpretation of AES spectra the effects of electronscattering in the clusters becomes an important parameter. For example, suchan exotic process as photoelectron recapture is observed in the AES spectra ofargon clusters. Accurate interpretation of AES spectra is of great importancesince it is a commonly used tool for investigating matter in both academiaand industry. An important advantage in studying free clusters in supersonicbeams, as done here, is that it allows for measuring the energy positions of thecluster features relative to their their atomic, monomer reference. The methodfor spectrum analysis and the discussion of scattering processes in the clus-ters, presented in this Thesis are necessary steps on the way towards using thefull potential of the experimental technique on solid samples. These resultsare among those presented in the Papers of the Thesis, which are summarizedin Chapter 5.
22

3. Methods and concepts
In this chapter the essential concepts of the research presented in this The-sis are discussed. The experimental study of clusters require methods to pro-duce them, as well as techniques for investigation of matter. In the follow-ing sections the cluster formation and bonding is described as well as theelectron spectroscopy methods used to probe the clusters. Also, the effect ofcharged particle interactions with matter is discussed in the context of spec-trum analysis.
3.1 Cluster formationAtoms and molecules are found in the gas, the liquid, or the solid phase de-pending on temperature and pressure. Water is a well-known example. Thewater molecule exists as a free molecule in the gas phase before forming raindrops in the clouds, it is found in the liquid phase in the oceans, and in thesolid phase at the home of the Leksand Stars ice-hockey team. We are lessused to the rare-gases in the solid or liquid phases. This is due to the veryweak bonding those elements are capable of, which leads to very low boilingpoints. For example, the boiling temperature of argon is −186C, at atmo-spheric pressure. In order to study aggregates of such elements it is necessaryto cool the gas extensively. This is discussed below, as well as the geometricstructure rare-gas clusters form in the solid phase.
3.1.1 Thermodynamics of an adiabatic expansionIn this Thesis we use a cluster source where a gas is expanded from a highpressure volume through a nozzle into vacuum. The temperature of the gas iscritical for the cluster formation process. Therefore, below the effect of theexpansion on the gas temperature is discussed using thermodynamics.
The expansion of gases in the cluster source is adiabatic, which implies thatthere is no heat transfer Q into or out of the system, or ∆Q = 0 [11]. Thisis of course an idealization, but a system can be viewed as adiabatic if it iswell insulated, or if the process takes place so rapidly that there is no timefor significant heat transfer. The latter case is applicable to the particle beamproduced by the adiabatic expansion source. Such expansions may changethe temperature of the gas which will be showed below. First we recall thedefinitions of the first and second laws of thermodynamics:
23

i First law of thermodynamics: The total energy in a closed system isconstant. Since the system considered here is at rest and unaffectedby electric, magnetic, and gravitational fields, the first law of thermo-dynamics may be formulated as:
Q = ∆U +W, (3.1)
∆U is the change in internal energy, Q is the heat transfer into or outof the system, and W is the work done on the system by the surround-ing. W includes all types of work: mechanical, electric, magnetic andwork associated with the chemical potential, µ . The work required toadd a particle to a thermodynamic system is defined as: δW = µdN.
ii Second law of thermodynamics: The total entropy in a closed systemmay increase but never decrease. In an isolated system this may beexpressed as:
∆S≥∆QT
(3.2)
Here ∆S is the change in entropy, ∆Q is the heat change in the system,and T is the temperature of the system. In Eq. 3.2 the = is valid forreversible and adiabatic processes and the > is true for irreversibleprocesses.
The internal energy (U ) is the sum of the kinetic energies of all particles inthe system. Also the relativistic rest mass and the potential energy of the inter-actions among the particles are included in U . The entropy, S, is a quantitativemeasure of the disorder in the system. When a system is in a macroscopicstate, the particles that make up the system may be in any of Ω possible mi-croscopic states. The greater the number Ω, the greater the entropy: S = k lnΩ,where k is the Boltzmann constant.
In the present case the special case of gas expansion into vacuum is of inter-est. This means that there is no matter for the expanding gas to interact with,and hence work on the surrounding is impossible. For an adiabatic expansion(∆Q = 0) of an ideal gas into vacuum we arrive at dW = −pvacuumdV = 0.Using the first law of thermodynamics (Eq. 3.1) this leads to dU = 0, i.e. thereis no change in internal energy. Since the gas is ideal there are no interatomicforces and therefore no internal work is associated with the internal motion ofthe gas. The kinetic energy of the gas is therefore conserved and no tempera-ture change is possible in an adiabatic expansion of an ideal gas into vacuum.
However, for a non-ideal gas, van der Waals forces are present betweenthe atoms and this may introduce a temperature change in an expansion. Inorder to investigate this the internal energy is expressed as a function of tem-perature and volume, U(T,V ). To do this both the first and the second lawsof thermodynamics must be considered, and the derivation therefore has itsstarting point in the central law of thermodynamics:
24

dU = T dS− pdV +∑i
µidNi (3.3)
By using the van der Waals law for non-ideal gases as an approximation of theinteractions present in a real gas it is possible to show that adiabatic expansionof a van der Waals gas does lead to a temperature change [12]:
T2 = T1 −a
CVVm,1(3.4)
T1,2 denotes the temperature before and after the expansion, a is describesthe intermolecular attraction in the gas, CV is the heat capacity of the gas atconstant volume, and Vm,1 is the molar volume before the expansion. The fullderivation is shown in Appendix A.
Since a, CV , and Vm all are positive quantities Eq. 3.4 shows that adiabaticexpansion of a van der Waals gas into vacuum results in a temperature de-crease. The cooling associated with the gas expansion is the key point in thecluster source used in experiments presented in this Thesis since cold condi-tions may cause gas to condensate into clusters. In rare-gas cluster productionalso the translational temperature plays an important role. This is discussedfurther in Section 3.1.3
3.1.2 Bonding of rare-gas clustersThe rare gases have fully occupied outer electronic shells. Consequently, therare gases are, under normal conditions, inert and do not take part in bond-ing. However, if cold enough the gases will go through a phase transition andbecome liquid or solid. In the condensed phase van der Waals bonds hold therare gases together.
The attractive contribution to the van der Waals interaction is due to dis-persive forces. This force is due to instantaneous dipoles which arise duringthe fluctuations in the electron clouds. An instantaneous dipole in a atom caninduce a dipole in neighboring atoms, giving rise to an attractive inductiveeffect. The repulsive contribution to the van der Waals interaction has its ori-gin in the Pauli principle, which prohibits any two electrons in a system fromhaving the same set of quantum numbers (see Appendix B). Same spin elec-trons of neighboring atoms are therefore prohibited from occupying the sameregion of space. Hence, at short interatomic distances the two nuclei will beincompletely shielded due to the reduced electron density in the internuclearregion. This results in a short-range nuclear repulsion.
Not all electrons in an atom participate in the bonding. It is fluctuationsin the valence orbitals (see Appendix B) which are responsible for the vander Waals interaction. The spectral consequence of the van der Waals bondis the so-called band formation of the electrons in the valence orbitals of thecondensed system. In argon the band formation arises due to many filled and
25
closely spaced 3p-shells. Since the bonding interaction distorts the energy lev-els the photoelectron signal from the clusters will not be sharp lines as in theatomic case. Instead a broad feature appears in the spectrum. An example ofthis is shown in Section 3.2.2 where photoelectron spectra are discussed inmore detail.
3 4 5 6
-25
-20
-15
-10
-5
0
5
10
15
3 4 5 6
-25
-20
-15
-10
-5
0
5
10
15
Ne2
Kr2
Xe2
Ar-Xe
Ar-Ne
Ar2 Ar2
Ar-Kr
Internuclear distance (Å)Internuclear distance (Å)
Pote
nti
al e
ner
gy
(meV
)
Pote
nti
al e
ner
gy
(meV
)
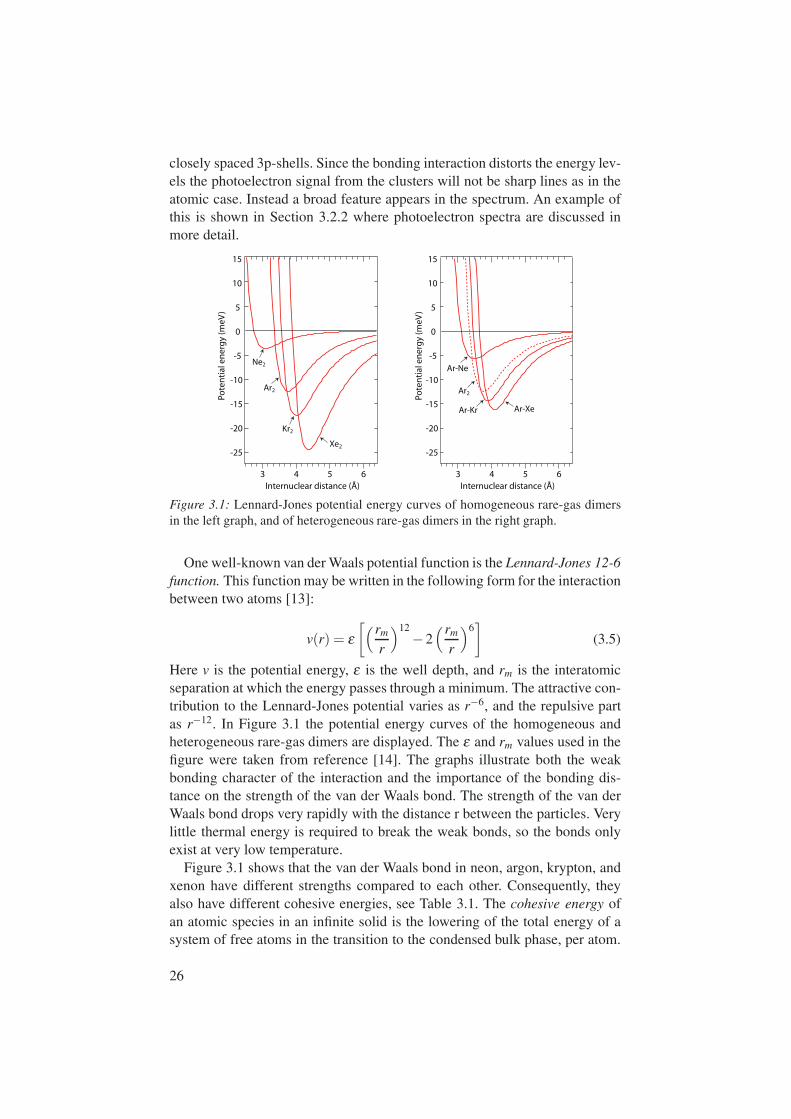
Figure 3.1: Lennard-Jones potential energy curves of homogeneous rare-gas dimersin the left graph, and of heterogeneous rare-gas dimers in the right graph.
One well-known van der Waals potential function is the Lennard-Jones 12-6function. This function may be written in the following form for the interactionbetween two atoms [13]:
v(r) = ε[(rm
r
)12−2
(rm
r
)6]
(3.5)
Here v is the potential energy, ε is the well depth, and rm is the interatomicseparation at which the energy passes through a minimum. The attractive con-tribution to the Lennard-Jones potential varies as r−6, and the repulsive partas r−12. In Figure 3.1 the potential energy curves of the homogeneous andheterogeneous rare-gas dimers are displayed. The ε and rm values used in thefigure were taken from reference [14]. The graphs illustrate both the weakbonding character of the interaction and the importance of the bonding dis-tance on the strength of the van der Waals bond. The strength of the van derWaals bond drops very rapidly with the distance r between the particles. Verylittle thermal energy is required to break the weak bonds, so the bonds onlyexist at very low temperature.
Figure 3.1 shows that the van der Waals bond in neon, argon, krypton, andxenon have different strengths compared to each other. Consequently, theyalso have different cohesive energies, see Table 3.1. The cohesive energy ofan atomic species in an infinite solid is the lowering of the total energy of asystem of free atoms in the transition to the condensed bulk phase, per atom.
26
The cohesive energy can therefore be regarded as a measure of the maximumbinding energy of an atom in the material. The binding energy per atom ishigher in the bulk than on the surface due to the greater number of neighborsin the bulk. The lower binding energy for surface atoms can be described as anenergy cost known as the surface energy. To minimize the total energy of theclusters they, in analogy to water droplets, adopt spherical shapes (ideally),minimizing the fraction of surface atoms and thus minimizing the surface en-ergy and maximizing the total binding energy of the system.
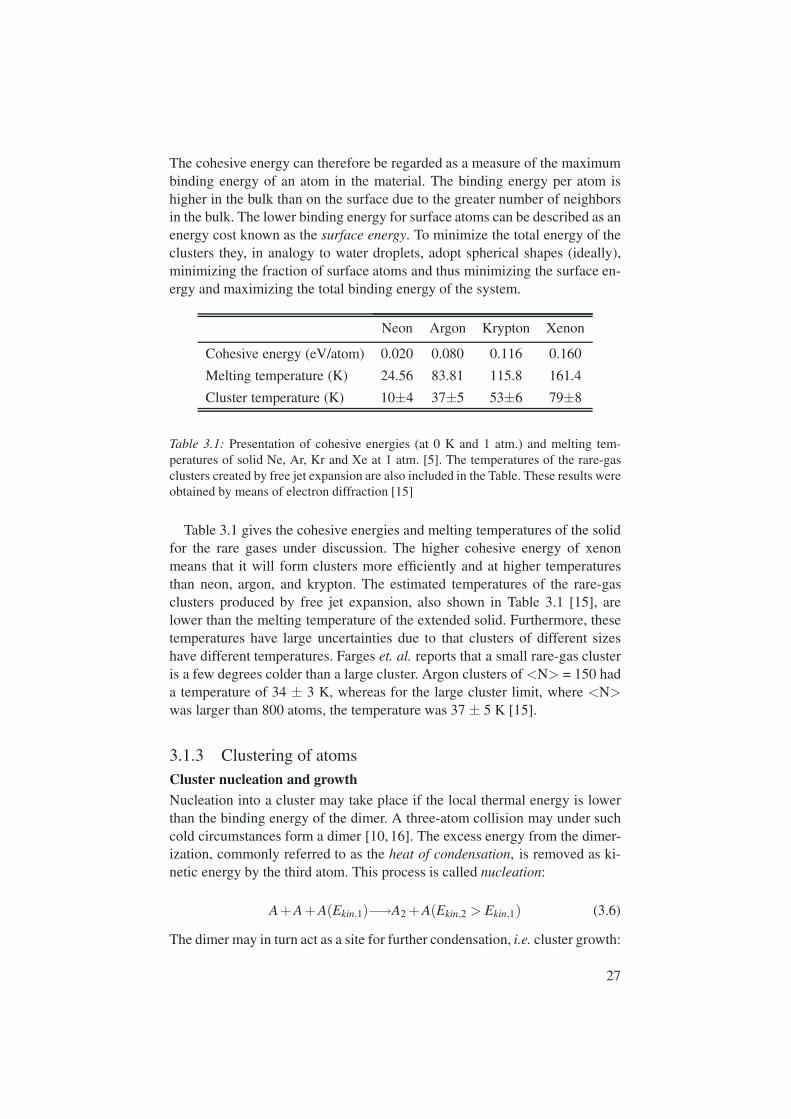
Neon Argon Krypton Xenon
Cohesive energy (eV/atom) 0.020 0.080 0.116 0.160
Melting temperature (K) 24.56 83.81 115.8 161.4
Cluster temperature (K) 10±4 37±5 53±6 79±8
Table 3.1: Presentation of cohesive energies (at 0 K and 1 atm.) and melting tem-peratures of solid Ne, Ar, Kr and Xe at 1 atm. [5]. The temperatures of the rare-gasclusters created by free jet expansion are also included in the Table. These results wereobtained by means of electron diffraction [15]
Table 3.1 gives the cohesive energies and melting temperatures of the solidfor the rare gases under discussion. The higher cohesive energy of xenonmeans that it will form clusters more efficiently and at higher temperaturesthan neon, argon, and krypton. The estimated temperatures of the rare-gasclusters produced by free jet expansion, also shown in Table 3.1 [15], arelower than the melting temperature of the extended solid. Furthermore, thesetemperatures have large uncertainties due to that clusters of different sizeshave different temperatures. Farges et. al. reports that a small rare-gas clusteris a few degrees colder than a large cluster. Argon clusters of <N> = 150 hada temperature of 34 ± 3 K, whereas for the large cluster limit, where <N>was larger than 800 atoms, the temperature was 37 ± 5 K [15].
3.1.3 Clustering of atomsCluster nucleation and growthNucleation into a cluster may take place if the local thermal energy is lowerthan the binding energy of the dimer. A three-atom collision may under suchcold circumstances form a dimer [10, 16]. The excess energy from the dimer-ization, commonly referred to as the heat of condensation, is removed as ki-netic energy by the third atom. This process is called nucleation:
A + A + A(Ekin,1)−→A2 + A(Ekin,2 > Ekin,1) (3.6)
The dimer may in turn act as a site for further condensation, i.e. cluster growth:
27

AN + A−→AN+1 (3.7)
Smaller clusters may also collide and form larger clusters in so-called coales-cence:
AN + AM−→AN+M−k + kA (3.8)
The increase of internal energy, due to the heat of condensation of addedatoms, generally cause the produced clusters to be hot, often close to meltingtemperature, and sometimes perhaps even molten. This may seem contradic-tive to the values of cluster and melting temperatures presented in Table 3.1.However, the solid melting temperatures were measured under conditions with1 atmosphere pressure. The cluster temperatures on the other hand, are foundin vacuum experiments. The melting point is known to drop with pressure,but an even larger drop in melting temperature is found when going fromlarge solid samples to small nano systems [4, 6]. Therefore there is no contra-diction between the presented low cluster temperatures and the near meltingpoint cluster temperatures.
Cluster coolingNear melting temperature of the clusters leads to a competition between clus-ter growth and decay [17]. Cluster decay means cluster shrinking and thisleads to cooling of the system. There are several paths of decay leading tocluster cooling [10]. The cluster may reduce its temperature by evaporation,i.e. boiling off of individual atoms where thermal and potential energy is con-verted to kinetic energy:
AN(T1)−→AN−1(T2 < T1)+ A(Ekin) (3.9)
If the internal energy becomes too high, a cluster may go through fragmenta-tion, i.e. splitting into two or more parts:
AN(T1)−→AN−k−m(T2 < T1)+ Ak(Ekin,1)+ Am(Ekin,2) (3.10)
A large, hot cluster can also lose thermal energy by collisional cooling. Theatom B will cool the hot cluster by removing excess thermal energy as kineticenergy:
AN(T1)+ B(Ekin,1)−→AN(T2 < T1)+ B(Ekin,2 > Ekin,1) (3.11)
Yet another possibility for clusters to lower their internal energy is emittinginfrared radiation. This is however a very inefficient method of cooling andmay be neglected in this case.
28

Homogeneous cluster productionIn order to produce clusters of rare-gas elements, it is critical to make the gascold and at the same time have a high collision rate of the atoms in the gas.The high collision rate is important since it allows nucleation, and the gasneeds to be cold to allow the weak van der Waals bonds not to break. As wasshown in Section 3.1.1, adiabatic expansion of rare-gases into vacuum leadsto a temperature decrease in the gas. In addition, when producing clusters thegas is expanded through a nozzle. If the gas before expansion is at sufficientlyhigh pressure, the mean free path of the atoms in the gas will be much shorterthan the diameter of the orifice in the nozzle. In this case many collisions willoccur even after the atoms have passed from the high pressure volume thoughthe nozzle, i.e. where the gas is cooled by the expansion, and hence nucleationwill be possible.
Additional cooling is brought to the system since the collisions of the atomsin the beam will result in momentum transfer in the direction of the beam (so-called hydrodynamic flow). The atoms in the beam will therefore eventuallytravel with very similar speed, leading to fewer collisions (so-called molecularflow). Due to the very narrow distribution of speeds in the beam the atoms areeffectively in a state of very low translational temperature. Atomic beams ofhelium may become as cold as 1 K (see D.R. Miller in [18]).
Figure 3.2: A sketch of atoms clustering by adiabatic expansion through a nozzle.
The principles described above provide the conditions necessary forrare-gas cluster production. The high density of cooled atoms in the beamleads to a supersaturated atomic vapor, which enables cluster condensationas illustrated in Figure 3.2. This type of cluster source, based on expansionof gases, is called a supersonic nozzle source [10, 19]. Cluster growth ceasesbeyond a few orifice diameters from the waist of the nozzle due to themolecular flow in the beam. Cluster cooling may however proceed beyondthis point. Using supersonic beams for condensing atoms and molecules waspioneered already in the 1950’s by Becker et al. [20].
The degree of cluster condensation in the beam is characterized by a scalingparameter Γ∗ [21]. Here the condensation parameter is formulated accordingto Buck et al. [22]:
Γ∗ =p0 ∗d0.85
eq
T 2.28750
∗ k (3.12)
where p0 is the stagnation pressure in mbar, k is a gas specific constant (seeTable 3.2), T0 is the nozzle temperature in K, and deq is the equivalent nozzle
29
diameter in µm. The equivalent diameter takes the conical nozzle geometryinto account:
deq = dtan θ0
tanθ(3.13)
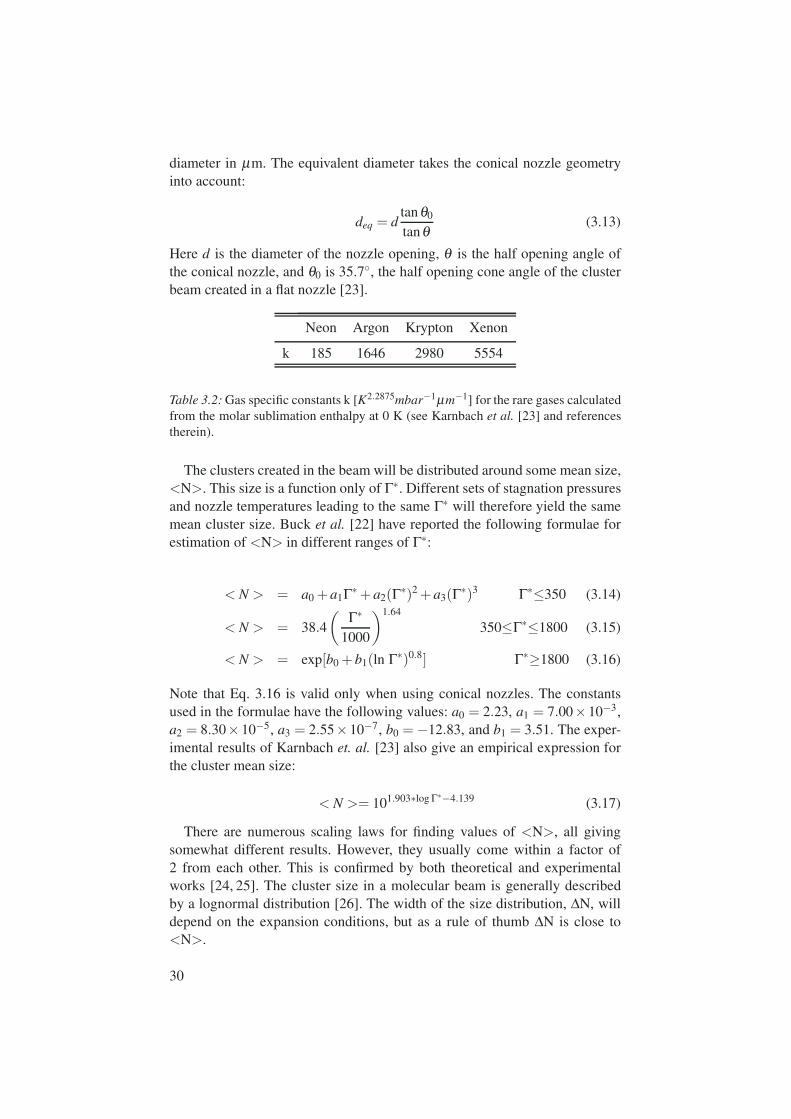
Here d is the diameter of the nozzle opening, θ is the half opening angle ofthe conical nozzle, and θ0 is 35.7, the half opening cone angle of the clusterbeam created in a flat nozzle [23].
Neon Argon Krypton Xenon
k 185 1646 2980 5554
Table 3.2: Gas specific constants k [K2.2875mbar−1µm−1] for the rare gases calculatedfrom the molar sublimation enthalpy at 0 K (see Karnbach et al. [23] and referencestherein).
The clusters created in the beam will be distributed around some mean size,<N>. This size is a function only of Γ∗. Different sets of stagnation pressuresand nozzle temperatures leading to the same Γ∗ will therefore yield the samemean cluster size. Buck et al. [22] have reported the following formulae forestimation of <N> in different ranges of Γ∗:
< N > = a0 + a1Γ∗ + a2(Γ∗)2 + a3(Γ∗)3 Γ∗≤350 (3.14)
< N > = 38.4
(Γ∗
1000
)1.64
350≤Γ∗≤1800 (3.15)
< N > = exp[b0 + b1(ln Γ∗)0.8] Γ∗≥1800 (3.16)
Note that Eq. 3.16 is valid only when using conical nozzles. The constantsused in the formulae have the following values: a0 = 2.23, a1 = 7.00×10⁻³,a2 = 8.30×10⁻⁵, a3 = 2.55×10⁻⁷, b0 = −12.83, and b1 = 3.51. The exper-imental results of Karnbach et. al. [23] also give an empirical expression forthe cluster mean size:
< N >= 101.903∗log Γ∗−4.139 (3.17)
There are numerous scaling laws for finding values of <N>, all givingsomewhat different results. However, they usually come within a factor of2 from each other. This is confirmed by both theoretical and experimentalworks [24, 25]. The cluster size in a molecular beam is generally describedby a lognormal distribution [26]. The width of the size distribution, ∆N, willdepend on the expansion conditions, but as a rule of thumb ∆N is close to<N>.
30

Heterogeneous cluster productionIn the work presented in this Thesis two methods of producing heterogeneousrare-gas clusters are employed: co-expansion and doping/pick-up. These tech-niques are schematically illustrated in Figure 3.3.
Co-expansion:
Doping/pick-up:
Figure 3.3: An illustration of heterogeneous cluster production by co-expansion andby doping/pick-up.
Co-expansions are common in molecular beam experiments, but not alwayswith the aim to produce binary clusters. If a gas, for example water vapor, isco-expanded with argon the expansion will be additionally cooled and henceallow larger water clusters to form [20]. This mode of cluster cooling wasdescribed in Eq. 3.11. The argon in the example above is a so-called carriergas, or buffer gas, and is not a part of the resulting cluster. However, if themixing proportions of the expanded gas, and the expansion conditions areproperly set, heterogeneous clusters may be formed.
Cluster formation by co-expansions is not as thoroughly studied as the sin-gle component expansions. However, the principles of cluster formation re-main unchanged: Nucleation of dimers is the starting point of the clustergrowth (see Eq. 3.6). In a co-expansion of two atomic species, A and B, dimer-ization may lead to three alternative combinations: A2, A−B, or B2. Since theatoms A and B are of different species, they will have different cohesive en-ergies, see Table 3.1. In the first stage of cluster formation the componentwith the highest cohesive energy will have a higher probability of formingdimers [27]. These dimers will act as condensation centers for further clus-ter growth. The mean size of the rare-gas clusters produced by this method isdifficult to determine. No scaling laws are available for co-expansions. Thereare, however, a few studies which report on the cluster size distributions afterco-expansions of gases [28]. In the special case of co-expansion of a gas mix-ture where there is only a very small fraction (<0.01%) of gas A mixed in withgas B, leading to single-atom-doped clusters, the Γ∗-formalism of Eqn. 3.12applied to gas B may be used for size estimation of the heterogeneous clus-ters [29].
In the case of heterogeneous cluster production using the doping/pick-uptechnique, homogeneous AN clusters are produced in the first stage. There-after B atoms are introduced by needles downstream from the nozzle, see
31
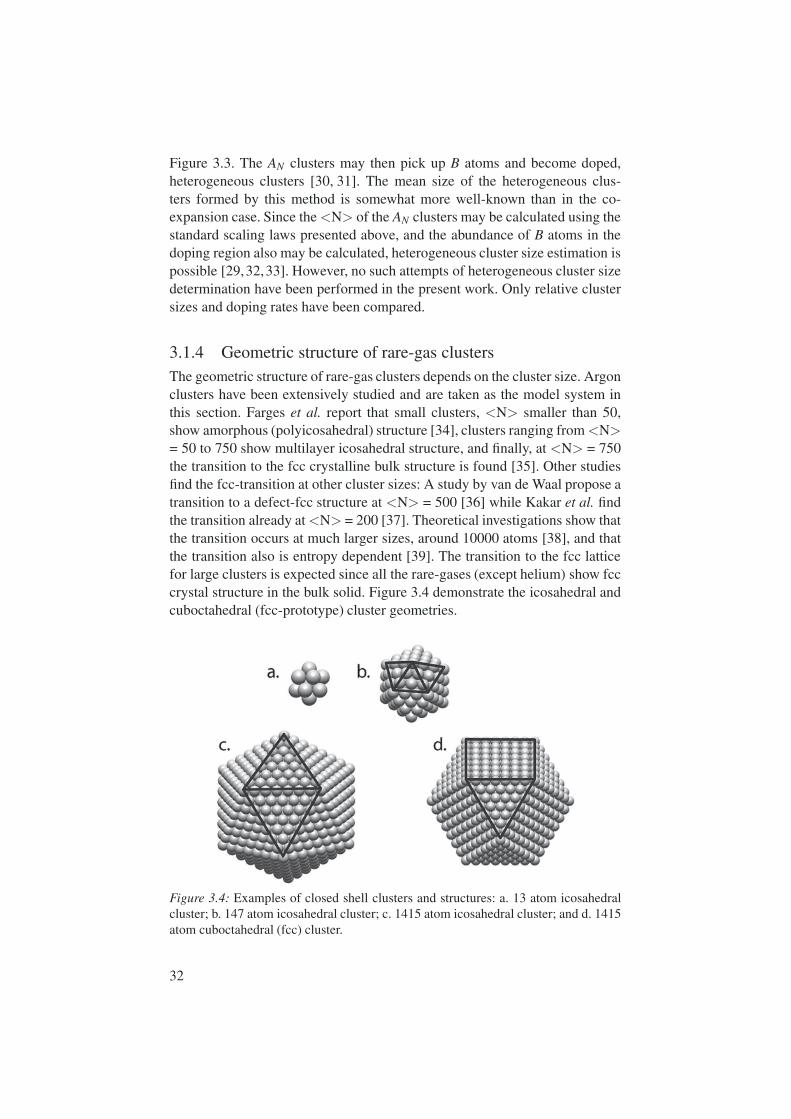
Figure 3.3. The AN clusters may then pick up B atoms and become doped,heterogeneous clusters [30, 31]. The mean size of the heterogeneous clus-ters formed by this method is somewhat more well-known than in the co-expansion case. Since the <N> of the AN clusters may be calculated using thestandard scaling laws presented above, and the abundance of B atoms in thedoping region also may be calculated, heterogeneous cluster size estimation ispossible [29,32,33]. However, no such attempts of heterogeneous cluster sizedetermination have been performed in the present work. Only relative clustersizes and doping rates have been compared.
3.1.4 Geometric structure of rare-gas clustersThe geometric structure of rare-gas clusters depends on the cluster size. Argonclusters have been extensively studied and are taken as the model system inthis section. Farges et al. report that small clusters, <N> smaller than 50,show amorphous (polyicosahedral) structure [34], clusters ranging from <N>= 50 to 750 show multilayer icosahedral structure, and finally, at <N> = 750the transition to the fcc crystalline bulk structure is found [35]. Other studiesfind the fcc-transition at other cluster sizes: A study by van de Waal propose atransition to a defect-fcc structure at <N> = 500 [36] while Kakar et al. findthe transition already at <N> = 200 [37]. Theoretical investigations show thatthe transition occurs at much larger sizes, around 10000 atoms [38], and thatthe transition also is entropy dependent [39]. The transition to the fcc latticefor large clusters is expected since all the rare-gases (except helium) show fcccrystal structure in the bulk solid. Figure 3.4 demonstrate the icosahedral andcuboctahedral (fcc-prototype) cluster geometries.
Figure 3.4: Examples of closed shell clusters and structures: a. 13 atom icosahedralcluster; b. 147 atom icosahedral cluster; c. 1415 atom icosahedral cluster; and d. 1415atom cuboctahedral (fcc) cluster.
32

The occurrence of different favored structures at different cluster sizesmay be understood by considering the competition of bulk strain and surfaceenergy. Icosahedral structures have higher surface coordination than thefcc structure, i.e. the surface cost in the icosahedral system is less than in afcc system. However, the icosahedral geometry cause the bulk layers in thecluster to be compressed, and not at their optimal inter-layer distance. Whenthe bulk becomes large enough the system no longer gains in total energyfrom having the high surface coordination of the icosahedral geometry. Thesystem instead reaches its lowest energy structure by restructuring the bulkinto a fcc lattice. The energy lowering of the system following the reorderinginto the fcc structure will at some cluster size compensate the increase insurface energy resulting from the reordering. The fcc structure is thereforefavored by larger clusters while icosahedral structures are observed in smallersizes.
The number of atoms, N, in clusters with closed shell icosahedral geometrycan be calculated using the following equation [10]:
N(n) =13(10n3 −15n2 + 11n−3) (3.18)
n in the equation denotes the number of shells in the cluster counting the cen-tral atom as the first. As discussed in Chapter 2 clusters have a large fractionof surface atoms. The number of surface atoms, NS, in an icosahedral clusterwith n layers is given by [40]:
NS = 10n2 −20n+ 12 (n > 1) (3.19)
Geometrically closed shell structures, as those displayed in Figure 3.4, aremore stable than clusters with incomplete shells. Cluster sizes with closedshell structures (given by Eq. 3.18) will therefore form in high abundance,relative to other sizes, in the adiabatic expansion. The number of atoms, N,associated with these sizes are called magic numbers [8].
Heterogeneous cluster structureAs was seen in Figure 3.1 the well depth, ε , and the bond distance, r0, varybetween the rare-gases and also between different combinations of the rare-gases. Clarke et al. [41] have investigated the properties of Lennard-Jonesclusters composed of A and B atoms using Molecular Dynamics. They reportthe following equilibrium structural dependence on ε :
i εAB εAA εBB
The similarity of A and B results in uniform mixing.ii εAB ≤ εAA ∼ εBB
The weak AB interaction leads to an elongated cluster with separatedA and B rich parts. If εAB ≈ 0 the cluster will fragment into two sub-clusters.
33

iii εBB ≤ εAB ∼ εAA
In this case a spherical A core will be coated by B particles. The Batoms will favor sites with high AB coordination.
iv εBB ∼ εAB ≤ εAA
A spherical A core will be covered by B atoms. Here BB coordinationis important and the overlayer will form islands.
v εAB εAA
The B particles will evaporate leaving an A core. This is equivalent tothe cluster cooling process described in Eq. 3.11.
In addition to ε , the bond distance in, and temperature of, the clusters areimportant parameters for the cluster geometry. Increased temperature gener-ally enhances mixing, or fragmentation, and differences in bond length tendto increase segregation. These issues will be discussed further in Chapter 5.
3.2 Electron SpectroscopiesThe experimental results presented in this Thesis were acquired by meansof x-ray photoelectron spectroscopy: a science of investigating matter via itsinner-electronic structure. The Physics Department of Uppsala University hasa strong tradition in photoelectron spectroscopy. In the mid 1950’s Kai Sieg-bahn (b. 1918) made great progress in instrumental resolution and definedElectron Spectroscopy for Chemical Analysis (ESCA) [42]. For this workhe was awarded the 1981 Nobel prize in Physics. Today the use of electronspectroscopy is widespread. The method is element specific, and sensitivity todifferent geometric sites is often achievable. Furthermore, it is a surface sen-sitive technique and is applicable to a large variety of samples. Studies of freeatoms and molecules as well as of liquid and solid samples are possible. Be-low, the basics of the spectroscopic methods used in the papers of this Thesisare presented.
3.2.1 PhotoionizationIonization of an atom means adding or removing an electron to/from the neu-tral atom. Photoionization means removing an electron through absorptionof radiation. This may occur if an electron in the sample absorbs a photonwith sufficient energy for the electron to escape the material. This processwas shown by Hertz in 1887 [43]. The escaping electron is then called a pho-toelectron [44]. Einstein described the interaction of light and matter whenformulating a theory for the photoelectric effect in 1905 [45], for which hewas awarded the 1921 Nobel prize in Physics. He introduced quantized elec-tromagnetic radiation (photons) and the photoelectric law:
Ekinetic = hν −Ebinding (3.20)
34

where Ekinetic is the kinetic energy of the ejected photoelectron, hν is the pho-ton energy, and Ebinding is the binding energy, i.e. the minimum amount ofenergy an individual electron requires to escape the material. Eq. 3.20 formu-lates the photoelectric effect for free samples, such as clusters in a molecularbeam and Figure 3.5 illustrates this equation.
0Binding energy Kinetic energy
Valenceband
Core-level
hν
Figure 3.5: Illustration of the photoelectric law. A photon with energy hν ionizes theatom and the difference between the photon energy and binding energy of the electronis transferred to kinetic energy of the photoelectron. The figure is used with the kindpermission of A. Lindblad [46].
3.2.2 Photoelectron spectroscopyFigure 3.6 shows a few different photon–atom interaction scenarios, con-nected to different experimental techniques. Core-level photoelectron spec-troscopy methods are element specific since the core-level energies are char-acteristic and different for all atomic species [42]. By only permitting photonswith a known, well-defined energy to reach the sample, and by measuring thekinetic energy of the emitted photoelectrons with high accuracy, Eq. 3.20 maygive the binding energy of the studied electrons with corresponding precision.Information about the binding energy will then directly yield what elementejected the photoelectron. Electron binding energies for atoms in their neutralform are easily found in handbooks [47]. The experimental equipment used toperform such measurements is presented in Chapter 4.
Vale
nce
elec
tro
ns
Co
reel
ectr
on
s
a. Ground State b. UPS d. XPSc. Core-level photo- excitation
Figure 3.6: a. shows the ground-state electron configuration in an atom. In b-d differ-ent photon–atom interactions are illustrated: b. photoionization of a valence electron(UPS); c. core-level photoexcitation; d. photoionization of a core electron (XPS).
35
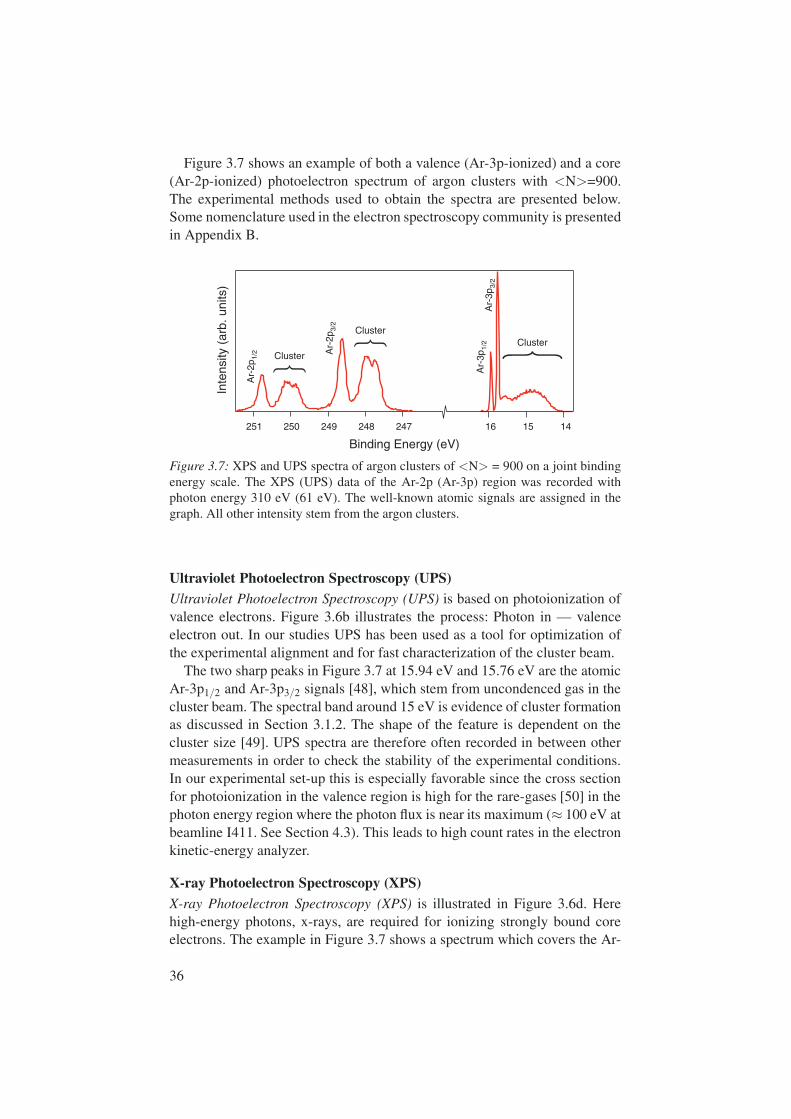
Figure 3.7 shows an example of both a valence (Ar-3p-ionized) and a core(Ar-2p-ionized) photoelectron spectrum of argon clusters with <N>=900.The experimental methods used to obtain the spectra are presented below.Some nomenclature used in the electron spectroscopy community is presentedin Appendix B.
Binding Energy (eV)
Inte
nsity
(ar
b. u
nits
)
16 15 14
Ar-
3p1/
2A
r-3p
3/2
251 250 249 248 247
Ar-
2p1/
2 Cluster
ClusterCluster
Ar-
2p3/
2
Figure 3.7: XPS and UPS spectra of argon clusters of <N> = 900 on a joint bindingenergy scale. The XPS (UPS) data of the Ar-2p (Ar-3p) region was recorded withphoton energy 310 eV (61 eV). The well-known atomic signals are assigned in thegraph. All other intensity stem from the argon clusters.
Ultraviolet Photoelectron Spectroscopy (UPS)Ultraviolet Photoelectron Spectroscopy (UPS) is based on photoionization ofvalence electrons. Figure 3.6b illustrates the process: Photon in — valenceelectron out. In our studies UPS has been used as a tool for optimization ofthe experimental alignment and for fast characterization of the cluster beam.
The two sharp peaks in Figure 3.7 at 15.94 eV and 15.76 eV are the atomicAr-3p1/2 and Ar-3p3/2 signals [48], which stem from uncondenced gas in thecluster beam. The spectral band around 15 eV is evidence of cluster formationas discussed in Section 3.1.2. The shape of the feature is dependent on thecluster size [49]. UPS spectra are therefore often recorded in between othermeasurements in order to check the stability of the experimental conditions.In our experimental set-up this is especially favorable since the cross sectionfor photoionization in the valence region is high for the rare-gases [50] in thephoton energy region where the photon flux is near its maximum (≈ 100 eV atbeamline I411. See Section 4.3). This leads to high count rates in the electronkinetic-energy analyzer.
X-ray Photoelectron Spectroscopy (XPS)X-ray Photoelectron Spectroscopy (XPS) is illustrated in Figure 3.6d. Herehigh-energy photons, x-rays, are required for ionizing strongly bound coreelectrons. The example in Figure 3.7 shows a spectrum which covers the Ar-
36
2p binding energy region (atomic binding energies 250.79 eV and 248.63 eVfor Ar-2p1/2 and Ar-2p3/2, respectively [51]).
Since electrons in core levels do not participate in the van der Waals bond-ing of the system, they do not form electronic bands. Core electrons thereforemaintain their atomic character in the condensed phase. The analysis of XPS istherefore simplified since the atomic signal may be used as a starting point inthe interpretation. As seen in Figure 3.7 the cluster signal is shifted in bindingenergy from the atomic peaks. In the analysis of XPS spectra the magnitudeof the shift is used to obtain information about the condensed system. Thiswill be discussed further in Section 3.4.
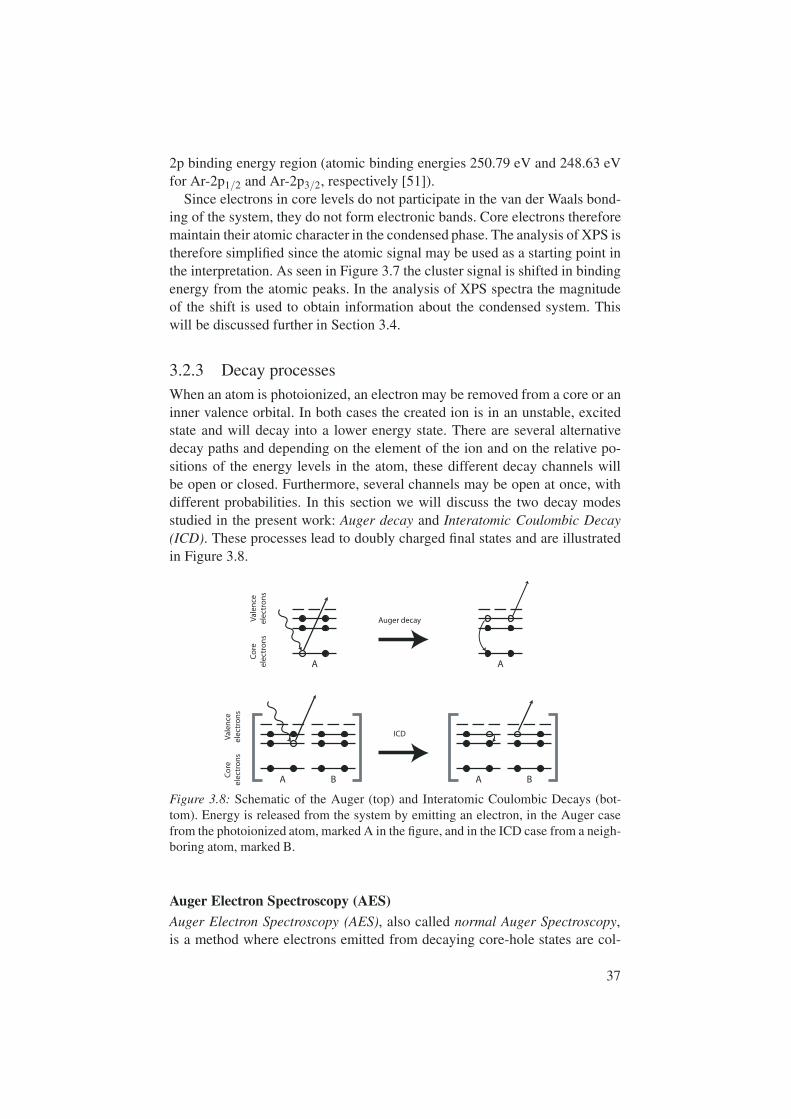
3.2.3 Decay processesWhen an atom is photoionized, an electron may be removed from a core or aninner valence orbital. In both cases the created ion is in an unstable, excitedstate and will decay into a lower energy state. There are several alternativedecay paths and depending on the element of the ion and on the relative po-sitions of the energy levels in the atom, these different decay channels willbe open or closed. Furthermore, several channels may be open at once, withdifferent probabilities. In this section we will discuss the two decay modesstudied in the present work: Auger decay and Interatomic Coulombic Decay(ICD). These processes lead to doubly charged final states and are illustratedin Figure 3.8.
A B
A
A B
Vale
nce
elec
tro
ns
Co
reel
ectr
on
s
Auger decay
ICD
A
Vale
nce
elec
tro
ns
Co
reel
ectr
on
s
Figure 3.8: Schematic of the Auger (top) and Interatomic Coulombic Decays (bot-tom). Energy is released from the system by emitting an electron, in the Auger casefrom the photoionized atom, marked A in the figure, and in the ICD case from a neigh-boring atom, marked B.
Auger Electron Spectroscopy (AES)Auger Electron Spectroscopy (AES), also called normal Auger Spectroscopy,is a method where electrons emitted from decaying core-hole states are col-
37
lected. The process is sketched in Figure 3.8. The created core-hole is filledby a valence electron. The excess energy, i.e. the binding energy differenceof the core orbital and the valence orbital minus the second ionization po-tential, will be transferred to another valence electron, which will be ejected.The ejected electron is called an Auger electron1 and may be detected by anelectron spectrometer.
The bandwidth of the ionizing radiation (high above the threshold) is of nosignificance for the resolution of Auger spectra, since the kinetic energy of thenormal Auger electrons is given by the energy difference between the energylevels involved in the Auger decay, and the second ionization potential. Augerlines in atomic spectra will therefore turn out sharp in the spectrum; the widthof the atomic spectral features are only limited by the spectrometer resolutionand the inherent lifetime width. The lifetime of the excited state before theAuger decay is typically in the femtosecond range, see Section 3.4.2. Theenergy position of an Auger line in the spectrum gives information about theenergy level differences in the atom.
Auger decay is characteristic for lighter elements whereas deeper core lev-els in heavy elements decay via photon emission to a large extent.
Interatomic Coulombic Decay (ICD)Interatomic Coulombic Decay is similar to Auger decay in the sense that theenergy of the system is lowered by ejection of an electron. However, ICD ischaracterized by an efficient energy transfer between monomers in the clus-ter. In Figure 3.8 the neighboring atoms are marked A and B. The illustrationshows how an inner valence hole is filled by an valence electron in atom Awhile an electron is ejected from atom B. This process was recently theo-retically predicted by Cederbaum et al. [52, 53], and was confirmed to oc-cur in neon dimers and clusters by experimental studies only a few yearsago [54–56]. The Cederbaum group also predicted ICD in mixed argon/neonsystems [57, 58]. This has also been observed in experiments [59].
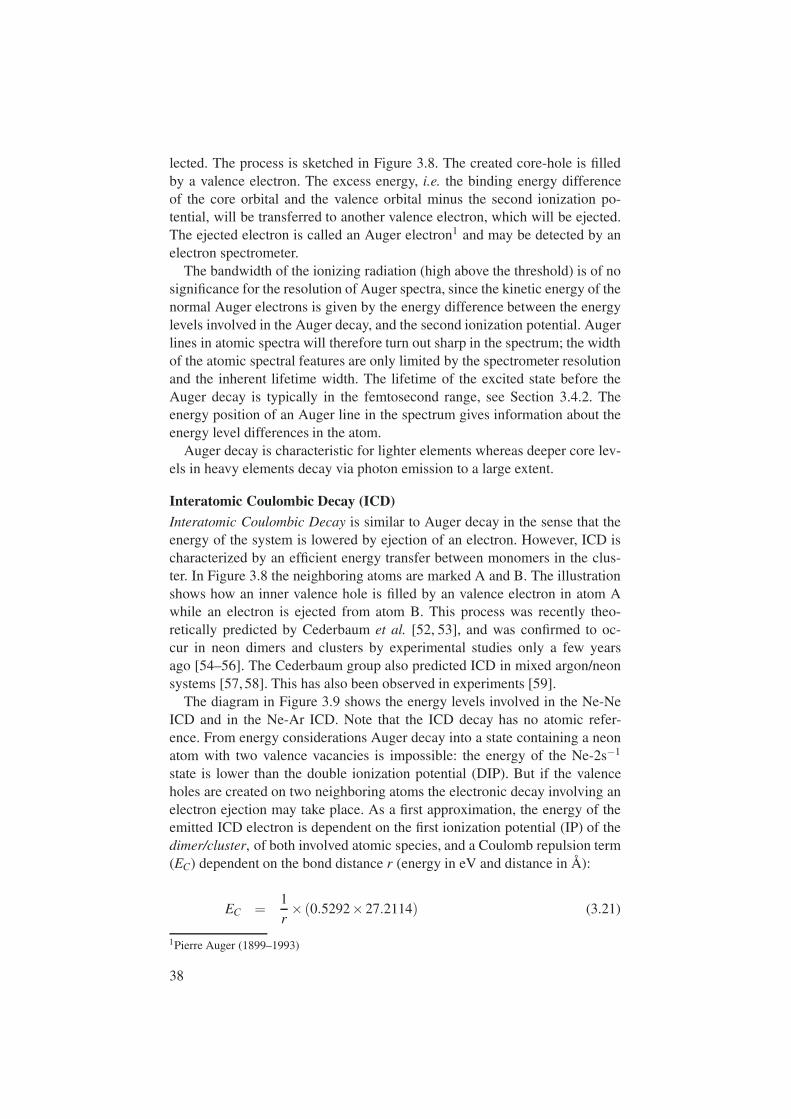
The diagram in Figure 3.9 shows the energy levels involved in the Ne-NeICD and in the Ne-Ar ICD. Note that the ICD decay has no atomic refer-ence. From energy considerations Auger decay into a state containing a neonatom with two valence vacancies is impossible: the energy of the Ne-2s−1
state is lower than the double ionization potential (DIP). But if the valenceholes are created on two neighboring atoms the electronic decay involving anelectron ejection may take place. As a first approximation, the energy of theemitted ICD electron is dependent on the first ionization potential (IP) of thedimer/cluster, of both involved atomic species, and a Coulomb repulsion term(EC) dependent on the bond distance r (energy in eV and distance in Å):
EC =1r× (0.5292×27.2114) (3.21)
1Pierre Auger (1899–1993)
38

0+ 1+ 2+
Ne/Ar - Ne(2s-1)
Ne/Ar - Ne(2p-1)
Ne(2p-1)-Ne(2p-1)
Ar(3p-1)-Ne(2p-1)
48 eV
Ne/Ar - Ne(2p-2)63 eV
0 eV
IP
DIP
EICD(Ne-Ne)
EICD(Ar-Ne)
Final State Charge
Flou
rescence
ICD
ICD
Figure 3.9: Energy diagram of the Interatomic Coulombic Decay in the neon andargon-neon dimers. Bold black lines denote atomic reference levels while the thinblack lines schematically show the energy levels in the dimer.
EICD ≈ IP[Ne(2s−1)]−2× IP[Ne(2p−1)]−EC (3.22)
EICD ≈ IP[Ne(2s−1)]− IP[Ne(2p−1)]− IP[Ar(3p−1)]−EC (3.23)
The constants in Eq. 3.21 are present to make the transition from atomic unitsto eV2. Eqn. 3.23 gives an approximate kinetic energy of 1 eV for the ICDelectron in the Ne dimer system. The ICD electron emitted from the Ar-Nesystem has higher kinetic energy, according to Eqn. 3.23 about 7 eV. This isalso illustrated in Fig. 3.9.
The ICD process is ultrafast (femtosecond time scale) and much faster thanthe slow radiative decay (picosecond time scale [60]), also indicated in Fig-ure 3.9. This means that when ICD is possible, it will be the dominant de-cay channel. The short lifetime of the excited state, in the present case theNe(2s−1) state, will affect the shape of photoelectron line (see Section 3.4.2).Hence ICD can be experimentally detected either by recording the low-energyICD electrons themselves, or by analyzing the photoelectrons. This will bediscussed in Chapter 5.
21 Hartree = 27.2114 eV, 1 Bohr radius a0 = 0.5292 Å
39

3.2.4 Angular distribution effectsThe angular distribution of photoelectrons, relative to the polarization plane ofthe ionizing photons, is dependent on from which orbital they are ejected. Inthe dipole approximation, a single parameter, the anisotropy parameter β , isused to describe the shape of the angular distribution of the emitted electronsafter the photon absorption:
I(θ) =σ4π
[1+
β2
(3cos2 θ −1)
](3.24)
where σ is the angle integrated ionization cross-section and θ is the anglebetween the direction of the electric field vector of the linearly polarized radi-ation and the direction of the emitted electron [61]. β may take values between−1 and 2. Eq. 3.24 is plotted for a few values of β in figure 3.10.
0°
90°
180°
270°
54.7°
ß=2
ß=1
ß=0
ß=-1
Figure 3.10: The anisotropy parameter β at different angles relative to the polarizationplane of the radiation, which is horizontal. The magic angle (54.7circ) is indicated inthe figure.
The value of the β parameter varies between the elements but also betweenorbitals and with photon energy. This variation may introduce problems inspectrum interpretation. But, for one angle, θ ≈ 54.7, the β -dependence ofEq. 3.24 vanishes. It is therefore called the magic angle. The magic directionis indicated in figure 3.10. The theory presented above was developed for pho-toionization of atoms but the angular distribution of emitted Auger electronsmay also be described by a β parameter [62]. Hence, the magic angle is thesame for both photoelectron and Auger spectroscopies.
Also in studies on free clusters the magic angle remains magic. Eq. 3.24is true also for other samples than free atoms, under the condition that theyare completely randomly oriented [63]. The formalism is therefore applicableto the studies in this Thesis, as free, randomly oriented clusters are investi-gated [64].
40
3.3 Intrinsic and extrinsic scattering processesBy intrinsic scattering processes we mean intra-atomic processes which causethe kinetic energy of the electrons emitted by photoemission or Auger decay tobe altered. Examples of such processes are the so-called shake-up and shake-down. These processes occur in both the free atom and in clusters and may beread about elsewhere [65–67].
In clusters and solids the possibility of extrinsic scattering processes, i.e.secondary processes occurring outside the ionized atom, is added relative tothe situation in free atoms. The scattering interaction may be elastic, where thekinetic energy of the electron is conserved, or inelastic, in which case there isan energy exchange in the "collision" with other cluster atoms. All free elec-trons (for example photoelectrons and Auger electrons) traveling through asolid or a cluster will have a kinetic energy dependent probability to scatterinelastically in several processes: by ionizing an atom in the cluster; by cre-ating phonons; in semiconducting or insulating matter, by creating excitons;or in conducting matter by creating plasmons. In our case the secondary ion-ization and energy loss through creation of excitons are of interest and will bediscussed further.
Excitons are metastable, delocalized electron-hole pairs [68–71]. If a pho-toelectron loses energy through exciton creation it will no longer contribute tothe XPS spectrum. However, the total charge of the cluster remains unchangedafter this interaction, so the potential in which the Auger electron propagates isunchanged, and the AES spectrum will therefore not be significantly affectedby the exciton.
Electrons which have lost energy due to secondary ionization normally con-tribute to a relatively structureless background in the spectra, since the twoelectrons — the photoelectron and the secondary electron — will share theavailable kinetic energy after the collision [72]. Due to this a second charge isintroduced into the system. In this case the potential in which the Auger elec-tron propagates is changed. This affects the appearance of the AES spectrumand will be discussed further in Chapter 5.
3.3.1 Electron flux attenuationFor a solid sample, or a cluster, the electrons may have to penetrate some ma-terial to reach the detector. While propagating through the material the elec-trons may scatter inelastically and lose kinetic energy. As discussed above,there are many mechanisms for inelastic scattering, the electron-electron in-teraction being the most significant one. This leads to an electron flux attenua-tion of electrons traveling through the material. The resulting effects are oftencollectively treated using a kinetic-energy-dependent escape depth or attenu-ation length, λ , for the electrons. λ is also often used to denote the inelastic
41

mean free path3. With this approach the probability for an electron to exit thebulk of the material in a certain direction is determined by an exponential fac-tor e−x/λ , where x is the distance from the parent atom to the surface in thechosen direction.
For adsorbed solid rare gases the pioneering studies of electron escapedepth at low kinetic energies were performed in the range from 20 eV down to5 eV [73–75]. In this relatively narrow interval the escape depth was reportedto grow from a few Å at 20 eV up to 1000 Å at 5 eV. The curve of electroninelastic mean free path shown in Figure 3.11 gives the qualitative kinetic en-ergy dependence of λ in the rare gases. The shape of the curve is taken formthe so-called universal curve [76] and the minimum is shifted to about 25 eVas was found by Tchaplyguine et al. [77]. It is known that neither the shapeof the curve nor the energy position of the minimum is universal [78, 79], butthe general shape of the curve is still valid and may be used as a simple ruleof thumb [80].
Electron Energy (eV)
Mea
n fr
ee p
ath
(lo
g-s
cale
)
Figure 3.11: The qualitative curve of inelastic mean free path for the rare-gases.
In the cluster spectra the photoelectron mean escape depth will influencethe surface signal fraction (surface intensity/total cluster intensity). If λ ismuch larger than the cluster diameter the surface signal fraction will give thetrue fraction of surface atoms in the cluster. However, if λ is smaller than thecluster diameter, the bulk signal will be suppressed and hence the surface willbe over-represented in the spectrum. The degree of surface enhancement re-flects the surface-sensitivity of photoelectron spectroscopy. This may be usedin depth profiling measurements.
Photoelectron recaptureIn both free atoms and in clusters there is a kinetic energy dependent prob-ability for a recapture of the photoelectron after ionization. For free atomsthis has been subject of thorough investigation, especially in connection withthe PCI process where the doubly charged Auger final state becomes singly
3Mean free path = mean propagation distance before scattering interaction
42

charged by the recapture of a slow photoelectron [81–84]. The probability forthis PCI-related recapture decreases exponentially with higher kinetic energy.The cluster environment, in contrast to the atomic case, provides probabilitiesof elastic and inelastic scattering of the ejected electrons. This introduces thepossibility of a solid state specific photoelectron recapture process we namepre-Auger recapture (PAR). This is discussed in Chapter 5.
3.4 Cluster spectrum interpretationInterpretation of cluster photoelectron spectra requires knowledge of bothatomic and solid-state physics. Important phenomena for understanding andassigning the spectra are presented below.
3.4.1 Polarization screeningWhen an atom in a neutral van der Waals cluster is ionized, it receives a pos-itive final charge. The ionized atom will affect the electron density of sur-rounding atoms as illustrated in figure 3.12b and c. This is called polarizationscreening, since the polarized atoms screen, or shield, the created positivecharge. This redistribution of the electron density around an ion in the clus-ter is dependent on the cluster geometry (bonding distance and coordinationnumber), the polarizability of the neighbors, and on the charge on the ionizedatom. Therefore the discussion of the effect of polarization screening on XPSand AES spectra is separated below.
a. c._
_ _+
+ +
+b.
_ _
___
_
+
+
++
+
+
+
Figure 3.12: a. A schematic presentation of a small neutral cluster. When a positivecharge is introduced to the system by ionization the surrounding atoms redistributesome electron density: b. Illustrates this for bulk ionization and c. depicts the situationafter surface ionization.
UPSThe width of valence p bands4 scale as 1
r3 , where r is the internuclearseparation, according to the tight-binding model of solid state theory [85].The width of the electronic band will decrease rapidly with increasinginteratomic distance, since the band formation arises due to valence orbitaloverlap. Decreased electronic band width is therefore also expected in
4Electronic structure of the rare-gases: . . . ns2np6, where n is 2, 3, 4, 5 for Ne, Ar, Kr, Xe.
43

low-dimensional structures [86], for example one-dimensional arrays ortwo-dimensional monolayers of atoms [87]. Measurements of the valenceband width may therefore be used for structural investigations of clusters.The spectral energy position of the band will be affected by polarizationscreening, but since the the band formation complicates the line shape thiswill instead be discussed further in connection with the core-level spectrabelow.
XPSWhen the ionized atom in the cluster is screened, the energy levels probedwith XPS will be altered. The final state relaxation due to the polarizationscreening (see Figure 3.12) is manifested by lowering of the binding energylevel (Ebinding in equation 3.20), and hence the photoelectron will be detectedwith higher kinetic energy than the one emitted from the corresponding levelin a free atom. This was for example observed in figure 3.7.
AtomicExperiment
SurfaceBulk
Ar XPS
251 250 249 248 247
Inte
nsity
(ar
b. u
nits
)
Binding Energy (eV)
Ar-2p1/2
Ar-2p3/2
Figure 3.13: XPS spectrum of argon clusters with <N> = 900 recorded @ 310 eVphoton energy. The spectrum is fitted with three features for each spin-orbit compo-nent. Curves indicating atomic, surface and bulk contributions are displayed.
Two ionized cases are separated in Figure 3.12: the bulk ionization in b, andthe surface ionization in c. The binding energy lowering effect of the polar-ization screening is dependent on the number of atoms neighboring the ion.Approximately 65% of the screening can be attributed to the nearest shell ofneighbors, the so-called first coordination shell [88]. A bulk atom will be morestrongly screened than a surface atom, since the surface atom has fewer near-est neighbors. In a high-resolution spectrum this means that the cluster featuremay be separated into surface and bulk components. The surface componentwill be found closest to the atomic signal, and the bulk component of thecluster feature will be shifted farther from the parent atomic line [77, 88, 89].
44

Figure 3.13 shows the same XPS spectrum as in Figure 3.7, but now withassigned cluster components.
The atomic lines in Figure 3.13 are at 248.63 eV and 250.79 eV [51]. Thecluster components are, as expected, shifted towards lower binding energy.The cluster surface signal is shifted 0.65 eV and the bulk feature is shifted0.93 eV from the corresponding atomic lines. The initial state shift due to thevan der Waals bonding is negligible here.
AES
0+ 1+ 2+
Ar(2p-1)
ArN-Ar(2p-1)
ArN-Ar(3p-2)
Ar(3p-2)
IP ∆E
4∆E
Final State Charge
Clu
ster Au
ger d
ecay
Atom
ic Auger d
ecay
206 eV
250 eV
0 eV
Figure 3.14: Energy diagram of the Auger decay in the argon monomer and cluster.
Auger spectra can be analyzed in a similar manner to the XPS spectra. Themagnitude of the polarization screening strength scales with the square of thefinal state charge [90]. As discussed above, a doubly charged state is createdthrough the normal Auger decay process. The kinetic energy of the Augerelectrons is related to the energy difference between these two states, in thecluster assuming that both charges are localized to the same atom. The en-ergy shift between the atomic and cluster surface/bulk responses in the XPS(∆EXPS) and AES (∆EAuger) may therefore be expressed as follows:
∆EXPS = ∆E+1 = (+1)2 ×∆E≡∆E (3.25)
45

where ∆E is the ’unit shift’ and the (+1) denotes the final state charge. Fordoubly ionized final states we write:
∆E+2 = (+2)2 ×∆E = 4∆E (3.26)
Figure 3.14 shows the energy diagram for the Auger decay in the argonmonomer and cluster. The ∆EAuger observed in the normal Auger spectracorresponds to the energy difference of the +1 and +2 final states:
∆EAuger = ∆E+2 −∆E+1 = 4∆E −∆E = 3∆E = 3∆EXPS (3.27)
Kaindl et al. [90] showed that it is possible to fit normal Auger spectra ofsolid xenon by shifting and broadening the atomic Auger spectrum 3∆EXPS
to form surface and bulk Auger contributions. This result is also applicableto clusters [91]. An example is found in figure 3.15 where the L2,3M2,3M2,3
transition spectrum of argon clusters with <N> = 200 is fitted with atomic,and cluster surface and bulk contributions. There are seven strong atomic linesin this energy region, and each is accompanied by a surface and bulk clusterfeature in the figure. This will be discussed further in Chapter 5.
212210208206204202200
Kinetic Energy (eV)
Inte
nsity
(ar
b. u
nits
)
AtomicExperiment
SurfaceBulk
Ar AugerL2,3M2,3M2,3
Figure 3.15: Argon cluster with <N> = 200 normal Auger spectrum of theL2,3M2,3M2,3 region recorded @ 310 eV photon energy fitted with atom, surface, andbulk contributions.
3.4.2 Line shapes and line widthsA number of effects contribute to the widths of core-level spectroscopic lines.Some of these broadening contributions may be minimized by increased ex-perimental resolution, while others are inherent to the sample and set the lowerlimit to the line width. The shape of the line used to model these different con-tributions depends on the physical nature of the broadening. In Figure 3.16 thethree line profiles discussed in this section are presented. The line profile used
46

in the curve fit analysis is a so-called Voigt profile which is a convolution ofthe Lorentzian and Gaussian line shapes [62].
Lorentzian
0.0 0.5-0.5 0.0 0.5-0.5
Gaussian
0.0 0.5-0.5
Post-Collision Interaction
Relative binding energy (eV)
Figure 3.16: Examples of the Gaussian, Lorentzian and Post-Collision Interactionphotoelectron line profiles.
Lifetime broadeningAs discussed in Section 3.2.3, when an electron is removed from a core or aninner valence orbital the created ion will decay to a lower energy state. Thecore-hole has a very short lifetime, typically on the femtosecond timescale. Ifthe lifetime of the excited state is τ , the energy level width, ∆E , is accordingto Heisenberg’s uncertainty principle [19]:
∆E ≈ hτ
(3.28)
This limits the resolution in the spectra. ∆E is the inherent lifetime broad-ening of the state and gives the FWHM of the associated Lorentzian lineshape [62]. τ = 6 fs, the approximate core-hole lifetime of the Ar-2p1− state,corresponds to ∆E≈110 meV. The lifetime has in our treatment been assumedto be equal in the monomer and the cluster. This assumption is reliable forcore levels but should be applied with caution when studying inner-valencelevels where the ICD may be an important process.
Experimental broadeningThe experimental set-up introduces several contributions to the total spectralwidth. Especially the finite precision in photon energy selection and electronkinetic energy determination contributes to the so-called experimental broad-ening. This often brings a compromise between resolution and intensity. Highintensity implies low resolution, and vice versa. The experimental broadeningcontributions combine to a Gaussian line shape, of the experimental signal.
Cluster specific broadeningCompared to the free atom, the addition of neighbors in a cluster will result inan extra spectral broadening of the cluster features. This is due to the distri-bution of in-equivalent sites in the probed cluster, and due to the cluster sizedistribution in the expansion [25]. Inter-atomic vibrations in rare-gas clusters
47

give a very small contribution and may be neglected [25]. Figure 3.17 showsthe in-equivalent surface sites in a cluster of 148 atoms with a closed-shellicosahedral structure, and one atom in a hollow site.
Figure 3.17: The surface sites on a cluster with icosahedral structure.
The additional width of the cluster surface and bulk peaks in the spec-tra is mainly a result of site-dependent variations in the polarization screen-ing [25, 92, 93]. The distribution of cluster sizes created by the cluster sourcewill also add to the broadening since different sizes have different amounts ofin-equivalent sites, especially in geometrically open-shell clusters. Note thatthe variation in coordination numbers is large for surface atoms. In a perfecticosahedral cluster the surface atoms have 6, 8, or 9 neighbors, while all bulkatoms have 12. This results in a broader surface component than bulk com-ponent in the spectra. The cluster specific cluster broadening is approximatedwith a Gaussian distribution.
In summary, the line shape of the cluster features have contributions fromthe Lorentzian life time broadening, and Gaussian contributions from the dis-tribution of in-equivalent sites, the distribution of cluster sizes, and the exper-imental set-up. As mentioned above these are convoluted into a Voigt profilewhich is used in the curve fit procedure of the spectral lines.
Further classification can be done by considering homogeneous and inho-mogeneous broadening. Homogeneous broadening stems from mechanismswhich are the same in all particles, and inhomogeneous broadening arisesfrom mechanisms which vary between individual particles [94]. The lifetimebroadening is an example of a homogeneous broadening since all particles inthe ensemble have the same lifetime, and hence we use the Lorentzian lineshape. Polarization screening and the instrumental widths give rise to Gaus-sian broadenings due to that they may vary for different particles and different
48

conditions in the experiment. Different sites in the cluster give different po-larization screening binding energy shifts, and photons with different energygive rise to photoelectrons of varying energy. These broadenings are inhomo-geneous.
Post-Collision Interaction (PCI)The line profiles discussed above were both symmetric, but under some condi-tions the spectral lines become asymmetric. This is due to the energy exchangebetween the photoelectron and the Auger electron. When an atom is ionizedthe photoelectron will propagate in the potential of a singly charged ion. Af-ter some time, τ , the ion may Auger decay, emitting a second electron. If thekinetic energy of the photoelectron is lower than that of the Auger electron,the Auger electron will overtake the photoelectron. When this occurs the pho-toelectron will suddenly find itself in the potential of the doubly charged ion,and will therefore lose energy. This is called Post-Collision Interaction (PCI).Since Heisenberg’s uncertainty principle gives a time span for the emission ofthe Auger electron, and not a definite time, the energy exchange between thephoto- and Auger electron will not be equal for all observed electrons. The re-sult is an asymmetric distortion of the Lorentzian line shape, see Figure 3.16.The photoelectron line will receive an asymmetry stretching towards higherbinding energy (lower kinetic energy). The Auger signal in the spectra willshow a similar asymmetry, but in the opposite direction. The Auger electronsgain kinetic energy when overtaking the photoelectron. The magnitude of theasymmetry is dependent on the distance from the ion at which the energy ex-change takes place. For atoms, this is according to van der Straten et al. [95]described by the PCI-parameter Q:
QAtom =1√2×
(1√
Ekin,XPS− 1√
Ekin,Auger
)(3.29)
In Eq. 3.29 atomic units should be used for the energy.In this Thesis, PCI line profiles [95] were used to account for the asym-
metric shape of the cluster features. According to reference [96] the PCI-parameter, Q, calculated for the atomic peak may also be used for the clus-ter surface peak. The model presented in the reference suggests that a correctvalue for the PCI-parameter for the bulk component is found by dividing theatomic PCI-parameter by the permittivity, ε , of the medium:
QBulk =QAtom
ε(3.30)
The permittivity accounts for the reduction of the coulomb force betweencharges caused by the electronic polarization of the medium. The value of εtherefore varies between different materials, see Table 3.3.
49
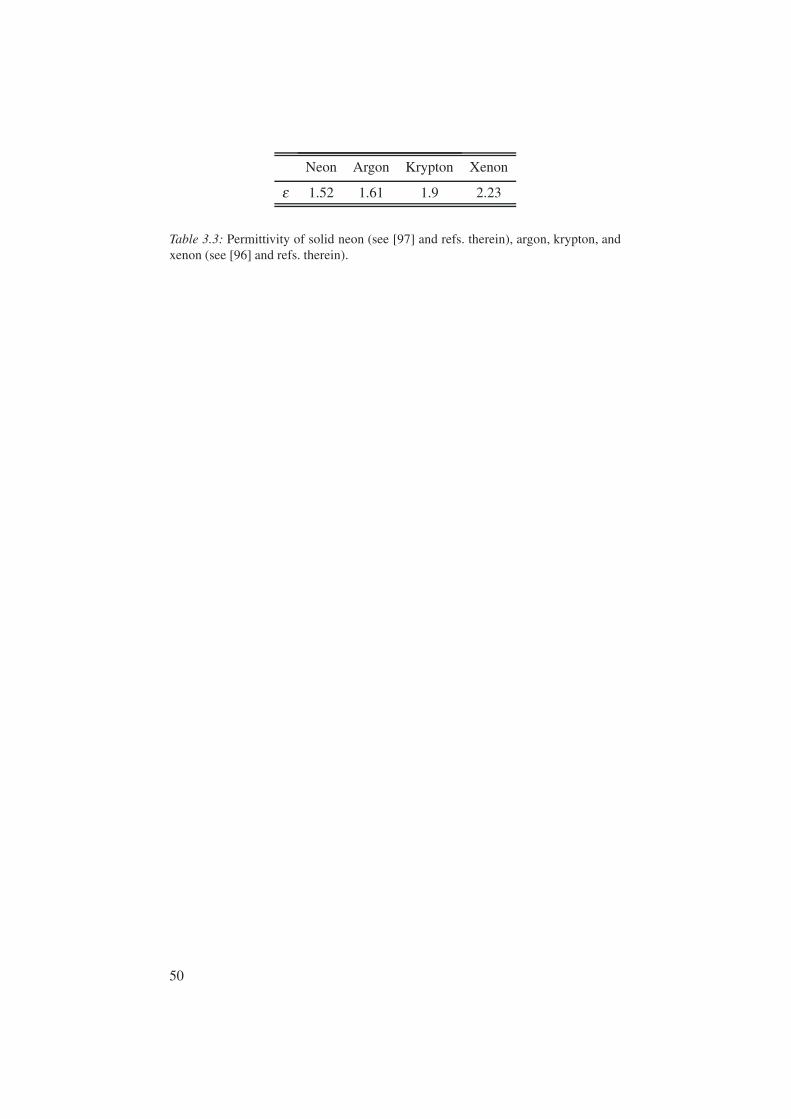
Neon Argon Krypton Xenon
ε 1.52 1.61 1.9 2.23
Table 3.3: Permittivity of solid neon (see [97] and refs. therein), argon, krypton, andxenon (see [96] and refs. therein).
50

4. Experimental equipment
The experimental work presented in this Thesis was preformed at twosynchrotron radiation facilities, MAX-lab1, located in Lund, Sweden, andBESSY2 in Berlin, Germany. This chapter gives a brief review of theexperimental set up: the concept of synchrotron radiation (SR), how thephotons are guided to the clusters, how those clusters are produced, and howthe emitted electrons are analyzed. Synchrotron facilities are in general verysimilar and below MAX-lab is used as an example.
4.1 High vacuum (HV)Electron spectroscopy techniques require high vacuum (HV) since the infor-mation carriers are electrons. Vacuum allows the electrons to travel the dis-tance from the sample to the analyzer without being scattered or absorbed byparticles on their path. For electron spectroscopy to be feasible in standard set-ups the pressure should be at most 10−4 mbar. Furthermore the high energyphotons produced by the synchrotron also require HV vacuum so the experi-mental station has to be connected to the same vacuum as the synchrotron. Thesystem therefore needs continuous pumping to maintain vacuum. The pumpsused in our experimental set-up were roughing pumps and turbo molecularpumps for high vacuum. These can be read about elsewhere [98].
The vacuum requirement brings some additional experimental advantages.For example, there will be no contamination of the sample, ideally. This isdesired since contaminants may change the properties of the material underinvestigation. At atmospheric pressure surface atoms are bombarded by freeatoms and molecules approximately 108 times per second. Even if only a verysmall fraction of the collisions result in contamination, a clean surface willremain clean for a very short time. In ultra-high vacuum (≤10−8 mbar) thecollision rate is decreased to about one hit per day [19]. In the experimentspresented in the Papers of this Thesis the flight time of the clusters beforeprobing was about 100 µs. Hence, the risk of contamination has been verylow.
1www.maxlab.lu.se2www.bessy.de
51

4.2 Synchrotron radiationA synchrotron radiation (SR) facility is a laboratory where photons are pro-duced by accelerated charged particles. The most crucial part of the syn-chrotron is the storage ring where high-energy electrons are stored in orbit.Magnets are used to control and guide the electron beam in the ring. In eachturn of the ring the electrons are centripetally accelerated by the magneticforce, and as a result photons are emitted [99].
β=0.3 β=0.9β=0.0
v
vv
a
Figure 4.1: Radiated power per unit angle for an electron in a circular orbit. v showsthe direction of the traveling electron and a shows the direction of the acceleration.The figure is used with the kind permission of A. Lindblad.
In Figure 4.1 the direction of the radiation emitted by the electrons is plottedfor three different velocity fractions, β , of the speed of light. As illustrated bythe figure, accelerated relativistic electrons result in a very intense light beamwith high directionality. To further increase the intensity of the radiation thestorage rings are often equipped with magnetic tools called insertion devices.Beamline I411, described below, is fed photons by an insertion device calledan undulator. The simplest undulator is an array of dipole magnets, forcingthe electrons passing through the undulator to take a sinusoidal path. Since thehigh-energy electrons emit radiation in each turn and the sinusoidal path in-creases the number of turns, the electrons will emit photons at more instances.This yields a higher photon flux. In addition, in an undulator the electronsare kept close to a linear path through the device and the emitted photons willinterfere constructively (see the undulator equation in e.g. ref. [99]). Construc-tive interference leads to a very large increase of brilliance3.
By altering the gap between the undulator magnets and thereby changingthe strength of the magnetic field in the devise, it is possible to select which
3Brilliance is a collective measure of the intensity, the point-likeness of the source, and thedirectionality of the radiation.
52

photon energy will undergo constructive interference. In practice more thanone energy is selected due to higher order overtones, for which conditionsare also favorable. This can be read about elsewhere [99]. In summary, thephotons produced in this manner are collectively called synchrotron radiation,and the radiation is characterized by several factors:
i SR is continuous, tunable from the hard x-rays to the IR region.ii SR has well defined polarization properties.
iii SR has very high brilliance.iv SR is generated under ultrahigh vacuum conditions.
4.3 Beamline I411Beamline I411 at MAX-lab is a soft x-ray beamline built for electron spec-troscopy on gases, liquids and solids [100, 101]. The undulator in the stor-age ring provides the photons which are lead through a series of optical ele-ments to achieve the desired focused and energy selected beam of photons atthe experiment. An overview picture of the beamline is found in Figure 4.2.The radiation from the undulator is focused in the horizontal plane onto themonochromator exit slit by a spherical mirror M1. The monochromator4 is themost important part of the optical system since that is where the undulator-set photon energy is purified. The Zeiss SX700 monochromator installed onbeamline I411 consists of three optical components: a plane mirror M2, aplane diffraction grating G1 and a plane elliptical mirror M3. The diffractiongrating reflects photons of different energies in different angles. By tilting thegrating, relative to the fixed exit slit, the photons of the desired energy are se-lected. M3 horizontally focuses the photons onto the exit slit so the radiation isdivergent after exiting the monochromator. The toroidal mirror M4 refocusesthe radiation, both vertically and horizontally, into the end station where theexperiments take place [101].
LH
ZEISS
ZEISS
M1 G 1 M3 M4
E xperimental E nd S tation
MA
X I
I
Monochromator
M2R 4000
Figure 4.2: Overview of beamline I411 at MAX-lab.
The end station is rotatable from 0 to 90, with respect to the linear, hori-zontal polarization of the synchrotron light, thus allowing angle resolved stud-ies. Furthermore, this makes it possible to set the electron detection angle,
4Greek: mono = one, chromo = color i.e. energy.
53
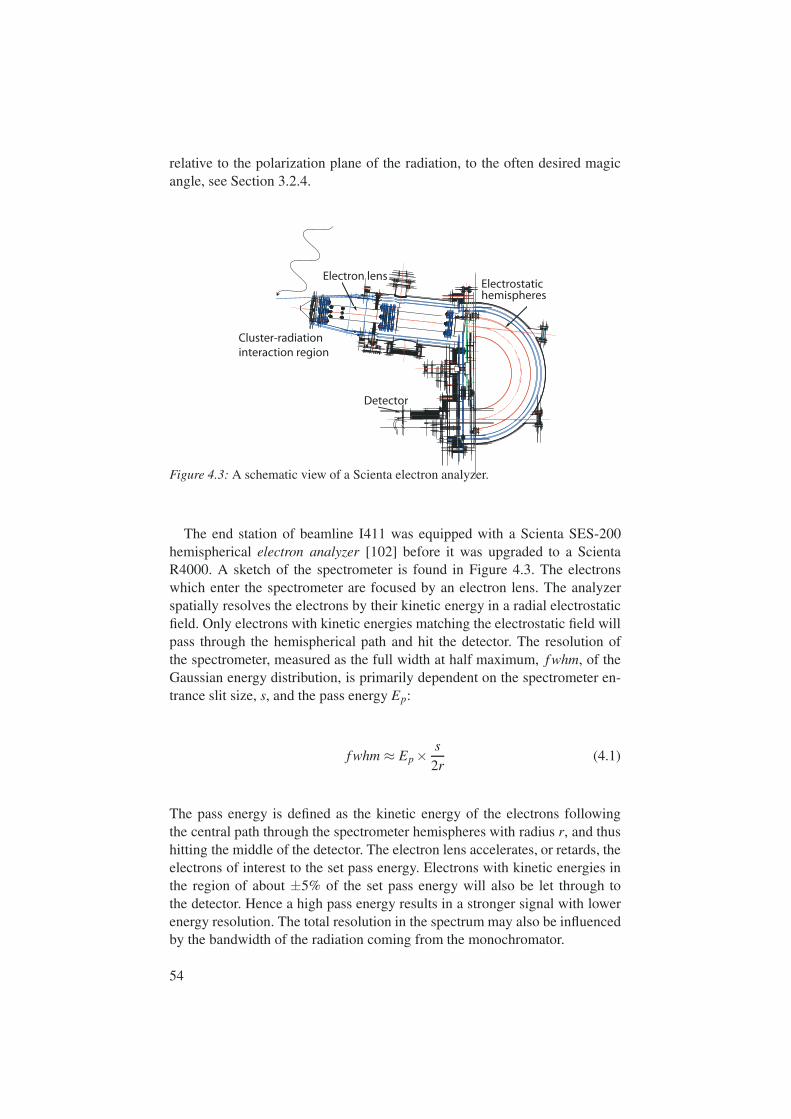
relative to the polarization plane of the radiation, to the often desired magicangle, see Section 3.2.4.
Cluster-radiationinteraction region
Electron lens Electrostatichemispheres
Detector
Figure 4.3: A schematic view of a Scienta electron analyzer.
The end station of beamline I411 was equipped with a Scienta SES-200hemispherical electron analyzer [102] before it was upgraded to a ScientaR4000. A sketch of the spectrometer is found in Figure 4.3. The electronswhich enter the spectrometer are focused by an electron lens. The analyzerspatially resolves the electrons by their kinetic energy in a radial electrostaticfield. Only electrons with kinetic energies matching the electrostatic field willpass through the hemispherical path and hit the detector. The resolution ofthe spectrometer, measured as the full width at half maximum, f whm, of theGaussian energy distribution, is primarily dependent on the spectrometer en-trance slit size, s, and the pass energy Ep:
f whm ≈ Ep ×s
2r(4.1)
The pass energy is defined as the kinetic energy of the electrons followingthe central path through the spectrometer hemispheres with radius r, and thushitting the middle of the detector. The electron lens accelerates, or retards, theelectrons of interest to the set pass energy. Electrons with kinetic energies inthe region of about ±5% of the set pass energy will also be let through tothe detector. Hence a high pass energy results in a stronger signal with lowerenergy resolution. The total resolution in the spectrum may also be influencedby the bandwidth of the radiation coming from the monochromator.
54
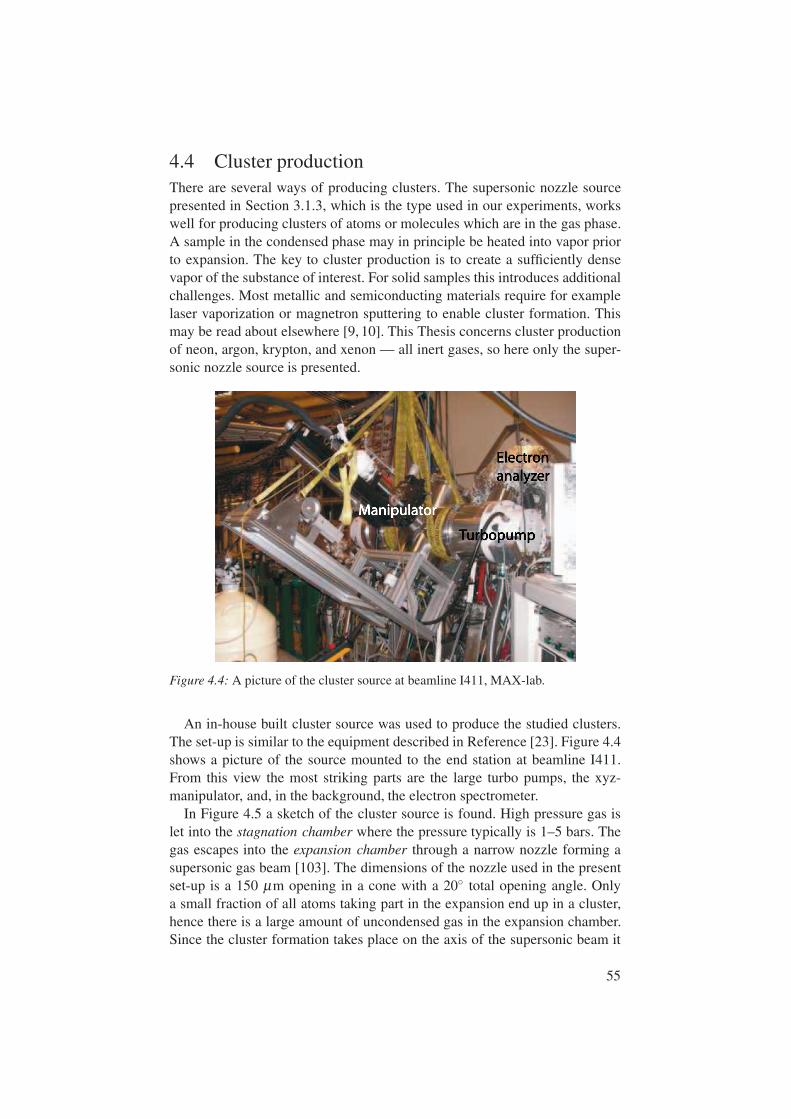
4.4 Cluster productionThere are several ways of producing clusters. The supersonic nozzle sourcepresented in Section 3.1.3, which is the type used in our experiments, workswell for producing clusters of atoms or molecules which are in the gas phase.A sample in the condensed phase may in principle be heated into vapor priorto expansion. The key to cluster production is to create a sufficiently densevapor of the substance of interest. For solid samples this introduces additionalchallenges. Most metallic and semiconducting materials require for examplelaser vaporization or magnetron sputtering to enable cluster formation. Thismay be read about elsewhere [9, 10]. This Thesis concerns cluster productionof neon, argon, krypton, and xenon — all inert gases, so here only the super-sonic nozzle source is presented.
Figure 4.4: A picture of the cluster source at beamline I411, MAX-lab.
An in-house built cluster source was used to produce the studied clusters.The set-up is similar to the equipment described in Reference [23]. Figure 4.4shows a picture of the source mounted to the end station at beamline I411.From this view the most striking parts are the large turbo pumps, the xyz-manipulator, and, in the background, the electron spectrometer.
In Figure 4.5 a sketch of the cluster source is found. High pressure gas islet into the stagnation chamber where the pressure typically is 1–5 bars. Thegas escapes into the expansion chamber through a narrow nozzle forming asupersonic gas beam [103]. The dimensions of the nozzle used in the presentset-up is a 150 µm opening in a cone with a 20 total opening angle. Onlya small fraction of all atoms taking part in the expansion end up in a cluster,hence there is a large amount of uncondensed gas in the expansion chamber.Since the cluster formation takes place on the axis of the supersonic beam it
55
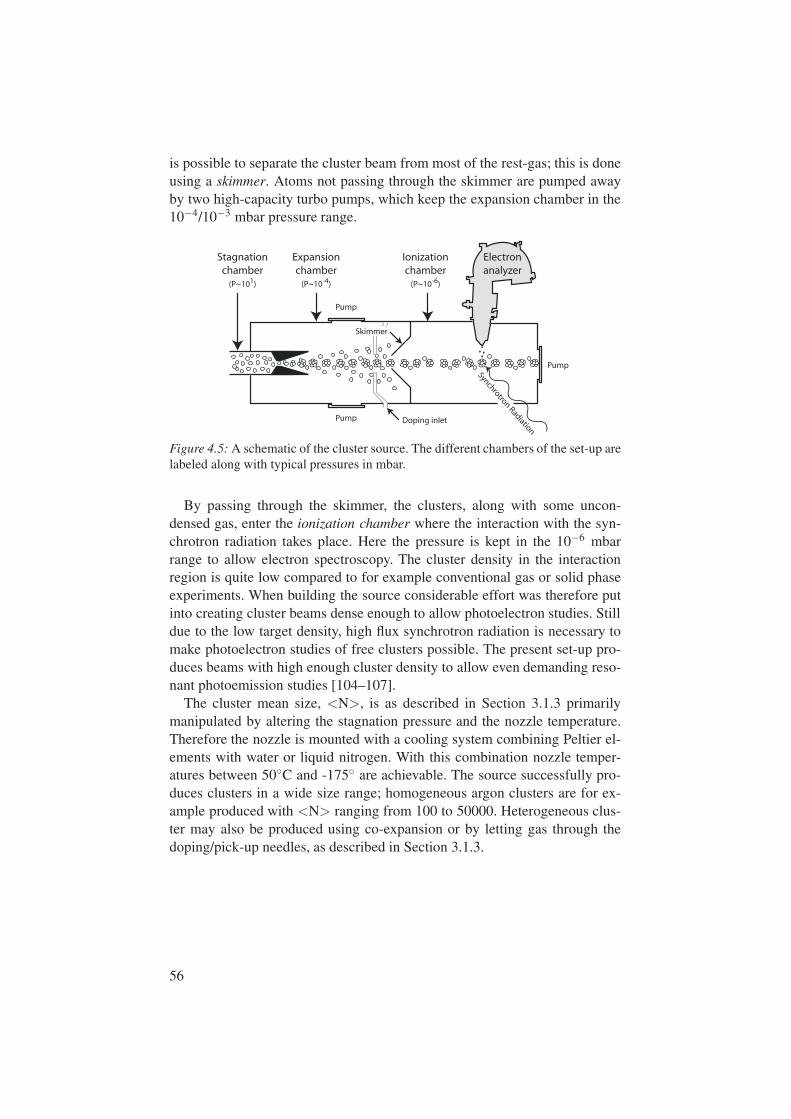
is possible to separate the cluster beam from most of the rest-gas; this is doneusing a skimmer. Atoms not passing through the skimmer are pumped awayby two high-capacity turbo pumps, which keep the expansion chamber in the10−4/10−3 mbar pressure range.
Synchrotron Radiation
Pump
Pump
Doping inlet
Pump
Stagnationchamber
(P~101)
Expansionchamber
(P~10-4)
Ionizationchamber
(P~10-6)
Electronanalyzer
Skimmer
Figure 4.5: A schematic of the cluster source. The different chambers of the set-up arelabeled along with typical pressures in mbar.
By passing through the skimmer, the clusters, along with some uncon-densed gas, enter the ionization chamber where the interaction with the syn-chrotron radiation takes place. Here the pressure is kept in the 10−6 mbarrange to allow electron spectroscopy. The cluster density in the interactionregion is quite low compared to for example conventional gas or solid phaseexperiments. When building the source considerable effort was therefore putinto creating cluster beams dense enough to allow photoelectron studies. Stilldue to the low target density, high flux synchrotron radiation is necessary tomake photoelectron studies of free clusters possible. The present set-up pro-duces beams with high enough cluster density to allow even demanding reso-nant photoemission studies [104–107].
The cluster mean size, <N>, is as described in Section 3.1.3 primarilymanipulated by altering the stagnation pressure and the nozzle temperature.Therefore the nozzle is mounted with a cooling system combining Peltier el-ements with water or liquid nitrogen. With this combination nozzle temper-atures between 50C and -175 are achievable. The source successfully pro-duces clusters in a wide size range; homogeneous argon clusters are for ex-ample produced with <N> ranging from 100 to 50000. Heterogeneous clus-ter may also be produced using co-expansion or by letting gas through thedoping/pick-up needles, as described in Section 3.1.3.
56
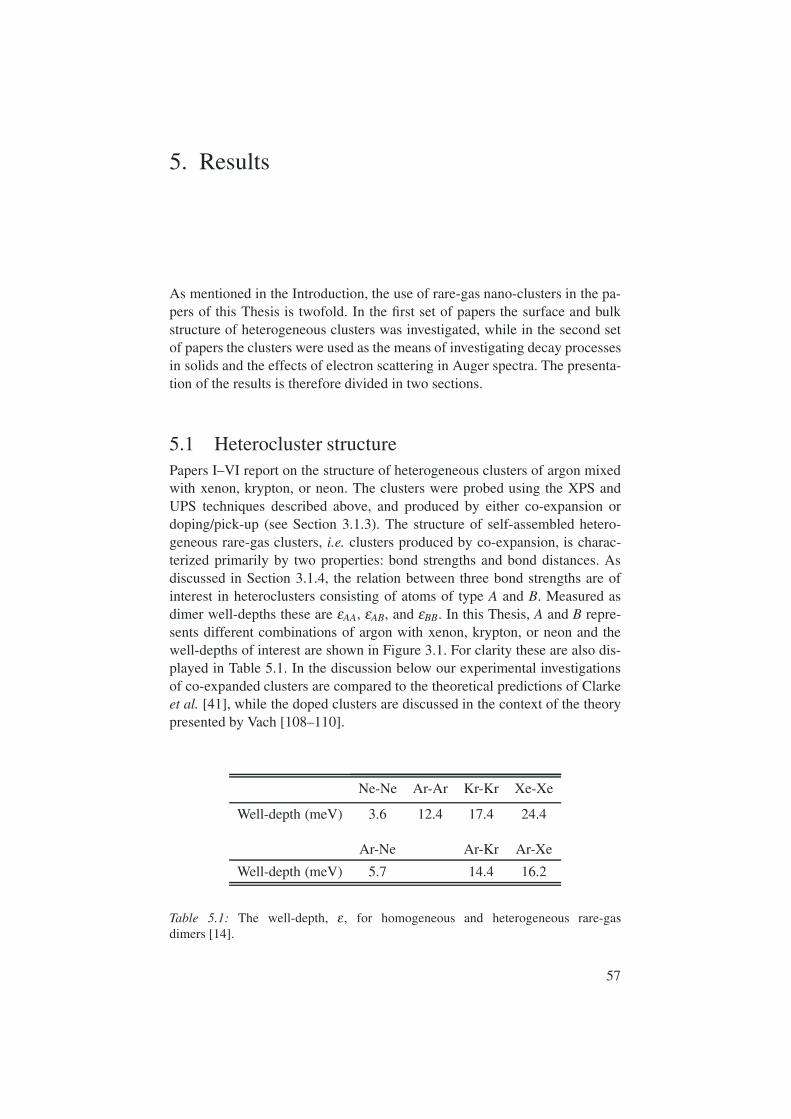
5. Results
As mentioned in the Introduction, the use of rare-gas nano-clusters in the pa-pers of this Thesis is twofold. In the first set of papers the surface and bulkstructure of heterogeneous clusters was investigated, while in the second setof papers the clusters were used as the means of investigating decay processesin solids and the effects of electron scattering in Auger spectra. The presenta-tion of the results is therefore divided in two sections.
5.1 Heterocluster structurePapers I–VI report on the structure of heterogeneous clusters of argon mixedwith xenon, krypton, or neon. The clusters were probed using the XPS andUPS techniques described above, and produced by either co-expansion ordoping/pick-up (see Section 3.1.3). The structure of self-assembled hetero-geneous rare-gas clusters, i.e. clusters produced by co-expansion, is charac-terized primarily by two properties: bond strengths and bond distances. Asdiscussed in Section 3.1.4, the relation between three bond strengths are ofinterest in heteroclusters consisting of atoms of type A and B. Measured asdimer well-depths these are εAA, εAB, and εBB. In this Thesis, A and B repre-sents different combinations of argon with xenon, krypton, or neon and thewell-depths of interest are shown in Figure 3.1. For clarity these are also dis-played in Table 5.1. In the discussion below our experimental investigationsof co-expanded clusters are compared to the theoretical predictions of Clarkeet al. [41], while the doped clusters are discussed in the context of the theorypresented by Vach [108–110].
Ne-Ne Ar-Ar Kr-Kr Xe-Xe
Well-depth (meV) 3.6 12.4 17.4 24.4
Ar-Ne Ar-Kr Ar-Xe
Well-depth (meV) 5.7 14.4 16.2
Table 5.1: The well-depth, ε , for homogeneous and heterogeneous rare-gasdimers [14].
57
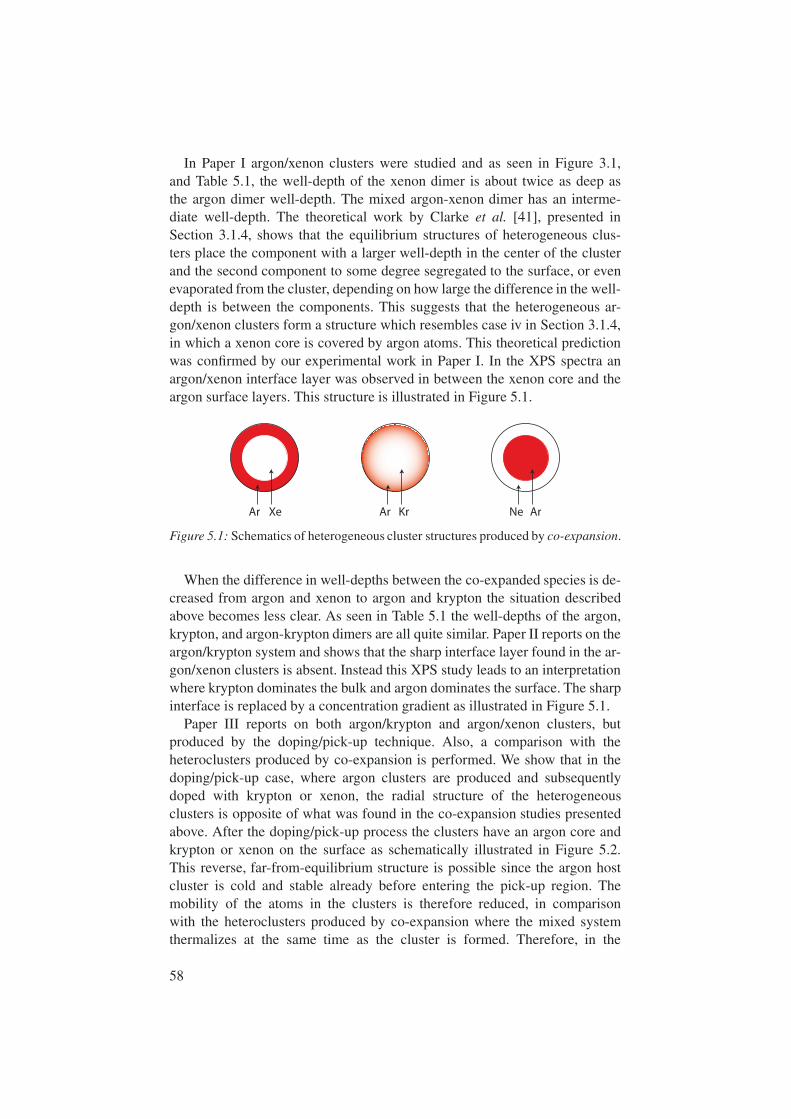
In Paper I argon/xenon clusters were studied and as seen in Figure 3.1,and Table 5.1, the well-depth of the xenon dimer is about twice as deep asthe argon dimer well-depth. The mixed argon-xenon dimer has an interme-diate well-depth. The theoretical work by Clarke et al. [41], presented inSection 3.1.4, shows that the equilibrium structures of heterogeneous clus-ters place the component with a larger well-depth in the center of the clusterand the second component to some degree segregated to the surface, or evenevaporated from the cluster, depending on how large the difference in the well-depth is between the components. This suggests that the heterogeneous ar-gon/xenon clusters form a structure which resembles case iv in Section 3.1.4,in which a xenon core is covered by argon atoms. This theoretical predictionwas confirmed by our experimental work in Paper I. In the XPS spectra anargon/xenon interface layer was observed in between the xenon core and theargon surface layers. This structure is illustrated in Figure 5.1.
Ar Xe Ar Kr Ne Ar
Figure 5.1: Schematics of heterogeneous cluster structures produced by co-expansion.
When the difference in well-depths between the co-expanded species is de-creased from argon and xenon to argon and krypton the situation describedabove becomes less clear. As seen in Table 5.1 the well-depths of the argon,krypton, and argon-krypton dimers are all quite similar. Paper II reports on theargon/krypton system and shows that the sharp interface layer found in the ar-gon/xenon clusters is absent. Instead this XPS study leads to an interpretationwhere krypton dominates the bulk and argon dominates the surface. The sharpinterface is replaced by a concentration gradient as illustrated in Figure 5.1.
Paper III reports on both argon/krypton and argon/xenon clusters, butproduced by the doping/pick-up technique. Also, a comparison with theheteroclusters produced by co-expansion is performed. We show that in thedoping/pick-up case, where argon clusters are produced and subsequentlydoped with krypton or xenon, the radial structure of the heterogeneousclusters is opposite of what was found in the co-expansion studies presentedabove. After the doping/pick-up process the clusters have an argon core andkrypton or xenon on the surface as schematically illustrated in Figure 5.2.This reverse, far-from-equilibrium structure is possible since the argon hostcluster is cold and stable already before entering the pick-up region. Themobility of the atoms in the clusters is therefore reduced, in comparisonwith the heteroclusters produced by co-expansion where the mixed systemthermalizes at the same time as the cluster is formed. Therefore, in the
58
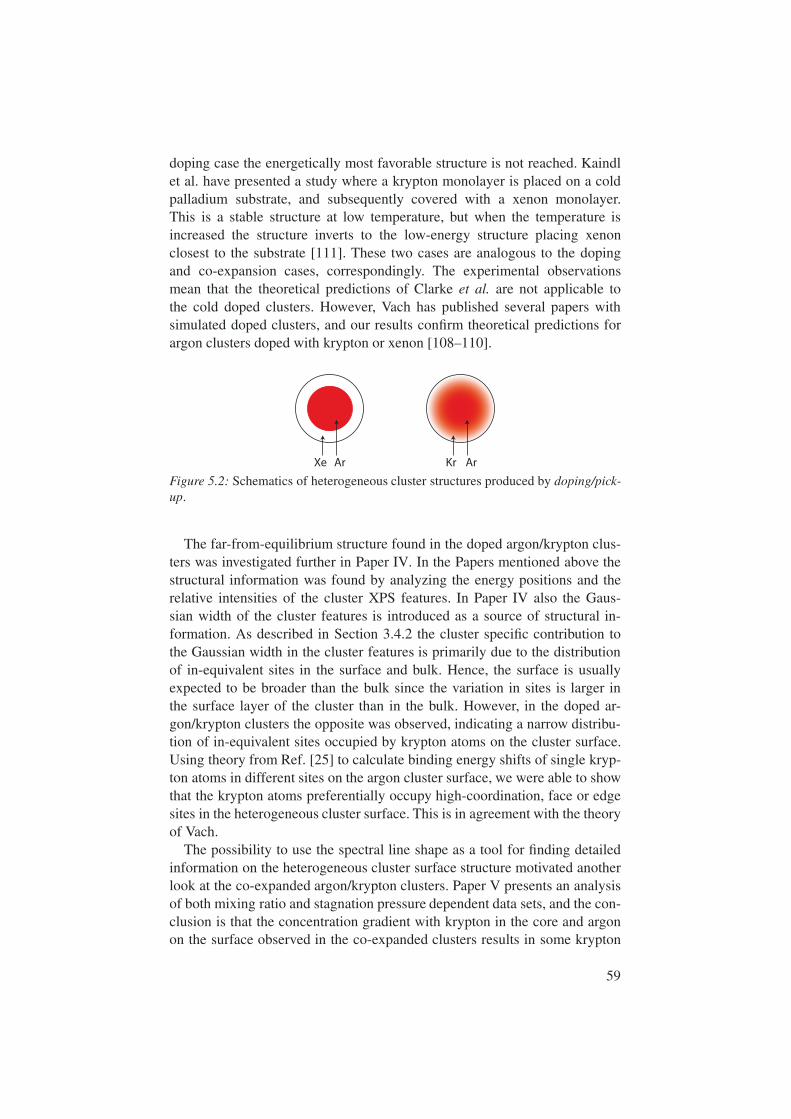
doping case the energetically most favorable structure is not reached. Kaindlet al. have presented a study where a krypton monolayer is placed on a coldpalladium substrate, and subsequently covered with a xenon monolayer.This is a stable structure at low temperature, but when the temperature isincreased the structure inverts to the low-energy structure placing xenonclosest to the substrate [111]. These two cases are analogous to the dopingand co-expansion cases, correspondingly. The experimental observationsmean that the theoretical predictions of Clarke et al. are not applicable tothe cold doped clusters. However, Vach has published several papers withsimulated doped clusters, and our results confirm theoretical predictions forargon clusters doped with krypton or xenon [108–110].
Xe Ar Kr Ar
Figure 5.2: Schematics of heterogeneous cluster structures produced by doping/pick-up.
The far-from-equilibrium structure found in the doped argon/krypton clus-ters was investigated further in Paper IV. In the Papers mentioned above thestructural information was found by analyzing the energy positions and therelative intensities of the cluster XPS features. In Paper IV also the Gaus-sian width of the cluster features is introduced as a source of structural in-formation. As described in Section 3.4.2 the cluster specific contribution tothe Gaussian width in the cluster features is primarily due to the distributionof in-equivalent sites in the surface and bulk. Hence, the surface is usuallyexpected to be broader than the bulk since the variation in sites is larger inthe surface layer of the cluster than in the bulk. However, in the doped ar-gon/krypton clusters the opposite was observed, indicating a narrow distribu-tion of in-equivalent sites occupied by krypton atoms on the cluster surface.Using theory from Ref. [25] to calculate binding energy shifts of single kryp-ton atoms in different sites on the argon cluster surface, we were able to showthat the krypton atoms preferentially occupy high-coordination, face or edgesites in the heterogeneous cluster surface. This is in agreement with the theoryof Vach.
The possibility to use the spectral line shape as a tool for finding detailedinformation on the heterogeneous cluster surface structure motivated anotherlook at the co-expanded argon/krypton clusters. Paper V presents an analysisof both mixing ratio and stagnation pressure dependent data sets, and the con-clusion is that the concentration gradient with krypton in the core and argonon the surface observed in the co-expanded clusters results in some krypton
59

atoms in surface sites. As in the doping case, these krypton atoms preferen-tially occupy high-coordination, face or edge sites in the argon-rich clustersurface. This conclusion is supported by calculated site-dependent bindingenergy shifts. Hence, despite the radially very different structure of the dopedand co-expanded argon/krypton cluster, the surface structure is similar. Theexperimentally determined structure of the co-expanded argon/krypton clus-ters corresponds to a combination of structures i and iii in Section 3.1.4.
Argon has been part of all the heterogeneous clusters discussed above andand in all cases it has been the component with the most shallow well-depth,gaining from coordination with the other component in the cluster. In Paper VIheterogeneous clusters of argon/neon, produced by co-expansion, are studied.Table 5.1 shows that the argon dimer well-depth is more than three times largerthan the neon dimer well-depth, and that the neon atom gains much from argoncoordination. In the structural predictions of Clarke et al. this relationship ofwell-depths corresponds to point iii, presented in Section 3.1.4, which placesargon in the core and neon in the surface of the cluster. In the simulationsthe neon atoms occupy sites with high argon coordination. Indeed our XPSstudy of the system shows that the argon atoms form the cluster core and theneon atoms occupy sites on the cluster surface as illustrated in Figure 5.1. Thestructural information is supported by calculations of site-dependent bindingenergy shifts. The experimental study also includes an extensive analysis ofthe valence region. The valence ionization, UPS spectra are shown in Fig-ure 5.3. Especially the width of the neon valence band is examined and linkedto the neon coordination on the argon cluster core. When only one monolayerof neon is present the observed band width is only half of the bulk value. Whena second layer is added the bandwidth resembles the neon solid. We proposethat the neon atoms in the monolayer occupy high-coordination hollow siteson the surface but when a second layer is built the neon atoms gain from highneon-neon coordination and the neon-argon interface becomes incommensu-rate. This is unexpected with regard to the predictions of Clarke et al., but itmay be understood by considering the trade between the well-depth and thebond distance. The van der Waals bond has a r−6 dependence. This leads tothat neon coordination can only compete with argon coordination by offeringmany neighbors and at close distance. As seen in Figure 3.1 the interatomicdistance of the neon dimer is smaller than in both mixed argon-neon and pureargon dimers. This means that when the neon-neon coordination becomes suf-ficiently high the total energy of the system may gain from allowing the neonlayers to adopt neon-neon interatomic distance instead of prioritizing highestpossible argon coordination.
Some observations regarding the heterogeneous cluster formation processcan be made in connection to Paper VI. This is a difficult topic since we onlymonitor the resulting cluster and not the actual formation process. In Fig-ure 5.3 the degree of condensation is clearly seen to vary through the seriesof measurements. In the spectra from the 50% argon in neon primary mixture
60
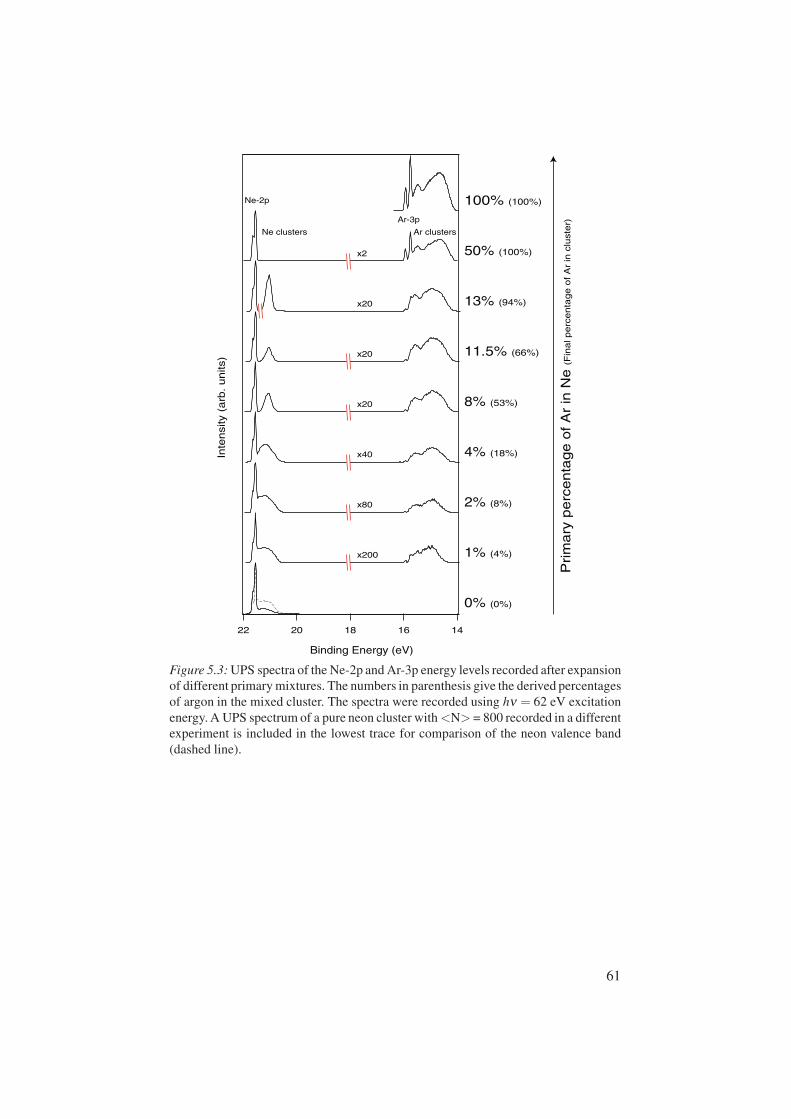
22 20 18 16 14
0% (0%)
1% (4%)
2% (8%)
4% (18%)
8% (53%)
11.5% (66%)
13% (94%)
50% (100%)
100% (100%)
x20
x2
x20
x20
x40
x80
x200
Binding Energy (eV)
Ne-2p
Ne clusters Ar clusters
Ar-3pIn
tensi
ty (
arb
. units
)
Prim
ary
perc
enta
ge o
f A
r in
Ne (F
ina
l pe
rce
nta
ge
of
Ar
in c
lust
er)
Figure 5.3: UPS spectra of the Ne-2p and Ar-3p energy levels recorded after expansionof different primary mixtures. The numbers in parenthesis give the derived percentagesof argon in the mixed cluster. The spectra were recorded using hν = 62 eV excitationenergy. A UPS spectrum of a pure neon cluster with <N> = 800 recorded in a differentexperiment is included in the lowest trace for comparison of the neon valence band(dashed line).
61

the neon cluster signal is absent while the the argon cluster signal is intense.In this case the neon acts as a buffer gas in the expansion, not taking part inthe condensation. The degree of condensation in the argon case, comparingthe relative intensity of the atomic and cluster signals, is in this case still equalto the pure 100% Ar expansion. However, when decreasing the argon contentin the primary mixture further, the degree of argon condensation is greatly af-fected. In fact, in all other studied cases but the 50% argon in neon case, thereis only a faint remainder of the atomic argon lines. The argon condensationis extremely efficient and the expansion is even cold enough to allow someneon atoms to condense as seen by the existence of a neon cluster signal inFigure 5.3.
The degree of condensation in neon is not as drastically affected as in ar-gon, but the degree of condensation in the pure neon case is roughly half ofthat after the 1% argon in neon co-expansion. We attribute this factor of twodifference to the role of the argon atoms in the heterogeneous cluster forma-tion process: In expansion of mixtures of neon with only little argon contentthe cluster beam becomes very cold and, as discussed above, evidence of thisis the very large degree of condensation observed in the argon UPS region. Un-der cold conditions we expect argon to condense more efficiently than neonsince the cohesive energy, and the well-depth, is almost four times larger forargon. This leads us to the conclusion that in the co-expansion the argon atomsform the condensations centers necessary for cluster formation. This conclu-sion is confirmed by the results of Vostrikov et al. [27]. Condensation centersof argon are more stable and resist for example evaporation in a stronger waythan condensation centers of neon, hence the neon cluster growth process be-comes more efficient with argon seeding.
In summary, by using photoelectron spectroscopy it is possible to investi-gate the radial structure of heterogeneous so-called core-shell nano-clusters.Furthermore, by studying the cluster feature line shapes we may also obtaindetailed information about the surface structure of the heterogeneous clus-ters. The photoelectron spectroscopy-technique is an addition to the toolsused in an active field of research. Studies using luminescence spectroscopyhas previously brought information on sparsely doped heterogeneous clus-ters [31, 112, 113]. For example, different xenon atoms in different shells oflarge argon clusters may be distinguished [29, 114]. There are also examplesof work studying cluster which are doped in two stages creating clusters witha krypton core, an argon shell (or a far-from-equilibrium structure with anargon core with a krypton shell) all embedded in large neon clusters [30,115].
As mentioned in Chapter 2 rare-gas clusters are suitable model systems formetal clusters. The tools for structure determination developed in this Thesismay in the future contribute to experimental studies of core-shell clusters offor example a nickel or copper core and a silver or gold shell [116,117]. Thesecore-shell combinations show stable structures, high melting points and in thecase of nickel/gold core/shell cluster a nonzero magnetic moment.
62
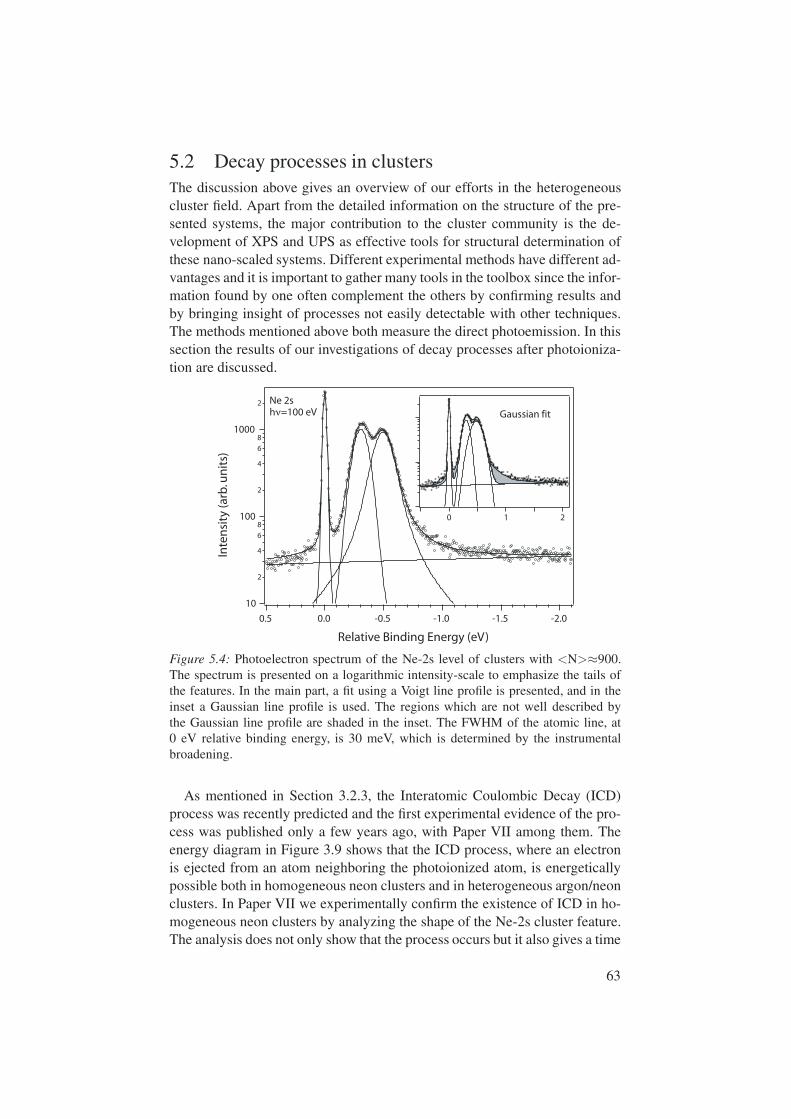
5.2 Decay processes in clustersThe discussion above gives an overview of our efforts in the heterogeneouscluster field. Apart from the detailed information on the structure of the pre-sented systems, the major contribution to the cluster community is the de-velopment of XPS and UPS as effective tools for structural determination ofthese nano-scaled systems. Different experimental methods have different ad-vantages and it is important to gather many tools in the toolbox since the infor-mation found by one often complement the others by confirming results andby bringing insight of processes not easily detectable with other techniques.The methods mentioned above both measure the direct photoemission. In thissection the results of our investigations of decay processes after photoioniza-tion are discussed.
Figure 5.4: Photoelectron spectrum of the Ne-2s level of clusters with <N>≈900.The spectrum is presented on a logarithmic intensity-scale to emphasize the tails ofthe features. In the main part, a fit using a Voigt line profile is presented, and in theinset a Gaussian line profile is used. The regions which are not well described bythe Gaussian line profile are shaded in the inset. The FWHM of the atomic line, at0 eV relative binding energy, is 30 meV, which is determined by the instrumentalbroadening.
As mentioned in Section 3.2.3, the Interatomic Coulombic Decay (ICD)process was recently predicted and the first experimental evidence of the pro-cess was published only a few years ago, with Paper VII among them. Theenergy diagram in Figure 3.9 shows that the ICD process, where an electronis ejected from an atom neighboring the photoionized atom, is energeticallypossible both in homogeneous neon clusters and in heterogeneous argon/neonclusters. In Paper VII we experimentally confirm the existence of ICD in ho-mogeneous neon clusters by analyzing the shape of the Ne-2s cluster feature.The analysis does not only show that the process occurs but it also gives a time
63
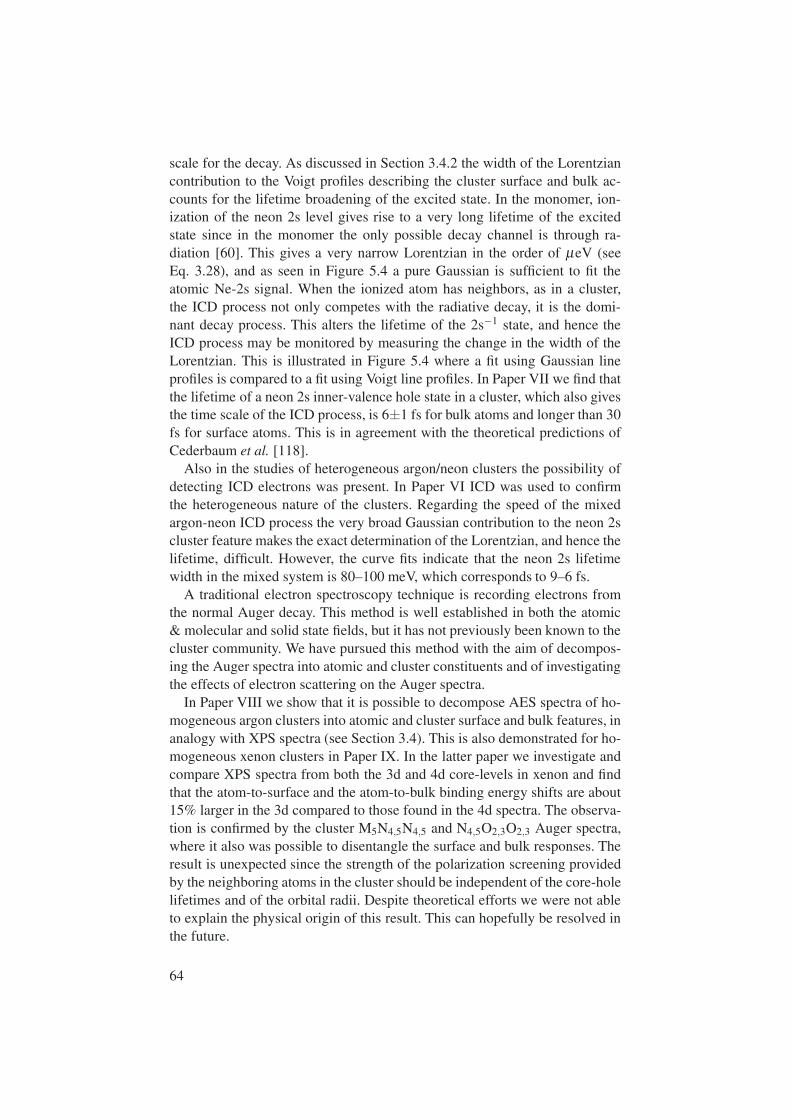
scale for the decay. As discussed in Section 3.4.2 the width of the Lorentziancontribution to the Voigt profiles describing the cluster surface and bulk ac-counts for the lifetime broadening of the excited state. In the monomer, ion-ization of the neon 2s level gives rise to a very long lifetime of the excitedstate since in the monomer the only possible decay channel is through ra-diation [60]. This gives a very narrow Lorentzian in the order of µeV (seeEq. 3.28), and as seen in Figure 5.4 a pure Gaussian is sufficient to fit theatomic Ne-2s signal. When the ionized atom has neighbors, as in a cluster,the ICD process not only competes with the radiative decay, it is the domi-nant decay process. This alters the lifetime of the 2s−1 state, and hence theICD process may be monitored by measuring the change in the width of theLorentzian. This is illustrated in Figure 5.4 where a fit using Gaussian lineprofiles is compared to a fit using Voigt line profiles. In Paper VII we find thatthe lifetime of a neon 2s inner-valence hole state in a cluster, which also givesthe time scale of the ICD process, is 6±1 fs for bulk atoms and longer than 30fs for surface atoms. This is in agreement with the theoretical predictions ofCederbaum et al. [118].
Also in the studies of heterogeneous argon/neon clusters the possibility ofdetecting ICD electrons was present. In Paper VI ICD was used to confirmthe heterogeneous nature of the clusters. Regarding the speed of the mixedargon-neon ICD process the very broad Gaussian contribution to the neon 2scluster feature makes the exact determination of the Lorentzian, and hence thelifetime, difficult. However, the curve fits indicate that the neon 2s lifetimewidth in the mixed system is 80–100 meV, which corresponds to 9–6 fs.
A traditional electron spectroscopy technique is recording electrons fromthe normal Auger decay. This method is well established in both the atomic& molecular and solid state fields, but it has not previously been known to thecluster community. We have pursued this method with the aim of decompos-ing the Auger spectra into atomic and cluster constituents and of investigatingthe effects of electron scattering on the Auger spectra.
In Paper VIII we show that it is possible to decompose AES spectra of ho-mogeneous argon clusters into atomic and cluster surface and bulk features, inanalogy with XPS spectra (see Section 3.4). This is also demonstrated for ho-mogeneous xenon clusters in Paper IX. In the latter paper we investigate andcompare XPS spectra from both the 3d and 4d core-levels in xenon and findthat the atom-to-surface and the atom-to-bulk binding energy shifts are about15% larger in the 3d compared to those found in the 4d spectra. The observa-tion is confirmed by the cluster M5N4,5N4,5 and N4,5O2,3O2,3 Auger spectra,where it also was possible to disentangle the surface and bulk responses. Theresult is unexpected since the strength of the polarization screening providedby the neighboring atoms in the cluster should be independent of the core-holelifetimes and of the orbital radii. Despite theoretical efforts we were not ableto explain the physical origin of this result. This can hopefully be resolved inthe future.
64

65
60
55
50
45
40
103
104
Mean Cluster Size <N>
Surf
ace
Sig
nal F
ract
ion (
% )
Normal AugerE kin ≈ 200 eV
445 eV XP SE kin ≈ 200 eV
2 3 4 5 6 2 3 4 5 6 2 3 4
Figure 5.5: Illustration of the surface signal fraction (surface intensity / total clusterintensity) variation in the argon cluster signal from normal Auger and 445 eV XPSspectra, as a function of mean cluster size. The lines are included as a help to the eye.The difference between the normal Auger and 445 eV XPS surface fractions is up to35%.
Apart from the demonstration of AES spectrum decomposition mentionedabove, Paper VIII also includes a size dependent study of the surface-to-bulkintensity ratio found in the Auger spectra compared to the photoelectron spec-tra. The results are summarized in Figure 5.5. The graph shows that even whenthe kinetic energy of the photoelectrons is equal to the kinetic energy of theAuger electrons, implying that the mean escape depth of both photoelectronsand Auger electrons should be equal, there is a large difference in the mea-sured surface signal fraction. We find that the AES technique is up to 35%more surface sensitive than the XPS. This result is discussed in the context ofelastic and inelastic scattering of both photoelectrons and Auger electrons.
After the ejection, the electron may scatter in several possible ways asshown in Figure 5.6. It may scatter elastically, which does not affect the ki-netic energy, or inelastically, which removes the electron from the spectralenergy region of interest. Therefore, in order to understand Auger spectra thefocus must be placed on the actions of the photoelectrons. Scenarios i and ii inFigure 5.6 do not affect the charge of the system and do not disturb the kineticenergy of the Auger electron. A more detailed discussion of this is found inPaper X.
Case iii in Figure 5.6 shows an inelastic scattering event. In the case ofsecondary ionization by the photoelectron the positive charge added to thesystem will affect the kinetic energy of the Auger electron. To what degree isdetermined by the distance between the photoionized atom and the secondarypositive charge. Since there are many possible distance in the cluster the sec-ondary ionization event will be seen as a featureless background in the Auger
65
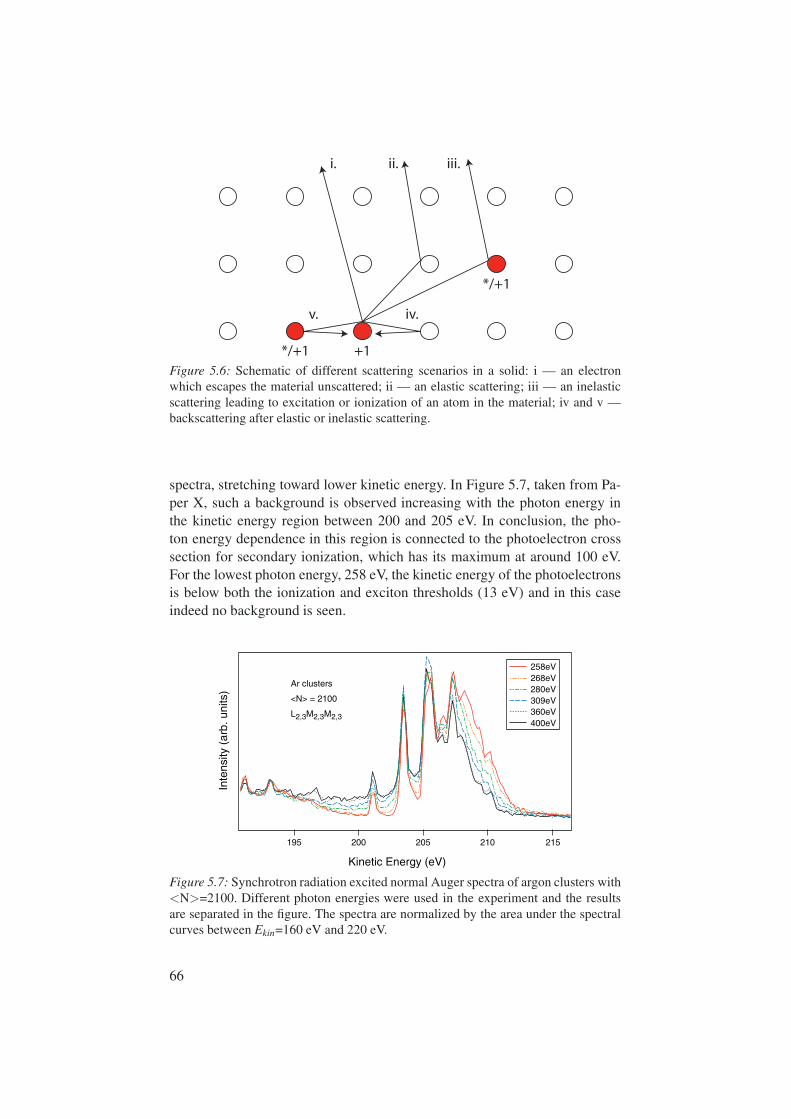
+1*/+1
*/+1
ii.i. iii.
iv.v.
Figure 5.6: Schematic of different scattering scenarios in a solid: i — an electronwhich escapes the material unscattered; ii — an elastic scattering; iii — an inelasticscattering leading to excitation or ionization of an atom in the material; iv and v —backscattering after elastic or inelastic scattering.
spectra, stretching toward lower kinetic energy. In Figure 5.7, taken from Pa-per X, such a background is observed increasing with the photon energy inthe kinetic energy region between 200 and 205 eV. In conclusion, the pho-ton energy dependence in this region is connected to the photoelectron crosssection for secondary ionization, which has its maximum at around 100 eV.For the lowest photon energy, 258 eV, the kinetic energy of the photoelectronsis below both the ionization and exciton thresholds (13 eV) and in this caseindeed no background is seen.
258eV 268eV 280eV 309eV 360eV 400eV
Kinetic Energy (eV)
Inte
nsity
(ar
b. u
nits
)
215210205200195
Ar clusters
<N> = 2100
L2,3M2,3M2,3
Figure 5.7: Synchrotron radiation excited normal Auger spectra of argon clusters with<N>=2100. Different photon energies were used in the experiment and the resultsare separated in the figure. The spectra are normalized by the area under the spectralcurves between Ekin=160 eV and 220 eV.
66

Above 205 eV kinetic energy in Figure 5.7 the 258 eV spectrum showshigher intensity than in the other measurements. In Paper X two cluster sizeswere probed, <N>=60 and 2100, but no clear size dependence of the intensitywas observed. This higher kinetic energy region was the focus of the investiga-tions presented in Paper XI where a photoelectron recapture process in homo-geneous argon clusters is suggested and pursued in a high-resolution, photonenergy dependent study. By decomposing a high photon energy spectrum intocluster surface and bulk contributions and using this result in the closer tothreshold spectra we were able to fit and quantify the recapture intensity. Theresult shows that almost 60% of the cluster specific intensity recorded in theargon L2,3M2,3M2,3 kinetic energy region, using 258 eV photon energy (≈10eV above threshold) of the ionizing radiation, was related to the photoelectronrecapture process.
Time
Atom Cluster
A
B
(c -1)
1+
(v -2R)
1+ (v -2R)
1+
(c -1R)
0
(c -1)
+1
hν
Figure 5.8: Schematic of the atomic recapture and normal Auger processes (left) andthe solid state pre-Auger recapture process (right). c represents core, v — valence,R — Rydberg, and the superscripts show the electron configuration and state charge.The time scale shows the photoionization event (A), the Auger decay (B).
Since the recaptured electrons have relatively high kinetic energy (>10 eV)and the recorded recapture features do not disperse with photon energy, theconservation of energy becomes an important issue. Since the photoelectronenergy is about 10 eV in the lowest case we may exclude secondary ioniza-tion processes as well as creation of so-called shake-up and exciton states. InPaper XI we propose that the excess energy in the recapture process is re-leased as radiation, in a bremsstrahlung-like inverse photoemission process.This leads us to conclude that the photoelectron recapture occurs prior to theAuger decay as illustrated in Figure 5.8. The process is possible in clusterssince the ejected photoelectron may scatter on neighboring atoms keeping itin the vicinity of the ionized atom. Scenarios iv and v in Figure 5.6 sketchthis so-called backscattering. This novel process we name Pre-Auger Recap-
67
ture (PAR) to distinguish it from the PCI-related recapture process previouslyobserved.
The large impact of the recapture intensity in the spectra can be seen bycomparing the ratio, R, of the total cluster (normal Auger+recapture) inten-sity with the atomic intensity. As seen in Figure 1 of Paper XI there is a largeincrease in R when the photon energy is decreased. This is the opposite ofwhat is observed in XPS measurements [77] where R decreases as the pho-ton energy approaches the L2,3 threshold. For the photoelectron spectra thisis traditionally understood as due to inelastic scattering. The results presentedin Paper XI show that also the PAR process contributes to the decrease in R
observed in XPS measurements at different photon energies. Hence, the pre-Auger recapture may influence the apparent mean free path of photoelectronsquite high above the threshold.
In summary, we have established that the Auger Electron Spectroscopytechnique is a useful tool in the study of non-conducting solids. It is a moresurface sensitive probe than photoelectron spectroscopy, at least in the case ofargon. Electron scattering events in the material affect the Auger spectrum invarious ways and these have been given much attention, for instance a novelprocess we call pre-Auger recapture (PAR) has been proposed.
68

6. Summary and outlook
The results presented in this Thesis fall into two categories. The firstconcerns the structure of heterogeneous rare-gas clusters produced byeither co-expansion or doping/pick-up. XPS and UPS spectra recordedusing synchrotron radiation were analyzed by performing curve fits. Theresults show that argon/neon, argon/krypton, and argon/xenon heteroclustersformed by co-expansion all form close-to-equilibrium structures, placing thespecies with higher cohesive energy in the core of the cluster. However, inthe argon/krypton case a line shape analysis, supported by site-dependentbinding energy shift calculations, showed that some krypton atoms occupysurface sites. These krypton atoms were concluded to preferentially occupyhigh-coordination sites in the surface layer.
For heterogeneous argon/krypton and argon/xenon clusters produced bydoping/pick-up we show, using the same spectroscopic techniques as above,that the reversed structures can be obtained, compared to the heteroclustersformed by co-expansion. In the case of the doped argon/krypton clusters weshow that the krypton atoms preferentially occupy high-coordination siteson/in the argon cluster surface, leading to similar surface structure as in theco-expansion case.
The second category of results concern the decay of excited states in clus-ters and, in connection to this, scattering of electrons in matter. Two forms ofdecay were discussed: ICD and Auger decay. ICD was theoretically predictedand we present experimental evidence of the process in line shape studies ofhomogeneous neon clusters. In the studies of heterogeneous clusters electronsemitted in the ICD were detected to prove the mixed nature of the argon/neonclusters.
Our work involving the interpretation of Auger spectra from clusters in-cludes the basic technique of decomposing the spectra into atomic and clustersurface and bulk contributions. Using the decomposition method we were forexample able to confirm that the atom-to-cluster binding energy shifts in Xe-3d XPS measurements are about 15% larger than those recorded in the Xe-4dspectra. Furthermore, we show that the Auger spectroscopy on argon clustersis more surface sensitive than the XPS technique.
We also show that the Auger response is photon energy dependent and thisis discussed in terms of electron scattering in the clusters. Special effort wasput into understanding the photon energy dependent intensity appearing onthe high-kinetic energy side of the normal Auger signal. This was attributed
69

to a solid state-specific photoelectron recapture process we named pre-Augerrecapture (PAR) which affects the kinetic energy of the Auger electrons.
There is of course much knowledge to be gained by continuing the inves-tigations summarized above. Some candidates for future research are listedhere:
i The unexplained origin of the shell-dependent binding energy shiftsobserved in xenon clusters is an obvious point. Here further investiga-tion could for example include other van der Waals bonded systemsof both atoms and molecules. This could also be pursued in mixedsystems to investigate a potential dependence on bond distance.
ii Investigation of mixed systems may in the future gain from usingAuger spectroscopy. The atom-to-cluster binding energy shifts in theAES spectra are three times larger than in the photoelectron spectrawhich means that AES provides the possibility to better resolve forexample interface layers, compared to XPS.
iii The observation of the photon energy dependent recapture relatedintensity in the normal Auger spectra clearly deserves further inves-tigation. The PAR process could for example be confirmed by de-tecting the photons emitted in the recapture. Furthermore, the clusterrecapture related intensity can perhaps be used as a direct measureof inelastic scattering in matter with non-metallic screening. In thiscontext an investigation of the connection between photoelectron re-capture and the minimum of the universal curve of inelastic meanfree path could be performed.
In a somewhat broader perspective, several new methods and systems are ofinterest. The development of free electron lasers already provides exciting newpossibilities for photon-hungry experiments such as probing size selected freeclusters. As mentioned in the Introduction, rare-gas clusters are well-suitedmodel systems for metallic clusters. Therefore, a natural progression wouldtherefore be to start transferring our assembled knowledge from the rare-gasclusters to their metal relatives. This work is well underway in Björneholm’sgroup and the first results of photoelectron spectra of homogeneous metallicclusters are already being analyzed. In my point of view, this will becomeeven more thrilling when mixed systems are pursued. In all this the knowl-edge of how to use electron spectroscopy to investigate nano-particles is ofgreat importance. The guidelines developed for extracting structural informa-tion from rare-gas cluster feature line shapes may prove very helpful whenpursuing these more applied systems.
70

Acknowledgements
My five years at the Department of Physics turned out to be more fun than Icould ever have dreamed of. I have my supervisors, former and present fellowPhD-students, and all coworkers at Physics 5 to thank for that. My supervisorsdeserve special recognition: Olle Björneholm, Maxim Tchaplyguine, GunnarÖhrwall, and Svante Svensson — what a team! You have introduced me toresearch and have been available for discussions to an extent beyond whatcan be expected. Thank you! I congratulate all your future PhD-students forfinding an outstanding set of supervisors!
Many thanks to the staff of MAX-lab for being very friendly, helpful andcreating the most cozy synchrotron facility in the world . Also the group ofUwe Hergenhahn in Berlin, Germany, are acknowledged for a very nice col-laboration. I enjoyed our discussions and visiting Berlin. Thanks!
In order to be a successful scientist not only the work environment shouldbe inspiring, but also the private life. Hence, I have my family and friends tothank for my success! You’ve done a fantastic job in taking care of my sparetime. My brain gains in capacity by receiving creative input from friends, oftenin combination with good food, beer, and music! The whole Uppsala experi-ance has been extremely positive for me and all my friends are most gratefullyacknowledged for making life fun and inspiring. Two Uppsala organizationsdeserve thanks for bringing me joy and many of the friends already men-tioned: V-Dala nation and Allmänna Sången. Thanks also to my parents fortheir never-ending support and encouragement. The same goes for my sisterand her family: KFZE, you provide the most high-pace, restful, and lovingenvironment in town! Thank you!
Uppsala, December, 2006
Marcus Lundwall
71

A. Adiabatic expansion into vacuum
In order to find the temperature change in a non-ideal gas when expanded intovacuum, we need to express the internal energy as a function of temperatureand volume, U(T,V ). The derivation presented here follows J. Harnes [12].To start the first and second laws of thermodynamic are combined. For a re-versible process this gives the central equation of thermodynamics:
dU = T dS− pdV +∑i
µidNi (A.1)
Here the sum is over all Ni particles and µi denotes the chemical poten-tial per particle. In the present case the number of particles in the process isconstant, and hence Eq. A.1 may written as: dU = T dS− pdV . U is a ther-modynamic function and may be expressed as a total differential [19]. FordN = 0, U(S,V,N) may be written as:
(dU)Ni =
(dUdS
)V,Ni
dS+
(dUdV
)S,Ni
dV (A.2)
= T dS− pdV
In Eq. A.2 we have identified T =(
dUdS
)V,Ni
and −p =(
dUdV
)S,Ni
. In order tomake (dU)Ni a function of T and V instead of S and V we must convert the dSdifferential to a differential in T and V [119]. We therefore write the entropyS as a total differential of T and V :
dS =
(dSdT
)V
dT +
(dSdV
)T
dV (A.3)
At constant volume processes, dV = 0, and by dividing Eq. A.2 by (dT )V
we receive:
dUV
dTV=
(∂U∂T
)V
= T
(∂S∂T
)V
(A.4)
Here we identify the heat capacity for a gas at constant volume CV = (∂U∂T )V .
This gives:
(∂S∂T
)V
=CV
T(A.5)
73

By using the Maxwell relation ( ∂S∂V )T,Ni = ( ∂ p
∂T )V,Ni and Eq. A.5 we mayrewrite Eq. A.3:
dS =
(CV
T
)dT +
(∂ p∂T
)V,Ni
dV (A.6)
Now we are ready to express (dU)Ni as a function of T and V . By substitut-ing the dS in Eq. A.6 with the result found in Eq. A.2 we obtain:
(dU)Ni = CV dT +
[T
(∂ p∂T
)V,Ni
− p
]dV (A.7)
The temperature change associated with adiabatic expansion into vacuumwhere dU = 0 may now be written as [119]:
(dT )U =1
CV
[p−T
(∂ p∂T
)V,Ni
]dVU (A.8)
We divide Eq. A.8 by dVU :
(dT )U
(dV )U=
(∂T∂V
)U
=1
CV
[p−T
(∂ p∂T
)V,Ni
](A.9)
We have now an expression which describes the change in temperature uponadiabatic expansion in vacuum. Now we will consider the expansion of anideal gas and non-ideal gas. First recall the ideal gas law:
pV = nRT (A.10)
Combining Eq. A.10 and Eq. A.9 yields dT = 0. Hence, there will be notemperature change in an ideal gas expanding adiabatically into vacuum. Ifwe now move to consider a real gas, the van der Waals law for non-ideal gasesmay be used instead of the ideal gas law:(
p+a
V 2m
)(Vm −b) = RT (A.11)
Here a and b are constants dependent on the type of gas. a describes theintermolecular/interatomic attraction and b compensates for the size of themolecule/atom. Vm is the molar volume. Since the term ( ∂ p
∂T )V,Ni is used inEq. A.9 we rewrite Eq. A.11 accordingly:(
∂ p∂T
)V,Ni
=R
Vm −b(A.12)
Using Eq. A.12 and Eq. A.11 in Eq. A.9 gives:(∂T∂V
)U
= − aCVV 2
m(A.13)
74
For a finite volume change we get:
T2 −T1 =a
CV
(1
Vm,2− 1
Vm,1
)(A.14)
When expanding the gas into vacuum, V2 will approach infinity. Thereforewe find:
T2 = T1 −a
CVVm,1(A.15)
Hence, we have found an expression for the temperature change in an adi-abatic expansion which is dependent on a, CV , and Vm,1 of the expanding gas.Since all these properties are positive in the normal case, the gas will be cooledin the adiabatic expansion. Note that this expression is valid for van der Waalsgases.
75


B. Nomenclature of electronspectroscopy
An atom consists of a nucleus and surrounding electrons. The electrons arerestricted to move in certain orbitals due to the quantization of energy, andthe principle quantum number n and the orbital quantum number l (= 0, 1,2, . . . , n-1) describe these. When writing the orbital quantum number, lettersare used instead of numbers: 0, 1, 2, . . . becomes s, p, d, f, . . . . Combiningthese two quantum numbers give the spectroscopic notation of atomic shells(n) and sub-shells (l). Argon has position 18 in the periodic table of elements.Hence it has 18 electrons in the ground state and has the following groundstate electron configuration: 1s22s22p63s23p6 where the superscript numbergives the number of electrons in the energy level.
The Pauli principle rules that no two electrons in the system may sharethe same quantum number set-up. Therefore, we must introduce the ml and squantum numbers to understand how for example 6 electrons may occupy ap sub-shell. ml may take the following values: l, l − 1, . . . , −l. The s quan-tum number describes the intrinsic orbital momentum of the electrons, the socalled spin. The corresponding ms quantum number may take either of twovalues: + 1
2 or − 12 . These are known as spin-up and spin-down, respectively.
In conclusion, every electron in an atom must, according to the Pauli princi-ple, have a unique set of (n, l,ml ,ms). This gives that the maximum number ofelectrons in a p sub-shell will be 6.
The electrons in the outermost shell, in the argon atom the 3p shell, arecalled outer valence electrons and are largely responsible for the bonds theatom may form. The 3s electrons in argon are often referred to as inner-valence electrons. In contrast, the electrons with lower n quantum numberare distributed close to the nucleus and are denoted as core electrons. Theseelectrons do not directly participate in chemical bonding (the overlap betweencore orbitals on different atoms is negligible) and therefore maintain atomiccharacteristics even in solids. Figure 3.6-a illustrates the separation of coreand valence electrons in a ground state configuration.
The energy of a sub-shell is often not unique. The spin angular momen-tum gives rise to a magnetic moment since moving charges generate magneticfields. Electrons with orbital angular momentum, i.e. electrons with l > 0, arebasically circulating charges, so this also gives rise to a magnetic moment. Theinteraction between the spin and orbital momenta is called spin-orbit couplingand give rise to energy splittings of the sub-shell. The spin-orbit coupling is
77

described in terms of the total angular momentum, i.e. the vector sum of theelectrons spin and orbital momenta. In this Thesis it is sufficient to describethis total angular momentum with the quantum number j, which may take thevalues l±ms = l + 1
2 or l − 12 . For a p sub-shell j may therefore be either 1
2or 3
2 . This number is given as a subscript when describing what energy levelis probed. In Figure 3.13 an example of spin-orbit splitting can be seen. TheAr-2p1/2 and Ar-2p3/2 are clearly separated in energy.
The notation of Auger transitions may also be worth mentioning.Figure 3.15 shows a spectrum of the L2,3M2,3M2,3 transitions in argon. Herethe principle quantum number is represented by capital letters; K, L, M, N,. . . denotes n = 1, 2, 3,. . . . In describing Auger transitions these denote theatomic shells involved in the decay. The first letter, in this case L, gives theshell with the initial core-hole, and the other two, M and M, show whichshells fill the core-hole and release the Auger electron. Since the atomicshells are split into sub-shells which in turn are spin-orbit split, the subscriptnumbers are present. The numbering of the energy levels in the atomic shellstarts with the highest binding energy and the following levels are numberedtaking spin-orbit splitting into account. Hence, the example given abovespecifies that both the p1/2 and p3/2 components are involved both in theinitial and final states of the decay.
78

Bibliography
[1] G. Grillon, P. Balcou, J.-P. Chambaret, D. Hulin, J. Martino, S. Moustaizis, L.Notebaert, M. Pittman, T. Pussieux, A. Rousse, J.-P. Rousseau, S. Sebban, O.Sublemontier, and M. Schmidt, Phys. Rev. Lett. 89, 065005 (2002).
[2] A. C. Dillon, K. M. Jones, T. A. Bekkedahl, C. H. Klang, D. S. Bethune, andM. J. Heben, Nature 386, 377 (1997).
[3] A. Ansòn, E. Lafuente, E. Urriolabeitia, F. Navarro, A. M. Benito, W. K. Maser,and M. T. Martìnez, J. Chem. Phys. B 110, 6643 (2006).
[4] J.-H. Shim, B.-J. Lee, and Y. W. Cho, Surf. Sci. 512, 262 (2002).
[5] C. Kittel, Introduction to Solid State Physics, seventh ed. (Wiley, New York,1996).
[6] M. Schmidt, R. Kushce, B. von Issendorff, and H. Haberland, Nature 393, 238(1998).
[7] J. Jortner, Z. Phys. D 24, 247 (1992).
[8] O. Echt, K. Sattler, and E. Recknagel, Phys. Rev. Lett. 47, 1121 (1981).
[9] Clusters of Atoms and Molecules I & II, Springer Series ChemicalPhysics Vol. 52, edited by H. Haberland (Springer, Berlin, 1994–1995).
[10] R. L. Johnston, Atomic and molecular clusters (Taylor & Francis, London,2002).
[11] H. D. Young and R. A. Freedman, University Physics, ninth ed. (Addison-Wesley Pub., USA, 1996).
[12] J. Harnes, Polarisasjonsenergies ved ionisering av et argonatom på over-flaten av en argonklase (Master Thesis, University of Bergen, Norway,2006).
[13] A. Leach, Molecular Modelling (Pearson Education Limited, Essex, 2001).
[14] K. T. Tang and J. P. Toennies, J. Chem. Phys. 118, 4976 (2003).
[15] J. Farges, M. F. de Feraudy, B. Raoult, and G. Torchet, Surf. Sci. 106, 95(1981).
79
[16] O. F. Hagena, Surf. Sci. 106, 101 (1981).
[17] B. Briel and H. M. Urbassed, J. Vac. Sci. Technol. A 17, 256 (1999).
[18] Atomic and Molecular Beam Methods, edited by G. Scoles (Oxford Uni-versity Press, New York, 1988), Vol. 1.
[19] P. W. Atkins, Physical chemistry, sixth ed. (Oxford university press, NewYork, 1999).
[20] E. W. Becker, K. Bier, and W. Henkes, Z. Phys. 146, 333 (1956).
[21] O. F. Hagena, Z. Phys. D 4, 291 (1987).
[22] U. Buck and R. Krohne, J. Chem. Phys. 105, 5408 (1996).
[23] R. Karnbach, M. Joppien, J. Stapelfeldt, J. Wörmer, and T. Möller, Rev. Sci.Instrum. 64, 2838 (1993).
[24] A. M. Bush, A. J. Bell, J. G. Frey, and J.-M. Mestdagh, J. Phys. Chem. A 102,6457 (1998).
[25] H. Bergersen, M. Abu-samha, J. Harnes, O. Björneholm, S. Svensson, L. J.Sæthre, and K. J. Børve, Phys. Chem. Chem. Phys. 8, 1891 (2006).
[26] C.-R. Wang, R.-B. Huang, Z.-Y. Liu, and L.-S. Zheng, Chem. Phys. Lett. 227,103 (1994).
[27] A. A. Vostrikov and D. Y. Dubov, JETP 98, 197 (2004).
[28] E. Fort, F. Pradère, A. D. Martino, H. Vach, and M. Châtelet, Eur. Phys. J. D 1,79 (1998).
[29] R. von Pietrowski, K. von Haeften, T. Laarmann, T. Möller, L. Museur, andA. V. Kanaev, Eur. Phys. J. D 38, 323 (2006).
[30] T. Laarmann, K. von Haeften, H. Wabnitz, and T. Möller, Surf. Rev. Lett. 9,111 (2002).
[31] T. Laarmann, K. von Haeften, A. Kanaev, H. Wabnitz, and T. Möller, Phys.Rev. B 66, 205407 (2002).
[32] M. Lewerenz, B. Schilling, and J. P. Toennies, J. Chem. Phys. 102, 8191(1995).
[33] A. Kanaev, L. Museur, F. Edery, T. Laarmann, and T. Möller, J. Chem. Phys.117, 9423 (2002).
[34] J. Farges, M. F. de Feraudy, B. Raoult, and G. Torchet, J. Chem. Phys. 78, 5067(1983).
80

[35] J. Farges, M. F. de Feraudy, B. Raoult, and G. Torchet, J. Chem. Phys. 84, 3491(1986).
[36] B. van de Waal, J. Chem. Phys. 98, 4909 (1993).
[37] S. Kakar, O. Björneholm, J. Weigelt, A. R. B. de Castro, L. Tröger, and T.Möller, Phys. Rev. Lett. 78, 1675 (1997).
[38] J. Xie, J. A. Northby, D. L. Freeman, and J. D. Doll, J. Chem. Phys. 91, 612(1989).
[39] J. P. K. Doye and R. Calvo, J. Chem. Phys. 116, 8307 (2002).
[40] R. von Pietrowski, Spektroskopische Untersuchungen an edelgasdotiertenEdelgasclustern, Ph. D. thesis, Universität Hamburg, 1997.
[41] A. S. Clarke, R. Kapral, and G. N. Patey, J. Chem. Phys. 101, 2432 (1994).
[42] K. Siegbahn, C. Nordling, A. Fahlman, R. Nordberg, K. Hamrin, J. Hedman, G.Johansson, T. Bergmark, S.-E. Karlsson, I. Lindgren, and B. Lindberg, ESCAAtomic, Molecular and Solid State Structure Studied by means of Elec-tron Spectroscopy (Almquist and Wiksells, Uppsala, 1967).
[43] H. Hertz, Wied. Ann. 31, 983 (1887).
[44] S. Hüfner, Photoelectron Spectroscopy: Principles and Applications(Springer, Berlin, 2003).
[45] A. Einstein, Ann. Phys. 17, 132 (1905).
[46] A. Lindblad, Photoelectron Spectroscopy of Clusters (Licentiate Thesis,University of Uppsala, Sweden, 2006).
[47] X-Ray Data Booklet, edited by A. C. Thompson and D. Vaughan (Berkeley,USA, 2001).
[48] C. E. Moore, Atomic Energy Levels, Circular of the National Bureau ofStandards 467 (U.S. GPO, Washington DC, 1949).
[49] F. Carnovale, J. B. Peel, and R. G. Rothwell, J. Chem. Phys. 95, 1473 (1991).
[50] J. J. Yeh and I. Lindau, At. Data Nucl. Data Tables 32, 1 (1985).
[51] L. Avaldi, G. Dawber, R. Camilloni, G. C. King, M. Roper, M. R. F. Siggel, G.Stefani, and M. Zitnik, J. Phys. B: At. Mol. Opt. Phys. 27, 3953 (1994).
[52] L. S. Cederbaum, J. Zobeley, and F. Tarantelli, Phys. Rev. Lett. 79, 4778(1997).
[53] R. Santra and L. S. Cederbaum, Phys. Rep. 368, 1 (2002).
81

[54] S. Marburger, O. Kugeler, U. Hergenhahn, and T. Möller, Phys. Rev. Lett. 90,203401 (2003).
[55] T. Jahnke, A. Czasch, M. S. Schöffler, S. Schössler, A. Knapp, M. Kåsz, J.Titze, C. Wimmer, K. Kreidi, R. E. Grisenti, A. Staudte, O. Jagutzki, U. Her-genhahn, H. Schmidt-Böcking, and R. Dörner, Phys. Rev. Lett. 93, 163401(2004).
[56] G. Öhrwall, M. Tchaplyguine, M. Lundwall, R. Feifel, H. Bergersen, T. Ran-der, A. Lindblad, J. Schulz, S. Peredkov, S. Barth, S. Marburger, U. Hergen-hahn, S. Svensson, and O. Björneholm, Phys. Rev. Lett. 93, 173401 (2004).
[57] J. Zobeley, R. Santra, and L. S. Cederbaum, J. Chem. Phys. 115, 5076 (2001).
[58] S. Scheit, V. Averbukh, H.-D. Meyer, J. Zobeley, and L. S. Cederbaum, J.Chem. Phys. 124, 154305 (2006).
[59] S. Barth, S. Marburger, S. Joshi, V. Ulrich, O. Kugeler, and U. Hergenhahn,Phys. Chem. Chem. Phys. 8, 3218 (2006).
[60] P. Lablanquie, F. Penent, R. I. Hall, J. H. D. Eland, P. Bolognesi, D. Cooper,G. C. King, L. Avaldi, R. Camilloni, S. Stranges, M. Coreno, K. C. Prince, A.Müehleisen, and M. Žitnik, Phys. Rev. Lett. 84, 431 (2000).
[61] J. Cooper and R. N. Zare, J. Chem. Phys. 48, 942 (1968).
[62] V. Schmidt, Electron Spectrometry of Atoms using Synchrotron Radiation(Cambridge University Press, UK, 1997).
[63] D. Dill, J. Chem. Phys. 65, 1130 (1976).
[64] G. Öhrwall, M. Tchaplyguine, M. Gisselbrecht, M. Lundwall, R. Feifel, T.Rander, J. Schulz, R. R. T. Marinho, A. Lindgren, S. L. Sorensen, S. Svens-son, and O. Björneholm, J. Phys. B: At. Mol. Opt. Phys. 36, 3937 (2003).
[65] K. Siegbahn, C. Nordling, G. Johansson, J. Hedman, P. F. Hedén, K. Hamrin,U. Gelius, T. Bergmark, L. O. Werme, R. Manne, and Y. Baer, ESCA Appliedto Free Molecules (North-Holland, Amsterdam, 1969).
[66] S. Svensson, B. Eriksson, N. Mårtensson, G. Wedin, and U. Gelius, J. ElectronSpectrosc. Relat. Phenom. 47, 327 (1988).
[67] S. Svensson, A. N. de Brito, M. P. Keane, N. Correia, L. Karlsson, C.-M.Liegener, and H. Ågren, J. Phys. B: At. Mol. Opt. Phys. 25, 135 (1992).
[68] L. Resca, F. Resta, and S. Rodrigues, Phys. Rev. B 18, 702 (1978).
[69] J. Stapelfeldt, J. Wörmer, and T. Möller, Phys. Rev. Lett. 62, 98 (1989).
82

[70] A. A. Pavlychev, E. V. Semenova, A. P. Hitchcock, and E. Rühl, Physica B208&209, 187 (1995).
[71] U. Hergenhahn, A. Kolmakov, M. Riedler, A. R. B. de Castro, O. Löfken, andT. Möller, Chem. Phys. Lett. 351, 235 (2002).
[72] M. Y. Amusia, I. S. Lee, and V. A. Kilin, Phys. Rev. A 45, 4576 (1992).
[73] N. Schwentner, M. Skibowski, and W. Steinmann, Phys. Rev. B 8, 2965 (1973).
[74] N. Schwentner, F.-J. Himpsel, V. Saile, M. Skibowski, and W. Steinmann, Phys.Rev. Lett. 34, 528 (1975).
[75] N. Schwentner, Phys. Rev. B 14, 5490 (1976).
[76] A. Zangwill, Physics At Surfaces (Cambridge University Press, USA, 1988).
[77] M. Tchaplyguine, R. R. T. Marinho, M. Gisselbrecht, J. Schulz, N. Mårtens-son, S. L. Sorensen, A. N. de Brito, R. Feifel, G. Öhrwall, M. Lundwall, S.Svensson, and O. Björneholm, J. Chem. Phys 120, 345 (2004).
[78] A. Jablonski and C. J. Powell, J. Electron Spectrosc. Relat. Phenom. 100, 137(1999).
[79] C. J. Powell, A. Jablonski, I. S. Tilinin, S. Tanuma, and D. R. Penn, J. ElectronSpectrosc. Relat. Phenom. 98/99, 1 (1999).
[80] M. P. Seah and W. A. Dench, Surf. Interface Anal. 1, 2 (1979).
[81] G. B. Armen and J. C. Levin, Phys. Rev. A 56, 3734 (1997).
[82] W. Eberhardt, S. Bernstorff, H. W. Jochims, S. B. Whitfield, and B. Crasemann,Phys. Rev. A 38, 3808 (1988).
[83] J. Tulkki, T. Åberg, S. B. Whitfield, and B. Crasemann, Phys. Rev. A 41, 181(1990).
[84] S. N. Pisharody and R. R. Jones, Phys. Rev. Lett. 91, 203002 (2003).
[85] D. Pettifor, Bonding and structure of molecules and solids (Oxford Uni-versity Press, New York, 2002).
[86] R. Hoffmann, Solids and Surfaces: A chemists view of bonding in ex-tended structures (Wiley-VCH, New York, 1988).
[87] K. Hermann, J. Noffke, and K. Horn, Phys. Rev. B 22, 1022 (1980).
[88] O. Björneholm, F. Federmann, F. Fössing, and T. Möller, Phys. Rev. Lett. 74,3017 (1995).
83

[89] O. Björneholm, F. Federmann, F. Fössing, T. Möller, and P. Stampfli, J. Chem.Phys. 104, 1846 (1996).
[90] G. Kaindl, T.-C. Chiang, D. E. Eastman, and F. J. Himpsel, Phys. Rev. Lett. 45,1808 (1980).
[91] M. Lundwall, M. Tchaplyguine, G. Öhrwall, A. Lindblad, S. Peredkov, T. Ran-der, S. Svensson, and O. Björneholm, Surf. Sci. 594, 12 (2005).
[92] F. G. Amar, J. Smaby, and T. J. Preston, J. Chem. Phys. 122, 244717 (2005).
[93] T. Hatsui, H. Setoyama, N. Kosugi, B. Wassermann, I. L. Bradeanu, and E.Rühl, J. Chem. Phys. 123, 154304 (2005).
[94] W. Demtröder, Laser Spectroscopy (Springer, Berlin, Germany, 1996).
[95] P. van der Straten, R. Morgenstern, and A. Niehaus, Z. Phys. D 8, 35 (1988).
[96] A. Lindblad, R. F. Fink, H. Bergersen, M. Lundwall, T. Rander, R. Feifel, G.Öhrwall, M. Tchaplyguine, U. Hergenhahn, S. Svensson, and O. Björneholm,J. Chem. Phys. 123, 211101 (2005).
[97] G. M. Seidel, R. E. Lanou, and W. Yao, Nucl. Instrum. Methods in Phys. Re-search 489, 189 (2002).
[98] J. F. O’Hanlon, A User’s Guide to Vacuum Technology, 3rd ed. (Wiley, NewYork, 2003).
[99] D. Attwood, Soft x-rays and extreme ultraviolet radiation (Cambridge Uni-versity Press, New York, 1999).
[100] M. Bässler, J.-O. Forsell, O. Björneholm, R. Feifel, M. Jurvansuu, S. Aksela, S.Sundin, S. L. Sorensen, R. Nyholm, A. Ausmees, and S. Svensson, J. ElectronSpectrosc. Relat. Phenom. 101-103, 953 (1999).
[101] M. Bässler, A. Ausmees, M. Jurvansuu, R. Feifel, J.-O. Forsell, P. de Tarso Fon-seca, A. Kivimäki, S. Sundin, S. L. Sorensen, R. Nyholm, O. Björneholm,S. Aksela, and S. Svensson, Nucl. Instrum. Methods Phys. Res. A 469, 382(2001).
[102] N. Mårtensson, P. Baltzer, P. A. Brühwiler, J.-O. Forsell, A. Nilsson, A. Sten-borg, and B. Wannberg, J. Electron Spectrosc. Relat. Phenom. 70, 117 (1994).
[103] H. Haberland, U. Buck, and M. Tolle, Rev. Sci. Instrum. 56, 1712 (1985).
[104] M. Tchaplyguine, R. Feifel, R. R. T. Marinho, M. Gisselbrecht, S. L. Sorensen,A. N. de Brito, N. Mårtensson, S. Svensson, and O. Björneholm, Chem. Phys.289, 3 (2003).
84

[105] A. Kivimäki, S. L. Sorensen, M. Tchaplyguine, M. Gisselbrecht, R. R. T. Mar-inho, R. Feifel, G. Öhrwall, S. Svensson, and O. Björneholm, Phys. Rev. A 71,033204 (2005).
[106] S. Peredkov, A. Kivimäki, S. L. Sorensen, J. Schultz, N. Mårtensson, G.Öhrwall, M. Lundwall, T. Rander, A. Lindblad, H. Bergersen, S. Svensson,O. Björneholm, and M. Tchaplyguine, Phys. Rev. A 72, 021201(R) (2005).
[107] T. Rander, M. Lundwall, A. Lindblad, G. Öhrwall, M. Tchaplyguine, S. Svens-son, and O. Björneholm, To be published.
[108] H. Vach, Phys. Rev. B 59, 13413 (1999).
[109] H. Vach, J. Chem. Phys 111, 3536 (1999).
[110] H. Vach, J. Chem. Phys 113, 1097 (2000).
[111] G. Kaindl, T.-C. Chiang, and D. E. Eastman, Phys. Rev. B 25, 7846 (1982).
[112] R. von Pietrowski, M. Rutzen, K. von Haeften, S. Kakar, and T. Möller, Z.Phys. D 40, 22 (1997).
[113] M. Lengen, M. Joppien, R. von Pietrowski, and T. Möller, Chem. Phys. Lett.229, 362 (1994).
[114] M. Lengen, M. Joppien, R. Müller, J. Wörmer, and T. Möller, Phys. Rev. Lett.68, 2362 (1992).
[115] T. Laarmann, K. von Haeften, H. Wabnitz, and T. Möller, J. Chem. Phys. 118,3043 (2003).
[116] G. Rossi, A. Rapallo, C. Mottet, A. Fortunelli, F. Baletto, and R. Ferrando,Phys. Rev. Lett. 93, 105503 (2004).
[117] D. Cheng, S. Huang, and W. Wang, Phys. Rev. B 74, 064117 (2006).
[118] R. Santra, J. Zobeley, and L. S. Cederbaum, Phys. Rev. B 64, 245104 (2001).
[119] T. Haug-Warberg, Den termodynamiske arbeidsboken (Kolofon, Norway,2006), iSBN: 8230002053.
85

Acta Universitatis UpsaliensisDigital Comprehensive Summaries of Uppsala Dissertationsfrom the Faculty of Science and Technology 260
Editor: The Dean of the Faculty of Science and Technology
A doctoral dissertation from the Faculty of Science andTechnology, Uppsala University, is usually a summary of anumber of papers. A few copies of the complete dissertationare kept at major Swedish research libraries, while thesummary alone is distributed internationally through theseries Digital Comprehensive Summaries of UppsalaDissertations from the Faculty of Science and Technology.(Prior to January, 2005, the series was published under thetitle “Comprehensive Summaries of Uppsala Dissertationsfrom the Faculty of Science and Technology”.)
Distribution: publications.uu.seurn:nbn:se:uu:diva-7431
ACTAUNIVERSITATISUPSALIENSISUPPSALA2007