rare and minor metals company review exploration ... and minor metals company review exploration,...
TRANSCRIPT

Rare and Minor Metals Company ReviewExploration, Development & ProductionMarch Quarter 2011

Resource Capital Research
Resource Capital Research
Suite 1306 183 Kent Street Sydney, NSW 2000
Tel: +612 9252 9405 Fax: +612 9251 2859 Email: [email protected]: www.rcresearch.com.au
Resource Capital Research ACN 111 622 489
Rare and Minor Metals Company ReviewMarch Quarter 2011
Resource Analyst (Rare and Minor Metals): Dr Trent Allen
Resource Analyst: Dr Tony Parry
Resource Analyst: John Wilson
This report is subject to copyright and may not be redistributed without written permission from RCR. Copies are available for purchase from RCR.
16 February 2011

Resource Capital Research
Rare and Minor Metals Company Review, March Q 2011. Disclaimer and disclosure attached. Copyright© 2010 by Resource Capital Research Pty Ltd. All rights reserved. 2
Contents Contents .............................................................................................................................. 2 Overview and Investment Comment ........................................................................................ 3 Featured Company Summary .................................................................................................. 4 [Explorers‟ Development Cycle, March Q 2011 ........................................................................... ] [Comparative Charts ............................................................................................................... ] Financial Data ....................................................................................................................... 5 Company Statistics ................................................................................................................ 5 Reserves, Resources and Historic Mineralisation ........................................................................ 6 Valuation and Performance Data ............................................................................................. 6 Exploration, Development and Production Companies
[Alkane Exploration Limited ........................................................................................... ] Arafura Resources Limited ............................................................................................ 7 Avalon Rare Metals Inc ................................................................................................. 9 [Galaxy Resources Limited ............................................................................................. ] Globe Metals & Mining Limited .................................................................................... 11 Greenland Minerals & Energy Limited ........................................................................... 13 [Hazelwood Resources Limited ....................................................................................... ] [Icon Resources Limited ................................................................................................ ] [King Island Scheelite Limited ........................................................................................ ] Latin Resources Limited ............................................................................................. 15 Lynas Corporation Limited .......................................................................................... 17 [Northern Minerals Limited ............................................................................................ ] Orocobre Limited ....................................................................................................... 19 [Rodinia Lithium Inc ...................................................................................................... ] [TNR Gold Corp ............................................................................................................ ]
Market Update: Lithium ........................................................................................................ 21 Market Update: Niobium ...................................................................................................... 23 Market Update: Tantalum ..................................................................................................... 27 Market Update: Tungsten ..................................................................................................... 29 Market update: Rare Earth Elements ...................................................................................... 25
Selected Rare and Minor Metal Price Data and Production Statistics ........................................... 31 Exchange Rates of some Rare and Minor Metals, Producers and Consumers. ............................... 32 [Rare and Minor Metal Company Share Performance Tables ......................................................... ] Report Contributors ............................................................................................................. 33 Disclosure and Disclaimer ..................................................................................................... 34
[This is the Abridged Report version of the March Quarter RCR Rare and Minor Metals Company Review. The
purchase price of RCR‟s March quarter subscriber reports (including uranium, gold, rare and minor metals, and
iron ore) is A$110. The annual rate for RCR reports – commodities covered may vary from quarter to quarter –
is A$440. Purchase details and research services for institutional investors can be found at
www.rcresearch.com.au]

Resource Capital Research
Rare and Minor Metals Company Review, March Q 2011. Disclaimer and disclosure attached. Copyright© 2011 by Resource Capital Research Pty Ltd. All rights reserved. 3
Overview and Investment Comment
The outlook for rare and minor metals
Analyst: Dr Trent Allen
Rare and minor metals (RMM) equities have made considerable share price
(sp) gains in the past 12 months (sp +118%), in parallel with metal prices,
but speculation has cooled in the past quarter (sp +5%, for a basket of
304 stocks). Companies with good-quality projects have retained most of
their gains from the second half of 2010 and remain close to yearly share-
price highs.
The main commodity and equity market driver is China. This has been the
case for the past several years and is likely to remain so for the
foreseeable future. China is reforming its RMM sectors, by raising tariffs,
reducing export quotas, stockpiling metal to ensure steady supply, and
encouraging consolidation and vertical integration of production. China‟s
stated aims are to increase domestic value-adding and use of the RMM,
conserve resources, and improve industry monitoring and efficiency.
China‟s actions could boost global RMM production.
Some examples of commodities with a stable to strong demand outlook for
the next several years:
Lithium: Increasing intensity of use will require additional supply
beyond 2014, although new mines could lead to oversupply.
Niobium: Industry forecasts are for FeNb consumption growth of ~15%
per annum to 2014.
Rare earth elements (REE): Forecasts are for 6-10% annual growth
in demand to 2015. Export prices (China) up 679% year-on-year.
Tantalum: A supply shortfall is expected to hand a competitive
advantage to companies that provide a long-term supply of ethically
produced tantalum, including Wodinga (WA, to be recommissioned).
Tungsten: Supply shortages are indicated from 2013.
RMM deposits can take 5+ years to develop as mines, sometimes due to
their geochemical complexity, and the challenge of financing projects that
are still considered to be outside the resources mainstream.
This provides an opportunity for companies with projects that are advanced
or can be fast-tracked, e.g. due to location, favourable chemistry, size
and/or high grades).
Equity performances
Globally, RMM stocks have matched or outperformed most exchange-based
indices in the past 12 months. Share price performances have been
studied, for 304 exchange-listed companies with one or more RMM projects
(in six groups: lithium, REE, tungsten, zirconium, niobium, tantalum).
The unweighted average performance over 1 month (to February 16) was
+6%, compared to 5% for Australia‟s ASX S&P300 Metals and Mining
Index, and also 5% for the ASX All Ords. Twelve-month performance was
+118% (S&P300 MM, +25%; All Ords +9%). The average RMM company
share price is 25% below its yearly high and 249% above a 12-month low.
The current market
driver is China‟s
policy of
rationalising supply
and cutting exports.
Strong medium to
long term market
and price growth is
likely for many RMMs
Companies with
strong projects
should continue to
benefit from the
buoyant RMM
markets.
Share prices of rare
and minor metal
companies have
outperformed the
ASX over the past
year, with +118%
annual growth.

Resource Capital Research
Rare and Minor Metals Company Review, March Q 2011. Disclaimer and disclosure attached. Copyright© 2011 by Resource Capital Research Pty Ltd. All rights reserved. 4
RCR March Quarter 2011 Featured Company Summary
AUSTRALIA
Company Code Commodities Comment
Alkane Exploration Limited ALK Definitive Feasibility Study
The Tomingley Project (840koz Au) has advanced to the stage of project financing (A$95m needed).
ALK has raised $21m at $1.05/share to complete a DFS on the Dubbo Zirconia Project (DZP), which
could be producing Zr, Nb and REE (up to 6.5ktpa) by 4Q12.
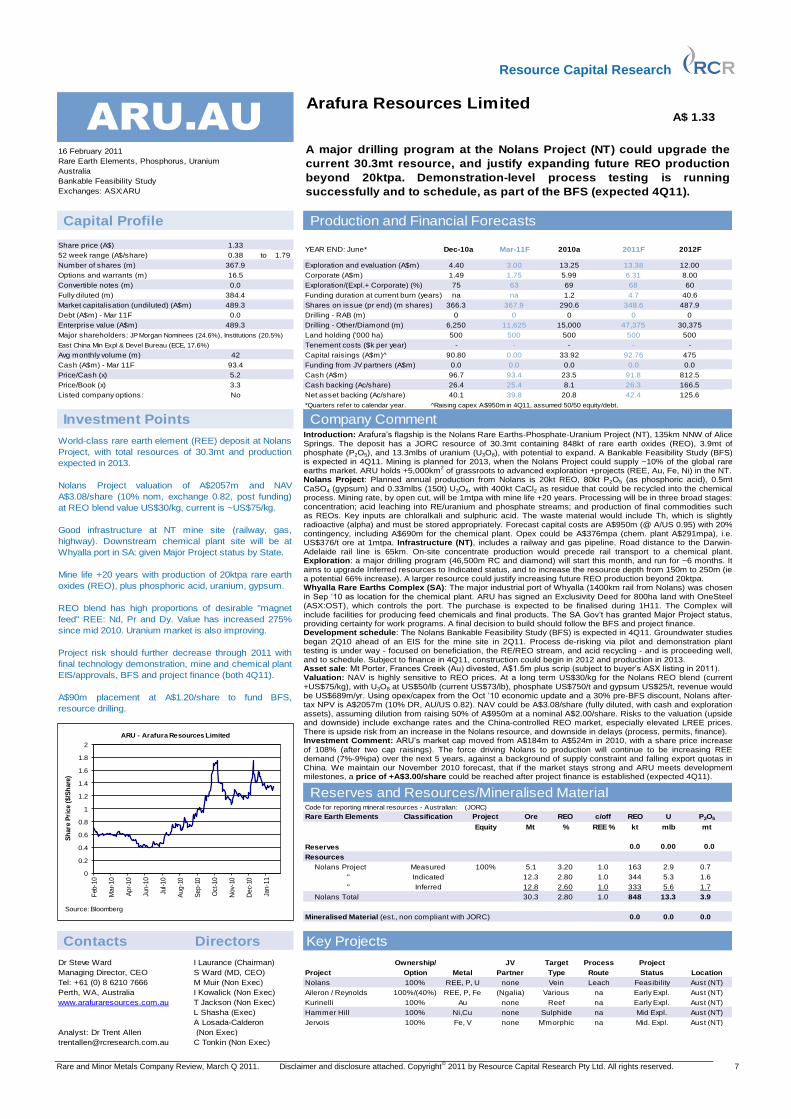
Arafura Resources Limited ARU Bankable Feasibility Study
A major drilling program at the Nolans Project (NT) could upgrade the current 30.3mt resource, and
justify expanding future REO production beyond 20ktpa. Demonstration-level process testing is
running successfully and to schedule, as part of the BFS (expected 4Q11).
Galaxy Resources Limited GXY Production
With Li production started at Mt Cattlin (WA, expected Li2O ~8.2ktpa) GXY can add value through
vertical integration, as a near-term provider of lithium carbonate (Jiangsu, China) and possibly Li ion
batteries. HK listing in 1Q11 could bring additional US$260m funding.
Globe Metals & Mining Limited GBE Bankable Feasibility Study (BFS)
An A$41m investment by China's ECE in the 60Mt Kanyika Niobium Project (Malawi) should go
ahead in 1Q11, paving the way for a completed BFS. Exploration programs at Machinga and Mount
Muambe have found highly encouraging levels of rare earths.
Greenland Minerals & Energy Limited GGG Pre-Feasibility Study
Mineralisation is confirmed 7km from the Kvanefjeld resource, with 185m @ 1.2% TREO, 442ppm
U3O8, 0.34% Zn. GGG has permission to evaluate the deposit's multi-element potential, including
uranium (forecast REE 43.7kt/yr, U3O8 3.9kt/yr). A DFS should start 2H11.
Hazelwood Resources Limited HAZ Project Construction
HAZ has rapidly built up its WO3 assets to supplement the Big Hill project with ATC (Mar '10) and
Mt Mulgine (Sep '10). Meanwhile, FeW prices have been climbing steadily. Further funding will be
required for HAZ to realise its global WO3 player aspirations.
Icon Resources Limited III Scoping Study
Mt Carbine (QLD) could be producing tungsten from historic mine tailings this year, in a 2 year
operation. Encouraging results of ore sorting trials mean the project could expand to retreatment of
low-grade stockpiles (4-6 years), followed by hard rock mining (10+ years).
King Island Scheelite Limited KIS Feasibility
Rising tungsten prices, and regaining 100% control of the King Island Project, have led to a market
re-rating of KIS: share price +113% in three months. Potential for 3.6kt/yr WO3 from a reserve
grading 1.3% WO3, with initial 1kt/yr from reprocessed tailings.
Latin Resources Limited LRS Mid Exploration
The share price of this recent, Peru-focused ASX listing has surged on news of a sevenfold increase
in the scale of its Guadalupito mineral sands project. Drilling of the iron-rich sands, and of magnetite
skarns near Ilo, is planned for coming weeks.
Lynas Corporation Limited LYC Project Construction
LYC has a stong competitive position in rare earths due to its world class resource, integrated mine
to market approach, first mover advantage in offering new supply from a source outside China, and
its pricing and cost advantages.
Northern Minerals Limited NTU Mid Exploration
The re-named NTU (formerly Northern Uranium) now has the rights to explore for multiple
commodities in the Tanami region (WA-NT), widening its focus to include rare earths and gold. With
cash A$7.4m in December 2010, intensive exploration is planned for 2011.
Orocobre Limited ORE Definitive Feasibility Study
The Salar de Olaroz deposit has the characteristics to become the world's next large scale, low cost
lithium-potash brine operation: attractive chemistry, a JORC compliant resource, proximity of
infrastructure and the financial support of Toyota Tsusho.
CANADA
Avalon Rare Metals Inc AVL Bankable Feasibility Study (BFS)
Indicated resources in the Basal Zone of the world class Nechalcho REE Project (Canada) were
recently expanded by 181%. A Bankable Feasibility Study is expected in 2Q12 and the project
could be producing 10ktpa total REO in 2015, along with Nb, Ta and Zr. Share price +177% over 12
months.Rodinia Lithium Inc RM Early to Mid Exploration
Rodinia is anticipating initial resource statements in 1Q11 at two lithium brine projects in the US and
Argentina. The strategy is to explore salars near high grade Li and pre-existing infrastructure. Strong
exploration results have led to share price +70% in 6 months.
TNR Gold Corp TNR Early to Advanced Exploration
TNR's near-term exploration program will focus on lithium brine projects at Mariana (ARG) and
Clayton Valley (Nevada), as well as gold at Shotgun (Alaska). The proposed TSX spin-out of Li and
REE assets as International Lithium Corp (ILC) could proceed in 2011.
Iron ore, mineral
sands (rare earths,
zircon, tungsten,
andalusite)
Lithium, Tantalum,
Manganese, Iron
Tungsten, Gold,
Base Metals, PGE
Tungsten
Tungsten, Copper,
Gold
Rare Earths,
Niobium, Tantalum,
Zirconium
Lithium
Gold, Copper,
Lithium, Rare
Earths
Lithium
Lithium
Gold, Rare Earths,
Zirconium, Base
Metals
Rare Earths,
Phosphorus,
Uranium, Gold
Niobium, Tantalum,
Rare Earths,
Uranium, Fluorine
Rare Earths,
Uranium, Zinc,
Sodium Fluoride
Rare earths

Resource Capital Research
Rare and Minor Metals Company Review, March Q 2011. Disclaimer and disclosure attached. Copyright© 2011 by Resource Capital Research Pty Ltd. All rights reserved. 5
Financial Data
C OM P A N Y Aust Canada USA Europe other
Listed
opt ions Share Price (LC$/share)3
2 Fully
Diluted
M arket
Cap Book
Enterprise
Value
Code Status1
Yr End 52 week Current Shares Opt+W2
C. Notes2
Shares (undiluted) Cash Debt Value (Undiluted)
16 F ebruary 2011 Hi Low (m) (m) (m) (m) (LC$m)3
(LC$m)3
(LC$m)3
(LC$m)3
(LC$m)3
AUSTRALIA (A$)
Alkane Explorat ion Limited Equinox M inAZXls LimitedALK E Dec ASX OTC ARUO 1.25 0.23 1.22 269 0 0 269 328 22.1 0.0 65 328
Arafura Resources Limited ARU E June ASX 1.79 0.38 1.33 335 17 0 352 445 93.4 0.0 146 445
Galaxy Resources Limited GXY P June ASX GXYO 1.82 0.91 1.53 193 52 12 245 294 400.2 168.4 401 463
Globe M etals & M ining Limited GBE E June ASX 0.51 0.12 0.31 106 2 0 108 32 41.4 0.0 57 32
Greenland M inerals & Energy Limited GGG E Dec ASX GGGO 1.37 0.31 1.30 311 114 0 425 404 9.5 0.0 61 404
Hazelwood Resources Limited HAZ I June ASX 0.33 0.17 0.22 230 33 0 263 49 0.3 4.0 21 53
Icon Resources Limited III I June ASX 0.23 0.06 0.15 119 22 0 141 17 0.9 0.0 8 17
King Island Scheelite Limited KIS I June ASX 0.34 0.14 0.32 62 5 0 67 20 1.8 0.0 31 20
Lat in Resources Limited Uranex NLLRS E June ASX LRSO 0.35 0.14 0.35 133 50 0 183 46 1.2 0.0 4 46
Lynas Corporat ion Limited LYC E June ASX ADR 2.35 0.38 1.93 1663 85 0 1748 3201 146.5 0.0 555 3201
Northern M inerals Limited Uranex NLNTU E June ASX 0.69 0.06 0.63 166 38 0 204 105 6.8 0.0 9 105
Orocobre Limited Uranex NLORE E June ASX TSX 4.05 1.50 3.25 96 1 0 97 312 39.8 0.0 70 312
Total : (A$) 763.8 172.4 1428.9 5427
CANADA (C$)
Avalon Rare M etals Inc AVL E Aug TSX OTCQX 8.14 1.89 7.49 92 11 0 103 692 30.9 0.0 75 692
Rodinia Lithium Inc RM E Dec TSX.V OTCQX 0.74 0.25 0.51 87 31 0 118 44 12.3 0.0 25 44
TNR Gold Corp TNR E Dec TSX.V 0.31 0.15 0.17 131 21 0 152 22 3.9 0.0 21 22
Total : (C$) 47.1 0.0 120.4 758
(1) P: Producer; E: Explorer; I: Imminent - includes companies with bankable feasibility studies and likely to be in production within 3 years (2) Fully Diluted (shares, opt ions + warrants (opt. + w), convert ible notes (Conv. N), other obligat ions)
(3) L.C. - Local Currency unit ; 1Q11 forecast(4) AUD/USD:1.01; CAN/USD: 0.99 Colour code: Actuals in black, forecasts in blue. Numbers for FY2010 can be either, depending on when the FY ends and companies' report ing schedules.
Exchanges
Company Statistics
C OM P A N Y
Code Land (A)/(A+B) %
16 F ebruary 2011 ('000 ha) Dec-10 M ar-11 2010 2011 Dec-10 M ar-11 2010 2011 Dec-10 M ar-11 2010 2011 M ar-11 2010 2011
AUSTRALIA (A$)
Alkane Explorat ion Limited ALK 181 3.8 3.8 21.2 15.0 1.5 2.0 7.7 6.5 0.3 0.3 1.4 1.2 88 85 85
Arafura Resources Limited ARU 500 6.3 11.6 15.0 47.4 3.0 3.0 13.2 13.4 2.0 1.8 6.0 6.3 63 69 68
Galaxy Resources Limited GXY 145 5.0 5.0 21.8 20.0 1.0 0.5 7.1 3.0 5.0 5.0 8.9 22.8 9 44 11
Globe M etals & M ining Limited GBE 279 5.0 5.0 20.0 14.7 0.5 0.5 5.4 2.8 0.4 0.4 1.0 1.5 59 84 65
Greenland M inerals & Energy Limited GGG 211 5.0 5.0 8.0 21.0 2.0 2.9 6.5 8.9 1.4 3.8 5.8 7.8 44 53 53
Hazelwood Resources Limited HAZ 254 0.0 0.0 0.0 0.0 0.5 0.9 7.9 2.4 1.0 1.0 2.5 3.8 47 76 39
Icon Resources Limited III 441 1.0 1.0 8.0 4.0 0.2 0.1 2.2 1.3 0.2 0.1 0.3 0.4 50 88 77
King Island Scheelite Limited KIS 0.0 0.0 0.0 0.0 0.0 0.3 0.1 0.7 0.6 0.3 0.3 1.1 0.9 30 38 38
Latin Resources Limited LRS 80 5.0 0.0 0.0 5.0 0.8 0.9 0.0 2.9 0.4 0.3 0.4 1.6 76 0 64
Lynas Corporat ion Limited LYC 2 0.0 2.0 0.0 2.0 1.0 1.0 0.2 2.3 15.0 23.5 22.4 59.6 4 1 4
Northern M inerals Limited NTU 1,802 5.0 0.0 1.5 8.0 1.0 0.6 3.0 3.4 0.4 0.5 1.0 1.8 55 76 66
Orocobre Limited ORE 300 0.0 0.0 0.0 0.0 4.0 5.0 11.9 19.3 0.7 0.7 3.0 3.6 88 80 84
4,194 36.0 33.4 95.5 137.1 15.7 9.9 50.6 38.7 26.9 37.4 53.7 111.2 51 58 55
CANADA (C$)
Avalon Rare M etals Inc AVL 4 7.0 7.0 22.2 29.8 3.0 3.0 13.0 13.4 0.5 0.5 2.0 2.2 86 87 86
Rodinia Lithium Inc RM 31 0.6 0.6 2.3 2.4 0.8 0.8 4.5 3.2 0.5 0.5 1.8 1.8 64 72 64
TNR Gold Corp TNR 34 3.5 0.0 2.3 3.5 0.7 0.7 1.2 2.7 0.3 0.3 2.4 1.3 68 34 68
Total or Average: 69 11 8 26.8 35.7 4 4 18.8 19.2 1 1.3 6.2 5.3 73 64 73
(A) Explorat ion (L.C.$m) (B) Corporate (L.C.$m)Drilling ('000 m)
Prepared by Dr Trent Allen

Resource Capital Research
Rare and Minor Metals Company Review, March Q 2011. Disclaimer and disclosure attached. Copyright© 2011 by Resource Capital Research Pty Ltd. All rights reserved. 6
Reserves, Resources and Historic Mineralisation
C OM P A N Y
Code Status1
Contained Other Contained Other Contained Other
16 F ebruary 2011 Element M t oxide% kt oxide Element M t oxide% kt oxide Element M t oxide% kt oxide
AUSTRALIA
Alkane Explorat ion Limited ALK E REE 0.0 REE 73 0.75 549.0 2.8moz Au 0.0
Arafura Resources Limited ARU E REE 0.0 REE 30 2.80 848.0 3.9mt P2O5 0.0
Galaxy Resources Limited GXY P Li 11 1.05 119.4 1.7kt Ta2O5 Li 16 1.08 171.5 2.5kt Ta2O5 0.0
Globe M etals & M ining Limited GBE E Nb 0.0 Nb 60 0.29 174.0 8.4kt Ta2O5 0.0
Greenland M inerals & Energy Limited GGG E REE 0.0 REE 279 1.07 2982.8 177mlb U3O8 0.0
Hazelwood Resources Limited HAZ I W 25 0.11 28.1 W 47 0.10 48.1 0.0
Icon Resources Limited III I W 0.0 W 115 0.06 70.6 29.8kt Cu W 18 0.05-0.08 12.2
King Island Scheelite Limited KIS E W 2.2 1.17 25.8 W 11 0.89 101.3 0.0
Latin Resources Limited LRS E Heavy mins 0.0 Heavy M ins 0.0 0.0
Lynas Corporat ion Limited LYC P REE 0.0 REE 20 7.615 1523.0 0.0
Northern M inerals Limited NTU E REE 0.0 REE 0.0 0.0
Orocobre Limited ORE E Li 0.0 Li 350mkL 800g/kL 1500kt Li2CO3 equiv 0.0
CANADA (C$)
Avalon Rare M etals Inc AVL E REO 12 1.7 204.2 REE 312 1.37 4274.0 1031kt Nb2O5 0.0
Rodinia Lithium Inc RM E 0.0 Li 0.0 0.0
TNR Gold Corp TNR E 0.0 Li 0.0 0.0 490koz Au
(1) P: Producer; E: Explorer; I: Imminent - includes companies with bankable feasibility studies and likely to be in production within 3 years; IHC: Investment Holding Company
(2) Reserves, resources and mineralised material published by the relevant company.
The applicable mineral resource codes are by country: Australian: JORC, Canadian: NI 43-101.
Focus commodity Focus commodity Focus commodity
Reserves (Equity)2
Resources (Equity)2
Historical/M ineralised M aterial (Equity)2
Valuation and Performance Data
C OM P A N Y EV-Cash EV-Cash Production
Code P/Book P/Net Cash /Reserves /Res'v+resources Commencement
16 F ebruary 2011 (x) (x) US$/kt1
US$/kt Year 1 month 3 month 6 month 12 month Hi Lo
AUSTRALIA
Alkane Explorat ion Limited ALK 5.0 14.9 na 0.56 na 15 72 194 300 2 430
Arafura Resources Limited ARU 3.0 4.8 na 0.42 na -15 16 93 65 26 250
Galaxy Resources Limited GXY 0.7 1.3 0.53 0.37 2010 -12 -1 39 21 16 69
Globe M etals & M ining Limited GBE 0.6 0.8 na -0.05 na -10 -10 69 39 40 165
Greenland M inerals & Energy Limited GGG 6.6 42.7 na 0.13 na 2 98 na 134 5 319
Hazelwood Resources Limited HAZ 2.3 -13.2 1.91 1.12 2011 2 -4 19 16 35 30
Icon Resources Limited III 2.3 19.6 na 0.23 4Q10 -6 7 81 38 36 134
King Island Scheelite Limited KIS 0.6 11.2 0.71 0.18 na 23 113 100 19 6 129
Latin Resources Limited LRS 13.3 37.4 na na na 67 119 na na 0 150
Lynas Corporat ion Limited LYC 5.8 21.9 na 2.03 1Q11 -5 46 112 267 18 413
Northern M inerals Limited NTU 11.1 15.3 na na na 18 81 576 399 9 1025
Orocobre Limited ORE 4.4 7.8 na na na -19 23 70 88 20 117
Total/Total Average 6 46 88 100 18 209
CANADA
Avalon Rare M etals Inc AVL 9.2 22.4 3.23 0.15 na 31 139 201 177 8 296
Rodinia Lithium Inc RM 1.8 3.6 na na na -22 6 70 -15 31 104
TNR Gold Corp TNR 1.0 5.5 na na na -3 -8 -25 -37 47 10
Total/Total Average 2 34 61 31 21 103
(1) EV-Cash / Reserves or / Resources applies to kt of focus commodity
(%)
Share Price Performance Current Share Price
% off 12 month
Prepared by Dr Trent Allen
Resource Capital Research
Rare and Minor Metals Company Review, March Q 2011. Disclaimer and disclosure attached. Copyright© 2011 by Resource Capital Research Pty Ltd. All rights reserved. 7
Arafura Resources Limited
1.79
Debt (A$m) - Mar 11F
Enterprise value (A$m)
Avg monthly volume (m)
Cash (A$m) - Mar 11F
Price/Cash (x) Cash (A$m)
Price/Book (x)
Listed company options: Net asset backing (Ac/share)
*Quarters refer to calendar year. ^Raising capex A$950m in 4Q11, assumed 50/50 equity/debt.
Resources
Mineralised Material (est., non compliant with JORC)
Contacts Directors
Dr Steve Ward
Managing Director, CEO
Tel: +61 (0) 8 6210 7666
Perth, WA, Australia
Analyst: Dr Trent Allen
[email protected] C Tonkin (Non Exec)
166.5
0
Shares on issue (pr end) (m shares)
na
2010a
-
366.3
Drilling - RAB (m)
-
Arafura Resources Limited
40.64.7
0 0
A$ 1.33
Production and Financial Forecasts
0.00
Capital raisings (A$m)^
Equity %
P2O5
163
Classification Project c/off
(JORC)
Measured
REO
30.3
U
Mt
1.0
Key Projects
344
Location
REE %
1.0
2.60
2.80
0.0
Drilling - Other/Diamond (m) 15,00011,625
0.00
Company Comment
125.6
-
367.9
Indicated 12.3 1.0
REO
96.7
0.0
Land holding ('000 ha)
Tenement costs ($k per year) -
Partner
Ore
93.4
Vein
na
M Muir (Non Exec)
S Ward (MD, CEO) Type
www.arafuraresources.com.au
Rare Earth Elements, Phosphorus, Uranium
"
Nolans Total
Reserves and Resources/Mineralised MaterialCode for reporting mineral resources - Australian:
4.40
Dec-10a
500
0.0
90.80
Major shareholders: JP Morgan Nominees (24.6%), Institutions (20.5%)
0.0
Australia
Bankable Feasibility Study
ARU.AU
489.3
to
0.0
367.9Number of shares (m)
Convertible notes (m)
0.38
384.4
3.3
42
Fully diluted (m)
489.3
World-class rare earth element (REE) deposit at Nolans
Project, with total resources of 30.3mt and production
expected in 2013.
Nolans Project valuation of A$2057m and NAV
A$3.08/share (10% nom, exchange 0.82, post funding)
at REO blend value US$30/kg, current is ~US$75/kg.
Good infrastructure at NT mine site (railway, gas,
highway). Downstream chemical plant site will be at
Whyalla port in SA: given Major Project status by State.
Mine life +20 years with production of 20ktpa rare earth
oxides (REO), plus phosphoric acid, uranium, gypsum.
REO blend has high proportions of desirable "magnet
feed" REE: Nd, Pr and Dy. Value has increased 275%
since mid 2010. Uranium market is also improving.
Project risk should further decrease through 2011 with
final technology demonstration, mine and chemical plant
EIS/approvals, BFS and project finance (both 4Q11).
A$90m placement at A$1.20/share to fund BFS,
resource drilling.
Market capitalisation (undiluted) (A$m)
I Laurance (Chairman)
Investment Points
No
East China Min Expl & Devel Bureau (ECE, 17.6%)
na
-
0.0
40.1
Inferred
Exchanges: ASX:ARU
Share price (A$) 1.33
Options and warrants (m)
Capital Profile
A major drilling program at the Nolans Project (NT) could upgrade the
current 30.3mt resource, and justify expanding future REO production
beyond 20ktpa. Demonstration-level process testing is running
successfully and to schedule, as part of the BFS (expected 4Q11).
12.00
52 week range (A$/share)
16.5
16 February 2011
Funding duration at current burn (years)
1.49
6963 60
500
6,250
1.2
500
47,375
290.6
1.75
68
30,375
2012F
487.9
0
2011F
13.38
0
YEAR END: June*
8.006.31
Exploration and evaluation (A$m)
Exploration/(Expl.+ Corporate) (%) 75
Mar-11F
5.99Corporate (A$m)
3.00 13.25
42.439.8
93.4
26.3
20.8
8.1
23.5
348.6
500
0.0
Cash backing (Ac/share) 26.4
I Kowalick (Non Exec)
none
Aileron / Reynolds 100%/(40%)
812.55.2
Funding from JV partners (A$m)
500
33.92
L Shasha (Exec)
T Jackson (Non Exec)
Nolans
Kurinelli
REE, P, Fe
kt
475
0.0
mlb
848 3.9
2.9 0.7
5.6333
5.3
0.0
1.7
Option Metal
92.76
ProjectJV
91.8
25.4
Nolans Project
Project
Leach
none
none
100% REE, P, U
Rare Earth Elements
Reserves
2.80
ProcessOwnership/ Target
"
Mid Expl.
na
100% 1.05.1 3.20
12.8
StatusRoute
Reef
Various
Aust (NT)
Early Expl.na
Feasibility
none
M'morphic
Sulphide
Aust (NT)
Aust (NT)
(Ngalia)
0.0 0.0 0.0
13.3
mt
1.6
Fe, VA Losada-Calderon 100% Aust (NT)Mid. Expl.
(Non Exec)
Hammer Hill 100%
Au100%
Ni,Cu
Jervois
Aust (NT)Early Expl.na
0
0.2
0.4
0.6
0.8
1
1.2
1.4
1.6
1.8
2
Feb
-10
Mar-
10
Apr-
10
Jun-1
0
Jul-10
Aug-1
0
Sep-1
0
Oct-10
Nov-
10
Dec-
10
Jan-1
1
Sh
are
Pri
ce
($/S
hare
)
ARU - Arafura Resources Limited
Source: Bloomberg
Introduction: Arafura‟s flagship is the Nolans Rare Earths-Phosphate-Uranium Project (NT), 135km NNW of Alice Springs. The deposit has a JORC resource of 30.3mt containing 848kt of rare earth oxides (REO), 3.9mt of phosphate (P2O5), and 13.3mlbs of uranium (U3O8), with potential to expand. A Bankable Feasibility Study (BFS) is expected in 4Q11. Mining is planned for 2013, when the Nolans Project could supply ~10% of the global rare earths market. ARU holds +5,000km
2 of grassroots to advanced exploration +projects (REE, Au, Fe, Ni) in the NT.
Nolans Project: Planned annual production from Nolans is 20kt REO, 80kt P2O5 (as phosphoric acid), 0.5mt CaSO4 (gypsum) and 0.33mlbs (150t) U3O8, with 400kt CaCl2 as residue that could be recycled into the chemical process. Mining rate, by open cut, will be 1mtpa with mine life +20 years. Processing will be in three broad stages: concentration; acid leaching into RE/uranium and phosphate streams; and production of final commodities such as REOs. Key inputs are chloralkali and sulphuric acid. The waste material would include Th, which is slightly radioactive (alpha) and must be stored appropriately. Forecast capital costs are A$950m (@ A/US 0.95) with 20% contingency, including A$690m for the chemical plant. Opex could be A$376mpa (chem. plant A$291mpa), i.e. US$376/t ore at 1mtpa. Infrastructure (NT), includes a railway and gas pipeline. Road distance to the Darwin-Adelaide rail line is 65km. On-site concentrate production would precede rail transport to a chemical plant. Exploration: a major drilling program (46,500m RC and diamond) will start this month, and run for ~6 months. It aims to upgrade Inferred resources to Indicated status, and to increase the resource depth from 150m to 250m (ie a potential 66% increase). A larger resource could justify increasing future REO production beyond 20ktpa. Whyalla Rare Earths Complex (SA): The major industrial port of Whyalla (1400km rail from Nolans) was chosen in Sep „10 as location for the chemical plant. ARU has signed an Exclusivity Deed for 800ha land with OneSteel (ASX:OST), which controls the port. The purchase is expected to be finalised during 1H11. The Complex will include facilities for producing feed chemicals and final products. The SA Gov‟t has granted Major Project status, providing certainty for work programs. A final decision to build should follow the BFS and project finance. Development schedule: The Nolans Bankable Feasibility Study (BFS) is expected in 4Q11. Groundwater studies began 2Q10 ahead of an EIS for the mine site in 2Q11. Process de-risking via pilot and demonstration plant testing is under way - focused on beneficiation, the RE/REO stream, and acid recycling - and is proceeding well, and to schedule. Subject to finance in 4Q11, construction could begin in 2012 and production in 2013. Asset sale: Mt Porter, Frances Creek (Au) divested, A$1.5m plus scrip (subject to buyer‟s ASX listing in 2011). Valuation: NAV is highly sensitive to REO prices. At a long term US$30/kg for the Nolans REO blend (current +US$75/kg), with U3O8 at US$50/lb (current US$73/lb), phosphate US$750/t and gypsum US$25/t, revenue would be US$689m/yr. Using opex/capex from the Oct ‟10 economic update and a 30% pre-BFS discount, Nolans after-tax NPV is A$2057m (10% DR, AU/US 0.82). NAV could be A$3.08/share (fully diluted, with cash and exploration assets), assuming dilution from raising 50% of A$950m at a nominal A$2.00/share. Risks to the valuation (upside and downside) include exchange rates and the China-controlled REO market, especially elevated LREE prices. There is upside risk from an increase in the Nolans resource, and downside in delays (process, permits, finance). Investment Comment: ARU‟s market cap moved from A$184m to A$524m in 2010, with a share price increase of 108% (after two cap raisings). The force driving Nolans to production will continue to be increasing REE demand (7%-9%pa) over the next 5 years, against a background of supply constraint and falling export quotas in China. We maintain our November 2010 forecast, that if the market stays strong and ARU meets development milestones, a price of +A$3.00/share could be reached after project finance is established (expected 4Q11).
Resource Capital Research
Rare and Minor Metals Company Review, March Q 2011. Disclaimer and disclosure attached. Copyright© 2011 by Resource Capital Research Pty Ltd. All rights reserved. 8
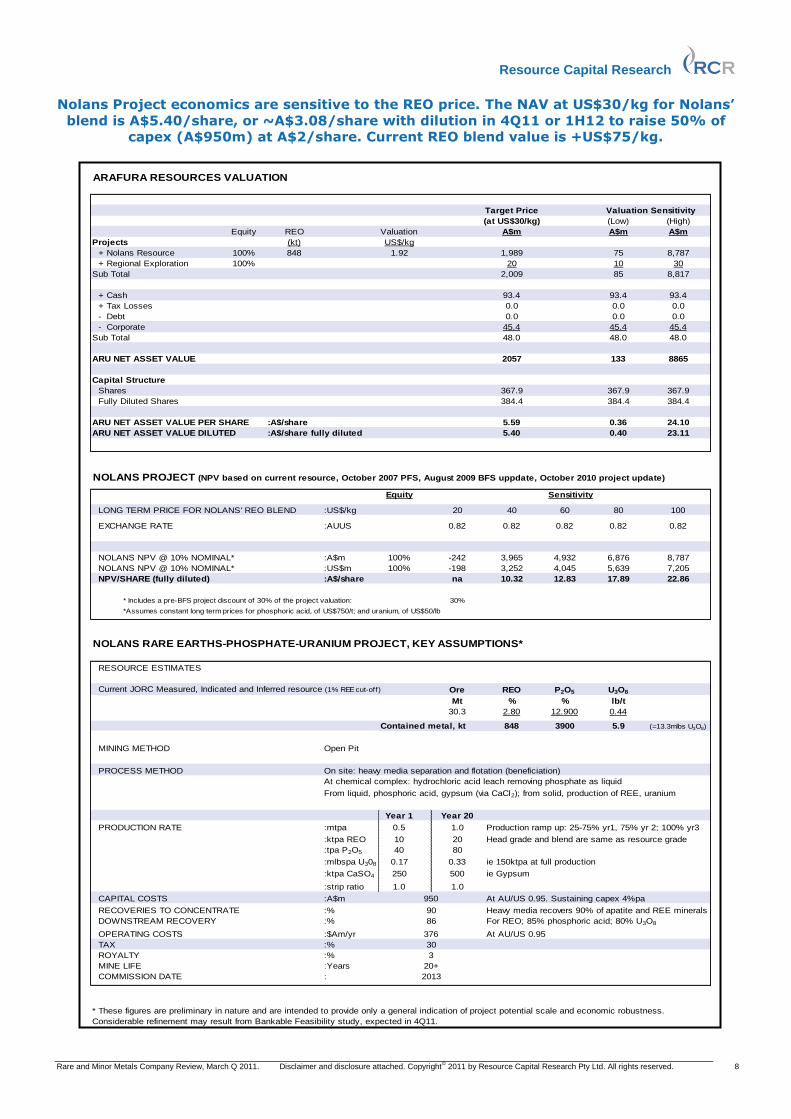
Nolans Project economics are sensitive to the REO price. The NAV at US$30/kg for Nolans‟
blend is A$5.40/share, or ~A$3.08/share with dilution in 4Q11 or 1H12 to raise 50% of
capex (A$950m) at A$2/share. Current REO blend value is +US$75/kg.
ARAFURA RESOURCES VALUATION
Target Price
(at US$30/kg) (Low) (High)
Equity REO Valuation A$m A$m A$m
Projects (kt) US$/kg
+ Nolans Resource 100% 848 1.92 1,989 75 8,787
+ Regional Exploration 100% 20 10 30
Sub Total 2,009 85 8,817
+ Cash 93.4 93.4 93.4
+ Tax Losses 0.0 0.0 0.0
- Debt 0.0 0.0 0.0
- Corporate 45.4 45.4 45.4
Sub Total 48.0 48.0 48.0
ARU NET ASSET VALUE 2057 133 8865
Capital Structure
Shares 367.9 367.9 367.9
Fully Diluted Shares 384.4 384.4 384.4
ARU NET ASSET VALUE PER SHARE :A$/share 5.59 0.36 24.10
ARU NET ASSET VALUE DILUTED :A$/share fully diluted 5.40 0.40 23.11
NOLANS PROJECT (NPV based on current resource, October 2007 PFS, August 2009 BFS uppdate, October 2010 project update)
Equity
LONG TERM PRICE FOR NOLANS' REO BLEND :US$/kg 20 40 60 80 100
EXCHANGE RATE :AUUS 0.82 0.82 0.82 0.82 0.82
NOLANS NPV @ 10% NOMINAL* :A$m 100% -242 3,965 4,932 6,876 8,787
NOLANS NPV @ 10% NOMINAL* :US$m 100% -198 3,252 4,045 5,639 7,205
NPV/SHARE (fully diluted) :A$/share na 10.32 12.83 17.89 22.86
* Includes a pre-BFS project discount of 30% of the project valuation: 30%
*Assumes constant long term prices for phosphoric acid, of US$750/t; and uranium, of US$50/lb
NOLANS RARE EARTHS-PHOSPHATE-URANIUM PROJECT, KEY ASSUMPTIONS*
RESOURCE ESTIMATES
Current JORC Measured, Indicated and Inferred resource (1% REE cut-off) Ore REO P2O5 U3O8
Mt % % lb/t
30.3 2.80 12.900 0.44
Contained metal, kt 848 3900 5.9 (=13.3mlbs U3O8)
MINING METHOD Open Pit
PROCESS METHOD On site: heavy media separation and flotation (beneficiation)
At chemical complex: hydrochloric acid leach removing phosphate as liquid
From liquid, phosphoric acid, gypsum (via CaCl2); from solid, production of REE, uranium
Year 1 Year 20
PRODUCTION RATE :mtpa 0.5 1.0 Production ramp up: 25-75% yr1, 75% yr 2; 100% yr3
:ktpa REO 10 20 Head grade and blend are same as resource grade
:tpa P2O5 40 80
:mlbspa U308 0.17 0.33 ie 150ktpa at full production
:ktpa CaSO4 250 500 ie Gypsum
:strip ratio 1.0 1.0
CAPITAL COSTS :A$m At AU/US 0.95. Sustaining capex 4%pa
RECOVERIES TO CONCENTRATE :% Heavy media recovers 90% of apatite and REE minerals
DOWNSTREAM RECOVERY :% For REO; 85% phosphoric acid; 80% U3O8
OPERATING COSTS :$Am/yr At AU/US 0.95
TAX :%
ROYALTY :%
MINE LIFE :Years
COMMISSION DATE :
950
90
86
* These figures are preliminary in nature and are intended to provide only a general indication of project potential scale and economic robustness.
Considerable refinement may result from Bankable Feasibility study, expected in 4Q11.
Valuation Sensitivity
Sensitivity
376
30
3
20+
2013

Resource Capital Research
Rare and Minor Metals Company Review, March Q 2011. Disclaimer and disclosure attached. Copyright© 2011 by Resource Capital Research Pty Ltd. All rights reserved. 9
Avalon Rare Metals Inc
8.14
Debt (C$m) - Feb 11F
Enterprise value (C$m)
Avg monthly volume (m)
Cash (C$m) -Feb 11F
Price/Cash (x) Cash (C$m)
Price/Book (x)
Listed company warrants: Net asset backing (Cc/share)
Quarters refer to calendar year.
Contacts Directors
Mr Donald Bubar
President, Director, CEO
Tel: +1 (416) 364 4938
Toronto, ON, Canada
Analyst: Dr Trent Allen
Capital raisings (C$m)
-
16.2
0.0 0.0
* Cut offs defined on basis of Net Metal Return (NMR) in PFS financial modelling. ^Indicated total has 0.26% HREO, 2.7% ZrO2
to
D Bubar (Pres, CEO)
D Connelly
9.2
7.49
1.89
A Ferry (Non Exec Chair)
LocationType
Investment Points
Land holding ('000 ha)*
Funding from JV partners (C$m)
AVL.WT
c/off
feldspar
-
0.0
MFC Global Investment Management US, LLC (15.6%)
Igneous
Partner
1.11.8
Drilling - Other/Diamond (m) 22,2177,000
92.4
0
28,000
92.4
Drilling - RAB (m)
C$ 7.49
Production and Financial Forecasts
2012F2010a 2011F
Avalon Rare Metals Inc
Shares on issue (pr end) (m shares) 92.4 92.4 79.1
0 00
4.35 3.00
Corporate (C$m)
Nov-10a Feb-11F
86
Exploration and evaluation (C$m)
Exploration/(Expl.+ Corporate) (%)
AVL.CN
692.1
0.0
92.4Number of shares (m)
10.6Options and warrants (m)
Capital Profile
52 week range (C$/share)
Exchanges: TSX:AVL, NYSE-Amex:AVL
50
Fully diluted (m)
692.1
Nechalacho Project: REE resource in advanced stages
of development (Canada, NWT), includes 1.35mt of
Total REE Oxides (TREO) as Indicated, grading 1.53%.
Rare earths in Basal Zone of the deposit are 20.7%
heavy rare earths, implying a high value ore: recent
181% upgrade in Basal Indicated Resource (Jan '11).
Thor Lake Pre-Feasibility Study (June 2010): capex
C$900m, opex C$267/t (mined) for 10ktpa TREO, LOM
18yrs, pre-tax NPV (10%) of C$246m (C$2.78/share).
A viable metallurgical process has been defined for
REE, with valuable by-products (zirconium, niobium,
gallium). Low thorium, no significant contaminants.
Well-funded to finish BFS in 1H12, with Jan '11 cash
C$37m (and no debt) after C$30m share placement and
C$9.6m exercise of warrants.
Three-month share price +139% in tight REE market
marked by Chinese export cuts and stockpiling.
Market capitalisation (undiluted) (C$m)
Major shareholders:
0.0
Canada
Bankable Feasibility Study (BFS)
Share price (C$)
13.00
Indicated resources in the Basal Zone of the world class Nechalacho REE
Project (Canada) were recently expanded by 181%. A Bankable Feasibility
Study is expected in 2Q12 and the project could be producing 10ktpa total
REO in 2015, along with Nb, Ta and Zr. Share price +177% over 12 months.
0.5
12.0013.35
YEAR END: August
16 February 2011
Funding duration at current burn (years)
0.72
Convertible notes (m)
103.0
Rare Metals
2.002.220.50
86
2.02
8786 86
0
4
8,757
4
16.8337.81 0.00
44
Tenement costs ($k per year)
8.8
14.9
30.1
4
29,757
- - -
0.00
20.4
Cash backing (Cc/share) 42.4
39.2
0.0
34.0
0.034.0
82.5
Company Comment
81.081.2 49.8 80.1
Ta
Separation Rapids Igneous
Process
P Fontaine
H Panday Canada (ON)Exploration
Permitting
na
na
none
P McCarter
BD MacEachenwww.avalonraremetals.com
100%
100%
100%
none
none
REE,Nb,Ta100%
100%
Sn,In,Ga
Li
none
none
Option Metal
37.81
Project
27.8
36.7
6.9
JV
Lilypad Lakes Igneous
IgneousWarren Township
Ownership/ Target
Project
East Kemptville
Nechalacho
Canada (ON)
na
Route
Financing
Scoping
na
PFS Canada (NWT)Float, hydromet
Status
Canada (ON)
Canada (NS)
Key Projects
Igneous
TREO
Equity Mt %
Reserves - Nechalacho
Reserves and Resources/Mineralised MaterialCode for reporting mineral resources - Canadian: NI 43-101
Rare Metals Classification Project Ore Nb2O5 Ta2O5TREO
kt
260 204.2
% ppmC$/t NMR*
57.5 1.56 260
0.41 410100% 12.0 1.70
Resources - Nechalacho
897 0.40 396Basal Zone Indicated 100%
Upper Zone Indicated 100% 30.6 1.48 260 453 0.31 192
Basal Zone Inferred 100% 107.6 1.35 260 1,453 0.37 354
Upper Zone Inferred 100% 116.0 1.27 260 1,473 0.34 196
1,348 0.37Total Indicated^ 88.1 3251.53
Mineralised Material (est., non compliant with JORC) 0.0 0.0 0.0
1.00
2.00
3.00
4.00
5.00
6.00
7.00
8.00
9.00
Feb
-10
Mar-
10
Apr-
10
May-
10
Jul-10
Aug-1
0
Sep-1
0
Oct-10
Nov-
10
Dec-
10
Jan-1
1
Share
Price (
$/S
hare
)
AVL - Avalon Rare Metals Inc
Source: Bloomberg
Introduction: AVL owns five rare metals and minerals projects in Canada, of which four are at advanced stages of development. Its main asset is the 100% owned Nechalacho Rare Earth Element Deposit. Nechalacho (REE, Nb, Ta, Zr): The project is at Thor Lake, 100km SE of Yellowknife. The deposit, an igneous intrusion, is enriched in valuable HREE (heavy rare earth elements). Since 2005, Avalon has spent +C$25m on exploration and development, and there have been regular resource upgrades and expansions. It is focusing on high-grade, HREE-rich resources in the large Basal Zone, which (as of January 2011) contains Indicated Resources of 57.5mt @ 1.56% TREO (total rare earth oxides) with 20.7% HREO/TREO, at a $260 Net Metallurgical Return (NMR) cut-off. At a higher $600 cut-off, Basal Zone Indicated is 14.7mt @ 2.2% TREO. Total Inferred Resources are 226.9mt @ 1.3% TREO (Upper and Basal zones). The deposit also contains Ta, Nb, Zr, Hf and Ga. Less than 10% of the property has been drilled. Recent discoveries include a near-surface zone (North Tardiff) with 11m @ 10.78% TREO. The main deposit is open in three directions. Winter drilling (29,000m program) commenced Jan ‟11. Pre-Feasibility Study: This June 2010 study was of an 18-year mine life, operating underground (~200m depth) on a 12mt reserve in the deposit‟s Basal Zone, ramping from 5ktpa up to 10ktpa TREO (total rare earth oxides), 18ktpa ZrO2, 1.7ktpa Nb2O5 and 100t Ta2O5. Opex is expected to be C$267/t. Capex is C$900m with 22% contingency, including C$589.3m for an underground mine, onsite mill (crush, flotation; 8.4MW by diesel at 2,000tpd) and offsite hydrometallurgical separation plant. The PFS contemplates a plant in the tailings area of an historic mine (Pine Point), to reduce environmental impacts and allow hydroelectric power during summer (7.3MW). In this scenario, concentrate will be barged in summer from Thor Lake via Great Slave Lake to the plant. Combined recoveries are 84.6% for flotation, 90% for the hydro plant. A Scoping Study of plant costs (Oct ‟10) estimates capex at C$345m. The PFS estimates pre-tax NCF of C$2.1bn ($1.5bn post tax). REEs contribute ~56% of revenue at US$21.94/kg TREO. Development: Possible start date for full capacity production is 2015, with 24-30 months construction from 2013 upon receipt of land and water permits and financing. Pilot and bench-scale testing of flotation and hydrometallurgical processes is ongoing – a 30 tonne sample could be tested in 2H11. The PFS could be updated in mid 2011 and a Bankable Feasibility Study is expected in 1H12, ahead of project financing. Permitting: Avalon commenced application for Type A Land Use Permit and Water Licence, in 2Q10 – an Environmental Assessment can take ~1.5-2.5 years to complete, prior to official approval. AVL has recently signed Negotiation Agreements with two local First Nations, a possible precursor to Accommodation Agreements. Other Projects: There are three other advanced projects in Canada, i.e. East Kemptville (tin-indium-gallium-germanium; Nova Scotia), Separation Rapids (lithium, Ontario) and Warren Township (calcium feldspar; Ontario; currently inactive pending resolution of permitting issue). A fifth project, Lilypad Lakes (tantalum; Ontario) is early stage. These projects could move forward under Joint Venture or be monetised while AVL develops Nechalacho. Investment Comment: Nechalacho has world class resources of REE and niobium. Avalon estimates the pre-tax NPV10 of Nechalacho is C$812m with IRR 28%, including potential optimisations. AVL‟s market capitalisation is ~C$690m. In line with other REE equities, the share price increased dramatically after July 2010 due to dramatic cuts in Chinese rare earth exports, pulled back due to profit taking and stabilisation of the market, and regained ground on news of further quota cuts for 1H11. AVL remains highly leveraged to REE prices.

Resource Capital Research
Rare and Minor Metals Company Review, March Q 2011. Disclaimer and disclosure attached. Copyright© 2011 by Resource Capital Research Pty Ltd. All rights reserved. 10
Avalon Rare Metals Inc project location map: from a recent company presentation, this
graphic shows the main focus is on Thor Lake, where AVL has the Nechalacho and North T
Deposits. Total Indicated Resources include 1.4mt of Rare Earth Oxides (REO).
Thor Lake, schedule to production: Avalon plans to have the Nechalacho REE Deposit in
production in late 2015. The project is expected to progress along four lines: community
engagement, permitting, marketing and Bankable Feasibility Study (BFS).

Resource Capital Research
Rare and Minor Metals Company Review, March Q 2011. Disclaimer and disclosure attached. Copyright© 2011 by Resource Capital Research Pty Ltd. All rights reserved. 11
Globe Metals & Mining Limited
0.51
Debt (A$m) - Mar 11F
Enterprise value (A$m)
Avg monthly volume (m)
Cash (A$m) - Mar 11F
Price/Cash (x) Cash (A$m)
Price/Book (x)
Listed company options Net asset backing (Ac/share)
Quarters refer to calendar year.
Resources
Mineralised Material (est., non compliant with JORC)
*5Mt measured, 18Mt Indicated, 37Mt Inferred
Contacts Directors
Mr Mark Sumich
Managing Director
Tel: +61 (0) 8 9486 1779
West Perth, WA, Australia
MW100%/20% U ASX:RSL S'stone na Adv Expl
0.0 0.0 0.0
174.00.29 0.15 0.014 0.009Kanyika Meas, Ind, Inf* 100% 60.0
% %
Reserves 0.0 0.0
Equity Mt
c/off
% Nb2O5%
Nb, Ta, U Classification Project Ore Nb2O5
0.00.0 0.00
Ta2O5 U3O8 Nb2O5
kt
0.0
Key Projects
0.00
Status
Target ProcessOwnership/
BFS MW
Mid Expl
MW
Analyst: Dr Trent Allen
0.0
16.0
(JORC)
1.5
1.5
Company Comment
36.1
97.5
10.1
Option Metal
42.48
Project
0.0
Early Expl
na
93.75
5.9
1.401.52
MW
MZ
Early Expl
F, REE Carb'tite
Salambidwe
Mount Muambe
J Stephens (Non Exec)
W Hayden (Non Exec)
Livingstonia
Reserves and Resources/Mineralised Material
5.29
2.5
1.48 41.00
26.1
0.0
Type
ASX:RSL
none
Partner
JV
Project
Machinga
Kanyika 100%
158.7
3,000
279
No
41.4
17.3
2.30.7
Cash backing (Ac/share) 18.9
0.35
65
1.03
8459
16 February 2011
0.12
Rare Metals, Uranium, Fluorine
Exchanges: ASX:GBE
Share price (A$)
0.53
65
Exploration and evaluation (A$m)*
Exploration/(Expl.+ Corporate) (%)Performance shares (m)
108 1.0
5.36
0.31
An A$41m investment by China's ECE in the 60Mt Kanyika Niobium
Project (Malawi) should go ahead in 1Q11, paving the way for a
completed BFS. Exploration programs at Machinga and Mount
Muambe have found highly encouraging levels of rare earths.
0.4
2.002.76
59
Dec-10a 2011F
Funding duration at current burn (years)
9
Fully diluted (m)
30.8
Valuation gap: Globe NAV (10% nom, 1Q11) based on
scoping/feasibility study is A$0.61/share post ECE
investment, DFS and development funding.
Kanyika Project BFS results due 2011. Expected
production is 4ktpa Nb as FeNb, opex US$13/kg-
US$20/kg Nb, capex US$155m.
Key economic driver is niobium, used in steel. Nb price is
extremely stable, LT forecast US$39/kg in FeNb, current
US$53.8/kg (CN). Nb 70-85% revenue; tantalum 15-30%.
Planned 51% investment by China's ECE may bring initial
A$41m,subject to shareholder approvals (expected Mar
'11), and could lead to project funding.
MOU's for offtake covering 45% of forecast production.
Portfolio of exploration projects in Africa. Strong HREE
drilling results from Machinga Project (REE,Nb,Ta) in Jan
'11; results from Mt Muambe (REE, F) expected Feb '11.
Kanyika resource of 60mt has 174kt Nb2O5 grading
Market capitalisation (undiluted) (A$m)
Major shareholders: HSBC Custody Nom (7.6%)
0.0
Malawi, Mozambique
Bankable Feasibility Study (BFS)
GBE.AU
30.8
to
5
101Number of shares (m)
2.2Options and warrants (m)
Capital Profile
52 week range (A$/share)
Shares on issue (pr end) (m shares)
YEAR END: June
0.97 0.50
Corporate (A$m)
A$ 0.31
Production and Financial Forecasts
2012FMar-11F 2010a
Globe Metals & Mining Limited
Drilling - Other/Diamond (m)
92.9
00
20,000
219.8
5,000
101.0
Drilling - RAB (m) 0
28.73.7
279
48.8
313.6
0
20,00014,688
0
279
Ragusa Investments (6.7%), JP Morgan Nom (6.3%)
M Sumich (Exec Chair, MD)
Investment Points
0.5
Code for reporting mineral resources - Australian:
Land holding ('000 ha)* 279
-
279
Tenement costs ($k per year) -
41.4
Acid leachU (Nb,Ta)
REE0%/80%
none
ASX:RSL100%
0%/90%
Location
na
Granitoid
Pegmatite
na
Route
Pegmatite
REEwww.globemetalsandmining.com.au
D Sumich (Non Exec)
-
31.1
47.2
- -
16.7
Capital raisings (A$m)
Funding from JV partners (A$m) 0.0
0
0.05
0.1
0.15
0.2
0.25
0.3
0.35
0.4
0.45
0.5
Feb
-10
Mar-
10
Apr-
10
Jun-1
0
Jul-10
Aug-1
0
Sep-1
0
Oct-10
Nov-
10
Jan-1
1
Feb
-11
Sh
are
Pri
ce
($/S
hare
)
GBE - Globe Metals & Mining Limited
Source: Bloomberg
Introduction: Globe Metals & Mining listed on the ASX in December 2005. It is an African-focused rare metals resource company. Its main project is the multi-commodity Kanyika Niobium Project. Globe also has exploration projects focused on rare metals, fluorite and uranium projects. Investment by ECE: An A$41m buy-in at A$0.345/share should see the East China Mineral Exploration and Development Bureau own 51% of GBE. ECE plans to help GBE with project finance and development. Government approvals have been received; the deal should be finalised at an EGM in Mar ‟11. In the interim, A$1.35m working capital was raised at A$0.25 in Dec ‟10. Kanyika (uranium, central Malawi): GBE is targeting rare metals (niobium, tantalum), zirconium and uranium mineralisation in an alkalic granitoid in central Malawi. The main ore minerals are disseminated pyrochlore (Nb, Ta, U) and zircon (Zr). GBE aims to bring Kanyika into production in late 2012, or 2013. Resource and grade – The current resource is 60mt, with a recent 77% increase in Measured and Indicated tonnes (now 23Mt). The resource is defined to 300m width, 250m depth and 2.3km of ~3.8km known strike within 5 zones: 60mt @ 0.29% Nb2O5 (174kt), 0.009% U3O8 (11.9mlbs), 0.014% Ta2O5 (18.5mlbs) and 0.5% ZrSiO4. There is a high-grade resource at 3,000ppm Nb2O5 cut-off, of 21mt with 0.41% Nb2O5 of which 10mt is M&I grading 0.47% Nb2O5 The deposit is open along strike in both directions (N-S). There is a high-grade Exploration Target of 40-50Mt @ 0.37-0.4% Nb2O5. Metallurgy – GBE aims to produce ferro-niobium (FeNb) for the steel industry, as well as oxides of niobium, tantalum and uranium, and possibly magnetite (iron oxide) and zircon. Two initial study phases reported encouraging costs and recoveries. Results for Stage 3 (bulk testing pilot program) are expected. Mining Potential - The deposit could be mined open-pit with low strip ratio of 0.5-0.9. Higher-grade, near surface Measured and Indicated resources could be targeted first (critical for early payback of capex). A Scoping Study (Coffey, Jun ‟08) and subsequent updates propose mining 1.5mt-2.5mtpa, for 3,000tpa Nb as FeNb alloy and 192tpa Ta2O5 over 20 year life-of-mine, with 11.4-13.7ktpa ZrSiO4, and uranium reporting to aluminous slag for potential future processing. Opex expected to be US$40.3/t. Capex is US$155m; a planned US$351m investment by the USA in Malawi‟s power sector could lead to grid supply for Kanyika and reduce capital costs. A Development Agreement between Globe and Malawi, similar to that over the Kayelekera Uranium Mine (ASX:PDN), is expected in 3Q11 and could lead to a Mining Licence. An EIA and Bankable Feasibility Study (BFS) are in progress. Other Projects: GBE has promising exploration projects in Malawi and Mozambique. The main focus is Machinga (manager ASX:RSL), for pegmatite-hosted REE-Nb-Ta-Zr. Drilling found heavy REE, with 11m @ 1.0% TREO (total REO) and 330ppm dysprosium oxide (a high-value element), with av. 32% HREO. Drilling results from the Mount Muambe Project (REE-Fluorite) are expected Feb ‟11. Surface samples show high REE values (peak >1.2% TREO) with av. 29% HREO/TREO. Further is planned for 2011. Investment Comment: GBE‟s share price has benefitted from exploration success and the 2H10 jump in REE prices. Company NAV is A$328m, or A$1.84/share based on funding 50% of capex at A$1.00/share. The sale of 51% to ECE for A$41m at A$0.375/share moves this NAV to A$0.61/share, above the 4Q07 high of +A$0.60/share and a reasonable target, subject to ECE‟s investment and a successful BFS.

Resource Capital Research
Rare and Minor Metals Company Review, March Q 2011. Disclaimer and disclosure attached. Copyright© 2011 by Resource Capital Research Pty Ltd. All rights reserved. 12
Kanyika Project valuation: economics are sensitive to the niobium price, with RCR long
term Nb at US$39/kg in ferroniobium (current is ~US$54/kg). Our share price target for
GBE is A$0.61/share, post financing 50% of capex at A$0.50/share and the sale to ECE.
GLOBE METALS AND MINING VALUATION
Target
Price (Low) (High)
Equity Niobium Valuation A$m A$m A$m
Projects (kt) US$/kg
+ Kanyika Resource 100% 174 1.10 234 23 730
+ Kanyika exploration 100% 160 0.20 39 5 98
+ Regional exploration 100% 15 10 25
Sub Total 288 38 853
+ Cash 41.4 41.4 41.4
+ Tax Losses 0.0 0.0 0.0
- Debt 0.0 0.0 0.0
- Corporate 1.7 1.7 1.7
Sub Total 39.7 39.7 39.7
GBE NET ASSET VALUE 328 78 892
Capital Structure
Shares 101 101 101
Fully Diluted Shares 103 103 103
GBE NET ASSET VALUE PER SHARE :A$/share 3.24 0.77 8.83
GBE NET ASSET VALUE DILUTED :A$/share fully diluted 3.18 0.76 8.65
With dilution at A$1/share to raise 50% of US$150m :A$/share fully diluted 1.84
With dilution at A$0.50/share to raise 50% of US$150m :A$/share fully diluted 1.29
With dilution at A$1/share, after sale of 51% for A$41m cash :A$/share fully diluted 0.61
KANYIKA SPECIALTY METALS PROJECT (NPV based on June 2010 resource, June 2008 Scoping Study and May 2009 update)
Equity
LONG TERM NIOBIUM PRICE (per kg in FeNb alloy)^ :US$/kg 25 35 45 55 65
EXCHANGE RATE :AUUS 0.82 0.82 0.82 0.82 0.82
KANYIKA NPV @ 10% NOMINAL* :A$m 100% -31 159 348 538 727
KANYIKA NPV @ 10% NOMINAL* :US$m 100% -25 130 286 441 596
NPV/SHARE :A$/share -0.30 1.57 3.45 5.32 7.20
* Includes a pre-BFS discount of 30% of the project valuation: 30%
^Niobium prices are modelled as f lat line from start of production. Long term FeNb is US$39/kg (Nb), Ta2O5 US$65/lb, U3O8 US$55/lb
GBE's equity assumed to be 100%; however, Govt of Malawi could hold 15% in return for fiscal trade-offs such as tax and royalty reductions
KANYIKA SPECIALTY METALS PROJECT KEY ASSUMPTIONS*
RESOURCE ESTIMATES
Current JORC Indicated and Inferred resource (1,500ppm Nb2O5 cut-off) Ore Nb2O5 Ta2O5 ZrSiO4 U3O8
Mt % % % %
Model does not include zircon production 60 0.29 0.014 0.50 0.009
Contained metal, mlbs 383.6 18.5 661.4 11.9
Contained metal, kt 174.0 8.4 300.0 5.4
MINING METHOD Open Pit
PROCESS METHOD Dedicated Specialty Metals Plant
Concentrate: crush, gravity (incl. seperation of zircon and magnetite), flotation.
Downstream: weak then strong acid leaches, calcining (Nb, Ta, U), smelting with Fe (FeNb).
Year 1 Year 10
PRODUCTION RATE :mtpa 1.72 2.3 Head grade falls from 0.38% Nb2O5 to 0.29% Nb2O5
:tpa Nb 3,000 3,000
:strip ratio 0.6 1.9
CAPITAL COSTS :US$ 155m Excludes working capital; sustaining capex $4mpa.
RECOVERIES TO CONCENTRATE :% 65 All products (Nb, Ta, U)
DOWNSTREAM RECOVERY :% 69
OPERATING COSTS :US$/t 40 to 43 (Includes US$2.80/t mined, US$26 to 34/t milled)
TAX :% 30 Company tax in Malawi
ROYALTY :% 3 ASX:PDN at Kayelekera pays 1.5% for first 3 yrs, then 3%
MINE LIFE :Years 10+
COMMISSION DATE : 3Q13
Valuation Sensitivity
Sensitivity
* These figures are preliminary in nature and are intended to provide only a general indication of project potential scale and economic robustness.
Considerable refinement may result from bankable feasibility study, expected in 2011.

Resource Capital Research
Rare and Minor Metals Company Review, March Q 2011. Disclaimer and disclosure attached. Copyright© 2011 by Resource Capital Research Pty Ltd. All rights reserved. 13
Greenland Minerals & Energy Limited
1.37
Debt (A$m) - Mar 11F
Enterprise value (A$m)
Avg monthly volume (m)
Cash (A$m) - Mar 11F
Price/Cash (x) Cash (A$m)
Price/Book (x)
Listed company options: Net asset backing (Ac/share)
Mineralised Material (est., non compliant w ith JORC)
Contacts Directors
Mr Roderick McIllree M Hutchinson (Chair)
Managing Director
Tel: 61 (0) 8 9382 2322 S Cato (Exec Dir)
Subiaco, WA, Australia J Whybrow (Expl Dir)
Analyst: Dr Trent Allen
0.0
Kt Kt
A$ 1.30
Mlb
TREO Eqty
* Year has ended but some actuals not yet published.
2011F
20,000
Equity
0.0
-
TREO
4,890
0.53 6.45
Fully diluted (m)
114.2
Number of shares (m) 310.9 Exploration and evaluation (A$m)
Options and warrants (m)
Exploration/(Expl.+ Corporate) (%)
Corporate (A$m)
45
1.58
425.1
288.7
Drilling - Other/Diamond (m)
Drilling - RAB (m)
Shares on issue (pr end) (m shares)
0.0
7.5
8.91
1
53
7.82
1.7
6
53
3.0
2
20.8 26.5
-
29.1
3.4
7.6
-
20.4
Market capitalisation (undiluted) (A$m)
Major shareholders: Citicorp Nom (16.7%), National Nom (16.7%),
402.7
402.7
5,000
0
Capital raisings (A$m)
Tenement costs ($k per year)
44
424.7
0
310.2 226.8
211
0
211
GGG.AU
Rare Earth Elements, Uranium, Zinc, Sodium Fluoride
Greenland
Pre-Feasibility Study
Production and Financial Forecasts Capital Profile
Mineralisation is confirmed 7km from the Kvanefjeld resource, with
185m @ 1.2% TREO, 442ppm U3O8, 0.34% Zn. GGG has permission
to evaluate the deposit's multi-element potential, including uranium
(forecast REE 43.7kt/yr, U3O8 3.9kt/yr). A DFS should start 2H11.
JP Morgan Nom (15.9%), HSBC Nom (7.6%), Westrip Hold. (5.9%)
16 February 2011
Exchanges: ASX:GGG
0.31 to
Share price (A$) 1.30
Convertible notes (m) 0.0
52 week range (A$/share)
20,000
0
Greenland Minerals and Energy Ltd
3.77
Funding duration at current burn (years)
-
14.7
Dec-10a 2010F*Mar-11FYear End: December
Land holding ('000 ha)
33.1
13,000
25
211 211
2012F
21.0
4.9
19.4
5.40
4.00
47
Company Comment
Funding from JV partners (A$m)
TREO
0
6.8
11.6 9.5
19.6
Project TREO
2.91
-
211
2
424.7
2.2
1.6
5,000
0
4.4 0.0
(JORC)
Reserves and Resources/Mineralised Material
Cash backing (Ac/share) 4.0
Classification
0
Cut OffOre
Process
U, REO
0.0
10,7801.07
IgneousWestrip
ppm
U3O8
%
Resources
Kvanefjeld*
Mt
61%
0.0
Kvanefjeld Advanced Expl
Metal Type
Greenland
Ownership/
Option StatusPartnerProject
Multi-element focus at Kvanefjeld - uranium component
valued in-ground (4Q10) at ~US$17.5 billion (US$62/lb)
and REE at ~US$146 billion (US$30/kg).
Potential to be one of the world's largest REE and U
deposits - plus economic potential NaF, Zn and Sn.
Resource includes 283mlbs U3O8, 4.9mt REO, 1mt Zn
and 3.1mt NaF- defined over 2km x 1km; open at depth
(>300m) and along strike, regional prospectivity is high.
Metallurgical studies are advanced, with further progress
likely: flow sheet includes alkaline/carbonate pressure
leach for uranium, and flotation and leach for REO.
Pre-feasibility study, Feb '10: processing 10.8mtpa for 23
years, producing 43.7ktpa REO and 8.6mlbspa U3O8 .
Capex is US$2.31bn, opex US$41/t. NPV US$2.18bn.
Greenland Government has approved investigation of
uranium potential (Dec '10), including a DFS.
Well funded by likely $40m option conversions in 1H11.
Indicated, inferred
Reserves
U3O8
Project
150
0.0
Route
61%/100%
Location
Target
457 2,983
JV
*Also uranium (283mlbs contained @ 0.028%), Zn (0.99mt contained @ 0.22%) and NaF (3.09mt contained @ 0.85% NaF).
0.0
na
Key Projects
42.6
Investment Points
6.6
GGGO
T Ho (Non-Exec)www.ggg.gl
9.5
Uranium
Code for reporting mineral resources - Australian:
R McIllree (MD)
0
0.2
0.4
0.6
0.8
1
1.2
1.4
1.6
Feb
-10
Mar-
10
Apr-
10
May-
10
Jul-10
Sep-1
0
Nov-
10
Dec-
10
Jan-1
1
Sh
are
Pri
ce
($/S
hare
)
GGG - Greenland Minerals and Energy Limited
Source: Bloomberg
Overview: Greenland Minerals and Energy Limited listed on the ASX in June 2006 (ASX:GGG). It is evaluating the uranium-rich Kvanefjeld multi-element project in Greenland. Kvanefjeld (uranium, Greenland): The project (80km
2) is located on the SW tip of Greenland, at
Narsaq. Within the Ilimaussaq alkaline intrusive igneous complex, it is one of the world‟s largest rare earth elements and uranium deposits. Other elements and minerals include zinc, tin and sodium fluoride. GGG‟s 61% ownership can move to 90% with A$10m payment, and 100% with A$50m, subject to the results of litigation brought by its JV partner, Westrip Holdings Ltd (see disclaimer). The deposit: is a flat-lying slab of disseminated mineralisation, open at depth and in three directions. Current JORC resource (Jun ‟09) is 457mt @ 0.028% U3O8 for 283mlbs, 1.07% REO for 4.91mt (includes yttrium) and 0.22% Zn for 0.99mt, with 79% of these in the Indicated category. There is also 363mt @ 0.85% NaF for 3.09mt. The resource covers 2km by 1km and extends from surface to 280m depth. Exploration: There is resource upside within the ~6km x 4km Ilimaussaq intrusive. Also, regional and resource development drilling (~11,000m from Jun ‟10) intersected black lujavrite at Zone 2 (6km SE of Kvanefjeld), similar to mineralised rocks of the resource: assays include 131m @ 1.3% TREO, 447 ppm U3O8, 0.34% Zn (Feb ‟11). Modelling suggests lujavrite is present as a continuous layer at depth. Metallurgical and mineralogical tests are at an advanced stage. Current process flow sheet includes alkaline pressure leach (CPL) to remove uranium, recovering 84%, followed by flotation and acid leach to produce REE carbonate (rec. 34%). There is potential to improve recoveries, and to beneficiate the ore prior to the CPL circuit and reduce costs. There is also the possibility of generating a zinc concentrate (ZnS). Fluorine and thorium can both convert to insoluble compounds during CPL. A mineralogical study at UBC (Uni British Columbia) should help refine the processing methodology. Pre-Feasibility Study (updated January 2010): Calls for open cut mining, 10.8mtpa processing, for 43.7kt REO and 3.9kt (8.6mlbs) U3O8. Total capital cost is US$2.31bn with contingency. Operating costs are US$3.83/t mining, US$23.55/t for the CPL uranium circuit (US$29.61/lb at head grade 365ppm U3O8), which includes some of the REO flowsheet, and a further US$13.62/t for the REO circuit (US$3.36/kg at head grade 1.19% REO). Construction is scheduled for 2013 and production for 2015. The study places mid-point NPV (10% disc) at US$2.18bn (pre-tax). Base commodity prices are US$80/lb U3O8 (current LT contract price ~US$75/lb) and US$13/kg REO (could now be +US$30/kg). Break even U3O8 is US$37/lb. A Definitive Feasibility Study (DFS) should start in 2H11. Permitting: In Dec „10, the Greenland Government approved full evaluation of the deposit‟s economic potential, including uranium. This, importantly, includes permission for a DFS. Critical studies will include Environmental and Social Impact Assessments, for which contracts have been awarded (Feb ‟11). Corporate: GGG raised working capital in 2Q10, placing A$6m in equity at $0.34/share, and has organised a further $15m equity facility that can be drawn down when needed over the next 5 years. Timely option conversions, the majority at $0.2/share, could raise $40m in 4Q10-2Q11 ($11.9m to date). Investment Comment: As we first forecast in March 2008, GGG has grown from a <$200m to >$500m company (fully diluted), helped by strong REE and resurgent uranium markets, a softening of Greenland‟s stance on uranium, and exploration success. The mid-point NPV in the 2010 Pre-Feasibility Study of US$2.18bn shows the share price could go further. Potential positive share price catalysts: the DFS with further process improvements; resource expansion; permission to mine; project finance; and a move from 61% to 90% ownership of Kvanefjeld. In view of increasing project confidence, especially following positive exploration results and their potential effect on NPV, we revise our mid-term sp target upwards from A$1.46/share (in Nov „10) to $1.80/share.

Resource Capital Research
Rare and Minor Metals Company Review, March Q 2011. Disclaimer and disclosure attached. Copyright© 2011 by Resource Capital Research Pty Ltd. All rights reserved. 14
Block section showing Kvanefjeld and the Zone 2 exploration target, southern Greenland: there is
considerable potential to extend the current resource (incl .283mlbs U3O8 and 4.9mt of rare earth oxides).
Mineralised lujavrite may form a continuous layer at depth, a theory supported by recent Zone 2 drilling
(185m @ 1.2% TREO).
Development schedule for Kvanefjeld: The updated PFS is expected in 2Q11. As hoped, the Greenland Gov‟t has given permission for a DFS, which should include pilot and demonstration level processing
plants. Production is possible in 2015.

Resource Capital Research
Rare and Minor Metals Company Review, March Q 2011. Disclaimer and disclosure attached. Copyright© 2011 by Resource Capital Research Pty Ltd. All rights reserved. 15
Latin Resources Limited
Capital Profile Production and Financial Forecasts
0.35
Debt (A$m) - Mar 11F
Enterprise value (A$m)
Avg monthly volume (m)
Cash (A$m) - Mar 11F
Price/Cash (x) Cash (A$m)
Price/Book (x)
Listed company options: Net asset backing (Ac/share)
*Unlisted until September 2010. Quarters stated on calendar year basis.
Investment Points Company Comment
Cape Lambert largest shareholder.
Reserves and Resources/Mineralised MaterialCode for reporting mineral resources - Australian: (JORC)
Contacts Directors Key Projects
Mr Chris Gale R Brown (Non Exec Chair)
(Managing Director) C Gale (MD)
Tel: +61 8 94850601 D Vilensky (Non Exec)
Perth, WA, Australia M Rowbottam (Non Exec)
www.latinresources.com.au J Moran (CFO)
Analyst: Dr Trent Allen
0.0
%
1.40
0.3
mt mt
Fe Cut Off Fe Fe Equity
0.0
Iron (Fe) Classification Project Ore
2010a* 2011F
Corporate (A$m) 0.49 0.29 na
2012F
Exploration and evaluation (A$m) 0.78 0.90 na 2.86 3.00
YEAR END: June Dec-10a Mar-11F
Exploration/(Expl.+ Corporate) (%) 61 76 na 64 68
Funding duration at current burn (years) na 0.0 0.5
Shares on issue (pr end) (m shares) 132.8 132.8 0.1 132.8 150.3
Drilling - RAB (m) 0 0 0 2,300 9,200
53 80
Drilling - Other/Diamond (m) 0 0 0 2,700 10,800
0.40 0.00
Land holding ('000 ha)* 39 53
Tenement costs ($k per year) - - - -
Funding from JV partners (A$m)
Cash backing (Ac/share) 1.9 0.1
0.0 0.0
Capital raisings (A$m)
2.6 1.2
0.9 1.4
2.6 na 2.4 5.4
na
3.0
0.0 0.0
0.2 2.1
1.58
2.00 7.40 7.00
na
-
Equity mt %
Share price (A$) 0.35
52 week range (A$/share) 0.14 to
182.7
0.0
0.0
LRSO
Mineral exploration and development company based in
Peru, focused on iron ore (skarn and placer deposits).
Guadalupito Project: magnetite-rich iron sands, also
prospective for rare earths, zircon, tungsten, andalusite
and gold. Close to Chimbote, site of major iron smelter.
Guadalupito area has recently increased sevenfold - LRS
now holds ~50km underexplored strike, potential world
class project. Drilling February 2011.
Portfolio of hard rock iron ore prospects in Ilo near major
port. Drilling 2,700m program from April 2011 on covered
magnetic targets defined by Teck (NYSE:TCK).
Recent listing (Sep '10) but more than 2 years of
exploration work and $3m spent to date.
Cape Lambert (ASX:CFE; mkt cap ~$426m) is largest
shareholder.
Strong experienced management team.
Market capitalisation (undiluted, A$m) 46.5
0.0
Reserves
Number of shares (m) 132.8
Number of options (m) 49.9
Convertible notes (m) 0
Number of securities (fully diluted, m)
Mid Exploration
Exchanges: ASX:LRS
0.0
45.2
Major shareholders: Cape Lambert Iron Ore (17%),
Fidelis Corp (11.0%), Lascelles Holdings (8.6%)
2
1.2
37.4
13.3
LRS.AU A$ 0.35
16 February 2011 The share price of this recent, Peru-focused ASX listing has
surged on news of a sevenfold increase in the scale of its
Guadalupito mineral sands project. Drilling of the iron-rich sands,
and of magnetite skarns near Ilo, is planned for coming weeks.
Iron Ore, Mineral Sands (Fe, REE, Zr, W, Au, Andalusite)
Peru
Status
PeruIlo Norte, Ilo Sur 100%
Mineralised Material (est., non compliant w ith JORC)
Latin Resources Limited
0.0 0.0
Resources
Ownership/ JV Target Process
LocationType Route
Project
Fe na Skarn na Mid Expl
Project Option Metal Partner
Guadalupito 100% Fe,REE na Sands na Mid Expl Peru
Pampa de Pongo 100% Fe (Cu,Au) na IOCG na Early Expl Peru
Early Expl PeruFerro Tacna 100% Fe (Cu,Au) na IOCG na
Toray 100% Fe na Skarn na Early Expl Peru
Coribeni 100% Fe na Skarn na Early Expl Peru
0
0.05
0.1
0.15
0.2
0.25
0.3
0.35
0.4
Apr-
10
May-
10
Jun-1
0
Jun-1
0
Jul-10
Aug-1
0
Aug-1
0
Sep-1
0
Oct-10
Nov-
10
Dec-
10
Jan-1
1
Feb
-11
Sh
are
Pri
ce
($/S
hare
)
LRS - Latin Resource Limited
Source: Bloomberg
Overview: Latin Resource listed on the ASX in September 2010, via an IPO at A$0.20/share to raise $6m, including $1m in oversubscriptions. It is focused on iron ore exploration and development in Peru (holding +500km
2), with an interest in iron sands and deposits of rare, minor and precious metals.
Strategy: Peru is a traditional producer of precious and base metals, and is now the focus of considerable iron ore exploration, including +$1Bn, +1Bn tonne developments by each of Shougang and Nianjinzhao (China) in the Pampa de Pongo area. Latin‟s iron ore assets are close to infrastructure, including road and port. Exploration in 2011 should help to identify a flagship project, where Latin may then establish a JORC-qualifying resource and commence mineral production. Guadalupito Project (mineral sands): 200km N of Lima, 20km S of the port town of Chimbote, which has Peru‟s largest iron smelter, and 5km from the Pan American Highway. The targets are beach placer deposits along the current shoreline, extending up to 5km inland. The project area was recently expanded sevenfold, from 22km
2 (option) to 163km
2, significantly increasing contiguous strike length to
40-50km (for a purchase price of US$20m over 10 years with $1.6m in 2011-12). Of this area, 60km2 is
thought to be highly prospective. Potentially economic minerals/metals include low-Ti magnetite and other Fe-Ti-V oxides, monazite (which contains light rare earths), andalusite (an aluminosilicate used in steelmaking), zircon, tungsten minerals and gold. Peru has little or no history of sand mining; sporadic work has been done in the area since the 1960s, focused on gold exploration. LRS has dug four test pits: average grade of these samples is 16.5% Fe, 146ppb Au, 1.16% Ti, 79ppm W, 99ppm Zr and 117ppm La. Mineral concentrates from gravity and magnetic separation assayed 63.5%-64% Fe: a typical sample (11.5% mass recovery) has assayed 63.5% Fe, 4.9% TiO2, 0.4% V2O5, 1.1% Al2O3, 0.1% P and 2.5% SiO2. Further assays are pending. Gold could be an important byproduct, with grades 3ppb to 278ppb, and 69% recovered to the -150μm fraction. These numbers are competitive with global iron sands projects. Sand mines in general have low operating costs (opex) due to simple extraction (free dig) and processing. An advantage of Guadalupito is that its placers are geologically recent, so the sediments are clean and potentially unaffected by slimes or oxide grain coatings. Unlike many areas of Peru, where landowners can make development difficult, the tenements are controlled by the Government. Drilling is planned for February 2011, with results expected in March. Ilo Project (iron ore): Divided into Ilo Norte and Ilo Sur tenements (103km
2 and 72km
2), 45km N and
40km S (respectively) of the Port at Ilo in southern Peru (800km S of Lima). Both areas have iron ore drill targets, after airborne magnetic surveys by Latin‟s partner Teck (8200 line km costing $2.5m; Teck can earn 50c/t royalty on Fe production and a 40% free carry on copper-gold discoveries). The current focus is on Ilo Norte, where Latin has conducted ground magnetic surveys over five areas (Mariela, and Essendon 2, 4, 5, 6). The targets are skarns, measuring 600m x 400m to 100-300m depth, and assaying up to 34.6% Fe (with veins to 56.2%). A particular focus will be Mariela, which is a high amplitude, covered magnetic anomaly. Drilling (2700m) at Ilo Norte and Sur is planned for April 2011, with results expected in May. Investment comment: The recent acquisition at Guadalupito has transformed it from an interesting prospect to a potentially world class mineral sands project. This potential is being recognised, as shown by recent share price gains. Latin Resources is competitively capitalised relative to other ASX-listed iron ore explorers focused on South America, e.g. Strike (Peru, A$62m) and Centaurus (Brazil, A$101m). Such explorers have a strong “tradition” of adding value via resource definition and development. As a recent listing, Latin is only at the beginning of this process, so share price gains can be expected if exploration in 2011 is successful.

Resource Capital Research
Rare and Minor Metals Company Review, March Q 2011. Disclaimer and disclosure attached. Copyright© 2011 by Resource Capital Research Pty Ltd. All rights reserved. 16
Guadalupito Project: a recent transaction has expanded Latin‟s holding to 16,268ha and extended strike to ~50km, creating in the process a potentially world class magnetite and mineral sands project. Other target
commodities are monazite (rare earths), zircon, tungsten and gold.
Near-term schedule: drilling is planned for 1Q11, with results expected in March-May. Work in the Ilo area (magnetite skarns) can commence after site and road preparation is completed. Latin‟s projects are close
to major infrastructure.

Resource Capital Research
Rare and Minor Metals Company Review, March Q 2011. Disclaimer and disclosure attached. Copyright© 2011 by Resource Capital Research Pty Ltd. All rights reserved. 17
Lynas Corporation Limited
2.38
Debt (A$m) - Mar 11F
Enterprise value (A$m)
Major shareholders:
Avg monthly volume (m)
Cash (A$m) - Mar 11F
Price/Cash (x) Cash (A$m)
Price/Book (x)
Listed company options: Net Asset Backing (Ac/share)
Quarters refer to calendar year.
Contacts Directors
Mr. Nicholas Curtis
Executive Chairman
Tel: 61 (2) 8259 7100
Sydney, NSW, Australia
Associate: Greg Burns
Flotation
Cut Off
164
3.5
14.4 2.5
Process
0.0
1,160
Mineralised Material (est., non compliant w ith JORC)
19.2Swan**
Classification
94.9
Kt%
Cash Backing (Ac/share)
Malawi
17.1
8.4
Indicated & Inferred 6.32100%
Carb'tite
Ownership/
Option
100%
Carb'titenone
none
Central Lanthanide Measured
ppm
0.0
TLnO
LYC has a stong competitive position in rare earths due to its
world class resource, integrated mine to market approach, first
mover advantage in offering new supply from a source outside
China, and its pricing and cost advantages.
A$ 1.93
Production and Financial Forecasts
YEAR END: June Dec-10a
na
1,680
1,084
2,700
Y2O3Ore REO
Mt REO %
1.5
0
0
Exploration and Evaluation (A$m) 0 1
LYC.AU
85
Rare Earths
Australia (WA), Malaysia
Project Construction
Exchanges: ASX:LYC, ADR:LYSDY
Capital Profile
52 week range (A$/share)
Lynas Corporation Ltd
to
16 February 2011
Share price (A$)
Number of shares (m) 1663
Options and warrants (m)
1.93
0.35Mar-11F 2011F
0.00
3208.6
1748
12
Rare Earth Production (koz) 0.0 0.0
0
2010a
Market capitalisation (undiluted) (A$m) 4.1
Convertible notes (m) 4
Cash Costs (US$/kg)
16.3
100% rare earths focus in two geographical regions (WA
& Malawi), with a mine to customer business model.
By late 2011 will offer the first new source of REO
supply outside of China.
Mount Weld (WA, 100% LYC) is the richest known
deposit of REE in the world at 17.5mt @ 8.1% REO.
Commissioning of the 33ktpa concentration plant to start
in Mar'11.
LAMP (Malaysia, 100% LYC) under construction with
Phase 1 production of 11ktpa of separated REO due to
start-up during 3Q11.
Agreement with Sojitz to provide US$250m for Phase 2
expansion that will double the size of both operations.
Final commitment expected Apr '11 for 2012 start-up.
REE
842
Fully diluted (m)
3208.6
21.9
Investment Points
5.8
No
146.5
Morgan Stanley (13%), JP Morgan Chase (5%), Capital Group (4.7%)
0.0
Status
Resources
Kangankunde, Malawi
Project
Key Projects
8.1
Reserves
ProjectRare Earth Elements
Code for reporting mineral resources - Australian:
10.0
37.7
100%Indicated
Inferred
Route
0.0
Gravity
Commissioning
Mid Expl.
Location
0.0
2.5
2.5
1,416
2,450
REO
Duncan
%
Duncan 2.5
na
1,523
475
107
Company Comment
1.1
Partner
100%
0.0
N Curtis (Exec Chairman)
W Forde (Non Exec)
60.4
* Polymetallic deposit.
Project
** Phosphate deposit
Target
Type
JV
Metal
REE
Mount Weld
100%
Analyst: Dr Trent Allen
J Klein (Non Exec)
www.lynascorp.com Z Switkowski (Non Exec)
D Davidson (Non Exec)
Kangankunde
Crown* Indicated & Inferred
Aus (WA)
Total Mount Weld
20.02
17.49
2.53
Central Lanthanide
5.5
1.3
3.97
100% 4.2
Indicated & Inferred 100% 4.1
7.9
5.22013.65
3.9
Measured
0.0
100%
14.35113.55100%
2012F
0.0 3.20.0
2
59.6
0
820
0
60.0
3.7 6.3
0
2
0.8
8.8
35.0 33.4
540
0.0
8.5
Reserves and Resources/Mineralised Material
22.4
Exploration/(Expl.+ Corporate) (%) 1.1
(JORC)
Equity
0
2,000
271.6 146.5
1,662
Drilling - RAB (m) 0
Corporate (A$m) 11.3 23.5
1,662 1,662
0
2,0000 5,000
2 2
Capital Raisings (A$m) 0.0 431.5
1,662 1,655
Drilling - Other/Diamond (m) 0
Shares on issue (pr end) (m shares)
2
Funding from JV partners (A$m) 0 0 0
405.2 56.8
0
Land holding ('000 ha)* 2
0
5.7
37.4 31.8
24.5 3.4
0
0.5
1
1.5
2
2.5
Feb
-10
Mar-
10
Apr-
10
May-
10
Jul-10
Aug-1
0
Sep-1
0
Oct-10
Nov-
10
Dec-
10
Jan-1
1
Sh
are
Pri
ce
($/S
hare
)
LYC - Lynas Corporation Ltd
Source: Bloomberg
Overview: LYC is a rare earth element (REE) exploration company, poised to become a producer during 2011. Association with the Mount Weld REE project started in Oct‟01 when Anaconda Nickel sold its interest for ~$5m. Funding packages secured in FY08 were withdrawn during the GFC and led to the suspension of construction in Feb‟09. A $450m equity raising in Nov‟09 enabled development to restart. During this period to-date, prices for Mt Weld‟s RE oxide (REO) blend have climbed from US$5/kg to US$70/kg. Mount Weld is the richest known REE deposit in the world at 17.5mt @ 8.1% REO. Located near Laverton (WA) it underpins LYC‟s strategy to create a fully integrated REE supplier. The current mine plan is based upon the Central Lanthanide deposit. The first (contract) mining campaign is complete, with 773kt of ore stockpiled. The 33ktpa concentration plant is due to be commissioned in Mar‟11. Concentrate will be containerised, trucked 1,000km to Fremantle and shipped to the Lynas Advanced Materials Plant (LAMP) in Kuantan, near Pahang, Malaysia. LAMP incorporates the latest technology and is world scaled. Initial capacity is 11ktpa of separated REO, with expansion to 22ktpa. First feed to kiln is scheduled for 3Q11. In Nov‟10, agreement was reached with Sojitz Corp that could accelerate expansion plans at the concentration plant (to 66ktpa) and LAMP (to 22ktpa). The key terms include Sojitz securing US$250m in funding to cover expansion costs in return for ~8,500tpa allocation of REO for the Japanese market. Together with six other offtake agreements already signed, approximately 70% of LAMP‟s 22ktpa capacity has been allocated. If implemented, the LAMP expansion could be committed to by Apr‟11. Malawi: LYC has secured Govt of Malawi approval to acquire the fully permitted Kangankunde REE resource. This US$4m acquisition was announced in Sep‟07. The deposit has an inferred resource of 2.5mt @ 4.24% REO. This acquisition differentiates LYC from most REE miners as having two significant ore resources in different geographic regions. Investment Comment: LYC‟s share price has doubled in the past three months due to high REE prices and reflecting solid progress towards development milestones. Our NAV for LYC is $2.61/share (assuming US$35/kg long term price, A$/US$0.82). Derisking issues like successful commissioning of operations and the satisfactory loan negotiations with Sojitz should energise the share price.

Resource Capital Research
Rare and Minor Metals Company Review, March Q 2011. Disclaimer and disclosure attached. Copyright© 2011 by Resource Capital Research Pty Ltd. All rights reserved. 18
LYC‟s Mt Weld project economics are sensitive to the REO price. Using our base case of
US$35/kg REO long term, the NAV is A$2.68/share, or A$2.61 diluted for options.
Sensitivity Sensitivity
LONG TERM RARE EARTH PRICE US$25/kg US$50/kg
AUUS EXCHANGE RATE 0.82 0.82 0.82
A$m A$m
MT WELD BASE CASE NPV @ 12% 1,405 4,883
+ Cash 272 272
+ Exploration 28 28
+ Tax Losses 46 46
- Corporate 424 424
LYC NET ASSET VALUE 1326 4804
LYC NET ASSET VALUE PER SHARE :A$/share 0.80 2.90
LYC NET ASSET VALUE DILUTED :A$/share dil 0.81 2.81
RESOURCE VALUATION 2.5% REO CUTOFF :US$/kg REO 0.83 2.84
Sensitivity analysis assumes flat nominal REE price for life of project.
RESOURCE ESTIMATES
Rare Earth Resource Tonnes Grade REO
Cutoff Mt % REO Kt
MEASURED, INDICATED & INFERRED Lanthanide 2.5% 9.9 10.7 1,057
MEASURED, INDICATED & INFERRED Duncan 2.5% 7.6 4.8 366
TOTAL 2.5% 17.5 8.1 1,416
MINING METHOD OPEN PIT
1. Contract truck and excavator operation. First campaign finished with 773kt stockpiled.
PROCESS METHOD CONCENTRATION PLANT (WA)
1. Conventional crushing, grinding, floatation & filter press process.
2. Initial capacity is 121ktpa ore to produce 33ktpa REE concentration @ 40% REO.
PROCESSING PLANT (MALAYSIA)
1. Rotary kiln, leaching, purification process.
2. Initial capacity is 11,000tpa separated rare earth products.
BASE CASE ASSUMPTIONS
Phase 1 Phase 2
PRODUCTION RATE Concentration 33,000tpa 66,000tpa
Processing 11,000tpa 22,000tpa
CAPITAL COSTS :A$m 555 300
SUSTAINING CAPEX :A$m 22 32
OPERATING COSTS :US$/kg 20.00 9.00
TAX :% 12 year tax exemption & $80m in tax losses.
COMMISSIONING DATES Concentration Q1 2011 Q2 2012
Processing Q4 2011 Q1 2013
4,521
272
28
MT WELD RARE EARTH PROJECT KEY ASSUMPTIONS
46
2.61
2.68
424
2.63
LYNAS CORPORATION VALUATION
Base Case
US$35/kg
4442
A$m
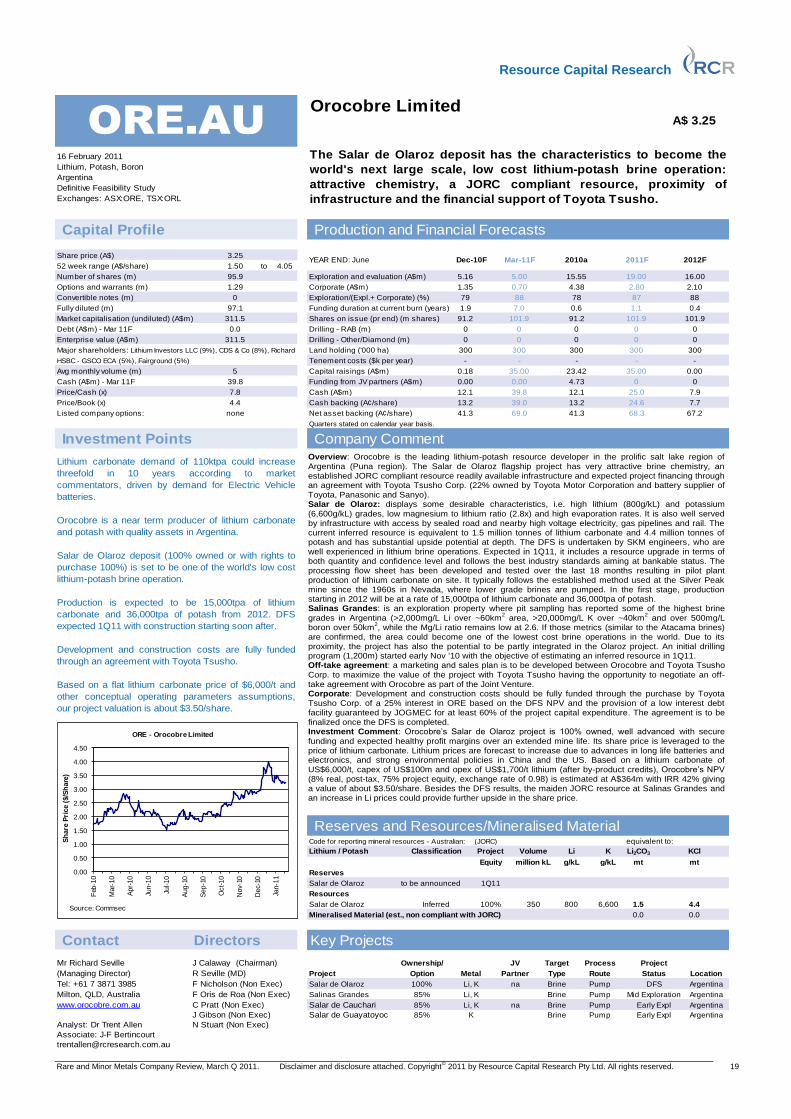
Resource Capital Research
Rare and Minor Metals Company Review, March Q 2011. Disclaimer and disclosure attached. Copyright© 2011 by Resource Capital Research Pty Ltd. All rights reserved. 19
Orocobre Limited
4.05
Debt (A$m) - Mar 11F
Enterprise value (A$m)
Avg monthly volume (m)
Cash (A$m) - Mar 11F
Price/Cash (x) Cash (A$m)
Price/Book (x)
Listed company options: Net asset backing (A¢/share)
Quarters stated on calendar year basis.
equivalent to:
Reserves
Resources
Mineralised Material (est., non compliant with JORC)
Contact Directors
Mr Richard Seville
(Managing Director)
Tel: +61 7 3871 3985
Milton, QLD, Australia
Salar de Cauchari
Salar de Guayatoyoc
Analyst: Dr Trent Allen
Associate: J-F Bertincourt
Salar de Olaroz to be announced 1Q11
Early ExplPump
Salar de Olaroz 100% Pump
Project
Location
ArgentinaBrineLi, K
100% 350
Project
Ownership/ Target
800
Partner
Salar de Olaroz
Key Projects
Metal
Argentina
Brine
Salinas Grandes 85% Li, K
Argentina
85%
85%
Brine
na PumpBrine
Reserves and Resources/Mineralised MaterialCode for reporting mineral resources - Australian: (JORC)
J Gibson (Non Exec)
N Stuart (Non Exec)
39.812.1
StatusType
JV
6,600Inferred
300 300
-
35.00
million kL
Volume
0.00 00.00
Production and Financial Forecasts
2012F
Exploration and evaluation (A$m)
79
Dec-10F
88
101.9
2.10
Mar-11F
5.16 5.00
4.380.70 2.801.35
Orocobre Limited
The Salar de Olaroz deposit has the characteristics to become the
world's next large scale, low cost lithium-potash brine operation:
attractive chemistry, a JORC compliant resource, proximity of
infrastructure and the financial support of Toyota Tsusho.
2011F
15.55 16.0019.00
A$ 3.25
2010a
Corporate (A$m)
0
Capital Profile
Options and warrants (m)
52 week range (A$/share) to
1.29
Share price (A$)
Number of shares (m) 95.9
0
0
Lithium, Potash, Boron
Argentina
Definitive Feasibility Study
Exchanges: ASX:ORE, TSX:ORL
Convertible notes (m)
YEAR END: June3.25
1.50
91.2
35.00
88Exploration/(Expl.+ Corporate) (%)
- -
300
0
Capital raisings (A$m)
Shares on issue (pr end) (m shares)
0
0.6
87
0
1.9
91.2 101.9
78
7.0
0
7.8
Funding from JV partners (A$m)
Drilling - RAB (m)
0.4
101.9
00
1.1
0
0
5
Fully diluted (m)
311.5
www.orocobre.com.au
none
4.4
16 February 2011
311.5
ORE.AU
Market capitalisation (undiluted) (A$m)
Funding duration at current burn (years)
Drilling - Other/Diamond (m)
Land holding ('000 ha)
97.1
13.2
HSBC - GSCO ECA (5%), Fairground (5%)
0.0
Tenement costs ($k per year)
39.8
Lithium carbonate demand of 110ktpa could increase
threefold in 10 years according to market
commentators, driven by demand for Electric Vehicle
batteries.
Orocobre is a near term producer of lithium carbonate
and potash with quality assets in Argentina.
Salar de Olaroz deposit (100% owned or with rights to
purchase 100%) is set to be one of the world's low cost
lithium-potash brine operation.
Production is expected to be 15,000tpa of lithium
carbonate and 36,000tpa of potash from 2012. DFS
expected 1Q11 with construction starting soon after.
Development and construction costs are fully funded
through an agreement with Toyota Tsusho.
Based on a flat lithium carbonate price of $6,000/t and
other conceptual operating parameters assumptions,
our project valuation is about $3.50/share.
Investment Points
Cash backing (A¢/share)
Project
67.2
39.0
Lithium / Potash Classification Li2CO3
41.3
g/kL
69.0
-
g/kL
Li
13.2
7.9
Company Comment
Argentina
DFS
25.0
mt
4.4
68.3
1.5
KCl
Pump Mid Exploration
Early Expl
23.42
300
04.73
41.3
300
-
Major shareholders: Lithium Investors LLC (9%), CDS & Co (8%), Richard Seville (5%)
Route
J Calaway (Chairman)
R Seville (MD)
12.1
Process
Equity
F Nicholson (Non Exec) na
C Pratt (Non Exec)
F Oris de Roa (Non Exec)
K
Li, K
0.0
K
0.18
Option
0.0
7.7
0.00
24.6
mt
0.00
0.50
1.00
1.50
2.00
2.50
3.00
3.50
4.00
4.50
Feb
-10
Mar-
10
Apr-
10
Jun-1
0
Jul-10
Aug-1
0
Sep-1
0
Oct-10
Nov-
10
Dec-
10
Jan-1
1
Sh
are
Pri
ce
($/S
hare
)
ORE - Orocobre Limited
Source: Commsec
Overview: Orocobre is the leading lithium-potash resource developer in the prolific salt lake region of Argentina (Puna region). The Salar de Olaroz flagship project has very attractive brine chemistry, an established JORC compliant resource readily available infrastructure and expected project financing through an agreement with Toyota Tsusho Corp. (22% owned by Toyota Motor Corporation and battery supplier of Toyota, Panasonic and Sanyo). Salar de Olaroz: displays some desirable characteristics, i.e. high lithium (800g/kL) and potassium (6,600g/kL) grades, low magnesium to lithium ratio (2.8x) and high evaporation rates. It is also well served by infrastructure with access by sealed road and nearby high voltage electricity, gas pipelines and rail. The current inferred resource is equivalent to 1.5 million tonnes of lithium carbonate and 4.4 million tonnes of potash and has substantial upside potential at depth. The DFS is undertaken by SKM engineers, who are well experienced in lithium brine operations. Expected in 1Q11, it includes a resource upgrade in terms of both quantity and confidence level and follows the best industry standards aiming at bankable status. The processing flow sheet has been developed and tested over the last 18 months resulting in pilot plant production of lithium carbonate on site. It typically follows the established method used at the Silver Peak mine since the 1960s in Nevada, where lower grade brines are pumped. In the first stage, production starting in 2012 will be at a rate of 15,000tpa of lithium carbonate and 36,000tpa of potash. Salinas Grandes: is an exploration property where pit sampling has reported some of the highest brine grades in Argentina (>2,000mg/L Li over ~60km
2 area, >20,000mg/L K over ~40km
2 and over 500mg/L
boron over 50km2, while the Mg/Li ratio remains low at 2.6. If those metrics (similar to the Atacama brines)
are confirmed, the area could become one of the lowest cost brine operations in the world. Due to its proximity, the project has also the potential to be partly integrated in the Olaroz project. An initial drilling program (1,200m) started early Nov „10 with the objective of estimating an inferred resource in 1Q11. Off-take agreement: a marketing and sales plan is to be developed between Orocobre and Toyota Tsusho Corp. to maximize the value of the project with Toyota Tsusho having the opportunity to negotiate an off-take agreement with Orocobre as part of the Joint Venture. Corporate: Development and construction costs should be fully funded through the purchase by Toyota Tsusho Corp. of a 25% interest in ORE based on the DFS NPV and the provision of a low interest debt facility guaranteed by JOGMEC for at least 60% of the project capital expenditure. The agreement is to be finalized once the DFS is completed. Investment Comment: Orocobre‟s Salar de Olaroz project is 100% owned, well advanced with secure funding and expected healthy profit margins over an extended mine life. Its share price is leveraged to the price of lithium carbonate. Lithium prices are forecast to increase due to advances in long life batteries and electronics, and strong environmental policies in China and the US. Based on a lithium carbonate of US$6,000/t, capex of US$100m and opex of US$1,700/t lithium (after by-product credits), Orocobre‟s NPV (8% real, post-tax, 75% project equity, exchange rate of 0.98) is estimated at A$364m with IRR 42% giving a value of about $3.50/share. Besides the DFS results, the maiden JORC resource at Salinas Grandes and an increase in Li prices could provide further upside in the share price.
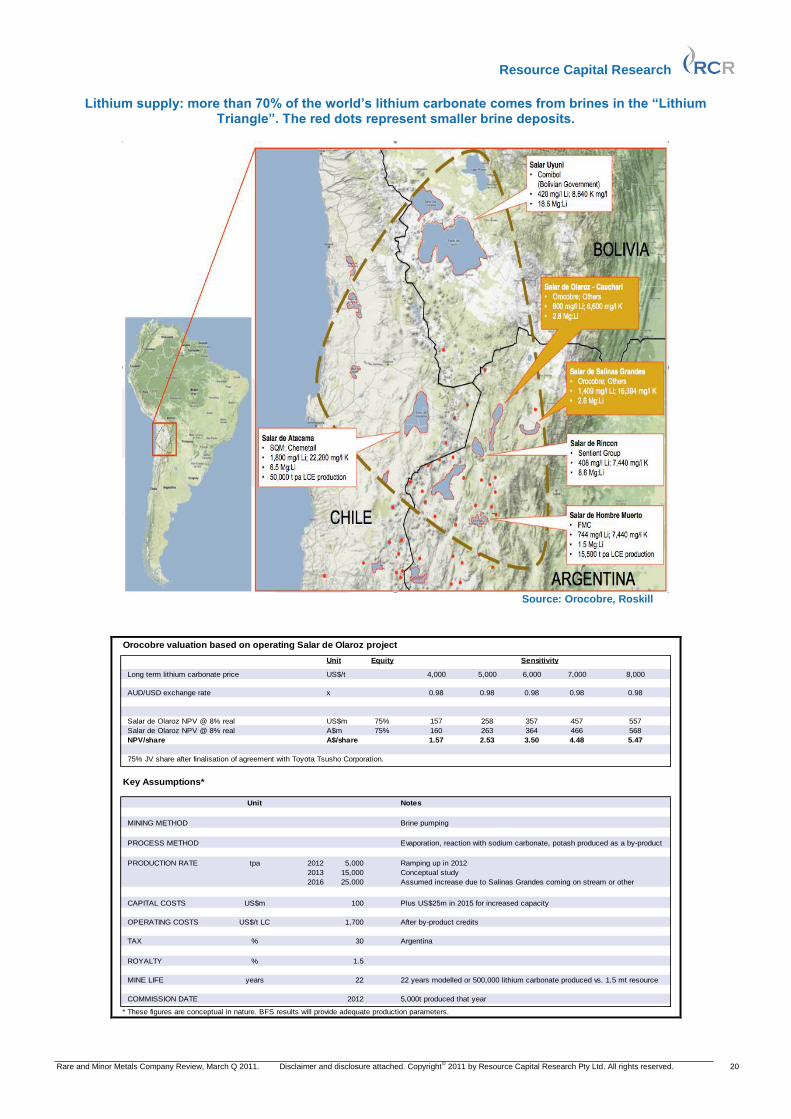
Resource Capital Research
Rare and Minor Metals Company Review, March Q 2011. Disclaimer and disclosure attached. Copyright© 2011 by Resource Capital Research Pty Ltd. All rights reserved. 20
Lithium supply: more than 70% of the world‟s lithium carbonate comes from brines in the “Lithium Triangle”. The red dots represent smaller brine deposits.
Source: Orocobre, Roskill
Orocobre valuation based on operating Salar de Olaroz project
Unit Equity
Long term lithium carbonate price US$/t 4,000 5,000 6,000 7,000 8,000
AUD/USD exchange rate x 0.98 0.98 0.98 0.98 0.98
Salar de Olaroz NPV @ 8% real US$m 75% 157 258 357 457 557
Salar de Olaroz NPV @ 8% real A$m 75% 160 263 364 466 568
NPV/share A$/share 1.57 2.53 3.50 4.48 5.47
75% JV share after finalisation of agreement with Toyota Tsusho Corporation.
Key Assumptions*
Unit Notes
MINING METHOD Brine pumping
PROCESS METHOD Evaporation, reaction with sodium carbonate, potash produced as a by-product
PRODUCTION RATE tpa 2012 5,000 Ramping up in 2012
2013 15,000 Conceptual study
2016 25,000 Assumed increase due to Salinas Grandes coming on stream or other
CAPITAL COSTS US$m 100 Plus US$25m in 2015 for increased capacity
OPERATING COSTS US$/t LC 1,700 After by-product credits
TAX % 30 Argentina
ROYALTY % 1.5
MINE LIFE years 22 22 years modelled or 500,000 lithium carbonate produced vs. 1.5 mt resource
COMMISSION DATE 2012 5,000t produced that year
* These figures are conceptual in nature. BFS results will provide adequate production parameters.
Sensitivity

Resource Capital Research
Rare and Minor Metals Company Review, March Q 2011. Disclaimer and disclosure attached. Copyright© 2011 by Resource Capital Research Pty Ltd. All rights reserved. 21
Market Update: Lithium
Investment Comment
Increasing intensity of lithium use could require new capacity beyond
2014, though a rush of new producers could bring oversupply – at which
stage, successful suppliers will be those that can provide consistent
volumes at competitive price. In the short-medium term, resources are
ample but could be slow to bring online, due to financial and technical
hurdles faced by some projects. There is an opportunity for developers,
with projects that can be advanced quickly, to gain market share.
Pricing
Lithium carbonate is currently at US$5,070-US$5,291/t. The CAGR of Li
carbonate 2005-2009 was 6.2%, with 2.0% forecast for 2010-2014
(Source: ASX:GXY). By 2015, nominal prices are expected to approach
those seen before the GFC (2007, US$6,731/t; 2015, US$6,757/t).
Chinese lithium carbonate export prices in US$/t 2000-2009,
plus forecast 2010-2015.
Source: Galaxy Resources
Market: Supply and Demand
The main producers of lithium in 2010 were Chile (brines, 8.8kt Li),
Australia (pegmatites, 8.5kt), China (4.5kt) and Argentina (2.9kt), with
a total 25.3kt Li, up from 18.8kt in 2009 (Source: USGS estimates). Li
converts to Li carbonate at ~1:5 by mass. Global reserves are thought
to be 9.9Mt Li, of which 76% are in Chile.
World consumption of Li by end use (t Li Carbonate; Roskill)
Lithium producers,
current or near-term,
will be well placed to
take advantage of
forecast increases in Li
price and demand.
Lithium carbonate
price, large contracts
(cont. USA) is
US$5,070-US$5,291/t.
CAGR of 2% is
forecast for 2010-
2014.
Li is produced from
brines and pegmatites,
with 25.3kt Li supplied
in 2010.
Other than batteries,
uses include ceramics
and glass, and
lubricants.
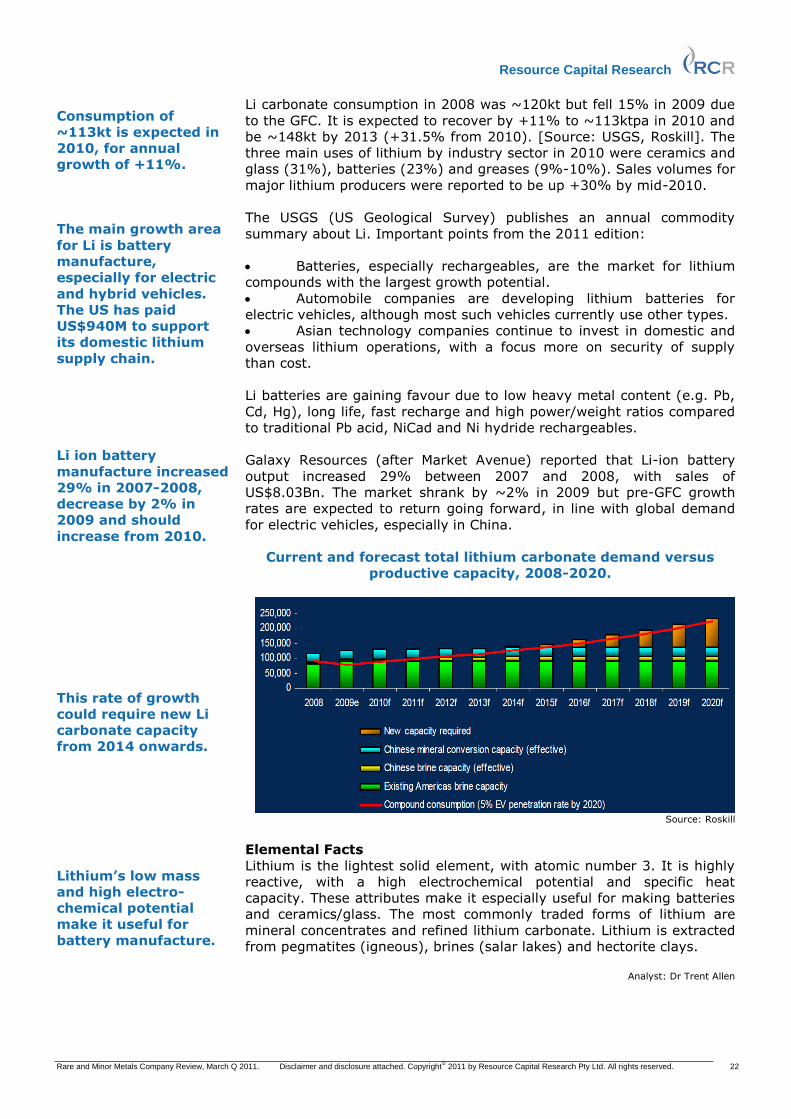
Resource Capital Research
Rare and Minor Metals Company Review, March Q 2011. Disclaimer and disclosure attached. Copyright© 2011 by Resource Capital Research Pty Ltd. All rights reserved. 22
Li carbonate consumption in 2008 was ~120kt but fell 15% in 2009 due
to the GFC. It is expected to recover by +11% to ~113ktpa in 2010 and
be ~148kt by 2013 (+31.5% from 2010). [Source: USGS, Roskill]. The
three main uses of lithium by industry sector in 2010 were ceramics and
glass (31%), batteries (23%) and greases (9%-10%). Sales volumes for
major lithium producers were reported to be up +30% by mid-2010.
The USGS (US Geological Survey) publishes an annual commodity
summary about Li. Important points from the 2011 edition:
Batteries, especially rechargeables, are the market for lithium
compounds with the largest growth potential.
Automobile companies are developing lithium batteries for
electric vehicles, although most such vehicles currently use other types.
Asian technology companies continue to invest in domestic and
overseas lithium operations, with a focus more on security of supply
than cost.
Li batteries are gaining favour due to low heavy metal content (e.g. Pb,
Cd, Hg), long life, fast recharge and high power/weight ratios compared
to traditional Pb acid, NiCad and Ni hydride rechargeables.
Galaxy Resources (after Market Avenue) reported that Li-ion battery
output increased 29% between 2007 and 2008, with sales of
US$8.03Bn. The market shrank by ~2% in 2009 but pre-GFC growth
rates are expected to return going forward, in line with global demand
for electric vehicles, especially in China.
Current and forecast total lithium carbonate demand versus
productive capacity, 2008-2020.
Source: Roskill
Elemental Facts
Lithium is the lightest solid element, with atomic number 3. It is highly
reactive, with a high electrochemical potential and specific heat
capacity. These attributes make it especially useful for making batteries
and ceramics/glass. The most commonly traded forms of lithium are
mineral concentrates and refined lithium carbonate. Lithium is extracted
from pegmatites (igneous), brines (salar lakes) and hectorite clays.
Analyst: Dr Trent Allen
Consumption of
~113kt is expected in
2010, for annual
growth of +11%.
The main growth area
for Li is battery
manufacture,
especially for electric
and hybrid vehicles.
The US has paid
US$940M to support
its domestic lithium
supply chain.
Li ion battery
manufacture increased
29% in 2007-2008,
decrease by 2% in
2009 and should
increase from 2010.
This rate of growth
could require new Li
carbonate capacity
from 2014 onwards.
Lithium‟s low mass
and high electro-
chemical potential
make it useful for
battery manufacture.

Resource Capital Research
Rare and Minor Metals Company Review, March Q 2011. Disclaimer and disclosure attached. Copyright© 2011 by Resource Capital Research Pty Ltd. All rights reserved. 23
Market Update: Niobium
Investment Comment
Industry forecasts are for ferroniobium (FeNb) consumption growth of
~15% per annum to 2014. New niobium producers have a chance to
meet this increase in demand and find secure revenue in the form of
long-term supply contracts. Prices should remain stable (RCR long term
US$39/kg in FeNb) so long as price-setter CBMM does not feel its
dominant market position to be threatened, which is unlikely, as most
advanced Nb projects are of a much smaller scale than Araxa.
Pricing
All measures show that Nb prices have risen in the past several years,
and were quite resistant to the GFC, likely because Nb is only a small
portion of steel production costs, and the price is set by the main
producer, CBMM.
The current price of Nb is US$43.50-$44/kg (contained in FeNb, EU
price, Metal Pages). The 2009 low, of US$34/kg, was reached in March
2009. This was ~25% below the previous high (in March 2008), which
compares favourably to declines in base metal prices of ~40% or more
over the same period. RCR‟s long-term forecast for modelling purposes
is US$39/kg Nb in FeNb, based on the apparent stability of Nb prices.
Ferroniobium import prices, Chinese yuan (66% Nb from Brazil)
Market: Supply and Demand
In 2010, 74% of niobium in the US was used for steel production
(followed by superalloys with 26%). Over the period 2002-2009, the
CAGR of global Nb production (11.2%) was more than 2.5x the rate of
growth in steel production (4.2%; USGS data). This demonstrates
increasing intensity of Nb use over time.
With 15% pa growth forecast, and a steady price, the outlook for Nb is strong. Prices were resilient in the face of the Global Financial Crisis … … assisted by the refusal of CBMM to lower its price, which the steel mills continued to pay. The Nb market has shown consistent long-term growth: 11.2% per annum between 2002 and 2009.
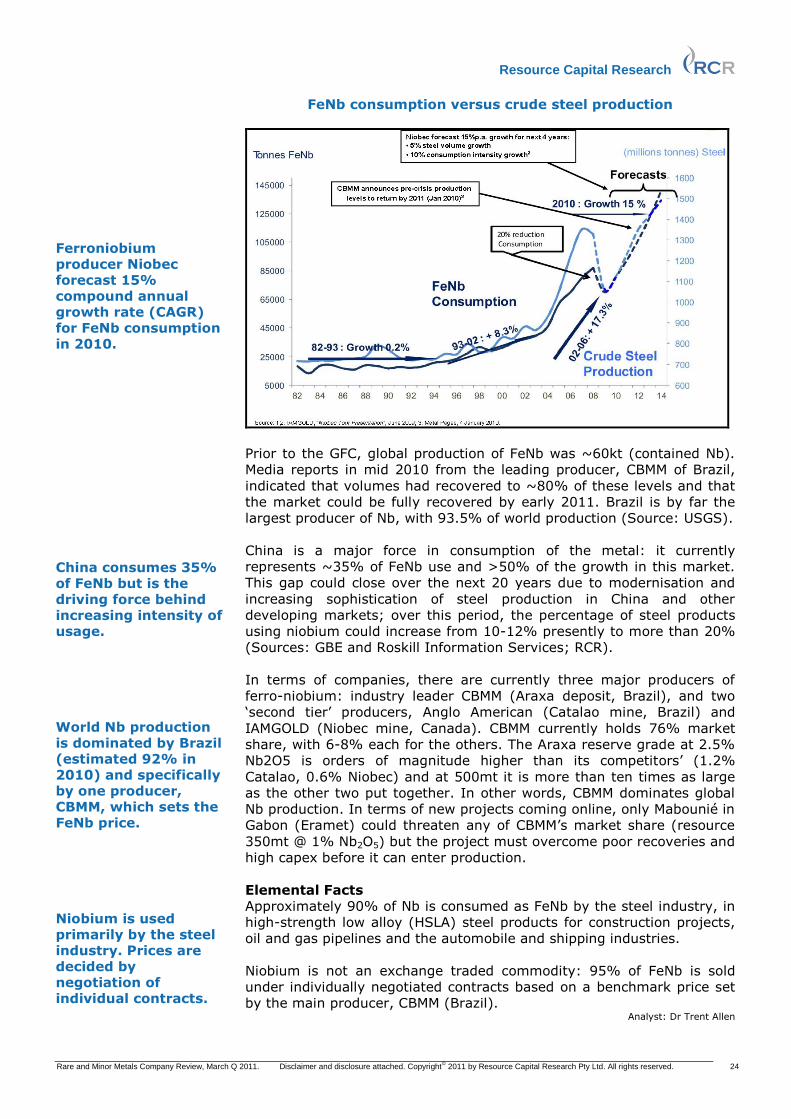
Resource Capital Research
Rare and Minor Metals Company Review, March Q 2011. Disclaimer and disclosure attached. Copyright© 2011 by Resource Capital Research Pty Ltd. All rights reserved. 24
FeNb consumption versus crude steel production
Prior to the GFC, global production of FeNb was ~60kt (contained Nb).
Media reports in mid 2010 from the leading producer, CBMM of Brazil,
indicated that volumes had recovered to ~80% of these levels and that
the market could be fully recovered by early 2011. Brazil is by far the
largest producer of Nb, with 93.5% of world production (Source: USGS).
China is a major force in consumption of the metal: it currently
represents ~35% of FeNb use and >50% of the growth in this market.
This gap could close over the next 20 years due to modernisation and
increasing sophistication of steel production in China and other
developing markets; over this period, the percentage of steel products
using niobium could increase from 10-12% presently to more than 20%
(Sources: GBE and Roskill Information Services; RCR).
In terms of companies, there are currently three major producers of
ferro-niobium: industry leader CBMM (Araxa deposit, Brazil), and two
„second tier‟ producers, Anglo American (Catalao mine, Brazil) and
IAMGOLD (Niobec mine, Canada). CBMM currently holds 76% market
share, with 6-8% each for the others. The Araxa reserve grade at 2.5%
Nb2O5 is orders of magnitude higher than its competitors‟ (1.2%
Catalao, 0.6% Niobec) and at 500mt it is more than ten times as large
as the other two put together. In other words, CBMM dominates global
Nb production. In terms of new projects coming online, only Mabounié in
Gabon (Eramet) could threaten any of CBMM‟s market share (resource
350mt @ 1% Nb2O5) but the project must overcome poor recoveries and
high capex before it can enter production.
Elemental Facts
Approximately 90% of Nb is consumed as FeNb by the steel industry, in
high-strength low alloy (HSLA) steel products for construction projects,
oil and gas pipelines and the automobile and shipping industries.
Niobium is not an exchange traded commodity: 95% of FeNb is sold
under individually negotiated contracts based on a benchmark price set
by the main producer, CBMM (Brazil). Analyst: Dr Trent Allen
Ferroniobium producer Niobec forecast 15% compound annual growth rate (CAGR) for FeNb consumption in 2010. China consumes 35% of FeNb but is the driving force behind increasing intensity of usage. World Nb production is dominated by Brazil (estimated 92% in 2010) and specifically by one producer, CBMM, which sets the FeNb price. Niobium is used primarily by the steel industry. Prices are decided by negotiation of individual contracts.

Resource Capital Research
Rare and Minor Metals Company Review, March Q 2011. Disclaimer and disclosure attached. Copyright© 2011 by Resource Capital Research Pty Ltd. All rights reserved. 25
Market update: Rare Earth Elements
Investment Comment
RCR recently attended the Sixth International Rare Earths Conference,
organised by Roskill and Metal Events, to gain a clearer picture of this
complex sector. Industry forecasts are for 6%-10% annual growth in
total REE demand to 2015. Given China‟s current dominance of REE
production (~95%), there is an opportunity for new producers to take
advantage of high prices and demand by ensuring security of supply to
non-Chinese buyers, while China increasingly seeks to retain and
domestically add value to its REE resources. Rare earth projects, due to
their chemical complexity, can take up to 20 years to develop, so only
advanced or geochemically simple projects will be able to come online in
the near term.
Pricing
Recovery from the GFC, combined with China‟s decision to cut REO
quotas in 2H10 and 1H11, has driven some prices to historic highs. This
includes the LREE, which are more common and less valuable the HREE.
For example, the biggest gain has been cerium (Ce) over 12 months, up
1611%. These prices will only be sustainable in the medium and long
term to the extent they are driven by supply-demand fundamentals.
This could favour the MREE (middle REE) and HREE, which in the past
three months have shown significant price gains due to expectations of
constrained supply, e.g. dysprosium +39%.
Changes in reported REO prices over 3 and 12 months
Rare Earth Oxide
Current
price
US$/kg
16-Nov-10 16-Feb-103mth %
change
12mth %
change
Lanthanum 73.0 49.0 5.5 49 1227
Cerium 71.0 49.0 4.2 45 1611
Praseodymium 114.5 76.5 25.8 50 345
Neodymium 124.5 73.5 26.8 69 365
Samarium 61.0 34.5 4.5 77 1256
Europium 650.0 630.0 480.0 3 35
Gadolinium 73.5 44.5 7.7 65 861
Dysprosium 410.0 295.0 132.5 39 209
Terbium 630.0 605.0 350.0 4 80
Yttrium 92.5 50.5 10.3 83 802
Light Rare Earths
Heavy Rare Earths
USD FOB ex-China per kg, 99.999% purity; prices are bid-offer mid points. Source: Metal Pages, 16 Feb 2011
Source: Metal Pages, RCR
Market: Supply and Demand
World REO production in 2009 and 2010 (USGS estimated) was 133kt
and 134kt respectively, of which 130kt (97%) came from China. It also
estimates that China has 50% of the total global REO economic reserves
of 110mt (a 10% increase on 2009 global reserves), followed by the CIS
(17%) and USA (12%).
The main importer of REE metals and compounds is Japan, with a
combined 34.3kt in 2008, while China exported 55kt (BGS). It is clear
that the majority of rare earths are both mined and consumed in China.
BCC Research forecast 7-9% compound annual growth rate in global
REE demand over 5 years from 2009, which equates to a +60kt increase
Companies with
advanced projects are
well positioned to gain
from the rare earths
boom, as China
curtails exports to
conserve domestic
supplies.
Some REO prices are
at 10 year highs.
The average,
unweighted 12 month
price increase for the
REO shown in this
table is 679%. The
most valuable
elements (Dy, Eu and
Tb) each have 25%
export tariffs in China;
the others 15%.
China dominates the
global REE trade, with
97% of the 134kt
production in 2010.
Demand for REE is
forecast to grow at 7-
9% per annum over
the five years to 2014.
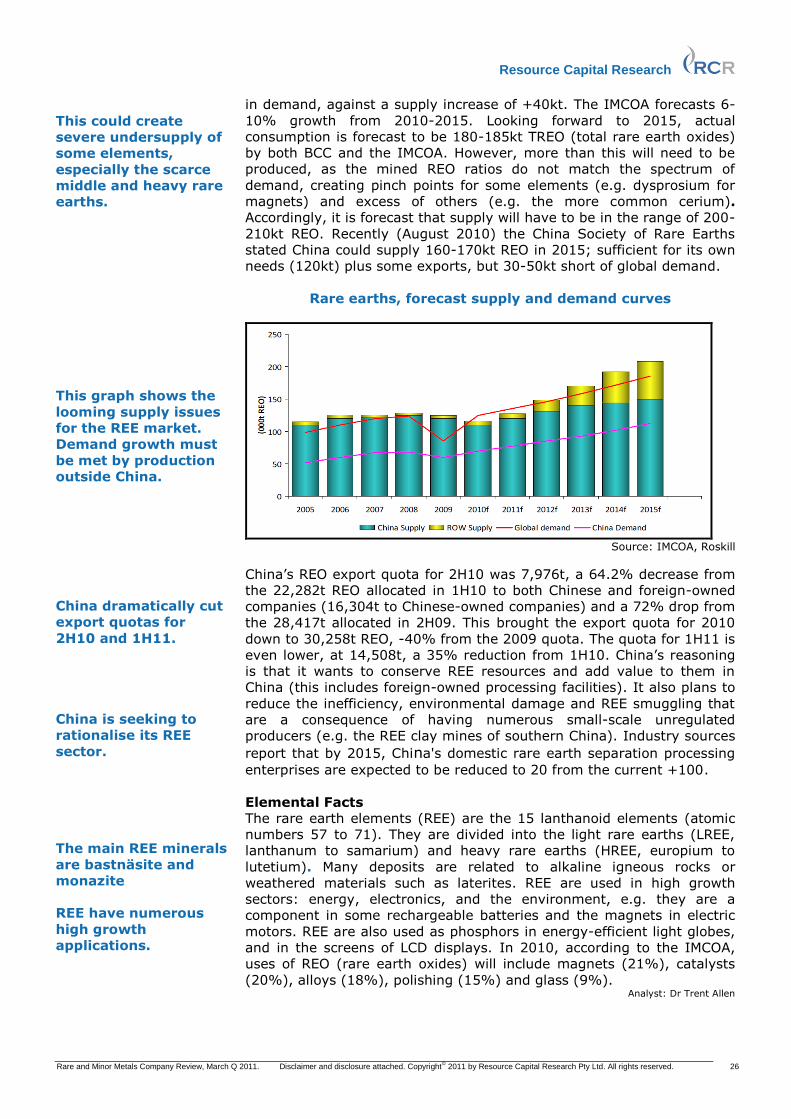
Resource Capital Research
Rare and Minor Metals Company Review, March Q 2011. Disclaimer and disclosure attached. Copyright© 2011 by Resource Capital Research Pty Ltd. All rights reserved. 26
in demand, against a supply increase of +40kt. The IMCOA forecasts 6-
10% growth from 2010-2015. Looking forward to 2015, actual
consumption is forecast to be 180-185kt TREO (total rare earth oxides)
by both BCC and the IMCOA. However, more than this will need to be
produced, as the mined REO ratios do not match the spectrum of
demand, creating pinch points for some elements (e.g. dysprosium for
magnets) and excess of others (e.g. the more common cerium).
Accordingly, it is forecast that supply will have to be in the range of 200-
210kt REO. Recently (August 2010) the China Society of Rare Earths
stated China could supply 160-170kt REO in 2015; sufficient for its own
needs (120kt) plus some exports, but 30-50kt short of global demand.
Rare earths, forecast supply and demand curves
Source: IMCOA, Roskill
China‟s REO export quota for 2H10 was 7,976t, a 64.2% decrease from
the 22,282t REO allocated in 1H10 to both Chinese and foreign-owned
companies (16,304t to Chinese-owned companies) and a 72% drop from
the 28,417t allocated in 2H09. This brought the export quota for 2010
down to 30,258t REO, -40% from the 2009 quota. The quota for 1H11 is
even lower, at 14,508t, a 35% reduction from 1H10. China‟s reasoning
is that it wants to conserve REE resources and add value to them in
China (this includes foreign-owned processing facilities). It also plans to
reduce the inefficiency, environmental damage and REE smuggling that
are a consequence of having numerous small-scale unregulated
producers (e.g. the REE clay mines of southern China). Industry sources
report that by 2015, China's domestic rare earth separation processing
enterprises are expected to be reduced to 20 from the current +100.
Elemental Facts
The rare earth elements (REE) are the 15 lanthanoid elements (atomic
numbers 57 to 71). They are divided into the light rare earths (LREE,
lanthanum to samarium) and heavy rare earths (HREE, europium to
lutetium). Many deposits are related to alkaline igneous rocks or
weathered materials such as laterites. REE are used in high growth
sectors: energy, electronics, and the environment, e.g. they are a
component in some rechargeable batteries and the magnets in electric
motors. REE are also used as phosphors in energy-efficient light globes,
and in the screens of LCD displays. In 2010, according to the IMCOA,
uses of REO (rare earth oxides) will include magnets (21%), catalysts
(20%), alloys (18%), polishing (15%) and glass (9%). Analyst: Dr Trent Allen
This could create
severe undersupply of
some elements,
especially the scarce
middle and heavy rare
earths.
This graph shows the
looming supply issues
for the REE market.
Demand growth must
be met by production
outside China.
China dramatically cut
export quotas for
2H10 and 1H11.
China is seeking to
rationalise its REE
sector.
The main REE minerals
are bastnäsite and
monazite
REE have numerous
high growth
applications.

Resource Capital Research
Rare and Minor Metals Company Review, March Q 2011. Disclaimer and disclosure attached. Copyright© 2011 by Resource Capital Research Pty Ltd. All rights reserved. 27
Market Update: Tantalum
Investment Comment
A tantalum supply shortfall has lifted prices and is expected to last until
at least 2013, although this could be alleviated earlier with the planned
recommissioning of Australia‟s Wodinga Mine. Producers will be expected
to provide a supply of ethically produced tantalum. RCR‟s long-term
price forecast, based on the assumptions of Ta industry participants
(e.g. ASX:GBE) is US$143/kg (US$65/lb) Ta2O5.
Pricing
The current price of Ta as tantalite (30% Ta2O5) is US$117.50/lb Ta2O5
(Metal Pages). This is (on average) 208% higher than the same date in
2010 and 239% higher than the 2009 low (August, 2009; US$33.00-
36.00/lb Ta2O5), which was the lowest price since March 2007
(US$32.22-34.33/lb Ta2O5).
The increase is recent and is due largely to anticipation of a supply
shortage as the market is starved of DRC tantalite. This shortage is
expected to last until at least 2013 (Source: Gippsland Minerals).
Tantalite basis 30% Ta2O5
Market: Supply and Demand
Before the GFC, global Ta2O5 consumption was estimated to be 6mlbs
per annum. Industry commentators suggest that the market is growing
at ~ 7% per annum (Sources: GBE, Gippsland Ltd).
Leading commercial consumers are HC Starck GmbH ( part of German
conglomerate Bayer AG), as well as Cabot Corporation (USA), Ulba OJSC
(Kazakhstan), Mitsui-Kinzoku (Japan) and Ningxia Non-Ferrous Metals
(China) plus various other Chinese groups.
The supply deficit in Ta markets could last to 2013.
Tantalum prices are commonly reported as lbs of its main ore mineral, tantalite. Ta prices have soared 208% in the past year, partly due to international measures taken against the DRC, which supplies “conflict tantalum”. Ta consumers are manufacturers of advanced technology, in Europe, Asia and the USA.

Resource Capital Research
Rare and Minor Metals Company Review, March Q 2011. Disclaimer and disclosure attached. Copyright© 2011 by Resource Capital Research Pty Ltd. All rights reserved. 28
According to the USGS, world mine production of Ta metal in 2009 and
2010 was 665-670t. From 2005-2008, approximately equal proportions
were supplied as ores and concentrates, metal, and scrap.
For concentrates, from 2006-2009, 66% were supplied by Australia. The
major producer by metal content in 2010 was Brazil (~27%). In 2009,
the biggest secondary producer (waste and scrap) was China (27%).
Until 2009, the major corporate producer of tantalum was Talison
Minerals, from its Wodinga mine near Greenbushes in WA‟s Pilbara.
However, this closed during the GFC. Obviously, the coincident
downturn in Ta-intensive industries prevented any problems with
undersupply. It was announced in Jan ‟11, with tantalite prices pushing
close to US$120/lb, that Wodinga would reopen under the control of
GAM (Global Advanced Minerals). Production will be 700,000lbpa (261t,
or 39% of 2009 global demand). This will leave excess capacity at
Wodinga; tantalite concentrate from Mt Cattlin (ASX:GXY) will also be
processed there (75t over five years).
In recent times the market has been clouded by the considerable black
market for Ta (about 20% of the global market), illegally supplied by
artisanal mines in the Democratic Republic of Congo (DRC) and allegedly
used to fund a civil war in that country, ie. “conflict tantalum”.
In July 2010, however, the US Congress passed the Financial Stability
Act, which requires US companies to disclose if their products contain
tantalum (and tin, tungsten or gold) that is sourced from the DRC or
adjoining countries. This should prevent the use of DRC material and,
due to the stringent supply chain reporting requirements of the Act, may
also turn buyers away from the adjoining countries (being Uganda,
Rwanda, Burundi, Kenya, Tanzania, Zambia, Angola, Republic of Congo
[Brazzaville], Sudan and the Central African Republic).
By 4Q10, metal traders were widely reporting that DRC supply had dried
up and that material from its neighbours was hard to obtain. This supply
squeeze has led to price increases. The reopening of Wodinga should
alleviate supply problems beyond 2012
Elemental Facts
Tantalum is used in diverse high technology applications. It is resistant
to corrosion, has a low thermal coefficient of expansion, and a high
dielectric constant, so its main uses are in capacitors (e.g. for consumer
electronics), chemical plant and equipment, aviation turbine blades and,
as tantalum carbide, for cutting tools. It can be substituted by niobium
and titanium in some applications, thought at the expense of larger
component size (Nb) and/or higher cost (Ti). The majority of the world‟s
tantalum is sold via long-term offtake agreements. Analyst: Dr Trent Allen
Historically, Brazil and Australia are major producers of tantalum. Australia‟s Wodinga Tantalum Mine, the world‟s largest, is set to reopen in 2011. DRC illegal production complicates the market but the US Conflict Minerals Bill should remedy the problem.
Tantalum is used in
high-tech applications
such as capacitors
and alloys.

Resource Capital Research
Rare and Minor Metals Company Review, March Q 2011. Disclaimer and disclosure attached. Copyright© 2011 by Resource Capital Research Pty Ltd. All rights reserved. 29
Market Update: Tungsten
Investment Comment
As we stated in November 2010, industry participants and
commentators are bullish about the medium-term outlook for tungsten.
For example, Icon Resources (III:ASX) recently stated: “The market
price for [concentrates and APT] has improved from mid-2009 returning
to pre-GFC levels. Recent market analysis has projected longer-term
strength for tungsten, particularly for non-Chinese supply beyond 2012,
with supply shortages indicated from 2013.” Annual Report 2010.
These forecasts are based partly on concern about security of supply for
manufacturers, in view of China‟s policy of falling export quotas and high
tariffs (e.g. 20% on ferrotungsten), and its intent to boost
manufacturing. This scenario favours existing producers, and companies
with tungsten projects that can enter production within 2-3 years.
Pricing
Prices have recovered to pre-GFC levels, during which they had a
relatively soft landing due to simultaneous cuts in demand and
production. For mine modelling, RCR has used US$150/mtu contained
tungsten in 65% concentrate.
The price of ferrotungsten in Europe at 75% W is US$445-450/mtu (of
contained W), APT to China (FOB) is US$338-343/mtu and concentrate
in China at 65% W is US$280-281/mtu (contained W). These figures are
typical of the value-add for increased tungsten processing (i.e. ~21%
from conc. to APT, and ~30% from APT to ferrotungsten. Concentrate
prices are up 60% year-on-year, 2010-2011, and 20% quarter-on
quarter, as global demand continues its post-GFC recovery. In 2010,
Roskill forecast that nominal APT prices could reach US$445/mtu by
2015, i.e. ~US$351/mtu for concentrate using the 21% value-add.
Market: Supply and Demand
Global consumption of tungsten in 2010 was ~55.5kt (Wolf Minerals,
Nov ‟10) and is forecast to increase to 88.5kt in 2015 (CAGR 9.8%).
World forecast tungsten demand, 2000 to 2015 (t W).
Advanced tungsten developments could benefit from elevated prices, due to Chinese control (~85%) of supply. Prices held steady during the GFC due to synchronous falls in supply and demand. Concentrate prices are up 60% Y-O-Y. The market outlook to 2015 is positive, with W demand forecast to increase from 55ktpa in 2010 to 88.5ktpa, i.e. CAGR 9.5%.

Resource Capital Research
Rare and Minor Metals Company Review, March Q 2011. Disclaimer and disclosure attached. Copyright© 2011 by Resource Capital Research Pty Ltd. All rights reserved. 30
China is the metal's prime consumer, accounting for 62% of it in 2009.
From 2002 to end-2007, global consumption of tungsten grew at 10%
per annum, with the other significant tungsten consumers being the
U.S., Western Europe and Japan. Consumption fell 25% Y-O-Y to 55kt
in 2009, but was forecast to reach 66kt in 2010, and 80kt in 2013.
China dominated world tungsten production in 2010 (~85%).
China85%
Other5%
Russia4%
Canada0%
Austria2%
Bolivia2% Portugal
2%
Source: USGS.
Global tungsten metal production in 2009 was 61.3kt (USGS) and an
estimated 61kt in 2010. Of the 2010 estimate, China accounted for
85%, producing 52kt. It was followed by Russia (2.5kt), Bolivia (1.1kt)
and Austria (1kt). China has banned export of concentrates, and ships
only semi-refined and refined powders. Recycled tungsten makes up
~35% of the market (Source: North American Tungsten Corp)
Elemental Facts
Tungsten is the hardest metal, and has a high density (19.25g/cc;
slightly less than gold, 19.3g/cc), melting point and tensile strength.
Tungsten is mined from or adjacent to igneous rocks (e.g. in skarns). It
has two economically important minerals: wolframite ((Fe,Mn)WO4) and
scheelite (CaWO4). The majority of the world‟s 2.9Mt economic reserves
are held by China (with 1.9Mt or 55%. Source :USGS).
Tungsten is primarily used in wear-resistant cemented carbides aka
hardmetals (56%) and steel/alloys (20%), as well as in lighting,
heating, and welding applications. Tungsten chemical compounds are
used in catalysts, inorganic pigments, and high-temperature lubricants.
Tungsten is sold in five common forms – APT (ammonium
paratungstate), ferrotungsten, tungsten concentrate (usually 65%
WO3), and tungsten carbide and oxides. Prices are quoted in $US or
RMB and the main units are mtu (metric tonne units, of 10kg WO3, ie
7.9kg W) and kilograms. It is usually sold on long-term contract.
Analyst: Dr Trent Allen
The world‟s largest consumer of tungsten is China (62% in 2009). Global 2010 mine production was ~61kt, of which China accounted for ~85%. China has banned exports of tungsten concentrate. The main application for tungsten is in „hardmetal‟, as tungsten carbide. In China, steel-making accounts for the highest % use. Ferrotungsten is used for steelmaking, while APT feeds into the cemented carbide and chemical stream.

Resource Capital Research
Rare and Minor Metals Company Review, March Q 2011. Disclaimer and disclosure attached. Copyright© 2011 by Resource Capital Research Pty Ltd. All rights reserved. 31
Selected rare and minor metal price data and production statistics.
Selected rare and minor metal price data and production statistics
Be
To self: advance x axis max
0
1
2
3
4
5
6
7
Jul-03
Oct-03
Jan-0
4
Apr-
04
Jul-04
Oct-04
Jan-0
5
Apr-
05
Jul-05
Oct-05
Jan-0
6
Apr-
06
Jul-06
Oct-06
Jan-0
7
Apr-
07
Jul-07
Oct-07
Jan-0
8
Apr-
08
Jul-08
Oct-08
Jan-0
9
Apr-
09
Jul-09
Oct-09
Jan-1
0
Apr-
10
Jul-10
Oct-10
Jan-1
1
(%)
US Federal Funds Rate (%)
Source: Bloomberg
0
20
40
60
80
100
120
140
160
Feb
-01
Jun-0
1
Oct-01
Feb
-02
Jun-0
2
Oct-02
Feb
-03
Jun-0
3
Oct-03
Feb
-04
Jun-0
4
Oct-04
Feb
-05
Jun-0
5
Oct-05
Feb
-06
Jun-0
6
Oct-06
Feb
-07
Jun-0
7
Oct-07
Feb
-08
Jun-0
8
Oct-08
Feb
-09
Jun-0
9
Oct-09
Feb
-10
Jun-1
0
Oct-10
Feb
-11
(US
$, b
bl)
Oil price
Source: Bloomberg
0
200
400
600
800
1000
1200
1400
1600
1800
Nov-
06
Jan-0
7
Mar-
07
May-
07
Jul-07
Sep-0
7
Nov-
07
Jan-0
8
Mar-
08
May-
08
Jul-08
Sep-0
8
Nov-
08
Jan-0
9
Mar-
09
May-
09
Jul-09
Sep-0
9
Nov-
09
Jan-1
0
Mar-
10
May-
10
Jul-10
Sep-1
0
Nov-
10
Jan-1
1
Mar-
11
(RM
B/t
)
Average Iron Ore Fines Spot Price, Hebei China
Source: Bloomberg (Met. Bulletin)
30
230
430
630
830
1030
1230
1430
Feb
-01
Jun-0
1
Oct-01
Feb
-02
Jun-0
2
Oct-02
Feb
-03
Jun-0
3
Oct-03
Feb
-04
Jun-0
4
Oct-04
Feb
-05
Jun-0
5
Oct-05
Feb
-06
Jun-0
6
Oct-06
Feb
-07
Jun-0
7
Oct-07
Feb
-08
Jun-0
8
Oct-08
Feb
-09
Jun-0
9
Oct-09
Feb
-10
Jun-1
0
Oct-10
Feb
-11
(US
$/t
)
Zirconium ore, premium, to Europe FOB
Source: Bloomberg
0
2
4
6
8
10
12
14
16
18
20
Jul-08
Sep-0
8
Nov-
08
Jan-0
9
Mar-
09
May-
09
Jul-09
Sep-0
9
Nov-
09
Jan-1
0
Mar-
10
May-
10
Jul-10
Sep-1
0
Nov-
10
Jan-1
1
(US
$)
China output, tungsten and related products, value
Source: Bloomberg
60
70
80
90
100
110
120
130
Oct-06
Dec-
06
Feb
-07
Apr-
07
Jun-0
7
Aug-0
7
Oct-07
Dec-
07
Feb
-08
Apr-
08
Jun-0
8
Aug-0
8
Oct-08
Dec-
08
Feb
-09
Apr-
09
Jun-0
9
Aug-0
9
Oct-09
Dec-
09
Feb
-10
Apr-
10
Jun-1
0
Aug-1
0
Oct-10
Dec-
10
Feb
-11
(mt,
mo
nth
ly)
IISI crude steel production index
Source: Bloomberg
150
200
250
300
350
400
Jun-0
8
Aug-0
8
Oct-08
Dec-
08
Feb
-09
Apr-
09
Jun-0
9
Aug-0
9
Oct-09
Dec-
09
Feb
-10
Apr-
10
Jun-1
0
Aug-1
0
Oct-10
Dec-
10
Feb
-11
(US
$/m
tu)
Tungsten APT: EU Prices
Source: Bloomberg
0
10,000
20,000
30,000
40,000
50,000
60,000
70,000
80,000
Feb
-06
Jun-0
6
Oct-06
Feb
-07
Jun-0
7
Oct-07
Feb
-08
Jun-0
8
Oct-08
Feb
-09
Jun-0
9
Oct-09
Feb
-10
Jun-1
0
Oct-10
Feb
-11
(US
$/t
)
Cerium oxide 99% min China FOB
Source: Metal Pages

Resource Capital Research
Rare and Minor Metals Company Review, March Q 2011. Disclaimer and disclosure attached. Copyright© 2011 by Resource Capital Research Pty Ltd. All rights reserved. 32
ASX indices and exchange rates of some rare and minor metals producers and consumers.
Exchange rates of some rare and minor metals, producers and consumers.
25/05/2001
28/05/2001
29/05/2001
30/05/2001
31/05/2001
1/06/2001
4/06/2001
5/06/2001
6/06/2001
7/06/2001
8/06/2001
11/06/2001
12/06/2001
13/06/2001
14/06/2001
15/06/2001
18/06/2001
19/06/2001
20/06/2001
21/06/2001
22/06/2001
25/06/2001
26/06/2001
27/06/2001
28/06/2001
29/06/2001
2/07/2001
3/07/2001
4/07/2001
5/07/2001
6/07/2001
9/07/2001
10/07/2001
11/07/2001
12/07/2001
13/07/2001
16/07/2001
17/07/2001
18/07/2001
19/07/2001
20/07/2001
0.4
0.5
0.6
0.7
0.8
0.9
1
1.1
Feb
-01
Dec-
01
Aug-0
2
Apr-
03
Dec-
03
Sep-0
4
May-
05
Jan-0
6
Sep-0
6
Jun-0
7
Feb
-08
Oct-08
Jun-0
9
Mar-
10
Nov-
10
(AU
D/U
SD
)
Exchange rate: Australia / USA
Source: Bloomberg
0.6
0.7
0.8
0.9
1
1.1
1.2
Feb
-01
Dec-
01
Aug-0
2
Apr-
03
Dec-
03
Sep-0
4
May-
05
Jan-0
6
Sep-0
6
Jun-0
7
Feb
-08
Oct-08
Jun-0
9
Mar-
10
Nov-
10
(CA
D/U
SD
)
Exchange rate: Canada / USA
Source: Bloomberg
0.1
0.105
0.11
0.115
0.12
0.125
0.13
0.135
0.14
0.145
0.15
Feb
-01
Dec-
01
Aug-0
2
Apr-
03
Dec-
03
Sep-0
4
May-
05
Jan-0
6
Sep-0
6
Jun-0
7
Feb
-08
Oct-08
Jun-0
9
Mar-
10
Nov-
10
(CN
Y/U
SD
)
Exchange rate: China / USA
Source: Bloomberg
0.1
0.2
0.3
0.4
0.5
0.6
0.7
Feb
-01
Dec-
01
Aug-0
2
Apr-
03
Dec-
03
Sep-0
4
May-
05
Jan-0
6
Sep-0
6
Jun-0
7
Feb
-08
Oct-08
Jun-0
9
Mar-
10
Nov-
10
(Re
al/U
SD
)
Exchange rate: Brazil / USA
Source: Bloomberg
0.006
0.007
0.008
0.009
0.01
0.011
0.012
0.013
Feb
-01
Dec-
01
Aug-0
2
Apr-
03
Dec-
03
Sep-0
4
May-
05
Jan-0
6
Sep-0
6
Jun-0
7
Feb
-08
Oct-08
Jun-0
9
Mar-
10
Nov-
10
(Ro
ub
le/U
SD
)
Exchange rate: Japan / USA
Source: Bloomberg
0
200
400
600
800
1,000
1,200
1,400
1,600
1,800
Feb
-01
Dec-
01
Aug-0
2
Apr-
03
Dec-
03
Sep-0
4
May-
05
Jan-0
6
Sep-0
6
Jun-0
7
Feb
-08
Oct-08
Jun-0
9
Mar-
10
Nov-
10
(Ru
pe
e/U
SD
)
Exchange rate: USA / Korea
Source: Bloomberg
0
1,000
2,000
3,000
4,000
5,000
6,000
7,000
8,000
Nov-
06
Jan-0
7
Apr-
07
Jul-07
Oct-07
Dec-
07
Mar-
08
Jun-0
8
Sep-0
8
Dec-
08
Feb
-09
May-
09
Aug-0
9
Nov-
09
Jan-1
0
Apr-
10
Jul-10
Oct-10
Dec-
10
ASX All Ordinaries Index
Source: Bloomberg
0
1,000
2,000
3,000
4,000
5,000
6,000
7,000
Nov-
06
Jan-0
7
Apr-
07
Jul-07
Oct-07
Dec-
07
Mar-
08
Jun-0
8
Sep-0
8
Dec-
08
Feb
-09
May-
09
Aug-0
9
Nov-
09
Jan-1
0
Apr-
10
Jul-10
Oct-10
Dec-
10
ASX S&P300 Metals & Mining Index
Source: Bloomberg

Resource Capital Research
Rare and Minor Metals Company Review, March Q 2011. Disclaimer and disclosure attached. Copyright© 2011 by Resource Capital Research Pty Ltd. All rights reserved. 33
Report Contributors Trent Allen: Trent has a BSc (Hons) and a PhD from the University of Sydney, specialising in the
petrology, trace-element geochemistry and economic geology of alkaline igneous rocks. His
Australian mining industry experience includes several years with Newcrest‟s Cadia Valley
gold/copper mines, where he was engaged in resource definition and geotechnical engineering.
Trent has also worked as an exploration consultant, university lecturer in geology and civil
engineering, and as a journalist and newspaper editor.
Tony Parry: Tony has extensive experience in metallurgical process development, (working with MIM
Limited for five years) and in mining equity research, equity sales and mining corporate finance
(working in London for five years and subsequently Perth). He was a founding Director and CEO of
an ASX listed exploration company and has been engaged extensively as a strategic planning
consultant to many small-medium enterprises. Tony‟s qualifications include a BSc (Hons) in
Metallurgy and a PhD in Metallurgy from the University of NSW.
Greg Burns: Greg has over 25 years‟ experience in the stockbroking/trading industry with companies
such as Jacksons, Capel Court Capel, BBY, Bain & Co, and BZW/ABN Amro. As an institutional
financial analyst, he has covered both the supply and demand side of the resource sector. Greg has
substantial experience in corporate work including underwritings, equity raisings and corporate
takeovers. Qualifications include an MEc from Macquarie University and a Bachelor of Economics
from the University of Sydney. Greg has also completed his Chartered Accounting qualification and
the Australian Defence Industry Study program.
John Wilson: John has a background in mining, finance and equity research. He worked on Wall
Street for 6 years and has covered US, Australian and Latin American mining stocks. He has also
worked with BHP in their minerals division. Qualifications include an MBA from the Wharton School
of the University of Pennsylvania and a Bachelor of Engineering from the University of Sydney.

Resource Capital Research
Rare and Minor Metals Company Review, March Q 2011. Disclaimer and disclosure attached. Copyright© 2011 by Resource Capital Research Pty Ltd. All rights reserved. 34
Disclosure and Disclaimer
Resource Capital Research ACN 111 622 489 www.rcresearch.com.au
Suite 1306
183 Kent Street Sydney, NSW 2000
Tel: +612 9252 9405
Fax: +612 9251 2859 Email: [email protected]
Disclosure and Disclaimer Important Information
Resource Capital Research Pty Limited (referred to as “we”, “our”, or “RCR” herein) ACN 111 622 489 holds an Australian Financial Services Licence (AFS Licence number 325340). General advice is provided by RCR‟s Authorised Representatives Dr Tony Parry (Authorised Representative number 328842) and Dr Trent Allen (Authorised Representative number 331960). The FSG is available at www.rcresearch.com.au. All references to currency are in Australian dollars unless otherwise noted.
This report and its contents are intended to be used or viewed only by persons resident and located in the United States, Canada and Australia, and therein only where RCR‟s services and products may lawfully be offered. The information provided in this report is not intended for distribution to, or use
by, any person or entity in any jurisdiction or country where such distribution or use would be contrary to law or regulation or which would subject RCR or its affiliates to any registration requirement within such jurisdiction or country.
This report and its contents are not intended to constitute a solicitation for the purchase of securities or an offer of securities. The information provided in this report has been prepared without taking account of your particular objectives, financial situation or needs. You should, before acting on the information provided in this report, consider the appropriateness of the purchase or sale of the securities of the companies that are the subject of this report having regard to these matters and, if appropriate, seek professional financial, investment and taxation advice. RCR does not guarantee the performance of any investment discussed or recommended in this report. Any information in this report relating to the distribution history or performance history of the securities of the companies that are the subject of this report, should not be taken as an indication of the future value or performance of the relevant securities.
In preparing this report, RCR analysts have relied upon certain information provided by management of the companies that are the subject of this report or otherwise made publicly available by such companies. The information presented and opinions expressed herein are given as of the date hereof and are subject to change. We hereby disclaim any obligation to advise you of any change after the date hereof in any matter set forth in this report. THE INFORMATION PRESENTED, WHILE OBTAINED FROM SOURCES WE BELIEVE RELIABLE, IS CHECKED BUT NOT GUARANTEED AGAINST ERRORS OR OMISSIONS AND WE MAKE NO WARRANTY OR REPRESENTATION, EXPRESSED OR IMPLIED, AND DISCLAIM AND NEGATE ALL OTHER WARRANTIES OR LIABILITY CONCERNING THE ACCURACY, COMPLETENESS OR RELIABILITY OF, OR ANY FAILURE TO UPDATE, ANY CONTENT OR INFORMATION HEREIN.
This report and the information filed on which it is based may include estimates and projections which constitute forward looking statements that express an expectation or belief as to future events, results or returns. No guarantee of future events, results or returns is given or implied by RCR.
Estimates and projections contained herein, whether or not our own, are based on assumptions that we believe to be reasonable at the time of publication, however, such forward-looking statements are subject to risks, uncertainties and other factors which could cause actual results to differ materially from the estimates and projections provided to RCR or contained within this report.
This report may, from time to time, contain information or material obtained from outside sources with the permission of the original author or links to web sites or references to products, services or publications other than those of RCR. The use or inclusion of such information, material, links or references does not imply our endorsement or approval thereof, nor do we warrant, in any manner, the accuracy of completeness of any information presented therein.
RCR, its affiliates and their respective officers, directors and employees may hold positions in the securities of the companies featured in this report and may purchase and/or sell them from time to time and RCR and its affiliates may also from time to time perform investment banking or other services for, or solicit investment banking or other business from, entities mentioned in this report. Globe Metals & Mining Ltd, Greenland Minerals and Energy Ltd* and Latin Resources Ltd commissioned RCR to compile their company reviews in this report. In consideration, RCR received from each a cash consultancy fee of less than $15,000. RCR may receive referral fees from issuing companies or their advisors in respect of investors that RCR refers to companies looking to raise capital. Those fees vary, but are generally between 0 - 1% of the value of capital raised from referrals made by RCR. RCR received referral fees in relation to recent capital raisings for Globe Uranium Limited, PepinNini Minerals Limited and Uranex NL and may receive fees in relation to Adamus Resources and Eleckra Mines. At the date of this report, neither RCR, nor any of its associates, hold any interests or entitlements in shares mentioned in this report with the exception that either or both of John Wilson (either directly or through Resource Capital Investments Pty Limited (RCI)), or RCI, as trustee of the Resource Capital Investments Fund owns shares in BHP and Rio Tinto.
* Greenland Minerals and Energy Ltd is currently defending civil proceedings in Western Australia brought by Westrip Holdings Ltd, its JV partner. The Company has been advised by Senior Counsel in writing that the action has no merit and the Joint Venture remains in full standing and effect.
Analyst Certification: All observations, conclusions and opinions expressed in this report reflect the personal views of RCR analysts and no part of the analyst‟s or RCR‟s compensation was, is, or will be, directly or indirectly related to specific recommendations or views expressed in the report. Officers, directors, consultants, employees and independent contractors of RCR are prohibited from trading in the securities of U.S. companies that are, or are expected to be, the subject of research reports or other investment advice transmitted to RCR clients for a blackout window of 14 days extending before and after the date such report is transmitted to clients or released to the market.
Cautionary Note to U.S. Investors Concerning Estimates of Measured, Indicated and Inferred Resources: RCR publishes mineral resources based on standards recognized and required under securities legislation where listed mining and exploration companies make their exchange filings and uses the terms “measured", "indicated" and "inferred" mineral resources. U.S. investors are advised that while such terms are recognized and required under foreign securities legislation, the SEC allows disclosure only of mineral deposits that can be economically and legally extracted. United States investors are cautioned not to assume that all or any part of measured, indicated or inferred resources can be converted into reserves or economically or legally mined. We recommend that US investors consult Securities and Exchange Commission Industry Guide 7 – “Description of Property by Issuers Engaged or to Be Engaged in Significant Mining Operations” for further information about the use of defined terms and the presentation of information included in this report.

Resource Capital Research Suite 1306 183 Kent Street Sydney, NSW 2000
T: +612 9252 9405 F: +612 9251 2859 E: [email protected]
ACN 111 622 489
www.rcresearch.com.au